
Laboratory Administration & Management of Pathology Practices
Quality management
Lean workflow / Six Sigma
Deputy Editor-in-Chief: Patricia Tsang, M.D., M.B.A.


Last author update: 28 April 2021
Last staff update: 6 January 2022
Copyright: 2020-2024, PathologyOutlines.com, Inc.
PubMed Search: Lean Six Sigma[TI] methods
Table of Contents
Definition / general | Essential features | Common Lean terms | Common Six Sigma terms | Diagrams / tables | Lean Six Sigma team management and leadership | Goals of Lean Six Sigma workflow management | Lean Six Sigma project teams | Lean Six Sigma project charter | Lean Six Sigma operations following DMAIIC | Process mapping and evaluation | Images | Case studies | Videos | Additional references | Board review style question #1 | Board review style answer #1 | Board review style question #2 | Board review style answer #2Cite this page: Hassell LA, Hardy SJ. Lean workflow / Six Sigma. PathologyOutlines.com website. https://www.pathologyoutlines.com/topic/managementlableanworkflow.html. Accessed April 18th, 2024.
Definition / general
- Lean Six Sigma is a customer focused, team oriented and data driven performance improvement and problem solving technique directed at breakthrough improvement to essential business processes
Essential features
- Lean Six Sigma methods improve quality and satisfaction of workers and customers by delivering consistent, defect free results, services or products at low cost by eliminating waste
- Lean Six Sigma is a manner of thinking and approaching problems or design, as well as a methodology with a robust set of special tools
- Lean Six Sigma has a proven record of breakthrough improvements in laboratory and healthcare services, significantly improving quality and safety outcomes
Common Lean terms
- Lean: set of methods intended to drive out waste and improve process flow
- 5S: Sort, Set in order, Shine, Standardize, Sustain (or in Japanese: Seiri, Seiton, Seiso, Seiketsu, Shitsuke); for maintaining an orderly workplace and using visual cues to achieve operational consistency
- Value stream map: defining the entire value stream for a process and measuring performance in time, work in progress (WIP) and resource utilization
- Single piece flow: workflow with no or minimal batches, no queues or waiting and no wasted motion
- Cycle and lead time: measurements of process time used to identify workflow improvements
- Pull systems: activities driven by customer needs in terms of quantity, specifications and delivery time
- Kanban: pull system of material and production control; an inventory control system for just in time manufacturing
- 7(+1) wastes: also known as muda (Japanese term for waste) or non value adding activities; defined as overproduction, waiting, transport, poor process design, inventories, motion, defective parts and not meeting external customer requirements
- Kaizen: defined as change for the better or the desire for continuous improvement
- Henry Ford production system: concept of a continuously moving production line, producing a high quality, low cost product (J Mol Diagn 2009;11:390)
- Toyota production system: a system of continuous flow, rapid changeover between tasks and minimal waste (Am J Clin Pathol 2006;125:16)
Common Six Sigma terms
- Six Sigma: a quality improvement methodology oriented around reduction of defects or errors to less than 3.4 defects per million opportunities; it is often linked to Lean, as both together have a very salutary effect on customer satisfaction, employee satisfaction and company performance
- Black Belt: a certification that an individual is thoroughly familiar with Six Sigma methodologies and can successfully lead quality improvement projects
- Green Belt, Yellow Belt: lesser certifications of individuals engaged in or supervising Six Sigma quality improvement projects
- Define, Measure, Analyze, Innovative Improvement, Control (DMAIIC): the Six Sigma structured, disciplined and rigorous approach to problem solving
- Voice of the Customer (VoC): refers to identifying customer needs and perceptions (CallMiner: Voice of the Customer Tools and Best Practices [Accessed 1 April 2021])
- Critical to Quality (CTQ): translates customer needs into specifications
- Design of experiments (DOE): an effective and efficient approach for determining the relationship between process variables
- Plan, Do, Study, Act (PDSA): an analytical approach that considers the process as is, analyzes it further, revises it as appropriate and then repeats the cycle for continuous improvement
- Failure mode and effect analysis (FMEA): a tool to help focus on process failures (Clin Leadersh Manag Rev 2004;18:37)
- Process map: using flowcharts to better understand and document workflow processes
- Descriptive statistics: use of carefully selected sampling techniques to predict characteristics of a population (Anesth Analg 2017;125:1797)
- Pareto chart: combination of bar graph and line graph that can used to highlight the frequency of defects and their cumulative impact; a funneling tool to understand various parts of a problem and decide where to focus problem solving efforts
- Gage R&R: set of trials to assess the repeatability and reproducibility of a measurement system
- Box plot: data visualization tool that provides pictorial representation of the median, first and third quartile that can be quickly understood by others
- Multi vari chart: data visualization tool that identifies the component that affects variability the most
- Hypothesis testing: procedure that summarizes data in order to detect differences among 2 or more groups
Diagrams / tables
Contributed by Stephen J. Hardy, M.B.A.
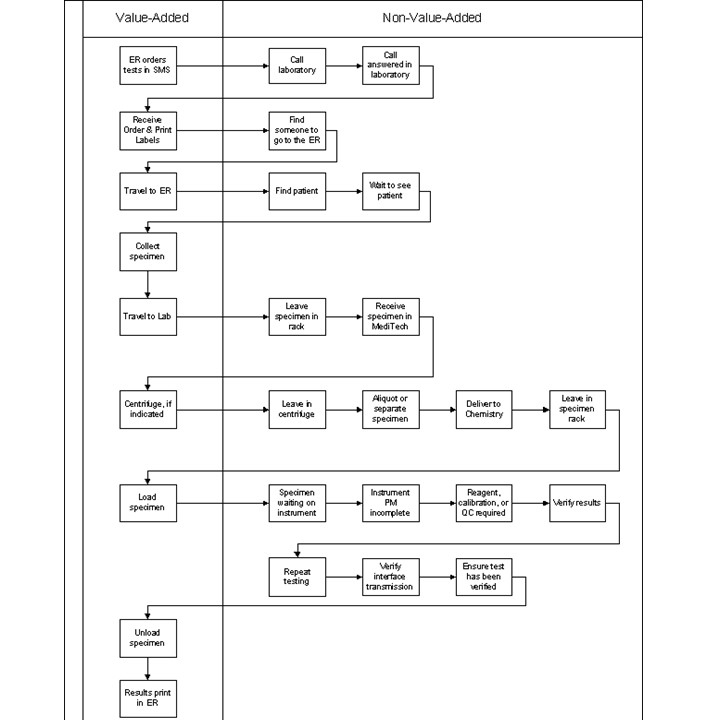
Value added flow chart
Laboratory order flow chart
Images hosted on other servers:

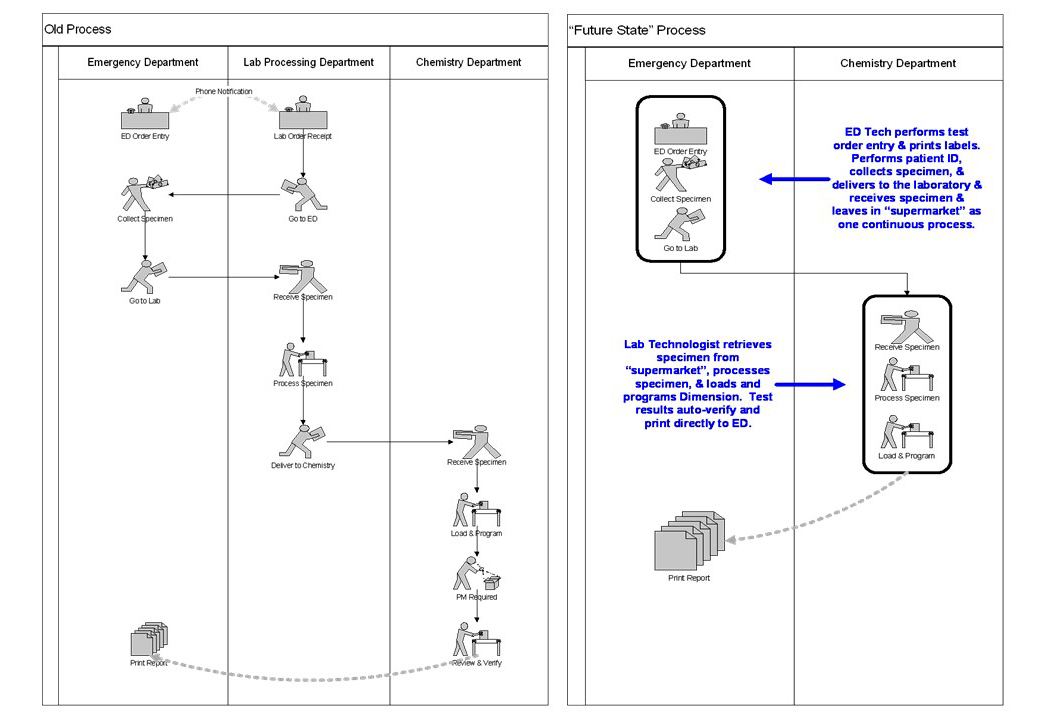
Critical information from value stream mapping

Future state value stream map
Lean Six Sigma team management and leadership
- Upper level administrative leadership and support required to clear the path for difficult changes
- Leadership must be customer focused, challenge the status quo, be visible and available, champion excellence, promote tough standards, act with integrity and facilitate teamwork
- Well trained project team leadership (Black Belts, Green Belts or Yellow Belts) and carefully selected team members with process content knowledge
- Structured regular meetings with agenda topics focused on assigning activities, reporting and documenting findings to promote both team efficiency and effectiveness
- Clinical and anatomic pathology project teams best include carefully selected administrators, pathologists, managers and staff members with process content knowledge
- Projects often span multiple departments and may be data intensive
- Project leaders (Black, Green or Yellow Belts) manage the projects and select the proper Lean and Six Sigma tools
- Pathologists and administrators support the project, clear barriers, identify CTQs (J Clin Lab Anal 2018;32:e22180)
- Team members with content knowledge are necessary to collect and process data and implement solutions
Goals of Lean Six Sigma workflow management
- Both Lean and Six Sigma focus on meeting customer requirements
- Lean emphasizes the elimination of waste and time
- Six Sigma focuses on quality improvement through reducing defects
- Lean and Six Sigma have complementary tools to help develop a shared understanding of the workflow process by identifying defects, areas of waste and process delay, workstation design and organization
- Lean Six Sigma applications include improving turnaround times, reducing data entry defects, improving insurance claim performance or improving workflow across multiple departments, such as with lab and pathology specimens (see Principles of laboratory quality improvement topic)
Lean Six Sigma project teams
- Project team that includes both the emergency department and laboratory staff is more effective when working to improve emergency department laboratory test turnaround time
- Project team with gross room staff, histology staff and pathologists is more effective when working to improve specimen processing and slide distribution
- Workflow process that is designed based on Lean and Six Sigma principles will be more efficient and effective than a workflow process that has been allowed to evolve naturally over time
Lean Six Sigma project charter
- Clear and concise project description (problem statement)
- Clear scope with a starting and ending point
- Tied to key Critical to Quality (CTQ) measures
- Defined links to company goals
- Quantified analysis of the financial benefit
- Identified team members and other resources (time)
- Identified customers and link to their needs
- Sign off that everyone is clear and committed to success
Lean Six Sigma operations following DMAIIC
- Select a problem to solve or process to improve
- Start the Define phase with the project charter, stakeholder analysis, process maps, Voice of the Customer and Critical to Quality measures to clarify problem, scope, customer needs and benefits
- Continue with the Measure phase using a data collection plan, Gage R&R, control charts, frequency plots, Pareto charts, FMEA and process capability studies to measure baseline performance
- Continue with the Analyze phase using cause and effect diagrams, affinity diagrams, flow diagrams, DOE, hypothesis tests, regression analysis, scatter plots and brainstorming to identify root causes
- Continue with the Innovative Improvement phase using the same analysis tools testing new solutions
- Finish with the Control phase using control charts, standards operating procedures and monitor performance
- All project activities must be completely and clearly documented
- Keep stakeholders and other interested parties well informed
Process mapping and evaluation
- Detailed capture of steps, times, capabilities or capacity to identify areas of batch processing versus single piece flow, signals of when work is available to be done and other process details
- Identification of bottlenecks, inventory, delays, rework due to defects and other sources of waste
- Graphical presentation allows grasp of the full scope of processes
- Spaghetti maps allow analysis of physical movements to complete work to detect movement waste
Images
Contributed by Stephen J. Hardy, M.B.A.
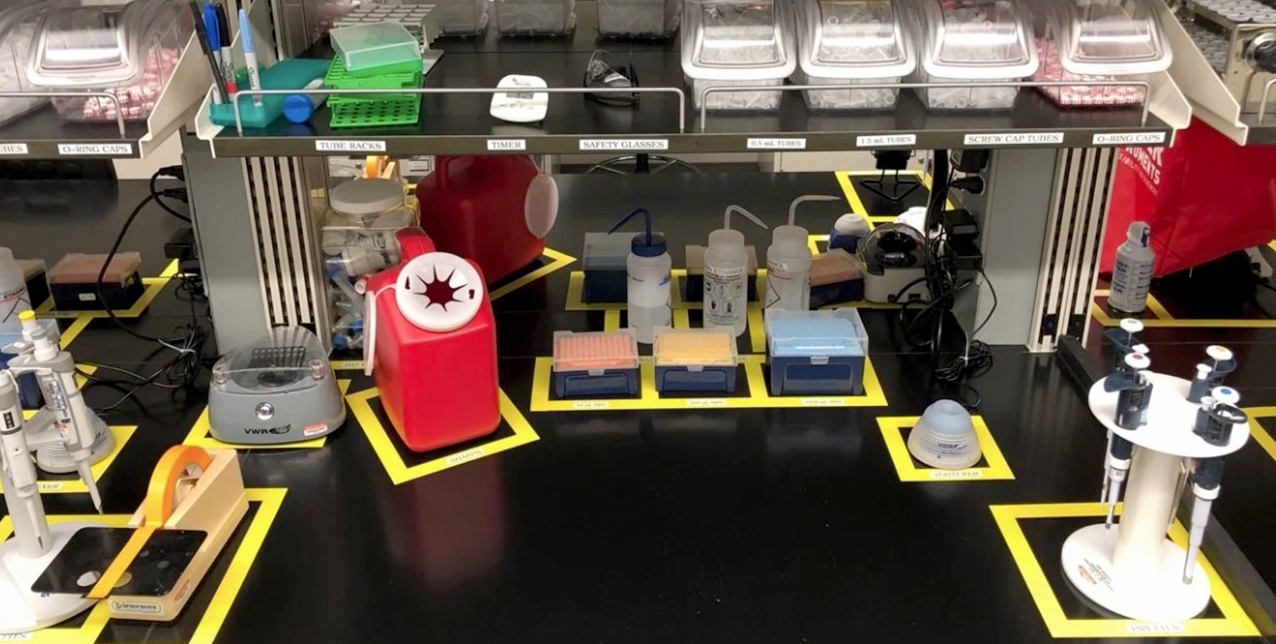
Sample 5S lab workspace
Case studies
- Delivery times for critical results to emergency department (J Med Biochem 2021;40:26)
- Elimination of error prone data entry or other steps (J Clin Lab Anal 2018;32:e22180)
- Use of Sigma metrics in coagulation laboratory (Int J Health Care Qual Assur 2018;31:600)
- Application to histology workflow (BMC Clin Pathol 2010;10:2)
- Reduction in total turnaround time in surgical pathology reporting (BMJ Qual Improv Rep 2015;4:u209223.w3773)
- Improving services from a molecular pathology lab (J Mol Diagn 2009;11:390)
- Hospital system laboratory (Lab Quality Confab: Listening to the Voice of the Customer at North Shore LIJ Laboratories [Accessed 31 March 2021])
- Improvement in phlebotomy experience and workflow (Am J Clin Pathol 2009;132:914)
- Pap test value stream assessment and improvement (Am J Clin Pathol 2013;139:574)
Videos
What is Lean?
What is Six Sigma?
5 whys
Lean / Six Sigma - waste, DMAIIC, etc.
Managers, steps and duties
Descriptive statistics
Five S
Value stream mapping basics
What is Kanban?
What is DMAIIC
Additional references
- Am J Clin Pathol 2007;128:423, Clin Lab Med 2004;24:865, Froehling: Measuring the "Voice of the Customer" in the Medical Laboratory Industry Using Surveys - A Case Study, 1st Edition, 2011, Pathol Lab Med Open J 2016;1:11, Six Sigma Material: Spaghetti Diagram [Accessed 31 March 2021], George: Lean Six Sigma for Service, 1st Edition, 2003, Voehl: The Lean Six Sigma Black Belt Handbook, 1st Edition, 2013, Eckes: Six Sigma Team Dynamicss, 1st Edition, 2002, Productivity Press Development Team: Kanban for the Shopfloor, 1st Edition, 2002
Board review style question #1
A laboratory has undertaken a process improvement project using Lean principles to improve services provided to clinicians offsite who submit samples. Which of the following Lean tools will give the best information about where they may find opportunities for improvement?
- Failure modes effect analysis (FMEA)
- Five S
- Five whys
- Root cause analysis (RCA)
- Value stream mapping (VSM)
Board review style answer #1
E. Value stream mapping (VSM) offers the best chance for an overview of a workflow or process beginning from the customer or supplier to the finished delivery of a product or service. Hence, it allows the best chance to identify areas for improvement and spots along the way where delays, rework, inventory or other forms of waste are generated that detract from the value the customer desires to pay for.
Comment Here
Reference: Lean workflow / Six Sigma
Comment Here
Reference: Lean workflow / Six Sigma
Board review style question #2
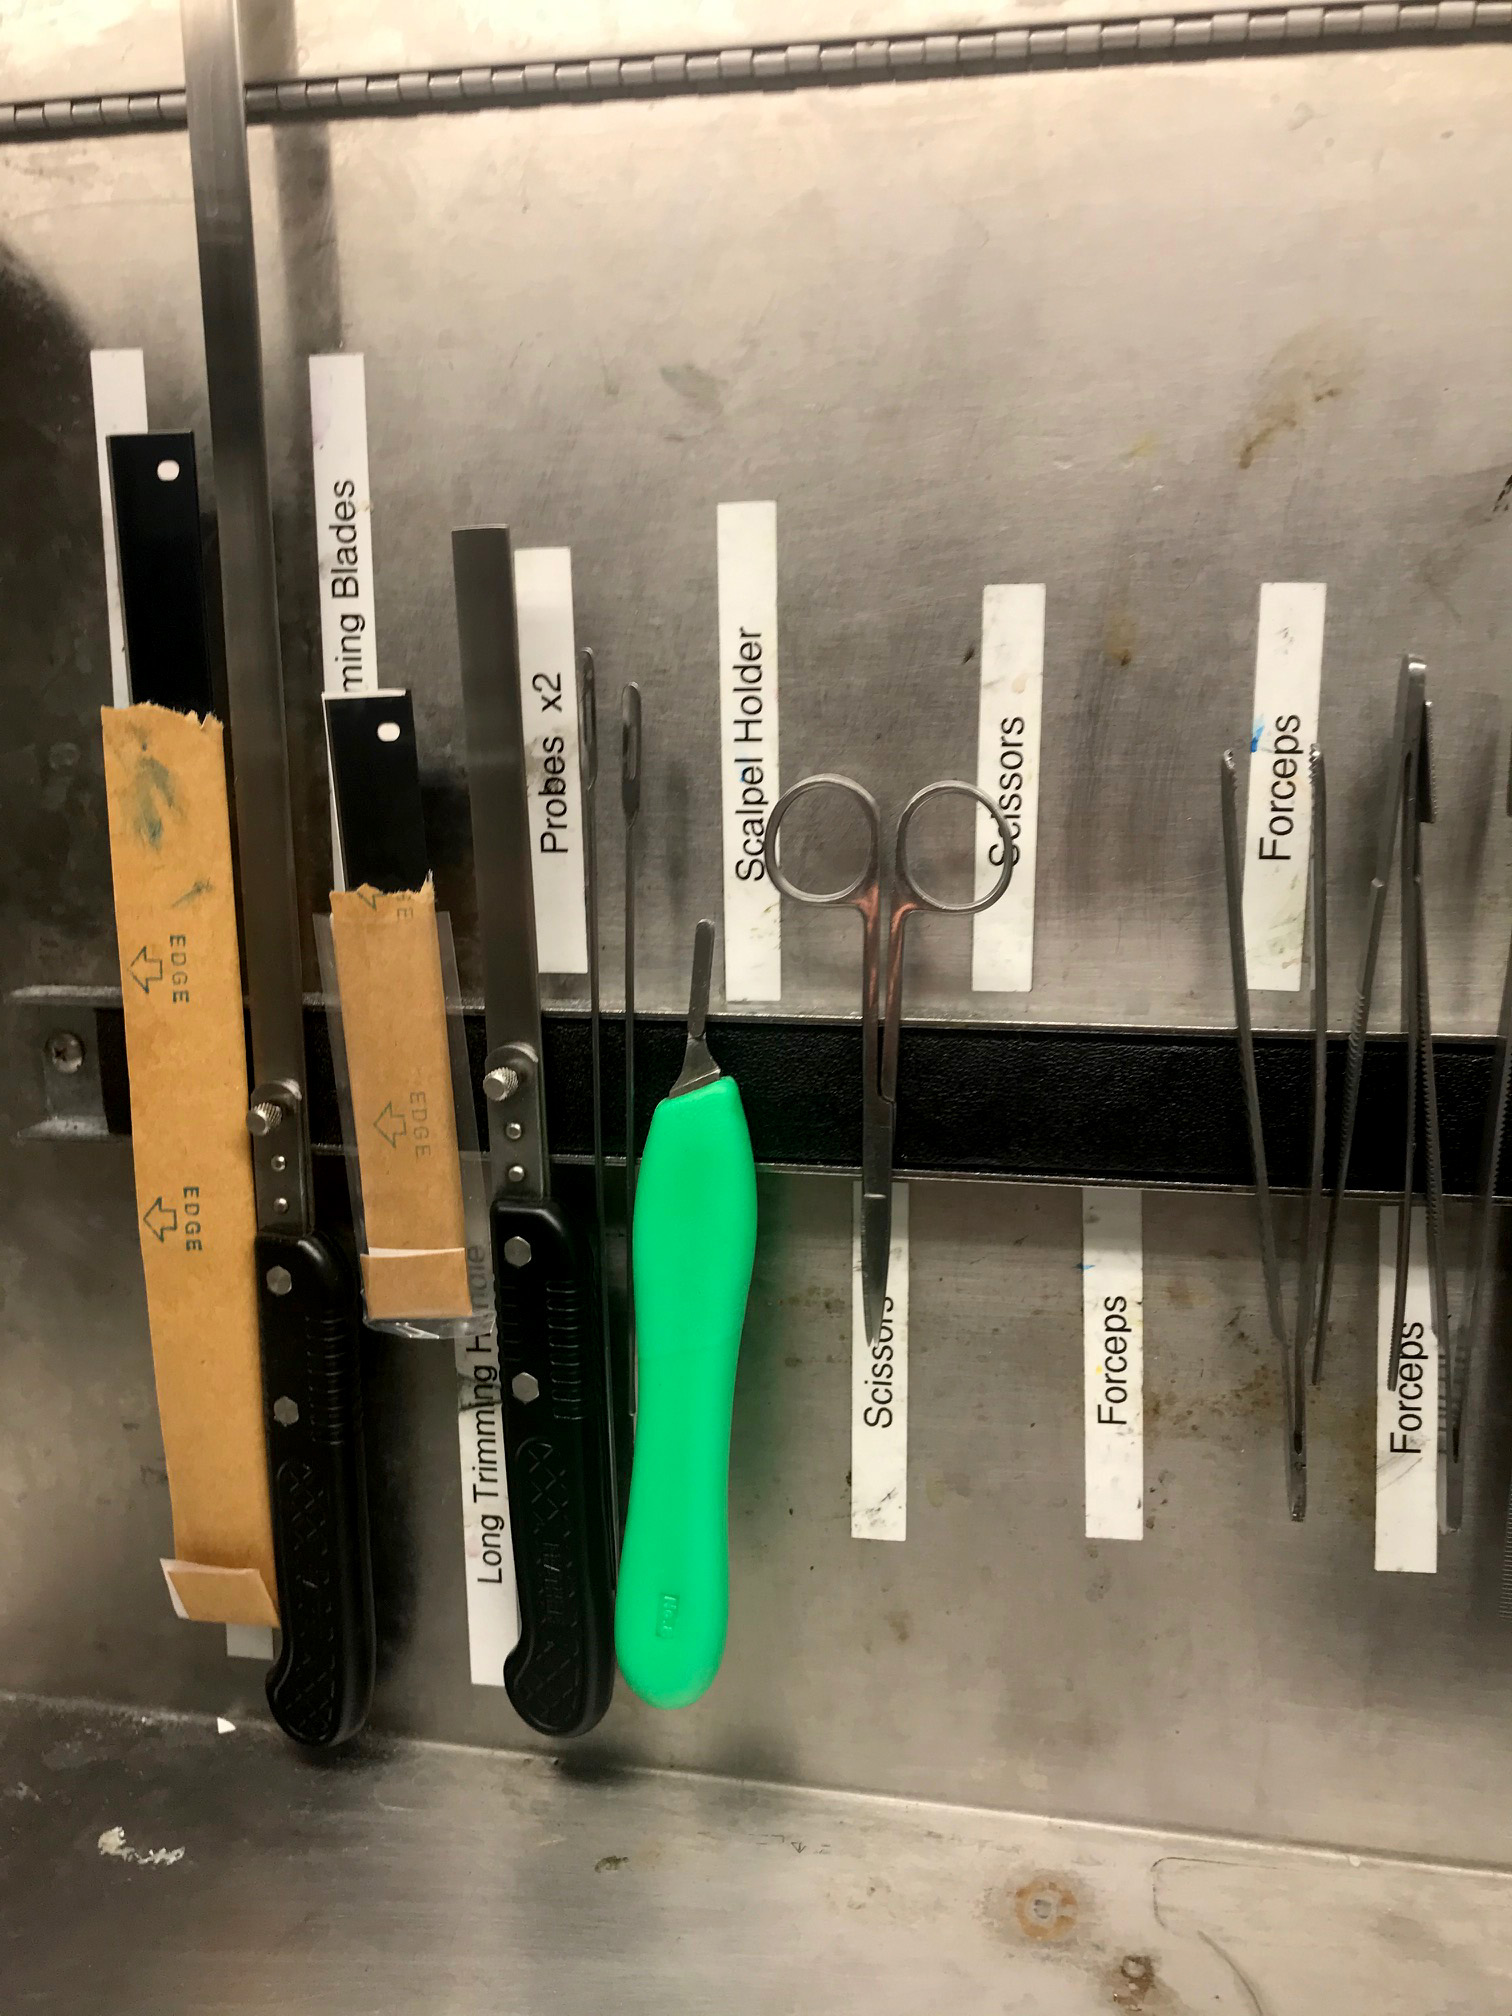
The lab you are working in has employed a visual system at every grossing station using labeling like this to readily identify when any of the needed tools are missing. This is an example of which of the following?
- CTQ
- Five S
- Kaizen
- Kanban
- Templating
Board review style answer #2
B. Five S refers to the organization of the workspace and includes the steps of Standardize and Set in Order. Using a standardized visual system to verify that each tool is present and ready to be used is an excellent way to organize a workspace, whether for grossing, accessioning or signout in pathology. The template also assists in the final S, Sustain.
Comment Here
Reference: Lean workflow / Six Sigma
Comment Here
Reference: Lean workflow / Six Sigma
Back to top
