
Laboratory Administration & Management of Pathology Practices
Quality management
Validation of reference intervals and reportable range
Authors: Duy K. Doan, M.D., Lewis A. Hassell, M.D.
Deputy Editor-in-Chief: Patricia Tsang, M.D., M.B.A.


Last author update: 30 August 2022
Last staff update: 17 January 2023
Copyright: 2022-2024, PathologyOutlines.com, Inc.
PubMed Search: Establishing reference intervals
Table of Contents
Definition / general | Essential features | Terminology | Diagrams / tables | Establishing reference intervals | Transference of reference intervals | Validation of reference intervals | Validation of reportable range | Videos | Additional references | Board review style question #1 | Board review style answer #1 | Board review style question #2 | Board review style answer #2Cite this page: Doan DK, Hassell LA. Validation of reference intervals and reportable range. PathologyOutlines.com website. https://www.pathologyoutlines.com/topic/labadminreferenceintervals.html. Accessed May 12th, 2024.
Definition / general
- Reference intervals (RI) are defined as the central 95% of laboratory test results obtained from a healthy reference population (McPherson: Henry's Clinical Diagnosis and Management by Laboratory Methods, 23rd Edition, 2016)
- 5% of all results from healthy people will fall outside of the reported RI and as such, will be flagged as being abnormal (Am J Clin Pathol 2010;133:180)
- Reportable range (analytical measurement range) is the span of test result values over which the laboratory can establish or verify the accuracy of the instrument or test system measurement response (Legal Information Institute: Definitions [Accessed 26 July 2022])
Essential features
- Nearly 80% of physicians' medical decisions are based on information provided by laboratory reports (Am J Clin Pathol 2010;133:180)
- RIs given in laboratory reports have an important role in aiding the clinician in the interpretation of test results as compared to values for healthy populations (Biochem Med (Zagreb) 2016;26:5)
- Reference ranges are population specific and are also influenced by instrumentation and testing methods
- Hence reference ranges used within a given lab may vary from those of another lab using different testing systems and serving different patient populations
Terminology
- Reference population is a group of healthy individuals that is served by the laboratory
- Outlier is an observation that lies an abnormal distance from other values, in a random sample from a population
- Normal distribution, also called Gaussian distribution, is a probability distribution that is symmetric about the mean, showing that data near the mean are more frequent in occurrence than data far from the mean; the normal distribution data show a bell shaped curve
- Parametric method is a statistical test that assumes that observed values follow the normal distribution
- Nonparametric method is a statistical test that makes no specific assumption about the distribution of the data (Bishop: Clinical Chemistry - Principles, Techniques, and Correlations, 9th Edition, 2022)
- Box-Cox transformation is a mathematical method used to convert nonnormal distribution data into normal distribution data
- Systematic error is a consistent or proportional difference between the observed and true values
- Random error is a chance difference between the observed and true values
- Validation of reference interval is a study to establish that an assay works as intended
- This applies to non-FDA cleared tests (e.g., laboratory developed methods) and modified FDA approved tests
- Modifications refer to changes to the assay that are not specified as acceptable by the manufacturer
- Verification of reference interval is a one time study meant to demonstrate that an assay performs in line with previously established performance characteristics; this applies to unmodified FDA approved or cleared tests
- Transference refers to adoption of previously established RI by a laboratory
- Reportable range refers to the span of results within which the method performs acceptably in terms of sensitivity, linearity and reproducibility
Diagrams / tables
Contributed by Duy K. Doan, M.D. and Lewis A. Hassell, M.D.
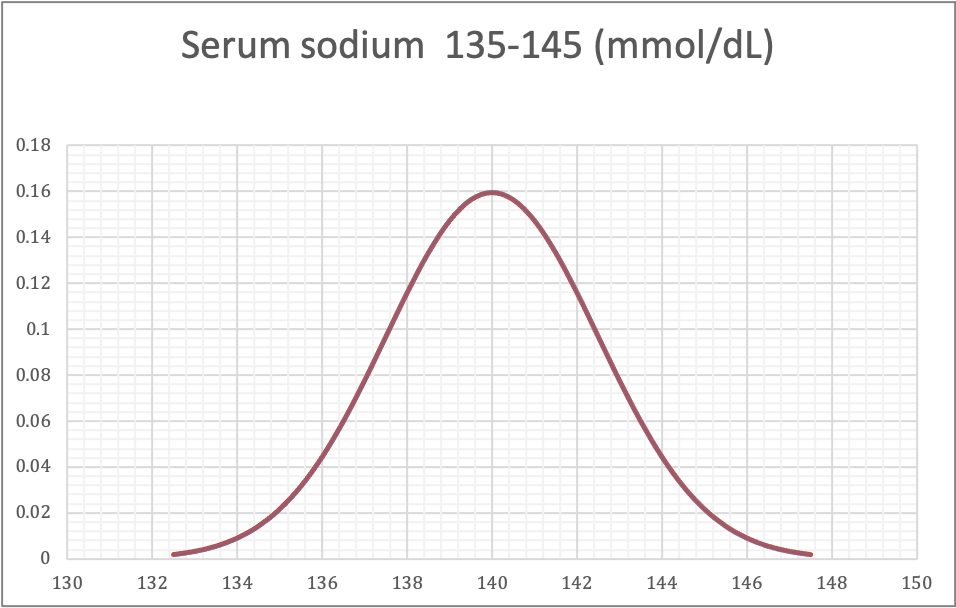
Normal distribution, serum sodium
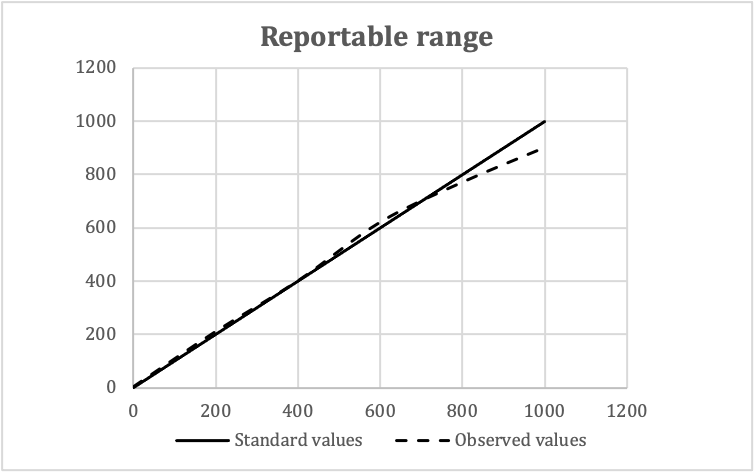
Reportable range
Validation of reportable ranges
| Standard values | Observed values | Means | ||
| Replicate 1 | Replicate 2 | Replicate 3 | ||
| 0 | 2 | 0 | 4 | 3 |
| 200 | 220 | 210 | 200 | 210 |
| 400 | 400 | 400 | 400 | 400 |
| 600 | 620 | 630 | 610 | 620 |
| 800 | 760 | 760 | 790 | 770 |
| 1,000 | 920 | 900 | 880 | 900 |
- In this example:
- Expected reportable ranges: 0 - 1,000 mg/dL
- Number of concentration levels: 5
- Number of replicates: 3
Establishing reference intervals
- Direct approach: subjects representing the reference population are selected and sampled and the specimens are analyzed to determine the reference intervals
- Indirect approach: results from specimens collected for routine purposes, such as for screening, diagnostic or monitoring purposes, are used to determine the reference intervals
- Reference: Clin Chem Lab Med 2018;57:20
| Direct approach | Indirect approach |
|
|
Direct approach
| 1. Selection of reference individuals |
|
| 2. Analysis of the samples |
|
| 3. Evaluation |
|
Indirect approach
| 1. Select the population |
|
| 2. Statistical evaluation |
|
Transference of reference intervals
- Laboratories are not required to establish their own RIs; most laboratories use previously established RIs
- If the patient population and methodology are comparable, the RIs can be transferred
- Like establishing RIs, parametric and nonparametric methods are also used for comparing data sets in transference
- Nonparametric methods such as Mann-Whitney, Run and Monte Carlo tests are preferred because they can be applied to data irrespective of distribution characteristics (Laboratory Medicine 2006;37:306)
Validation of reference intervals
- CLSI document C28-A recommends 3 methods for meeting the CLIA specified requirement:
- Inspection method
- This is a not a statistical approach
- If there is no evidence to show that the patient population served by the laboratory differs from the reference population, the use of reference intervals is acceptable
- Decision can be made by the laboratory medical director
- This method can be used only if the local population data are unavailable
- Limited validation
- 20 samples are obtained from the healthy subjects served by the laboratory
- If no more than 2 values (10%) fall outside the reference interval, the range is validated
- If ≥ 3 reference specimens are outside of the reference range, 20 additional reference samples can be obtained; if ≥ 3 of the second reference sample are again out of the reference interval, the laboratory should consider establishing its own reference range (Laboratory Medicine 2006;37:306)
- Extended validation
- 60 samples are obtained from healthy subjects served by the laboratory
- Reference interval of the local population is generated (parametric method, Gaussian distribution)
- Another 60 samples are randomly collected from the same population; if the reference interval calculated in this study is similar to that of the above, the range is validated
- This method is not recommended because this is nearly the same as the sample size required for an RI study (Clin Chem Lab Med 2018;57:30)
- Inspection method
Validation of reportable range
- Procedure to confirm the linear relationship between the analytical results of a method and the concentration of the analyte over the range of measurement
- Materials: patient specimens, commercial kits, standard reference materials, calibrators
- Number of concentration levels: CLSI recommends at least 4, preferably 5 different concentration levels; 1 minimum value, 1 midpoint value and 1 maximum value should be included
- Analyze 3 samples at each value in replicate
- Data analysis: plot observed values against standard values
- Check visually for linearity
- Calculate the slope and intercept
- Coefficient of variance (CV) = SD/mean; CV < 10 is very good, 10 - 20 is good, 20 - 30 is acceptable and CV > 30 is not acceptable
- Reference: Arch Pathol Lab Med 2014;138:1173
Videos
Reference intervals, the basics
Additional references
Board review style question #1

| Reference interval | Sample size | |
| Ceruloplasmin (mg/L) | 159 - 414 | 603 |
A group of investigators from Saudi Arabia was studying the reference intervals of serum ceruloplasmin in adult healthy individuals. The results of their study are shown above. How many of the 603 subjects are expected to have a ceruloplasmin concentration of greater than 454 mg/L?
- 3
- 6
- 9
- 12
Board review style answer #1
A. 3. The data show a normal distribution; mean: 286.5. By definition, reference interval = mean ± 1.96 SD → 1 SD = 65. Ceruloplasmin levels of more than 454 will be approximately 2.58 SD from the mean / median (454 - 286.5 = 167.5 = 2.58 x 65 = 2.58 SD). 99% of values will be between (mean - 2.58 SD) and (mean + 2.58 SD), 0.5% values will be < (mean - 2.58 SD) and 0.5% values will be > (mean + 2.58 SD). Number of values > 454 will be 0.5% x 603 (n) = 3.
Comment Here
Reference: Validation of reference intervals and reportable range
Comment Here
Reference: Validation of reference intervals and reportable range
Board review style question #2
Which of the following is a disadvantage of using the indirect approach to establish reference intervals?
- Calculation method is complicated
- More expensive to perform
- Need informed consent to use samples
- Repeating the evaluation is technically challenging
Board review style answer #2
A. Calculation method is complicated
Comment Here
Reference: Validation of reference intervals and reportable range
Comment Here
Reference: Validation of reference intervals and reportable range
