
AFIP images
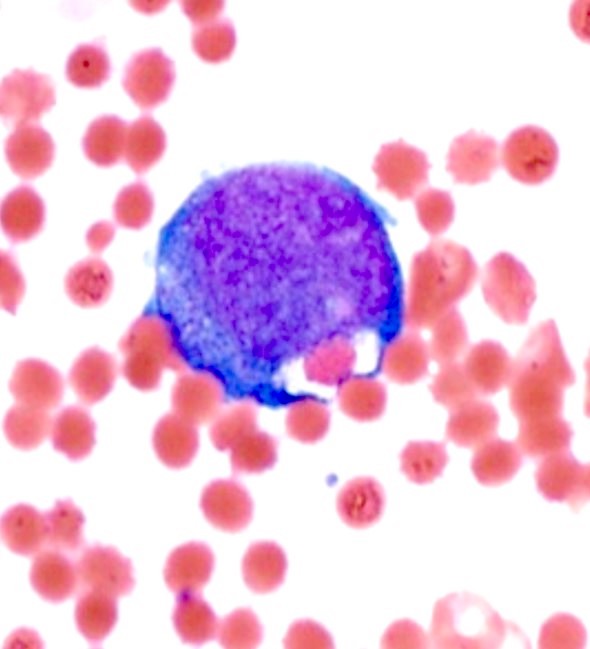
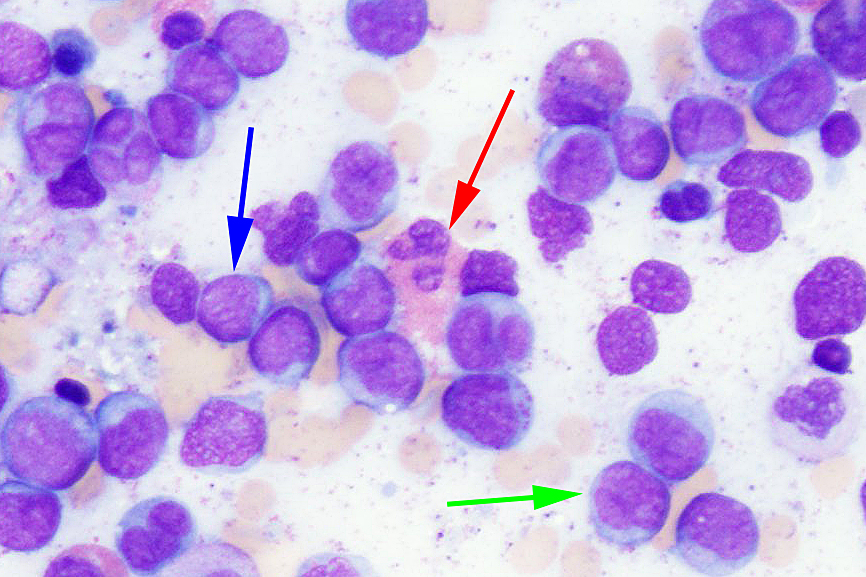
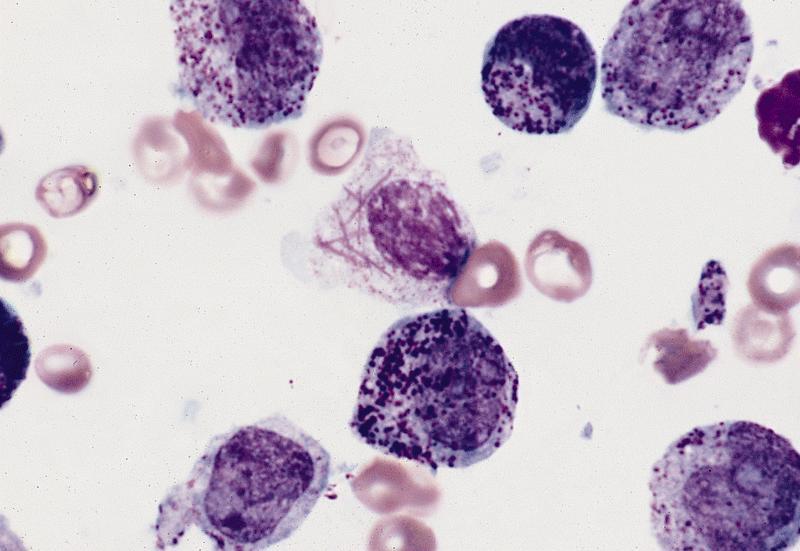
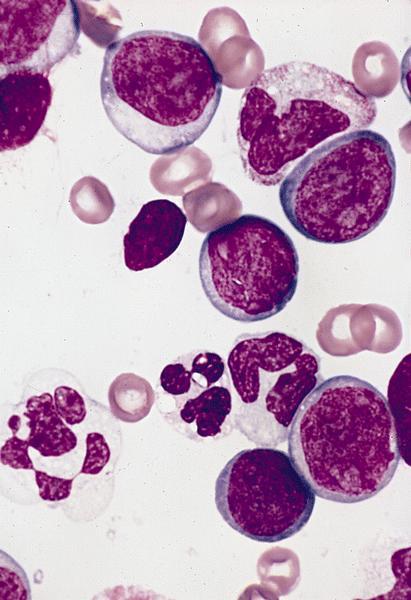
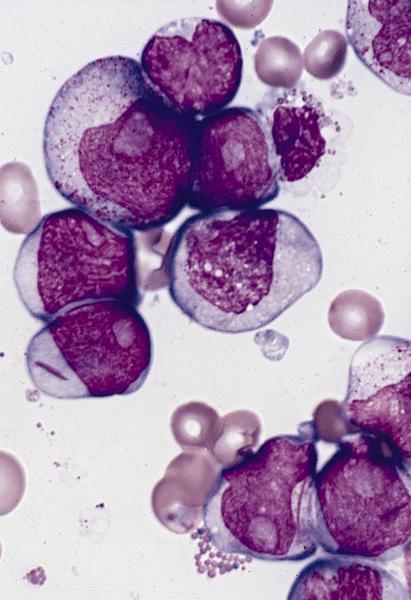
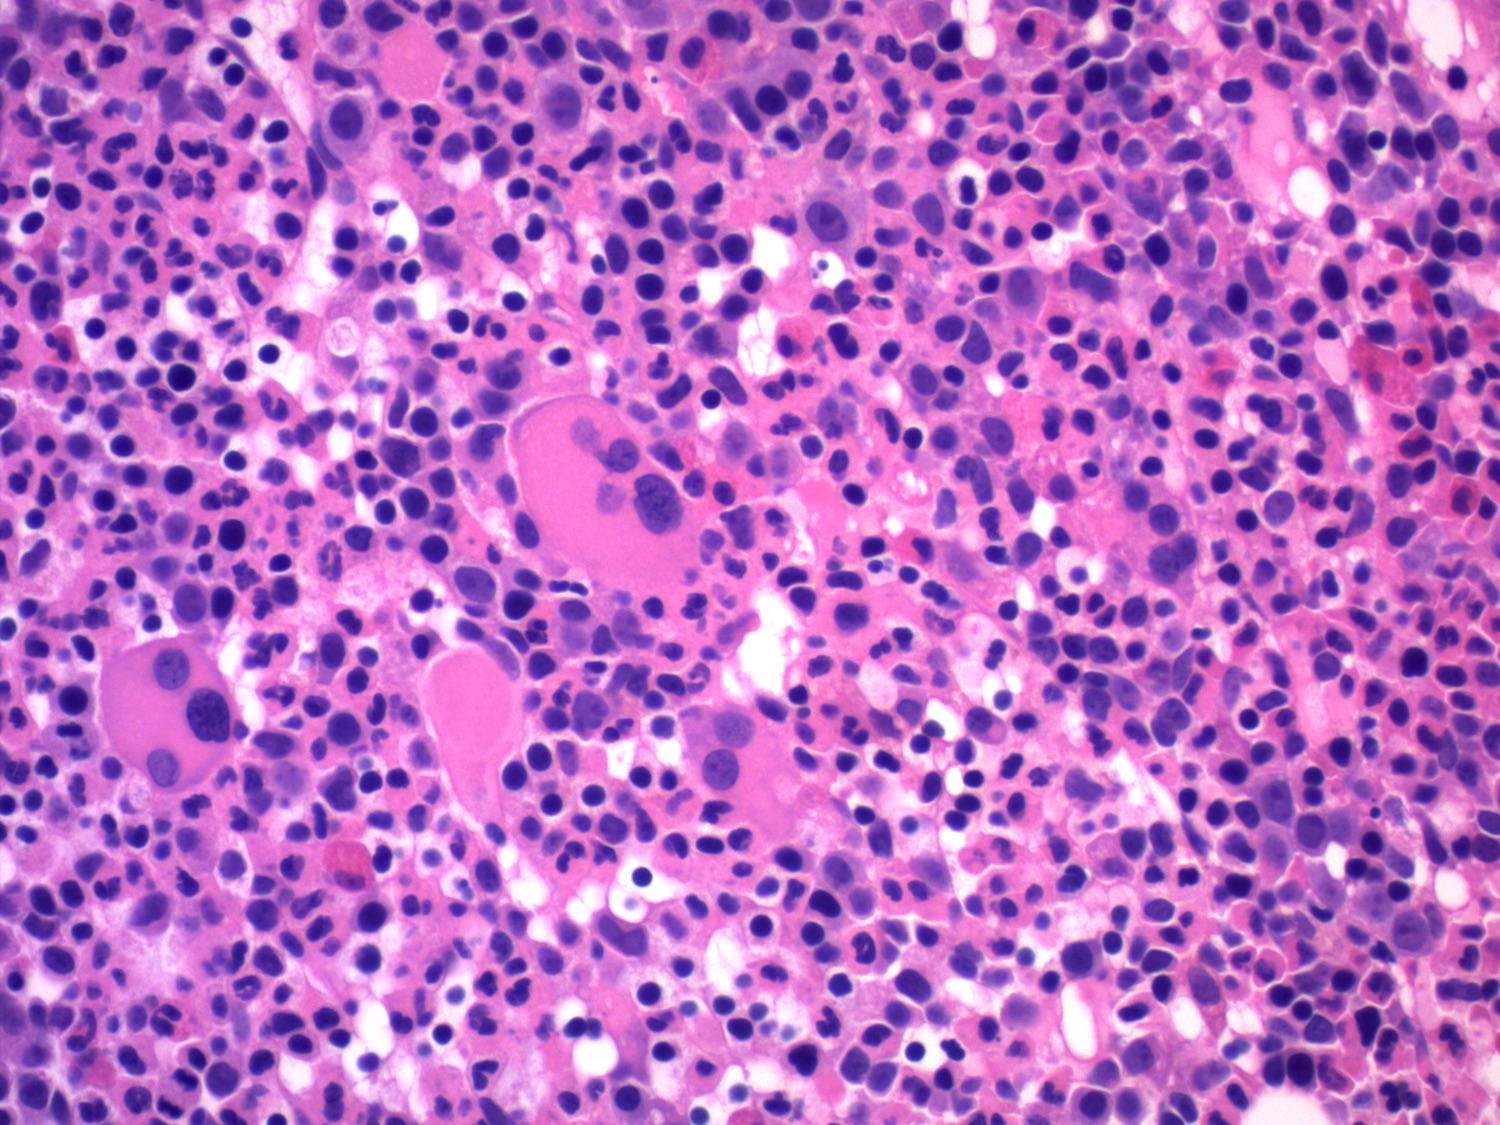
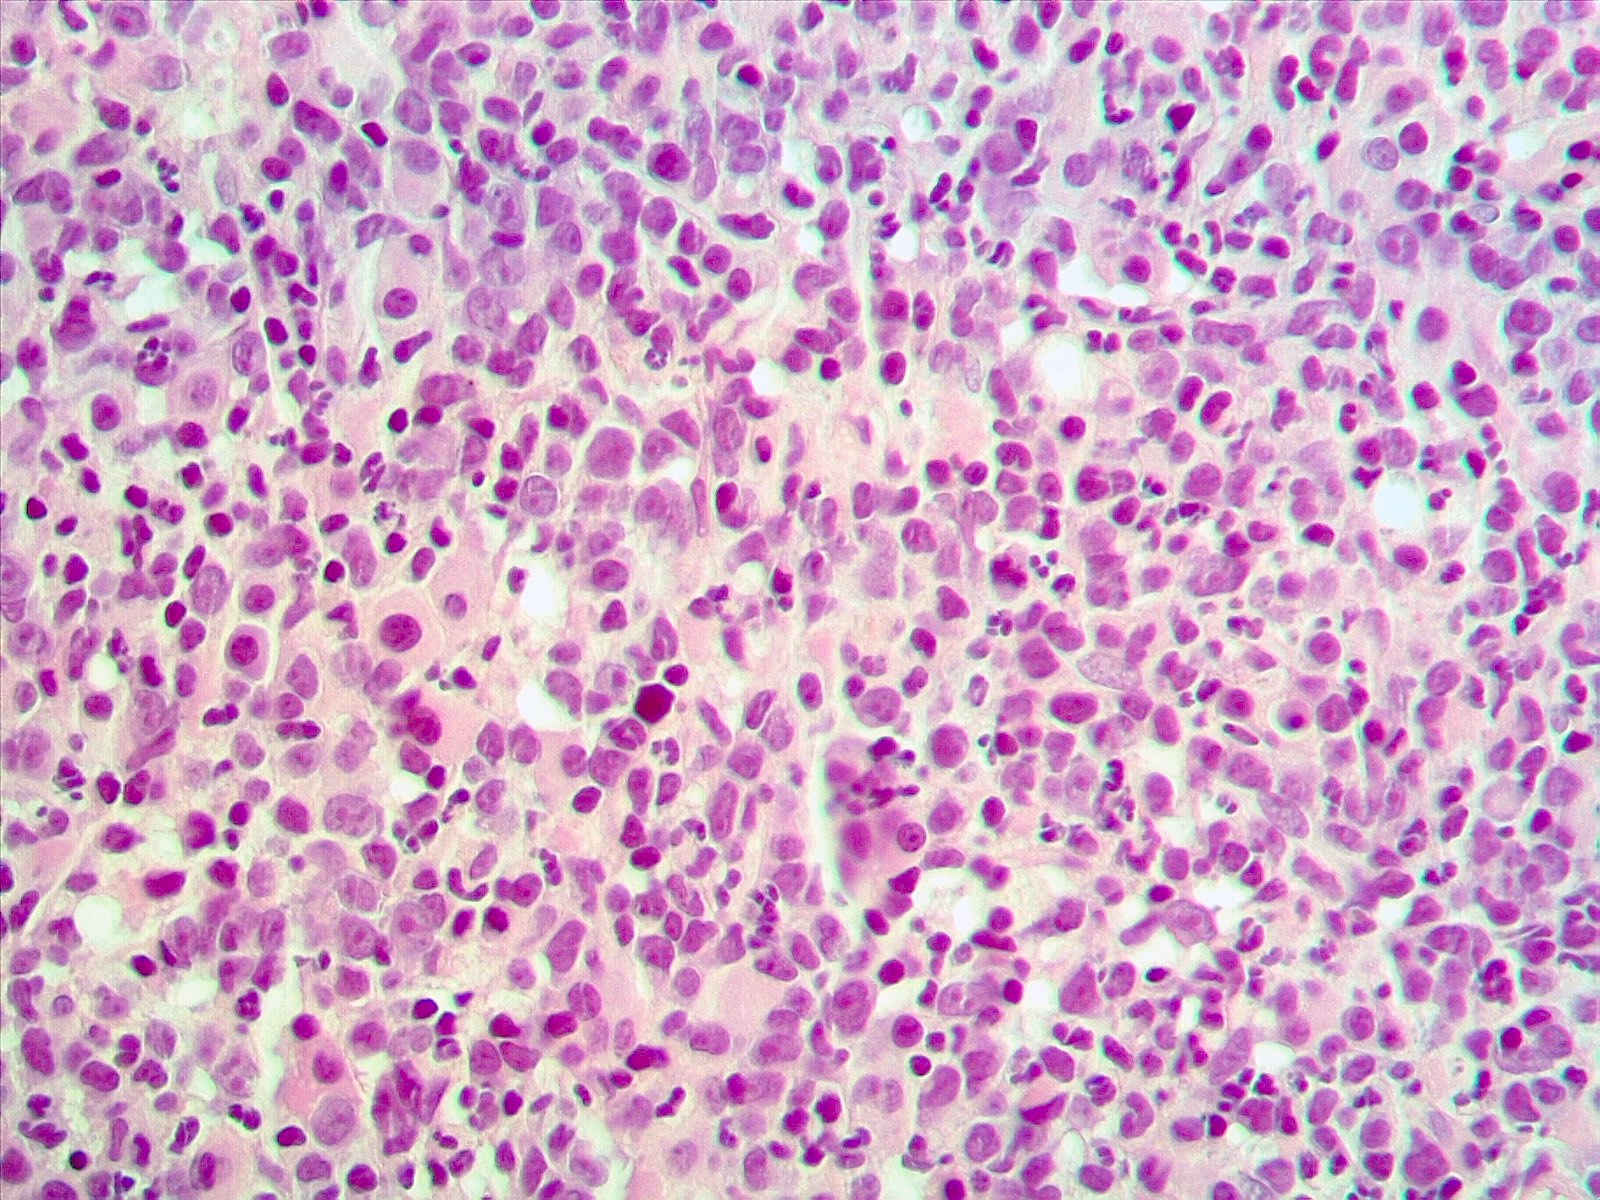
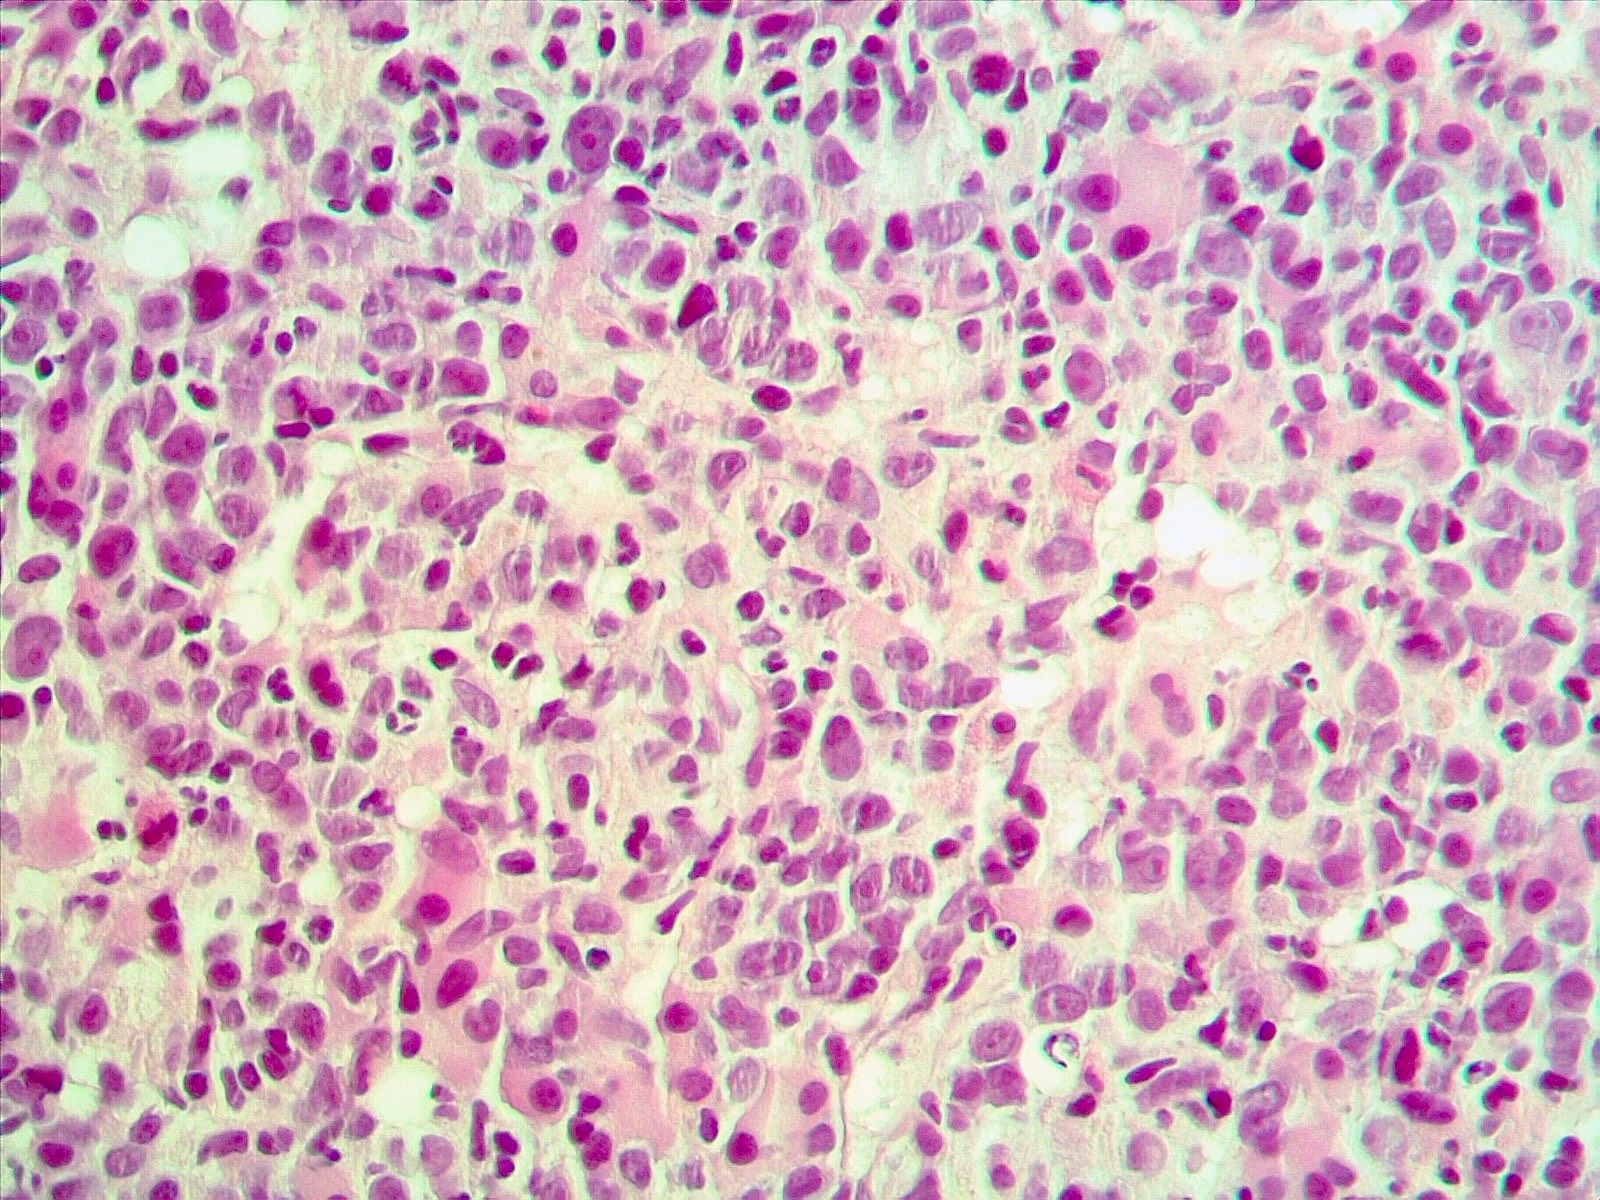
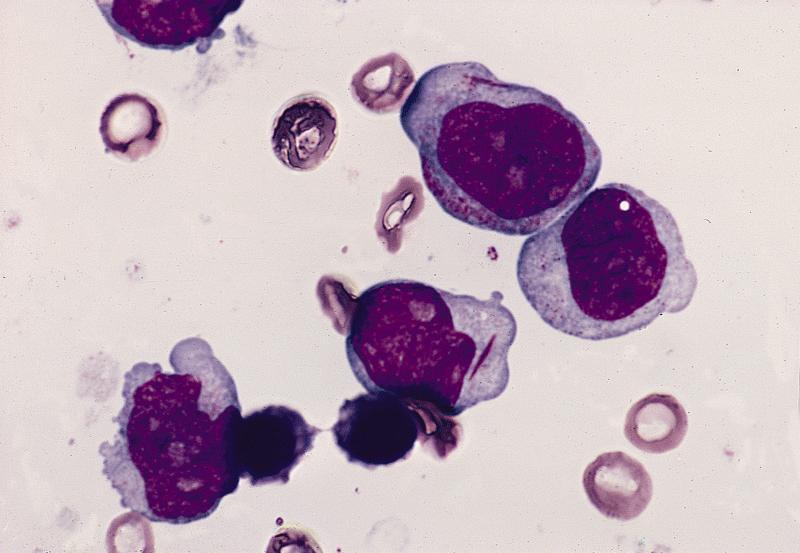
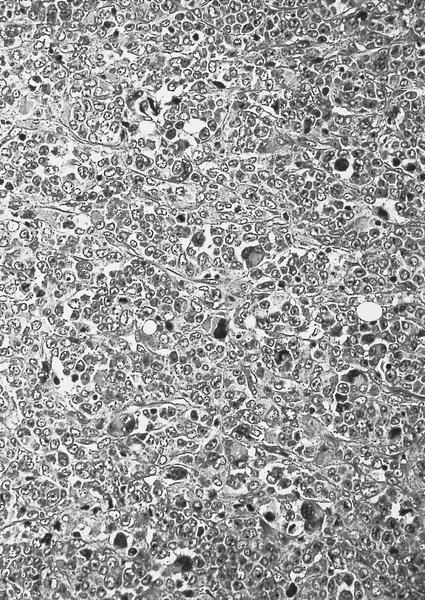
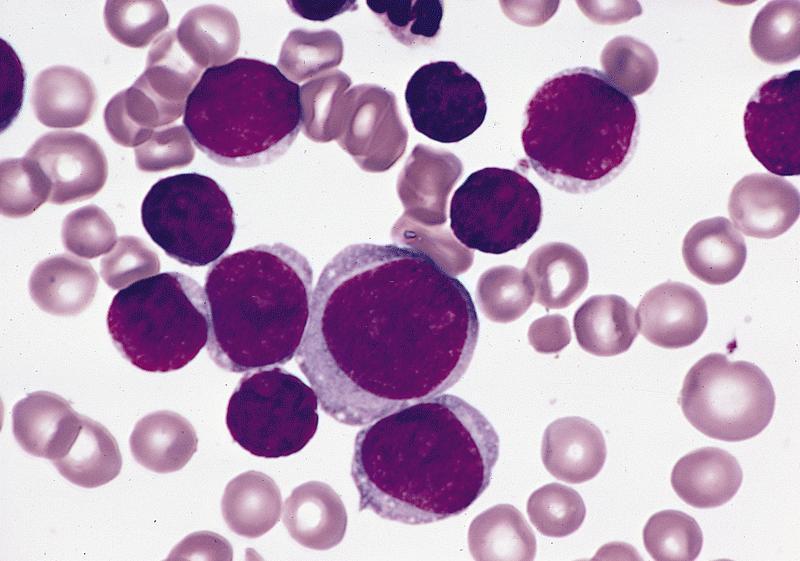
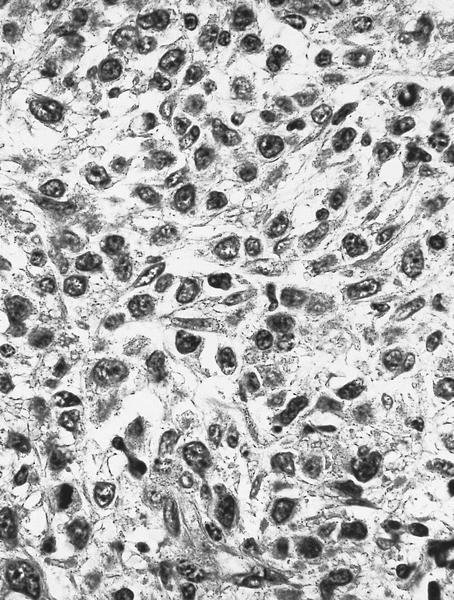
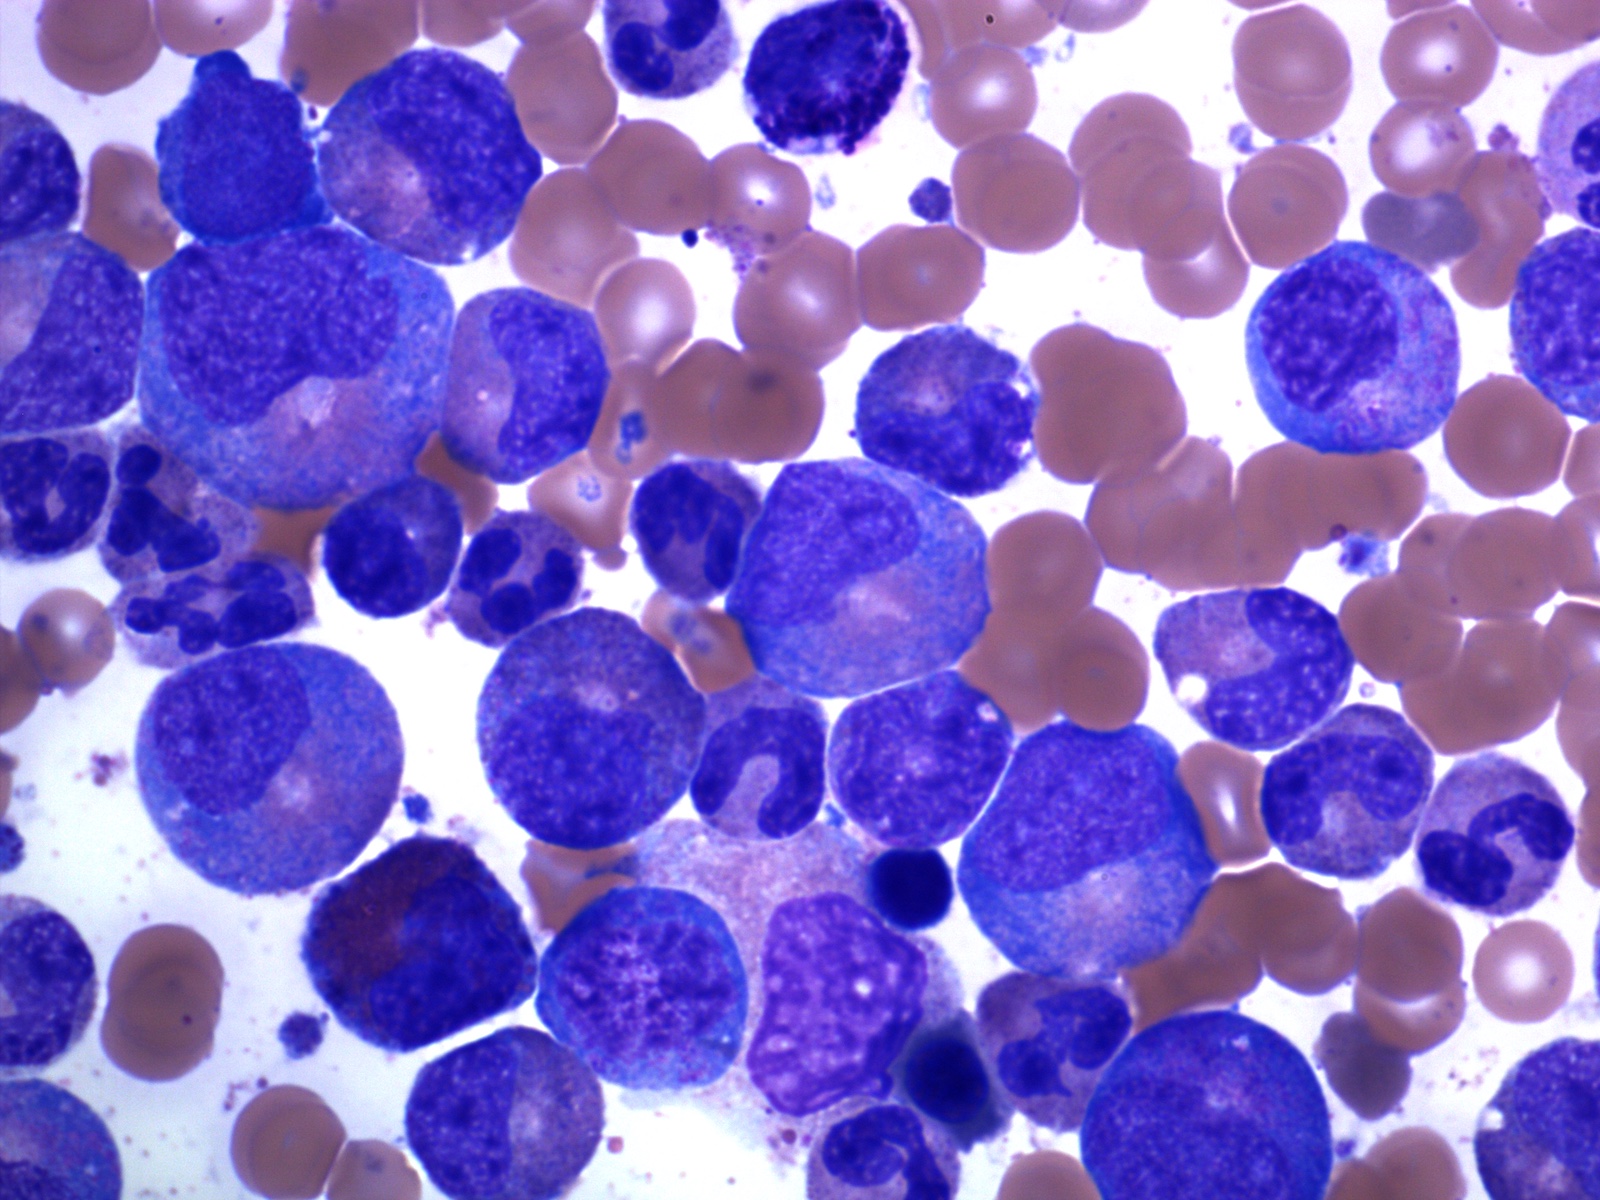
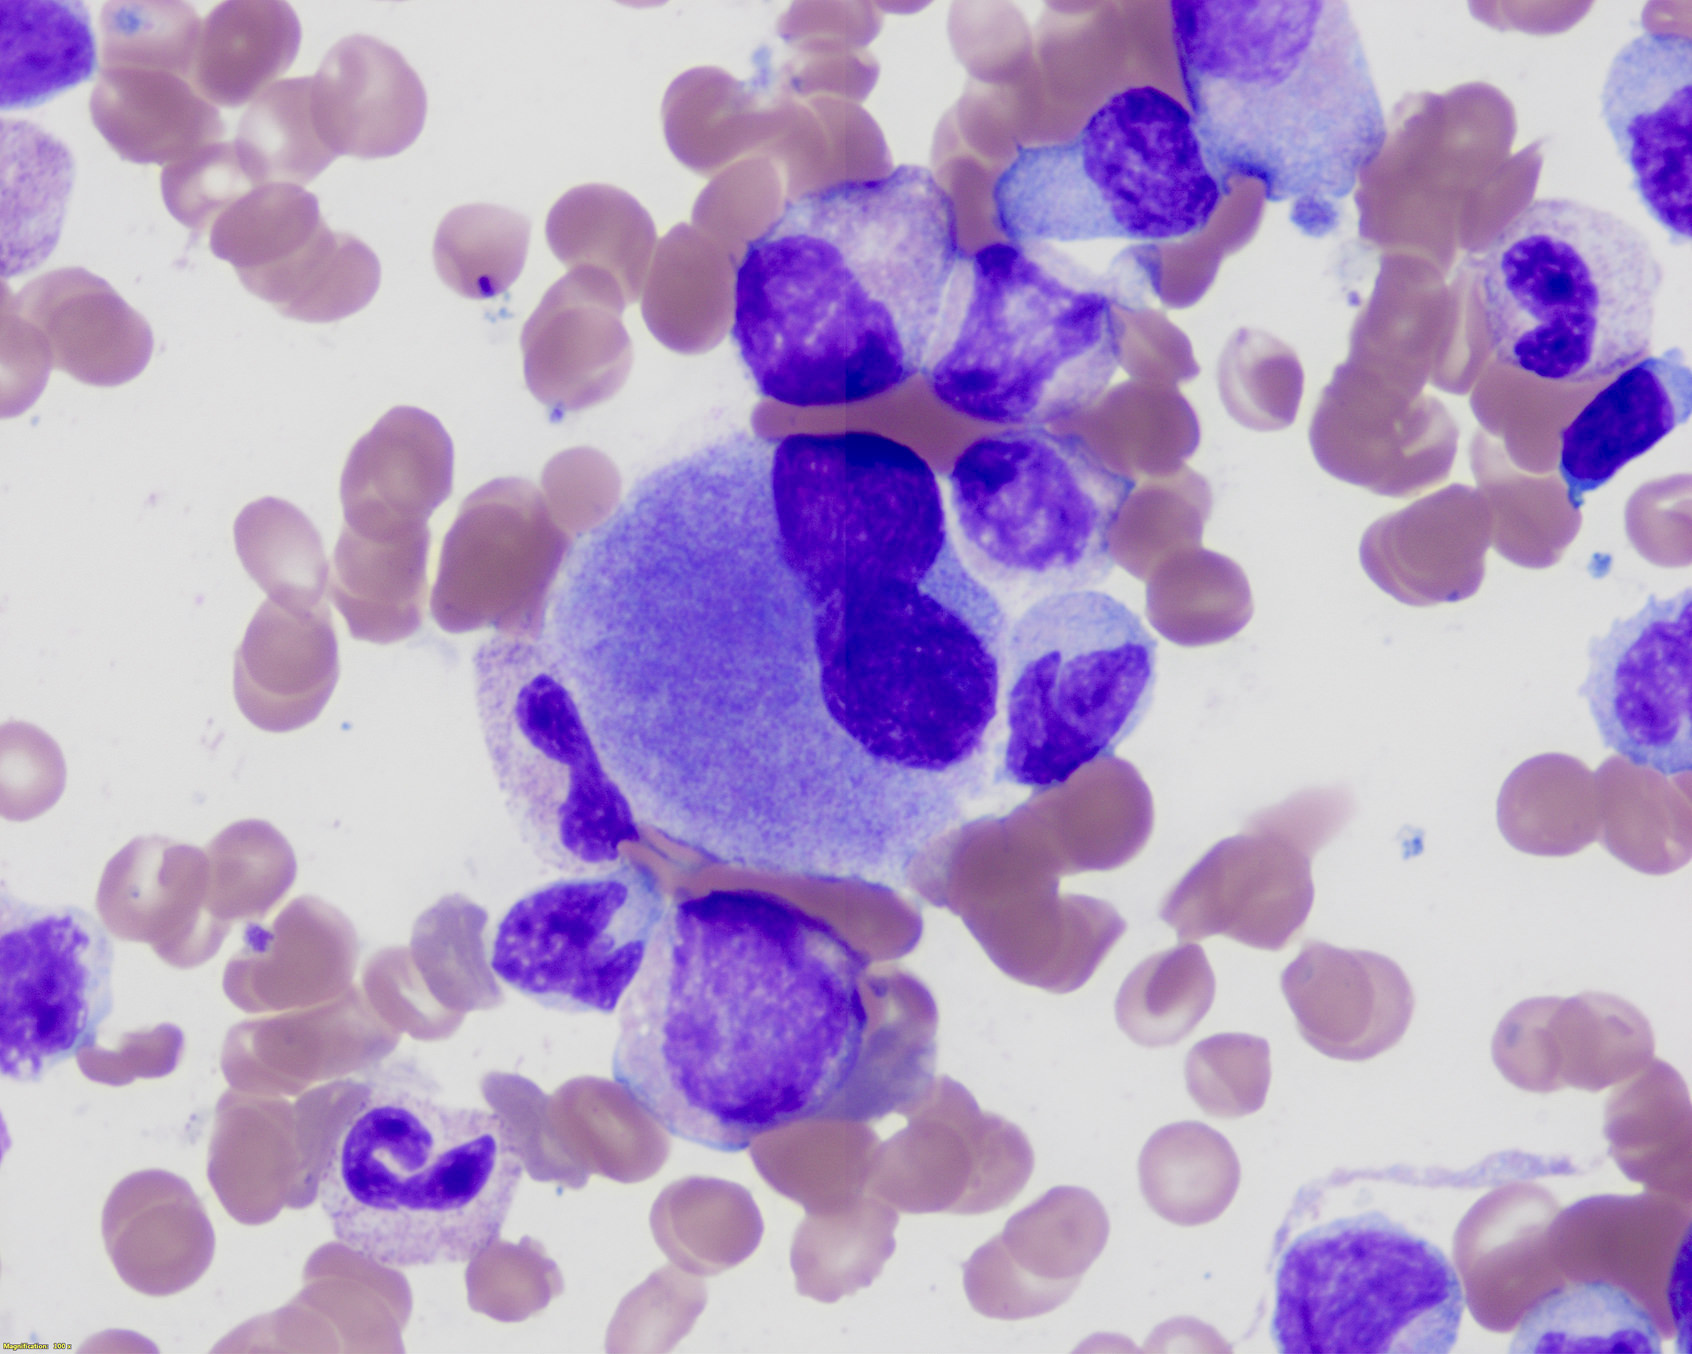
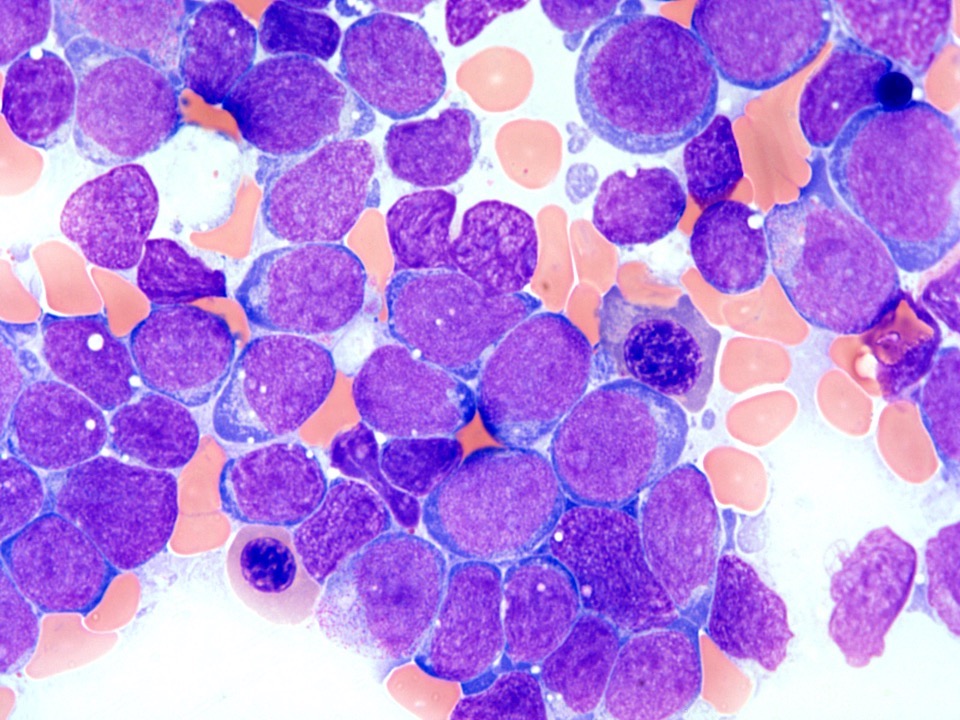
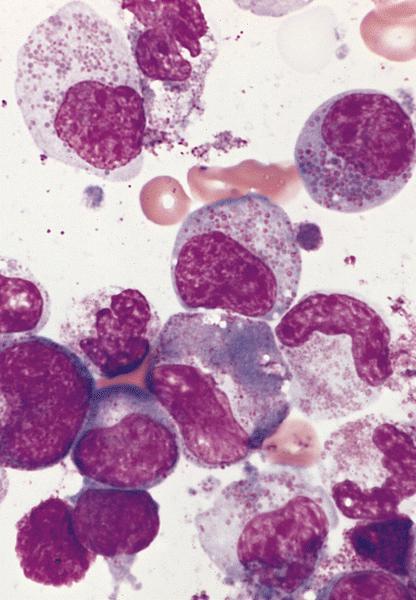
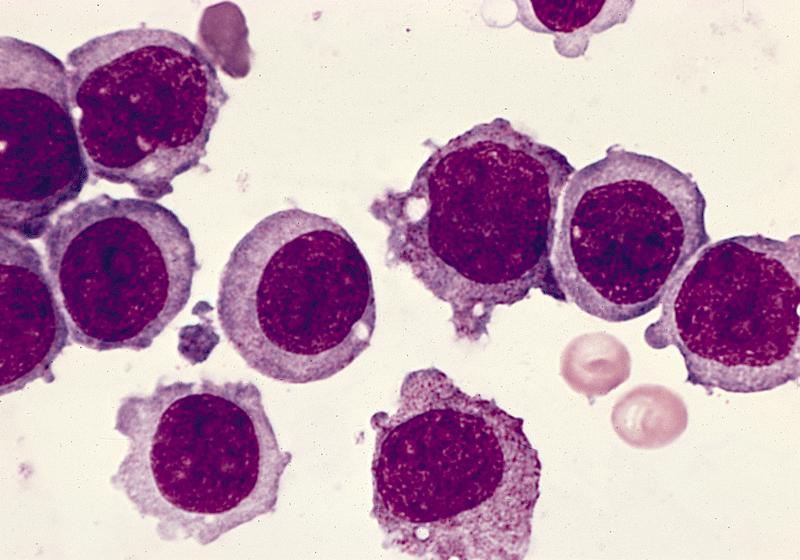
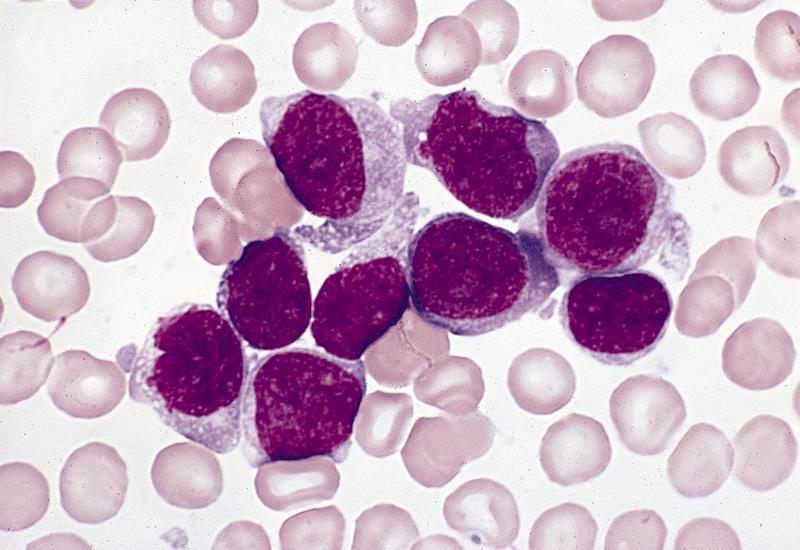
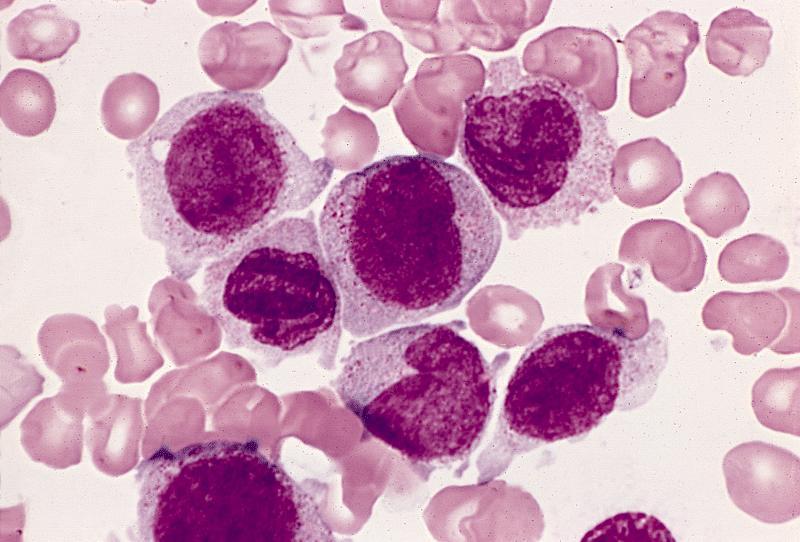
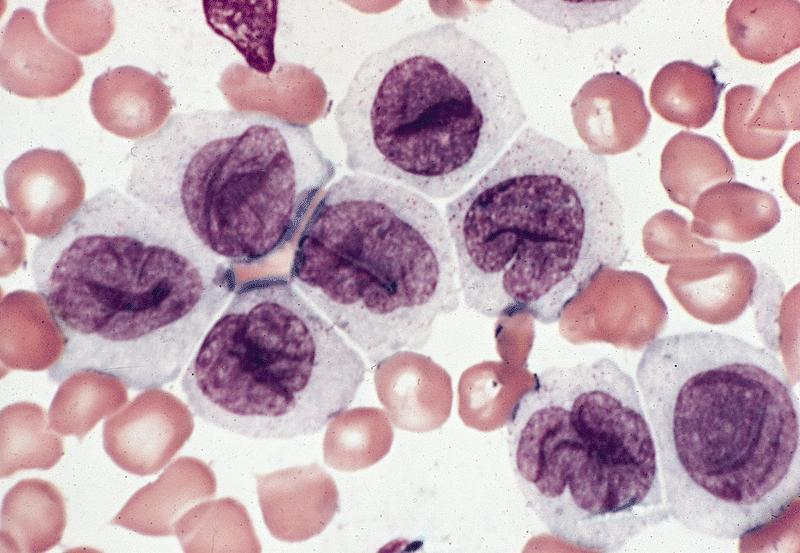
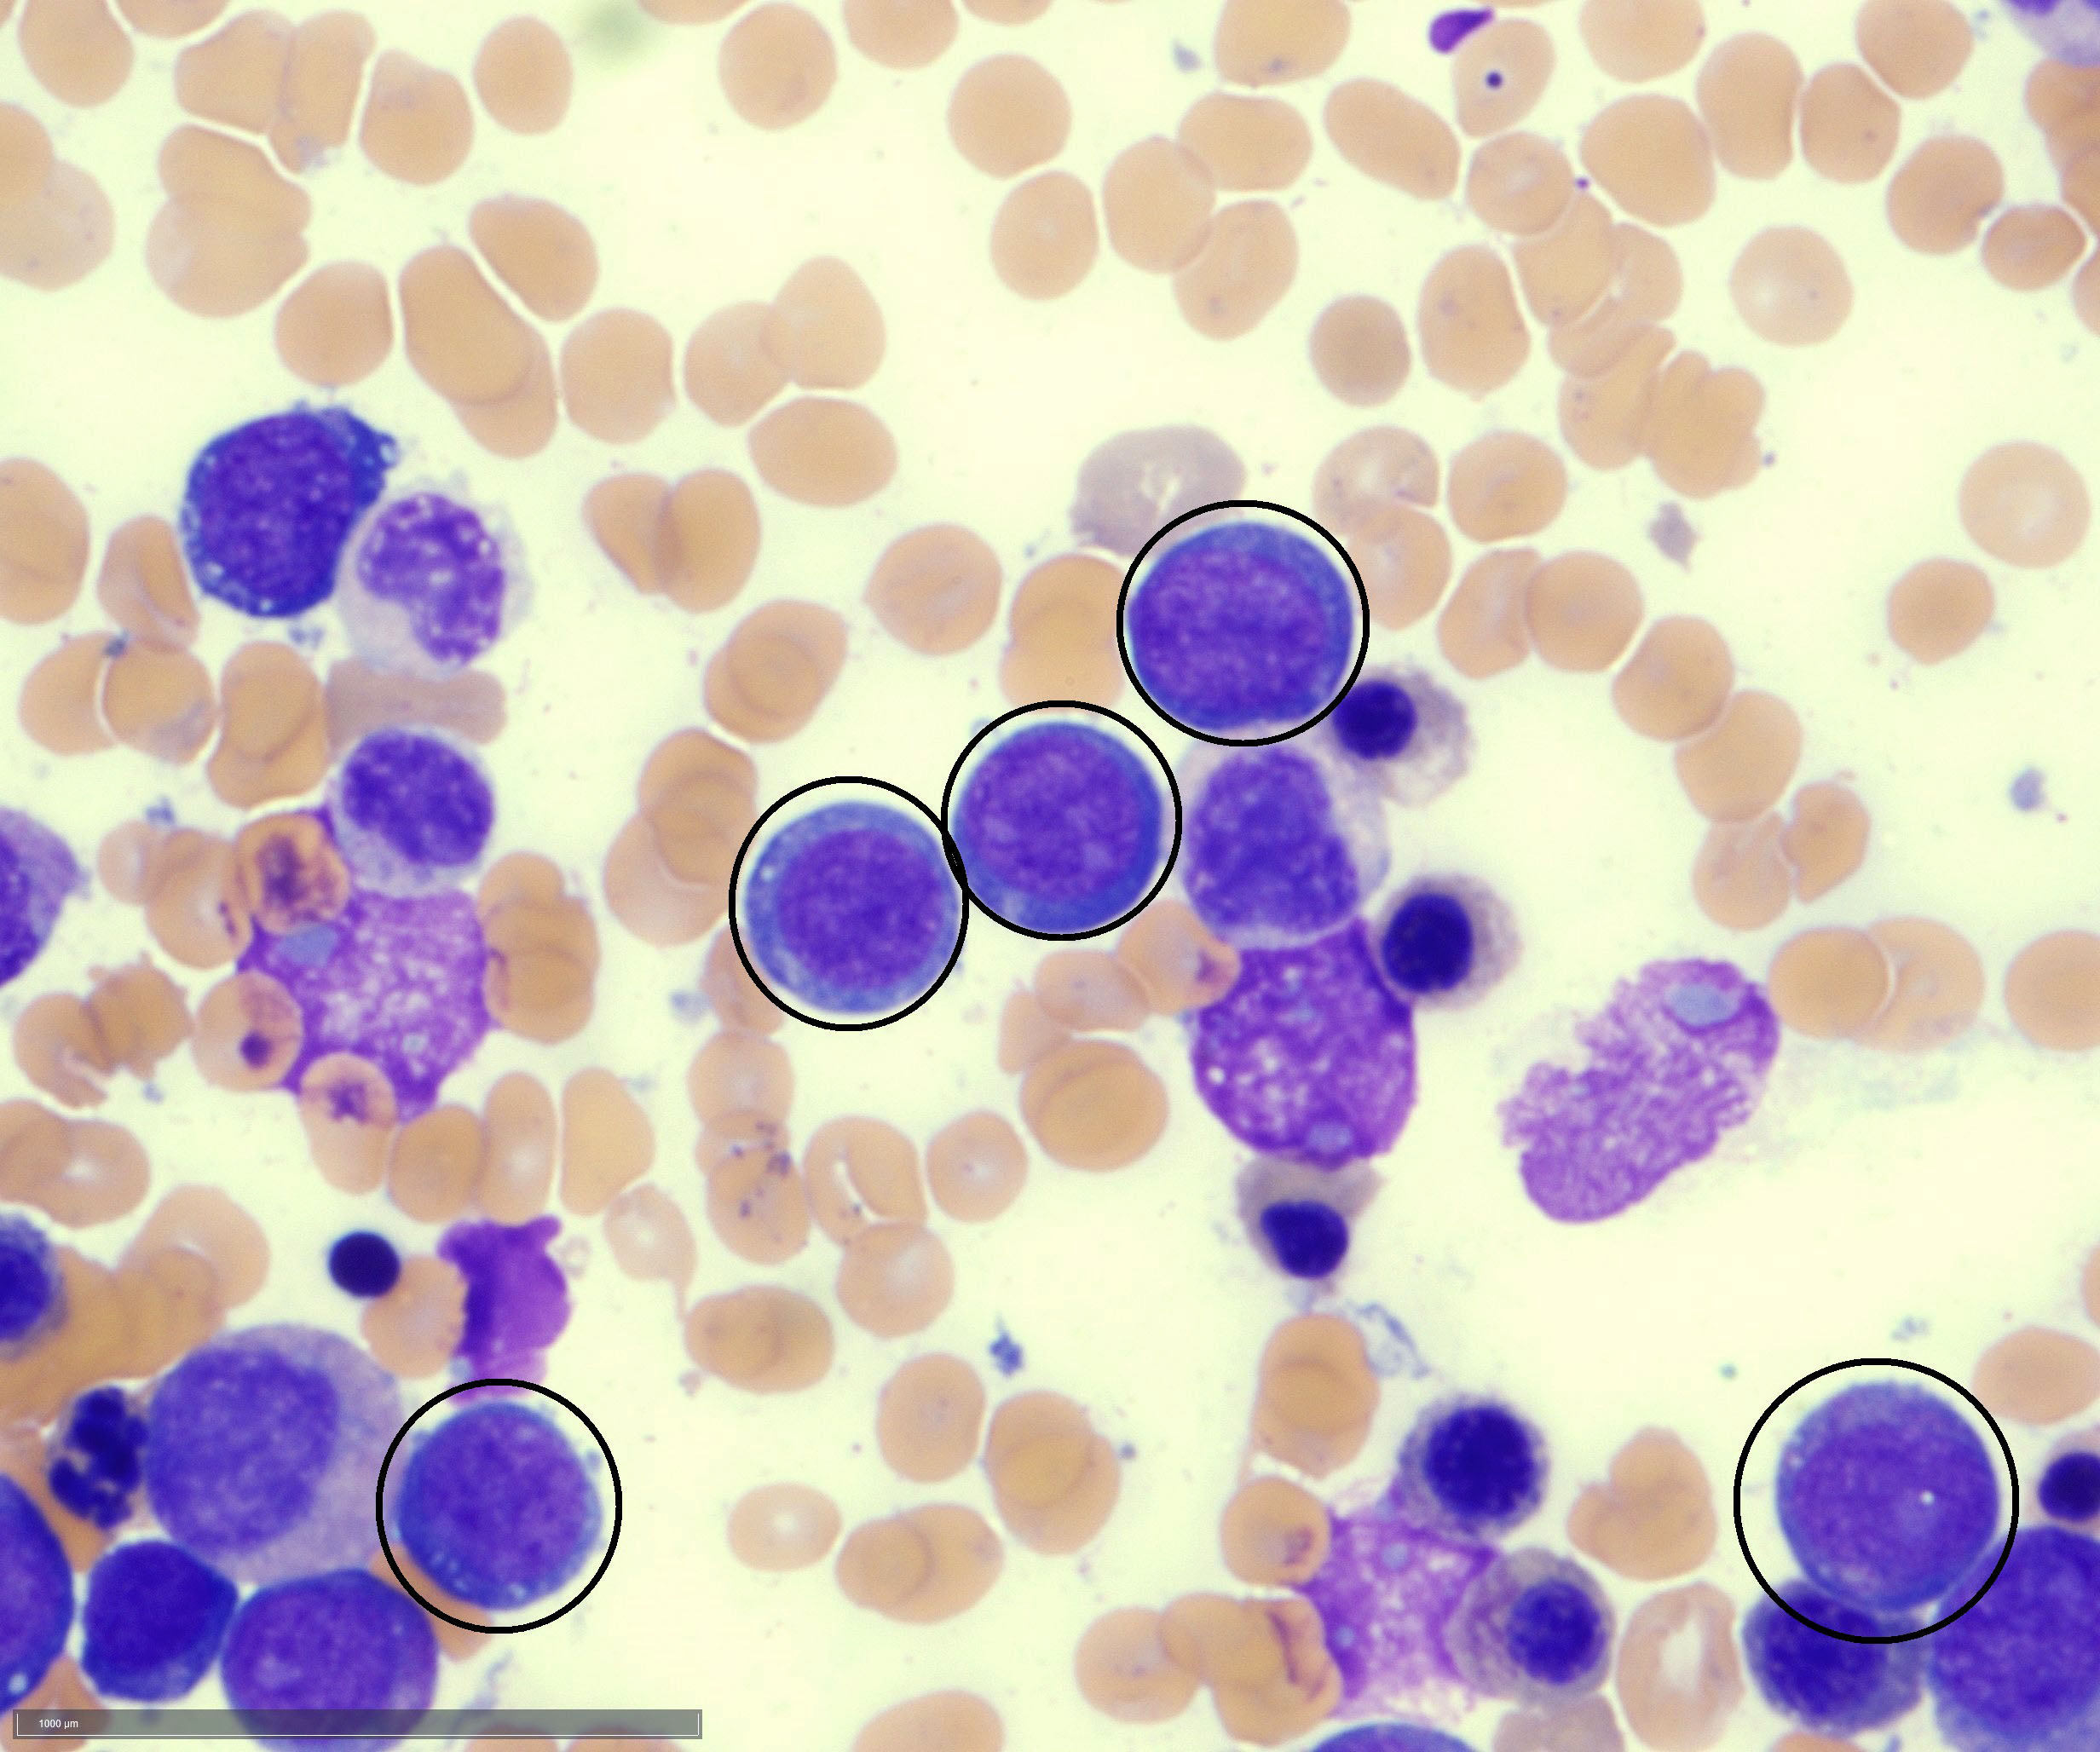
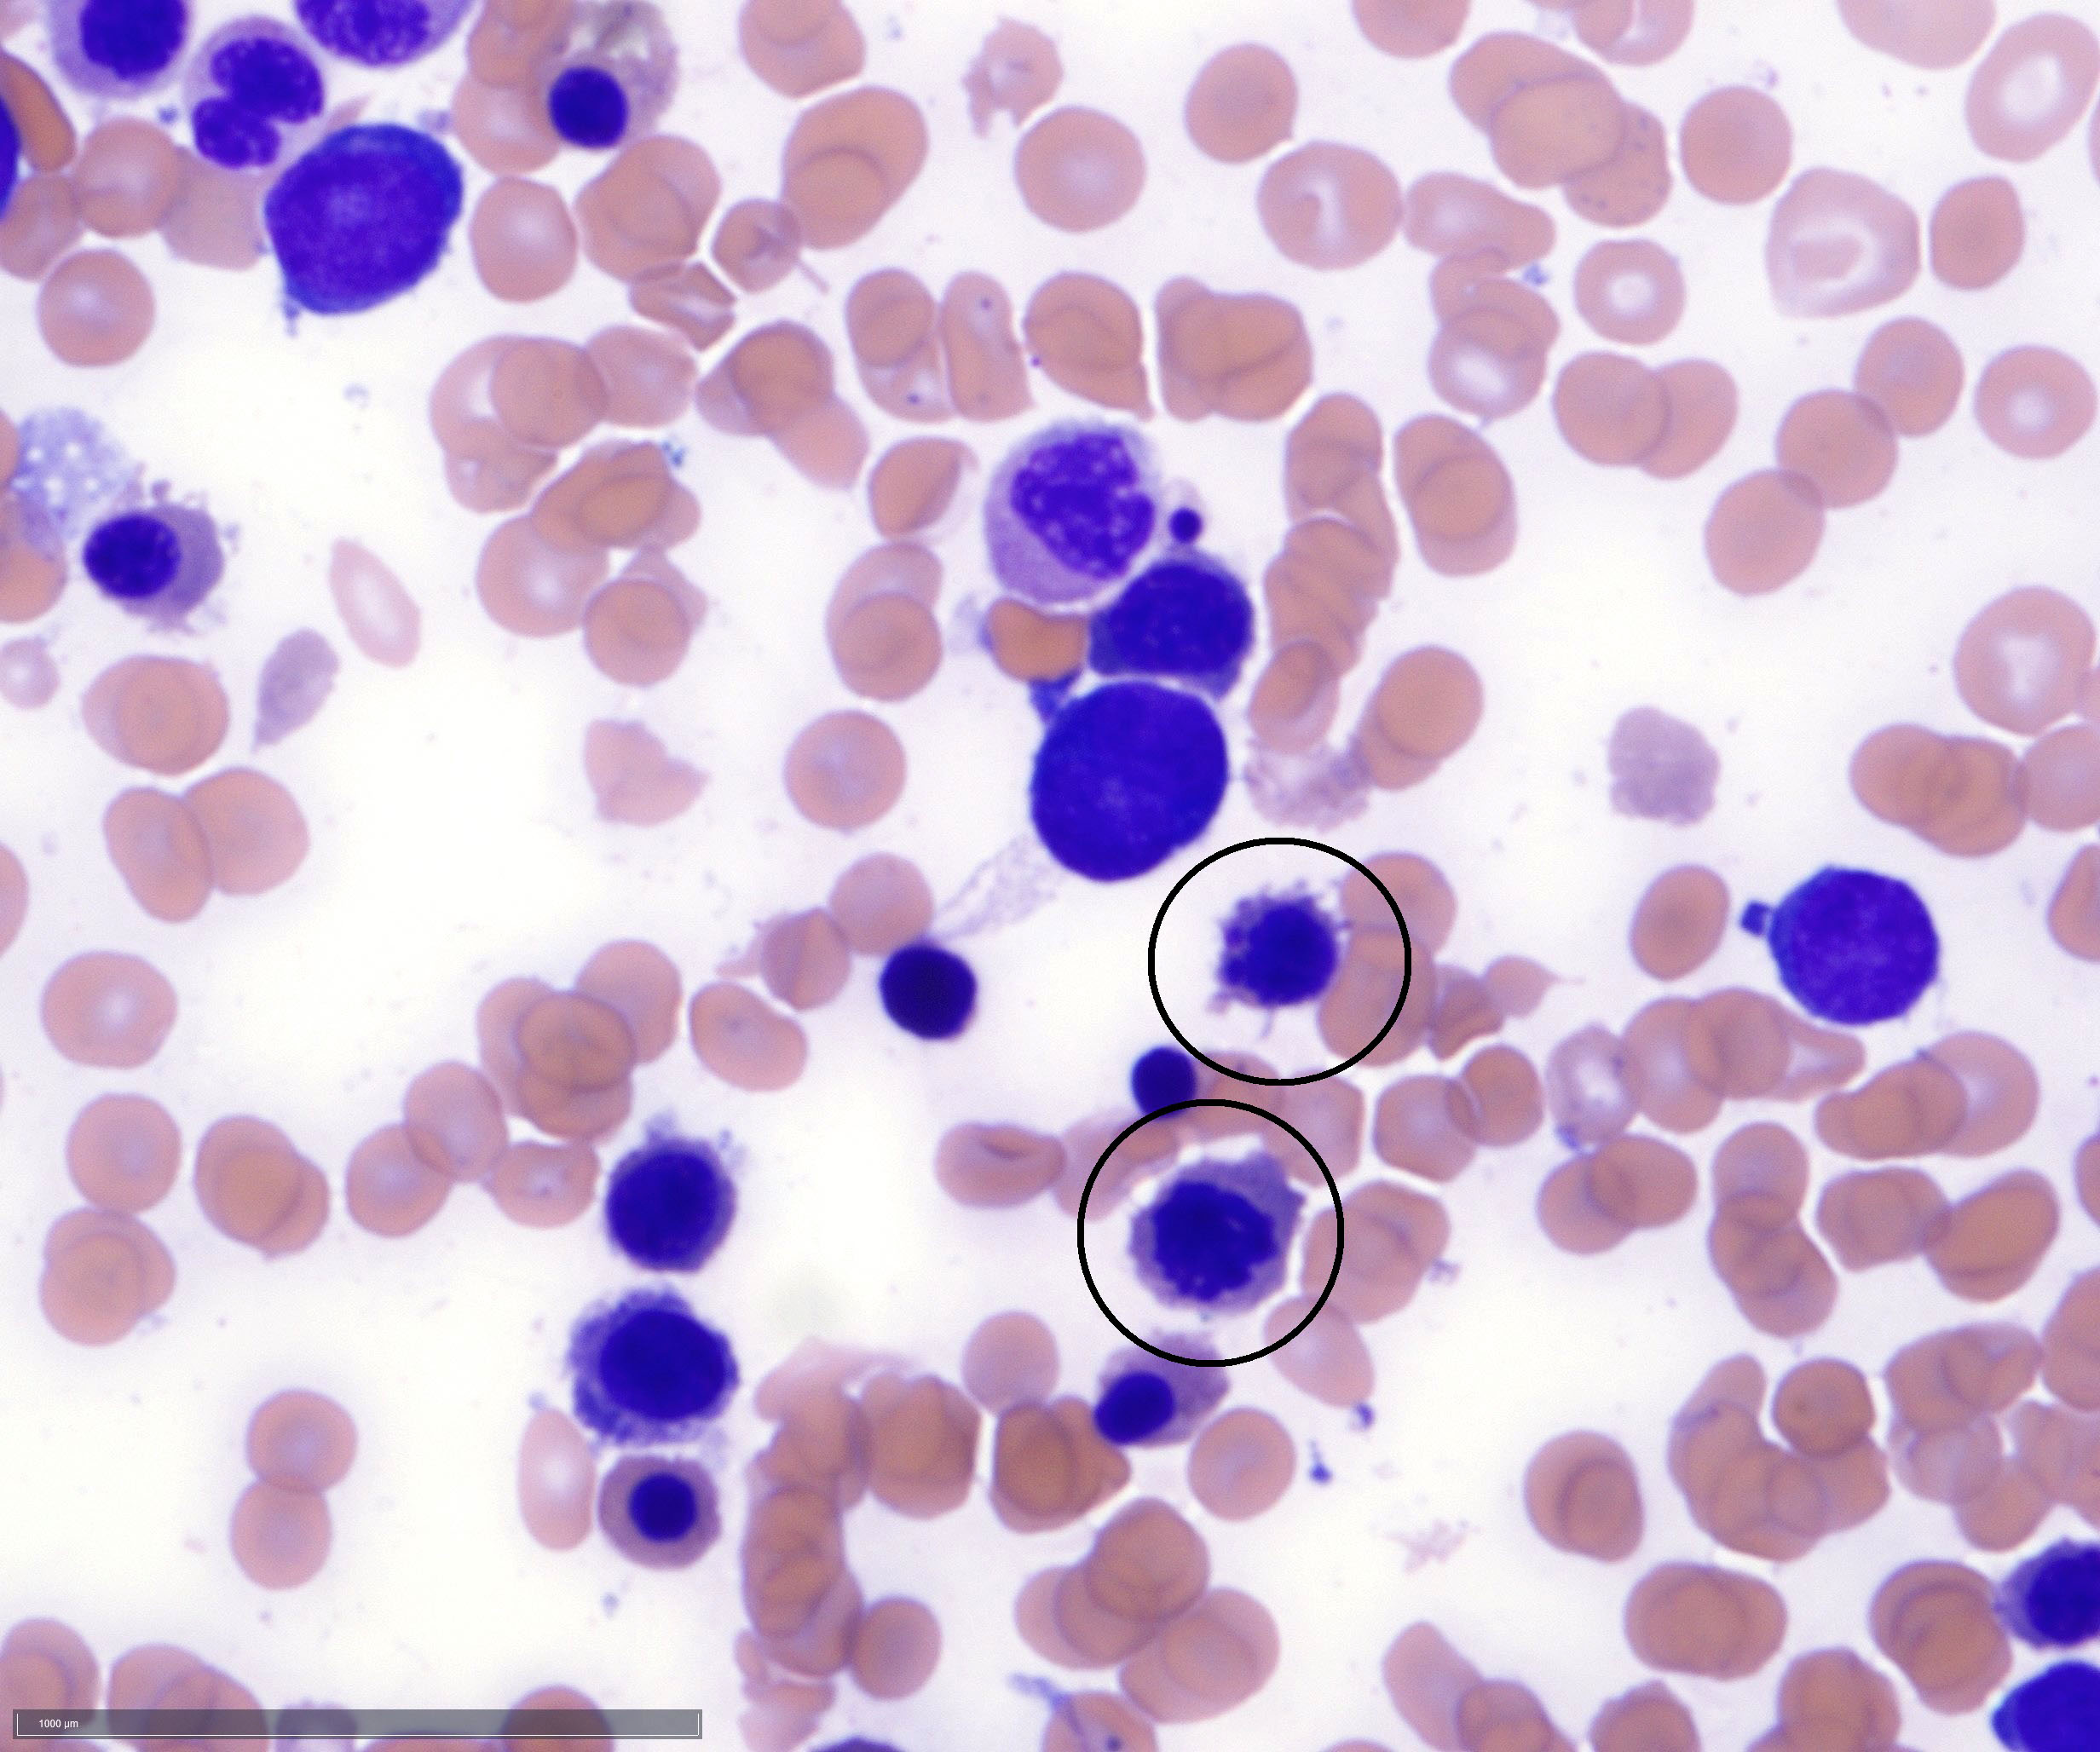
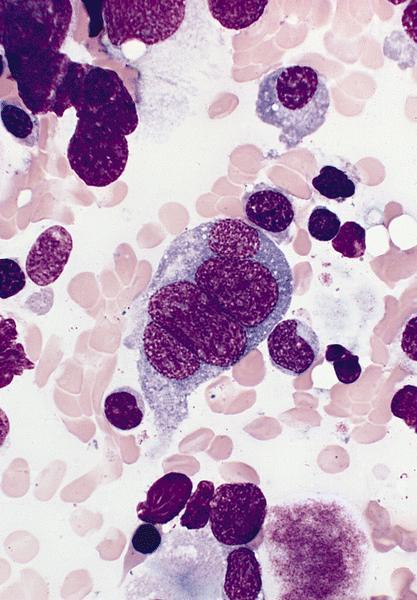
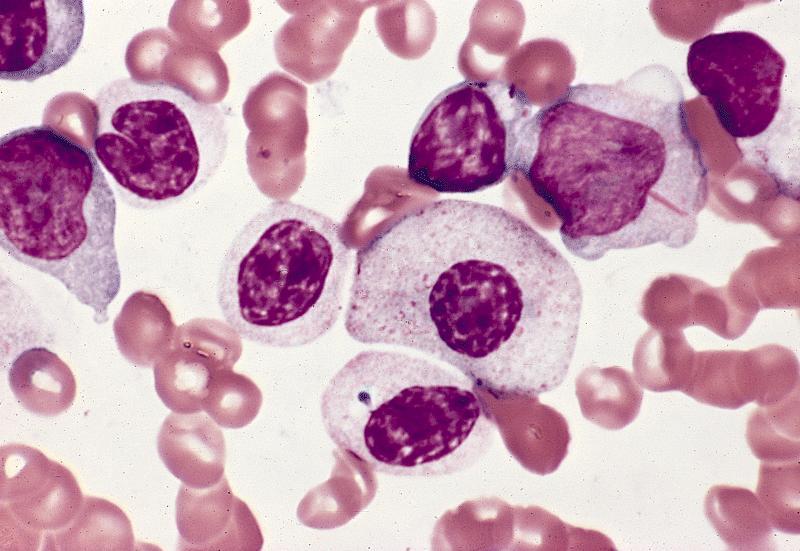
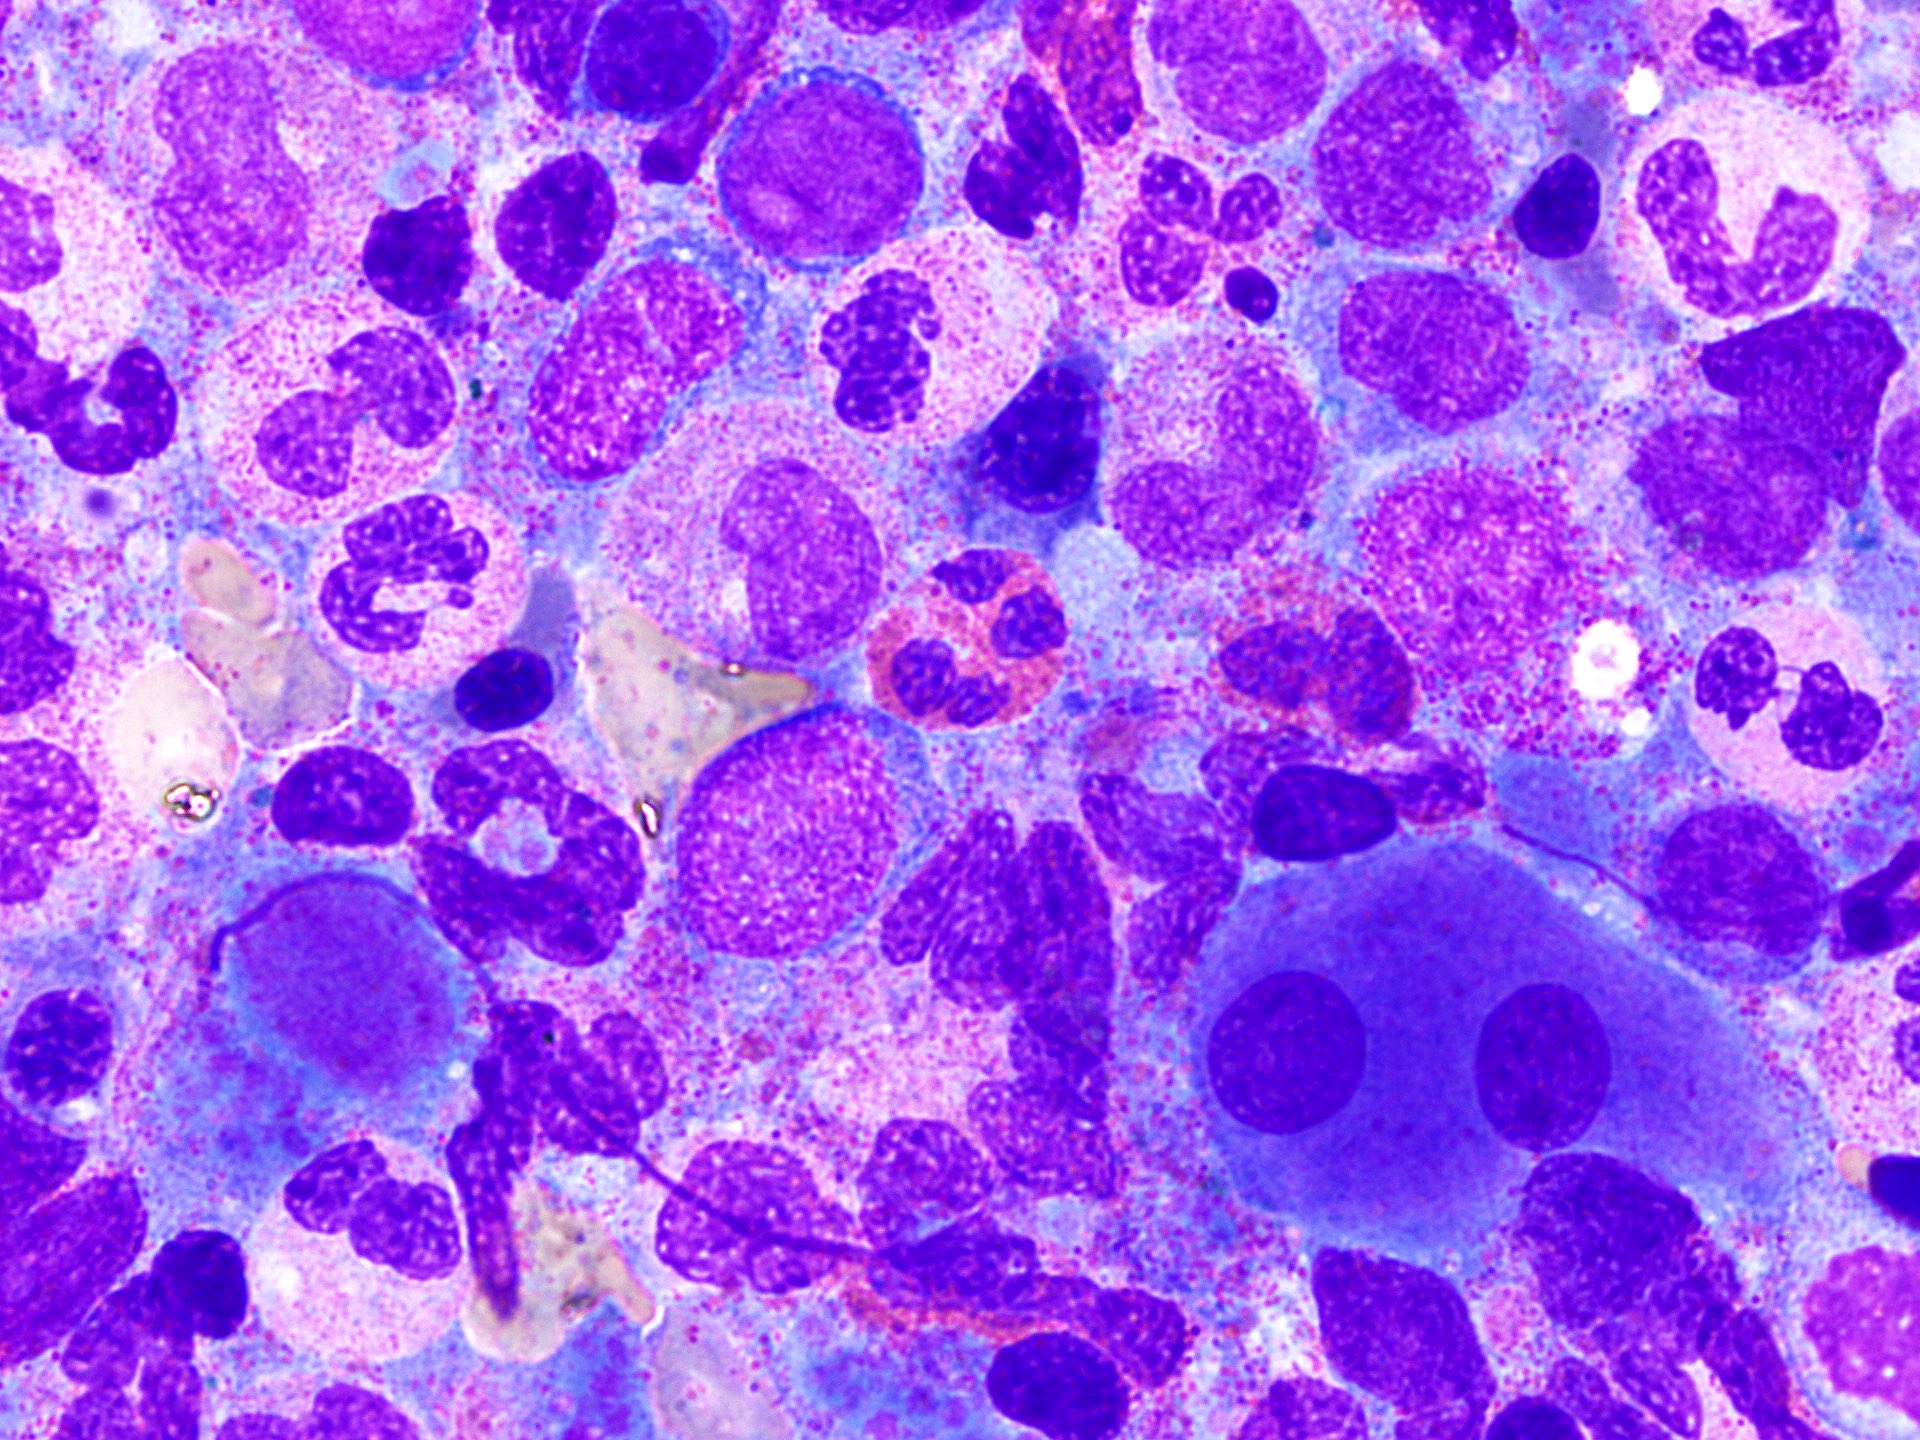
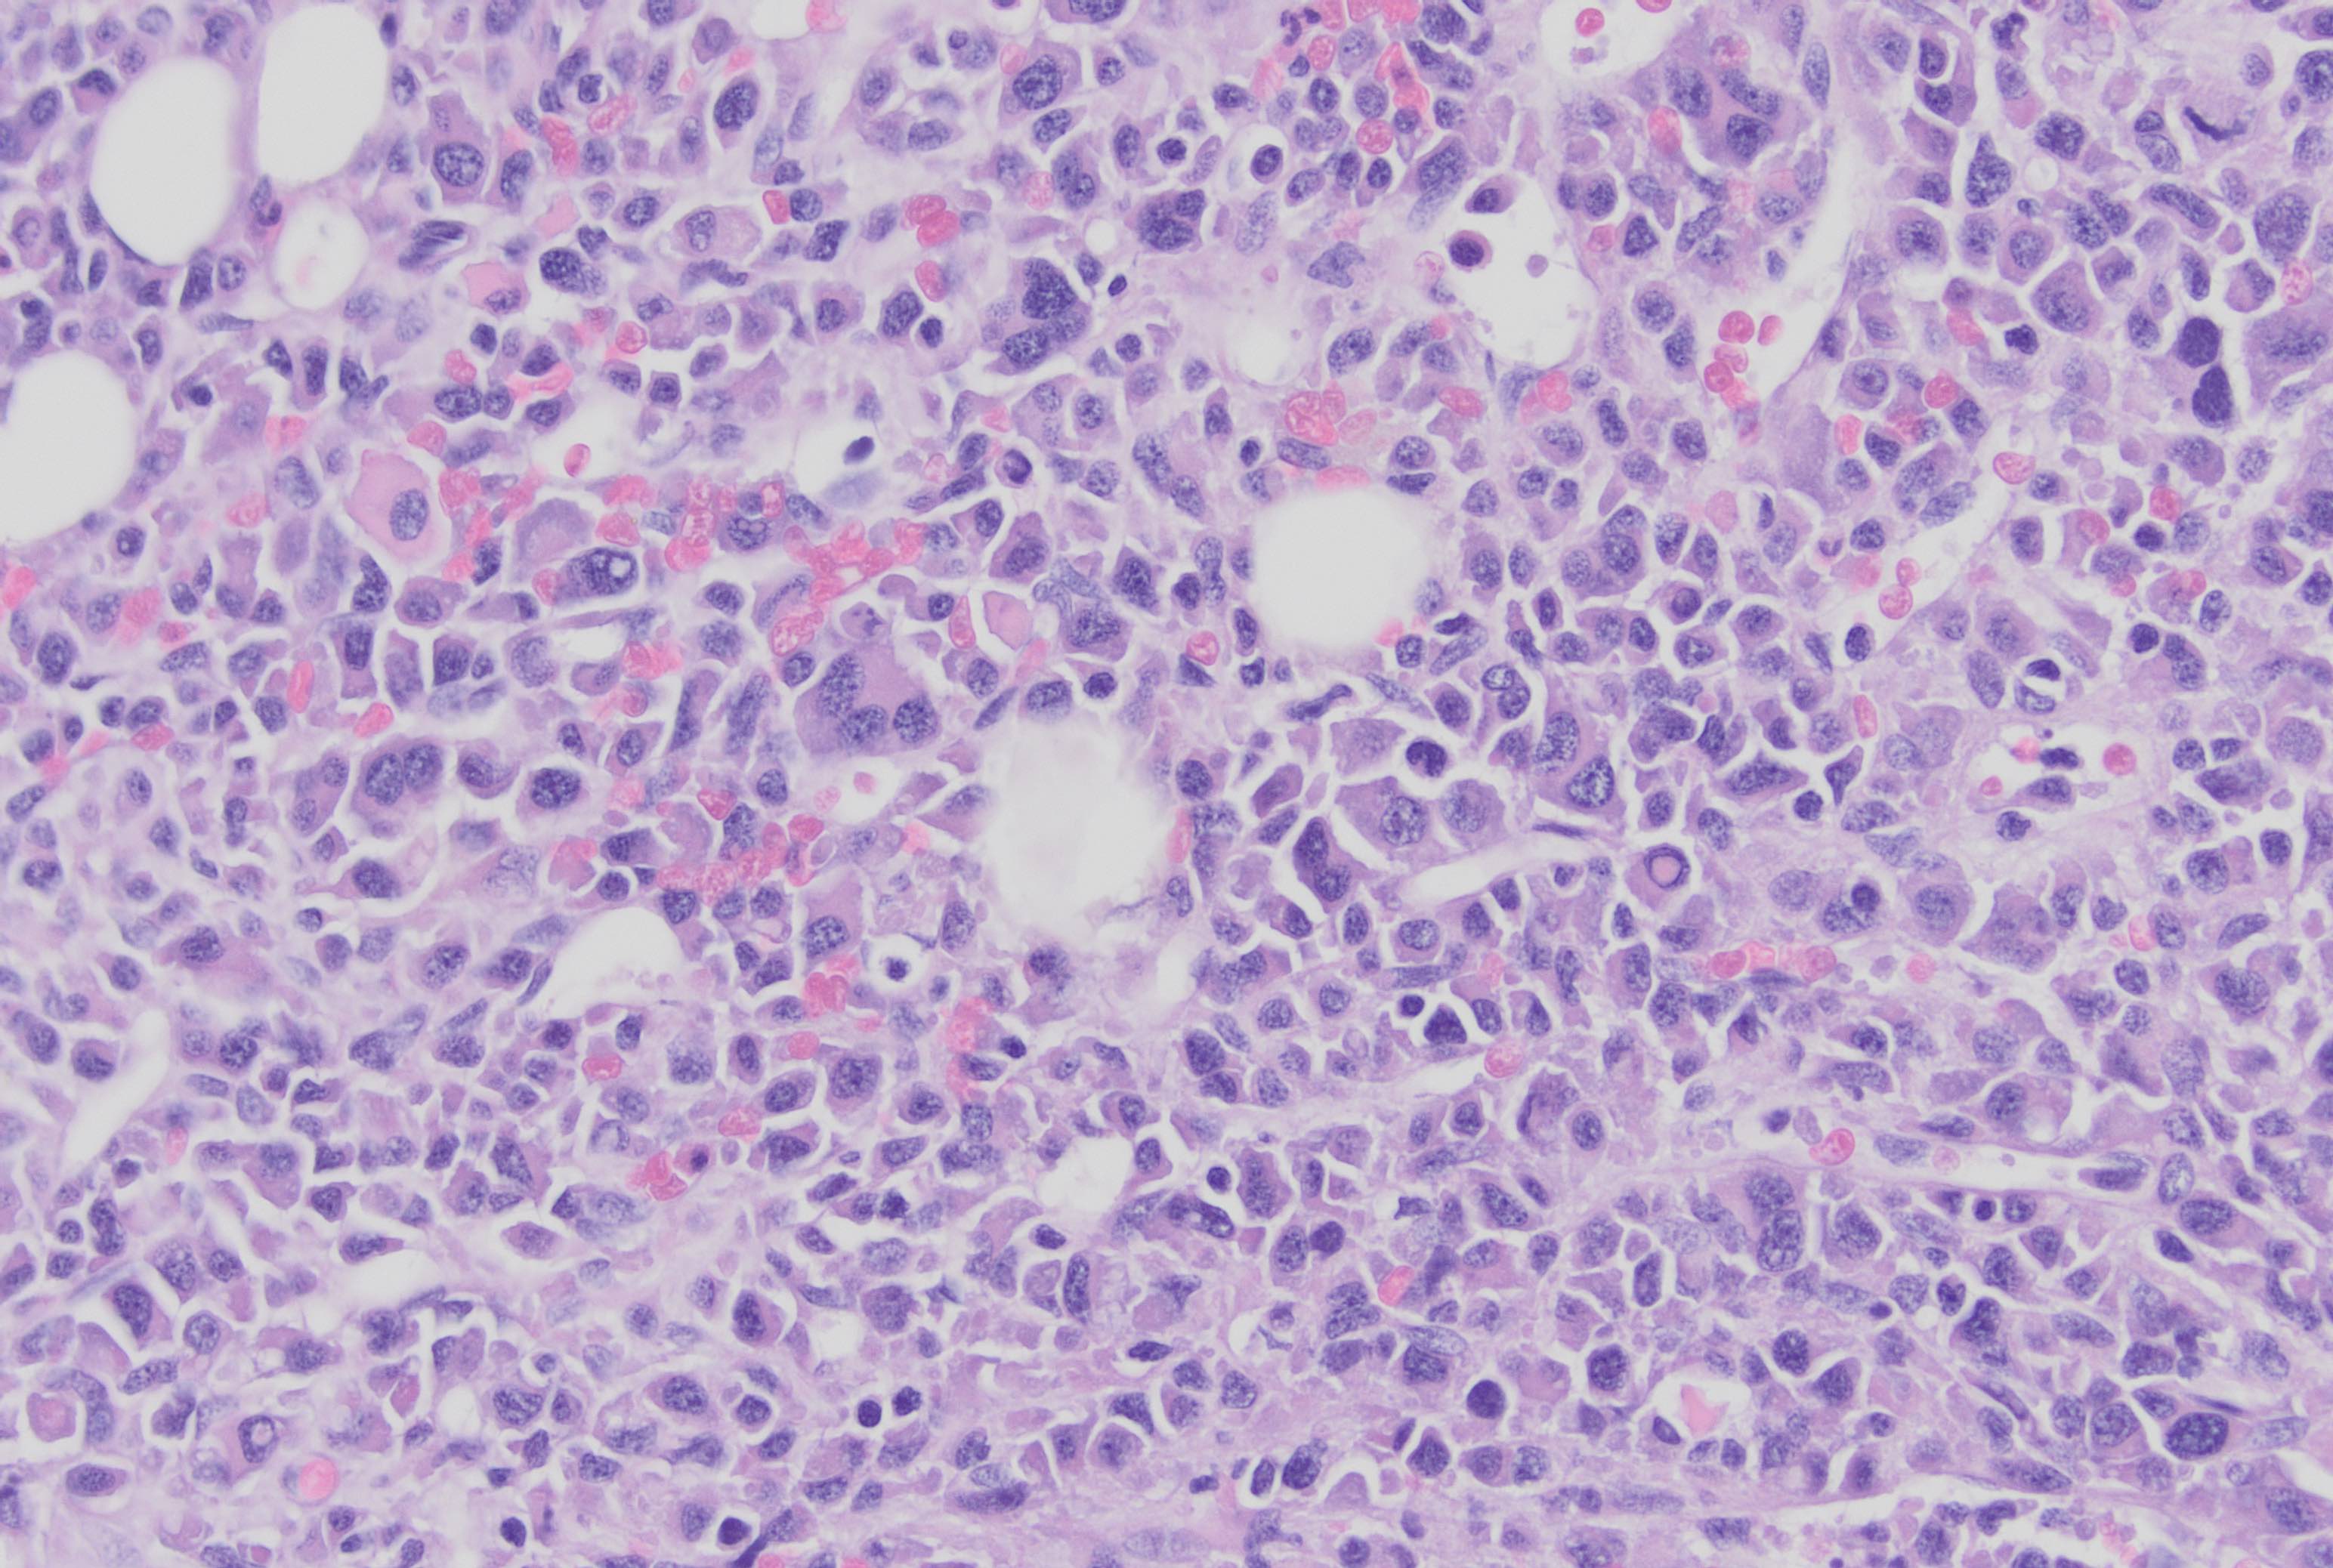
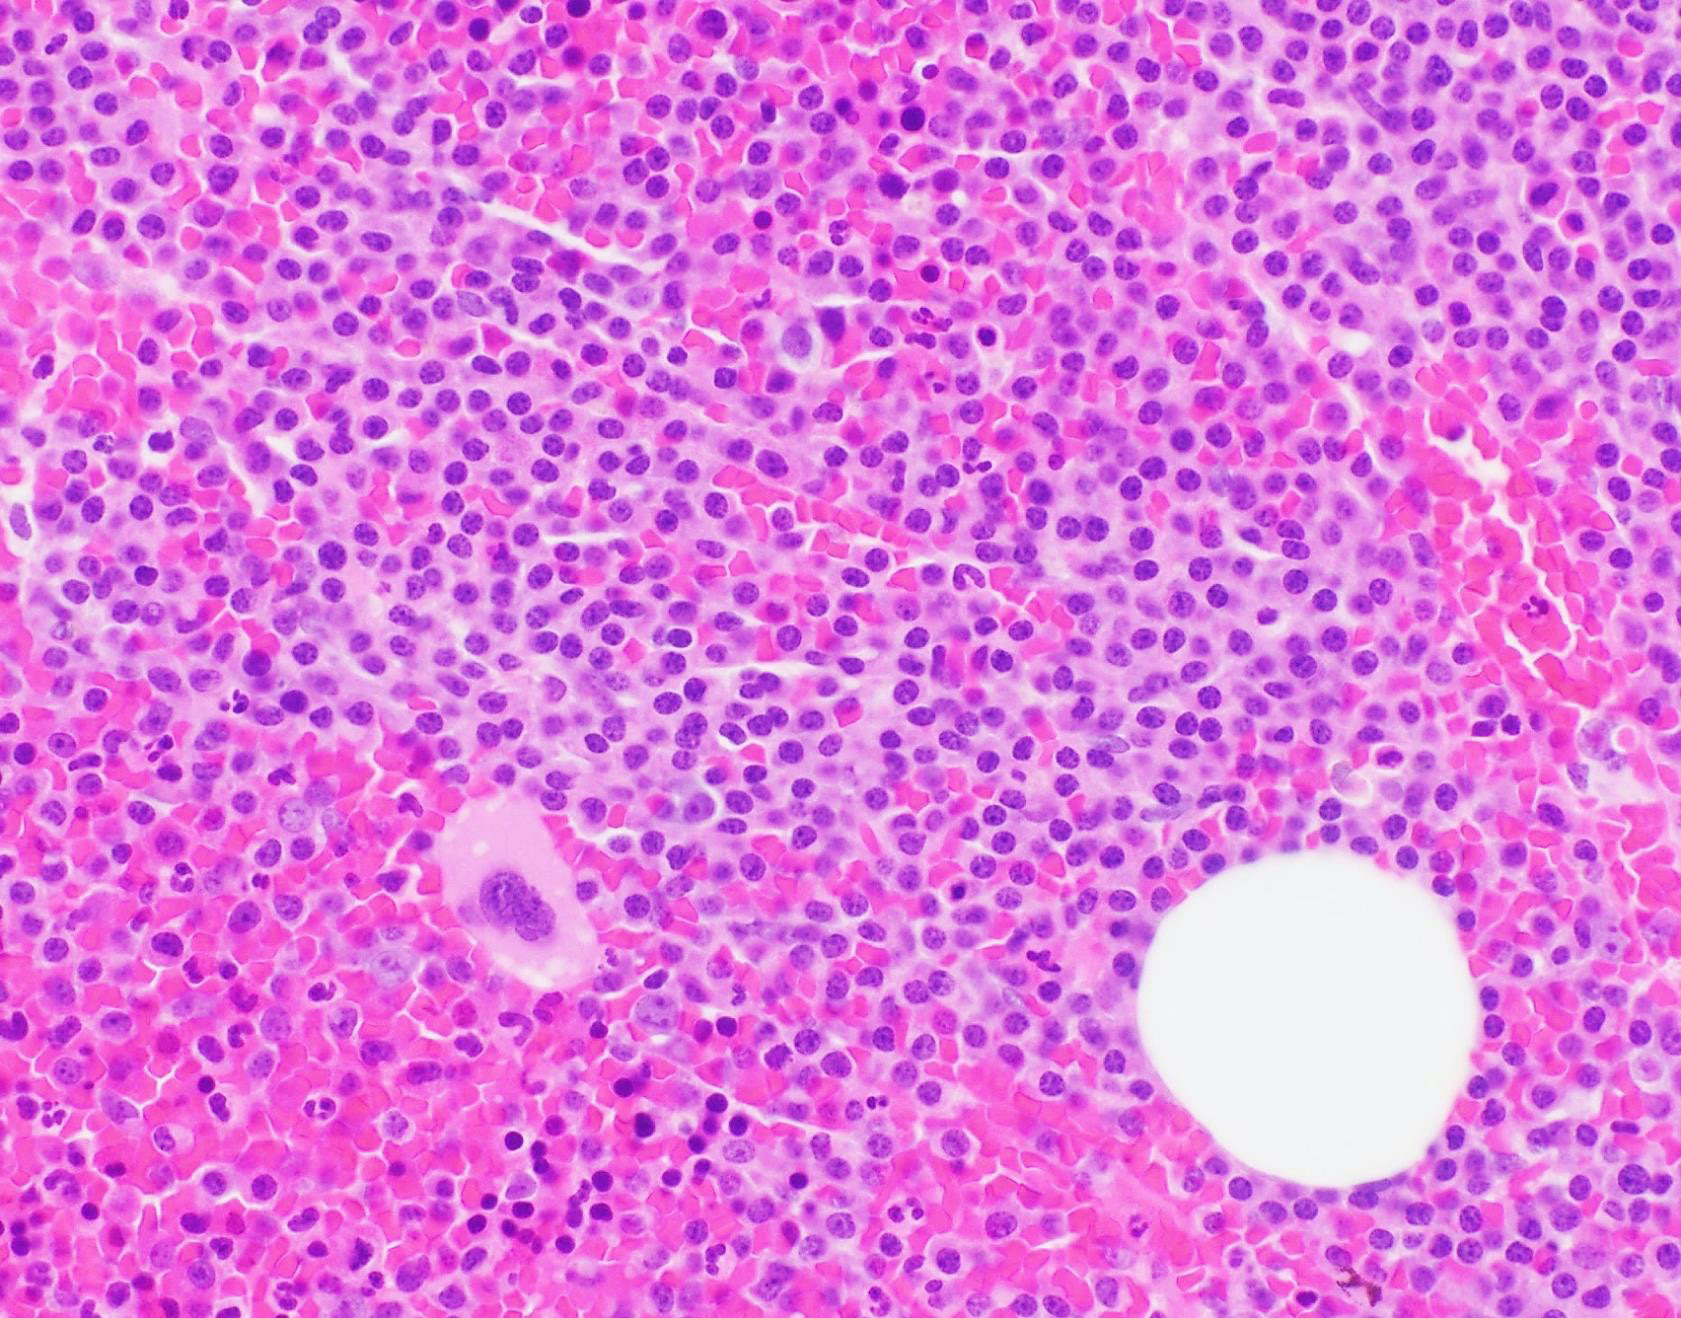
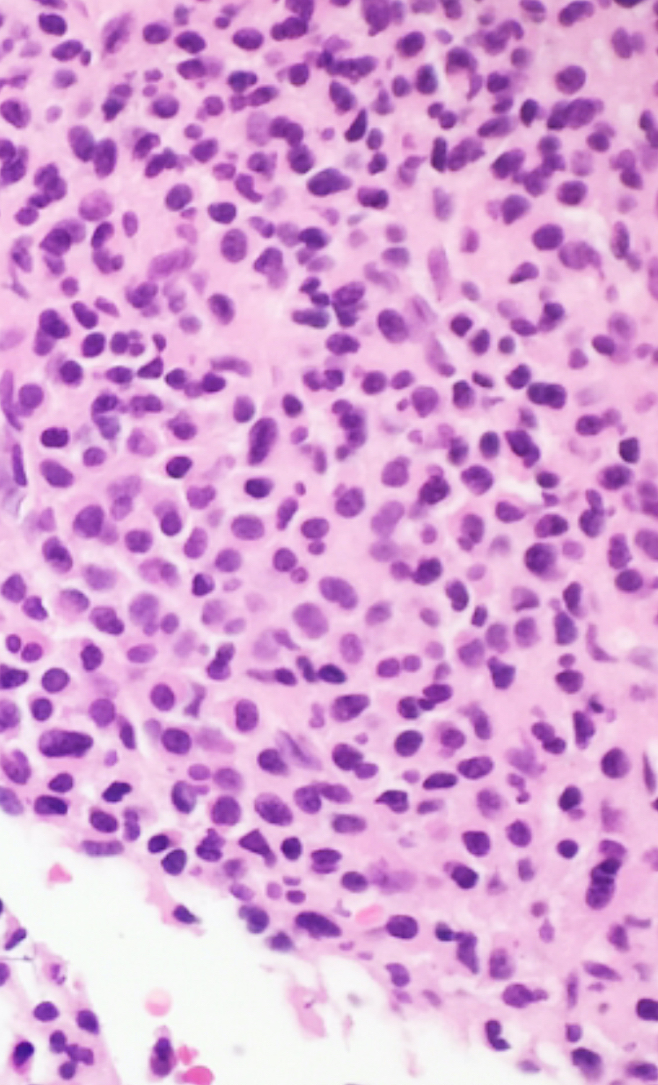
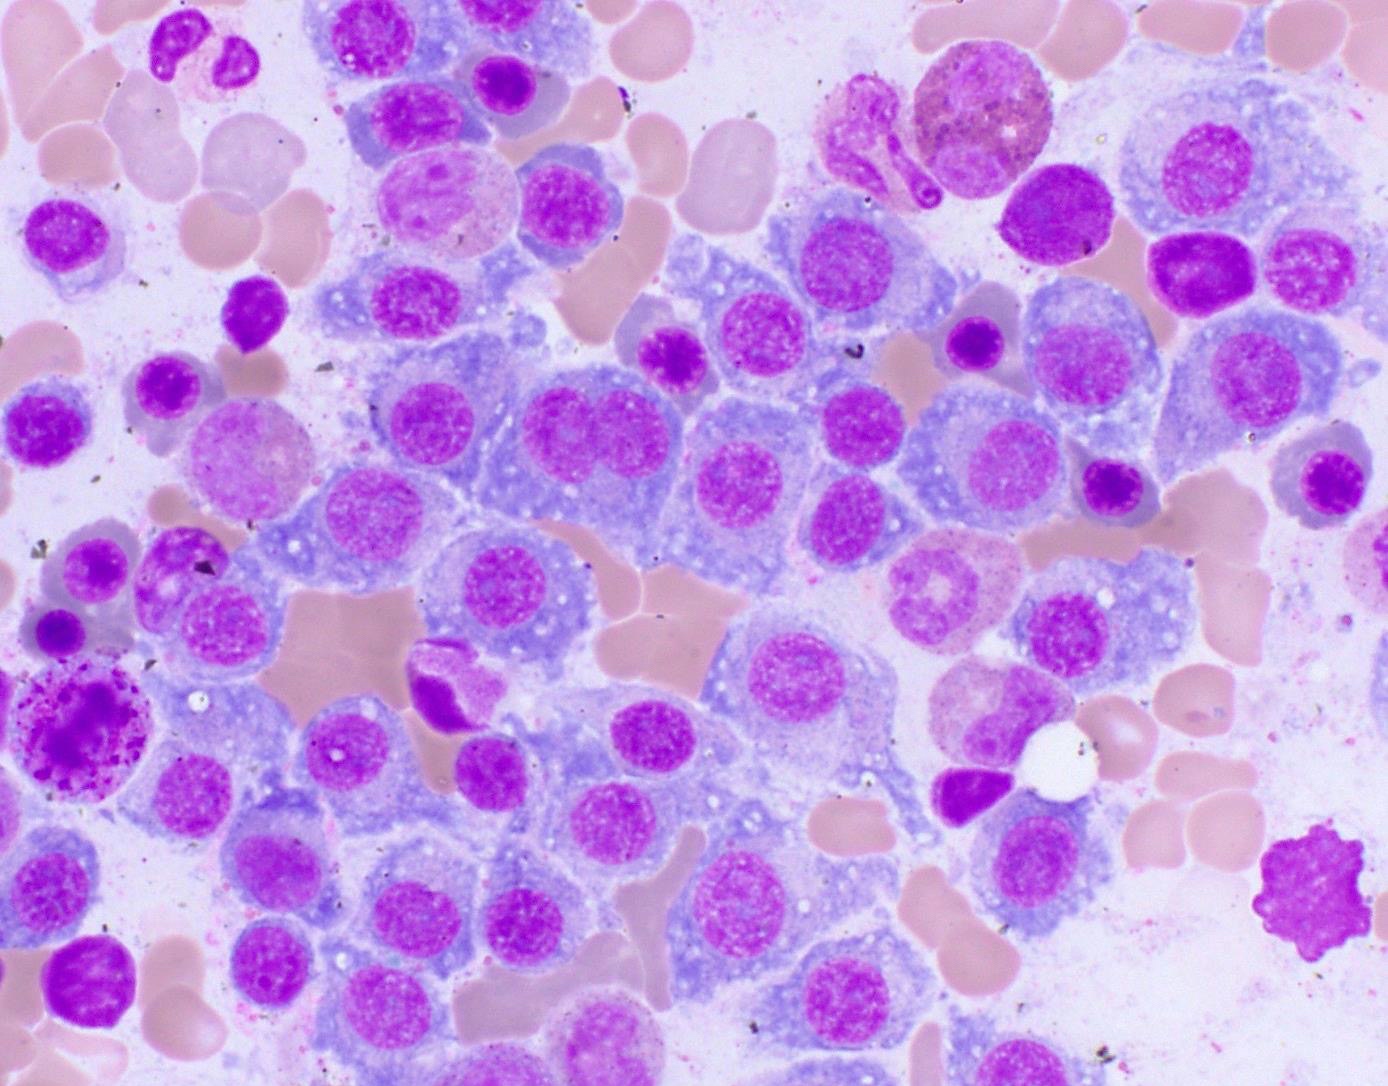
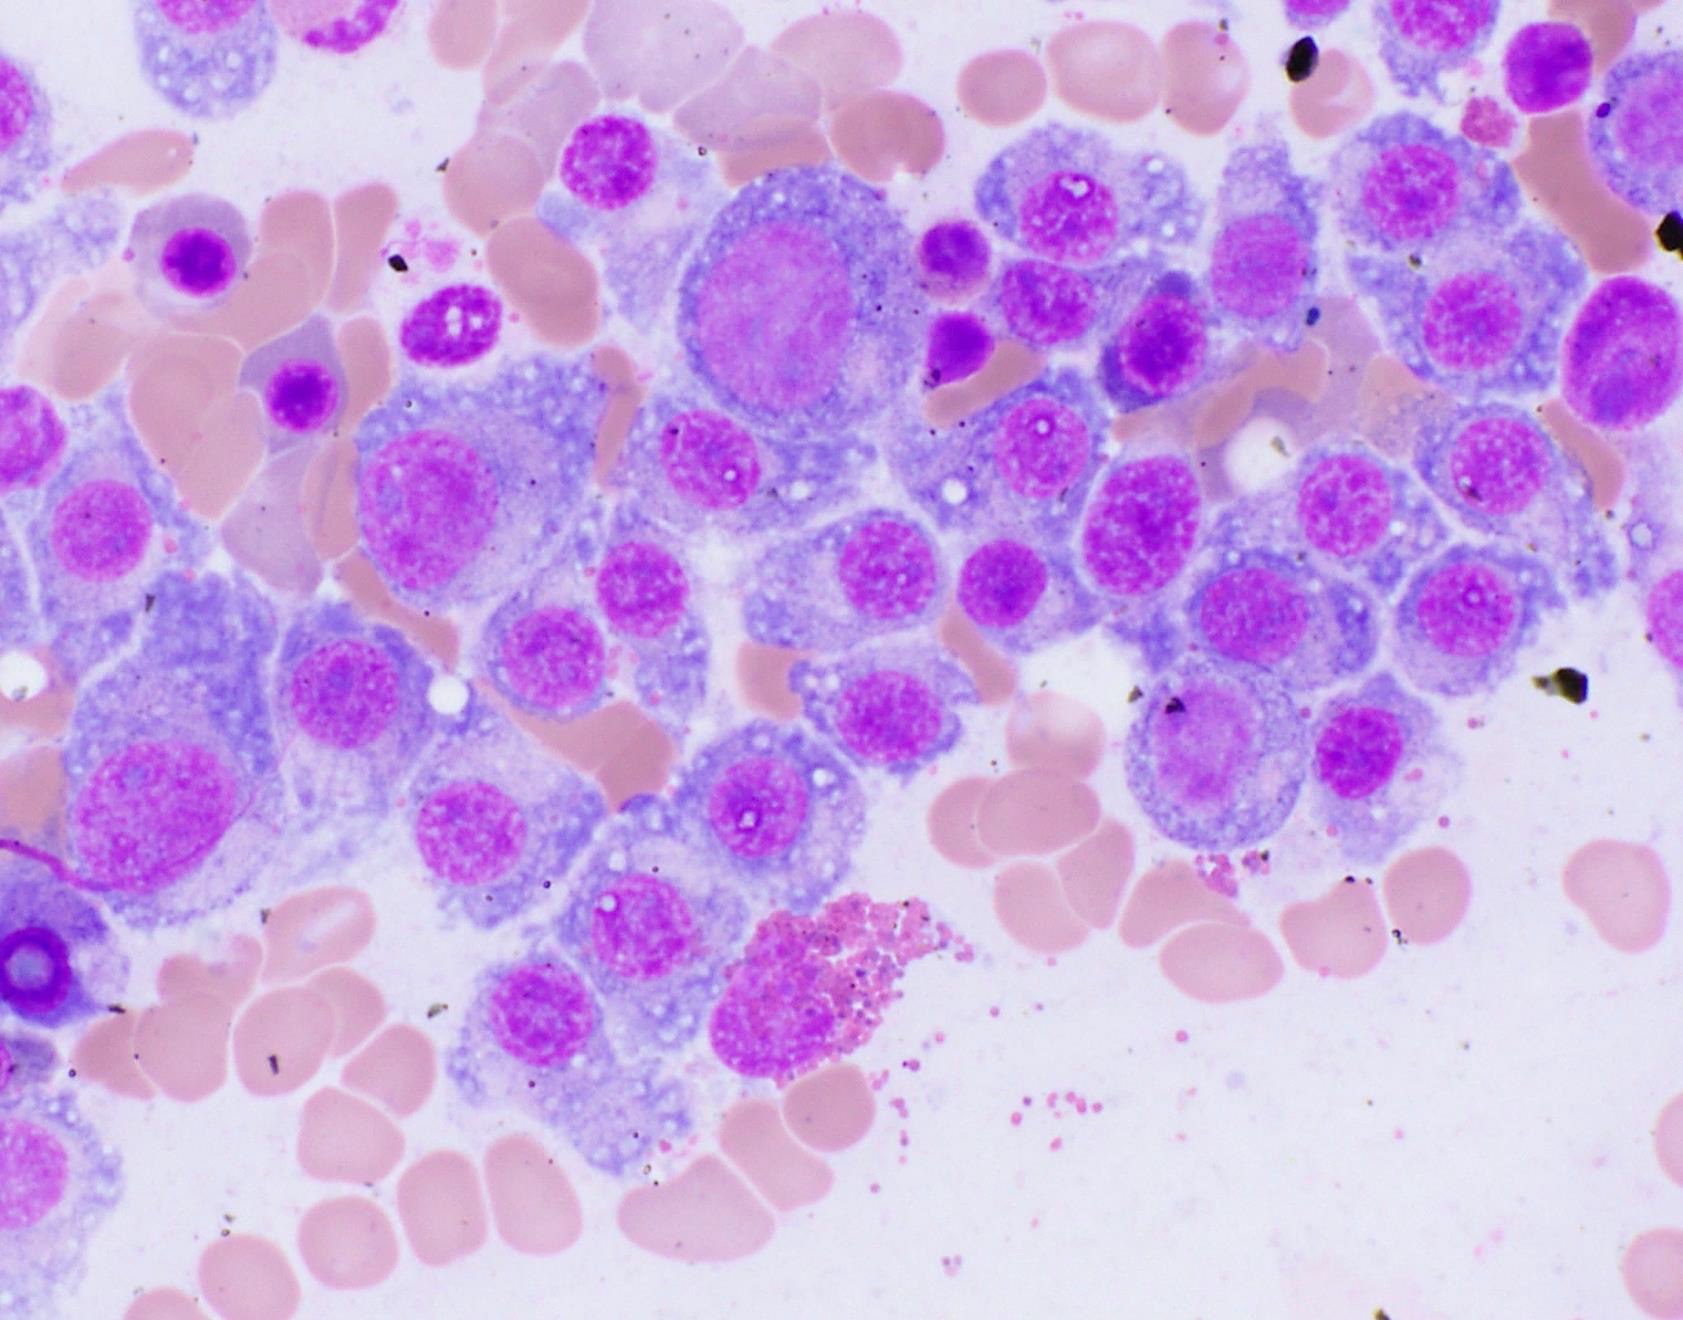
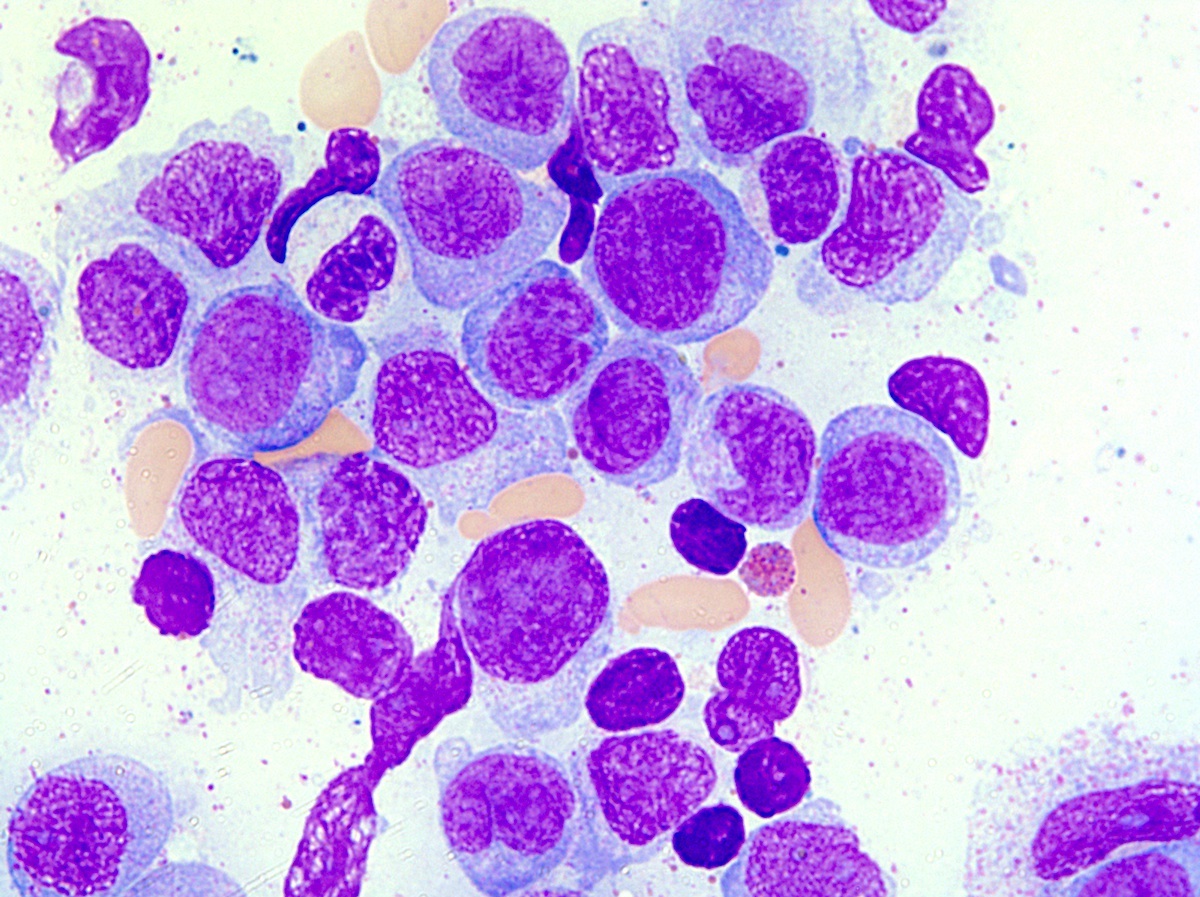
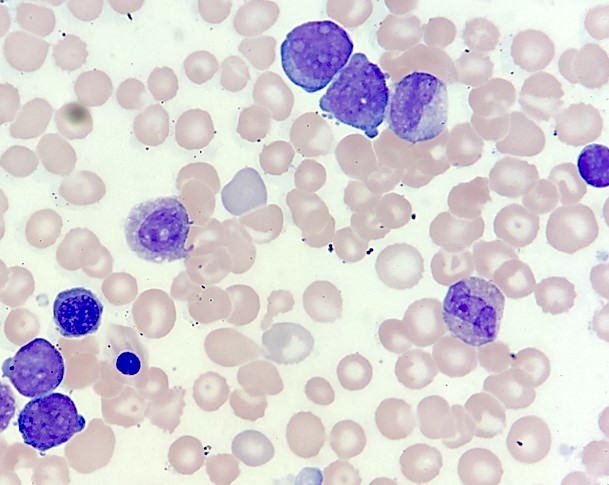
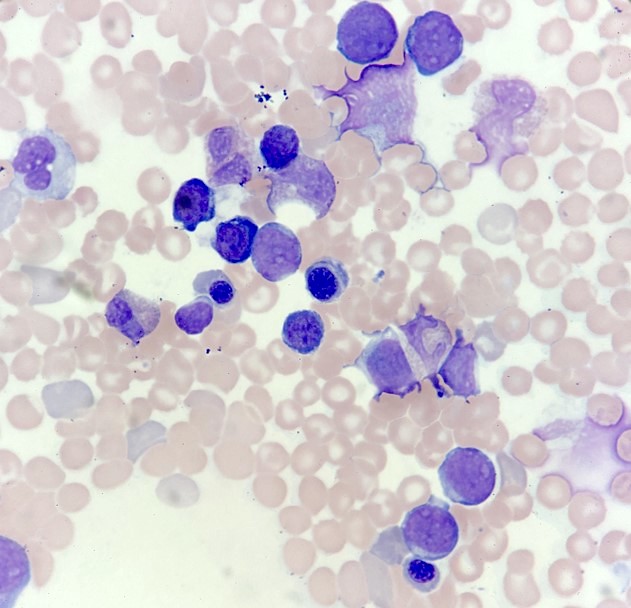
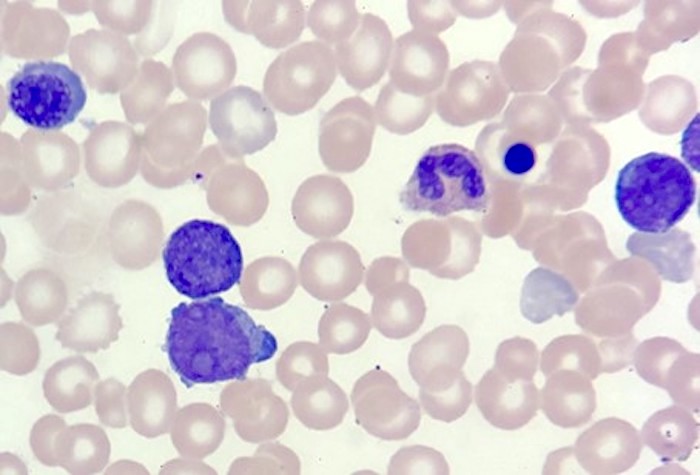
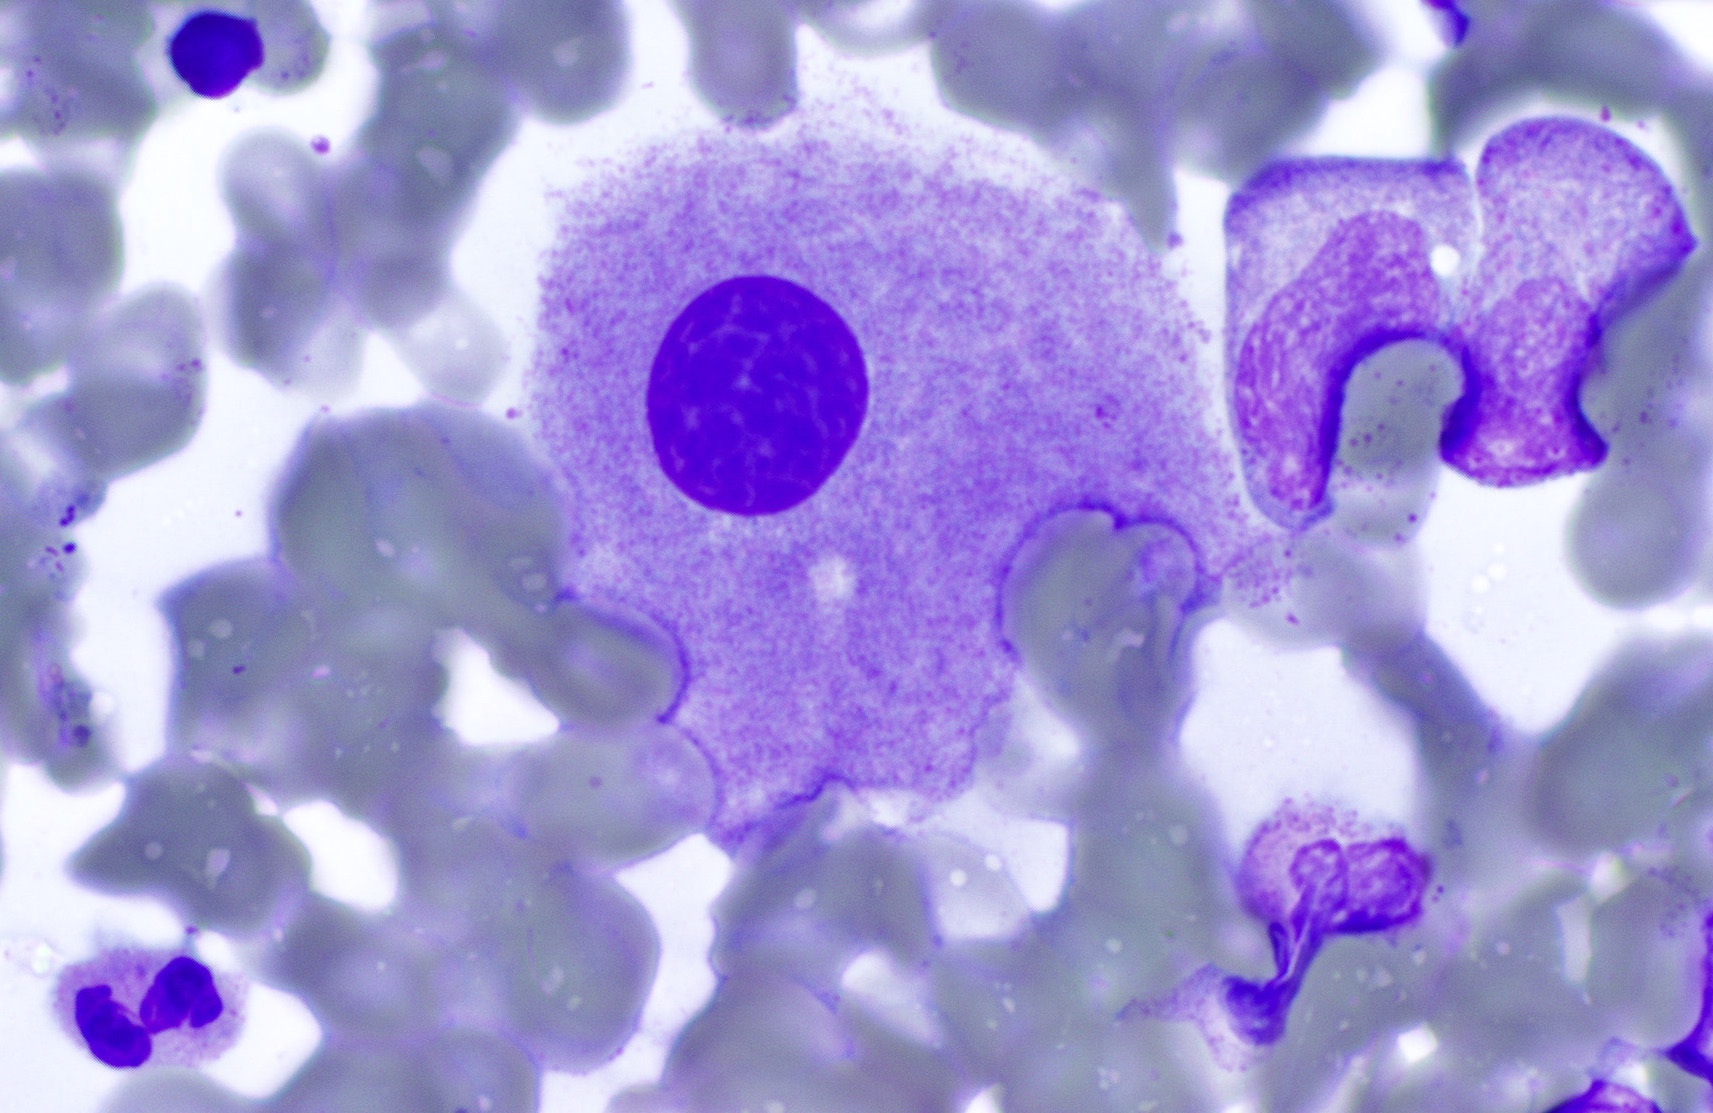
Abundant cytoplasm
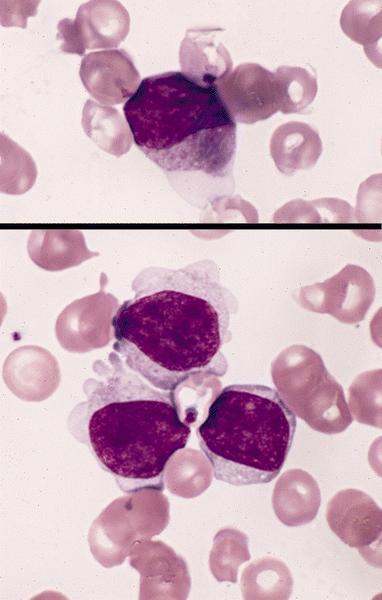
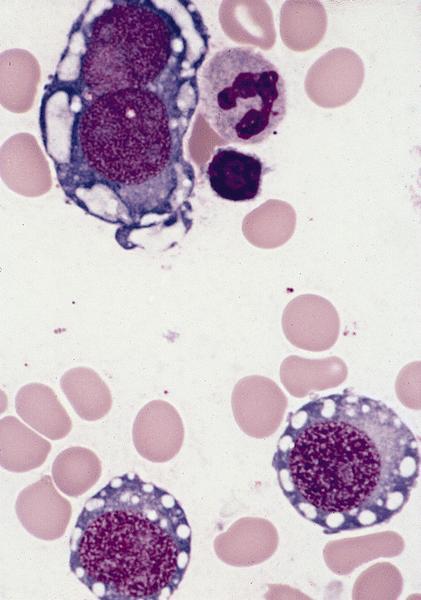
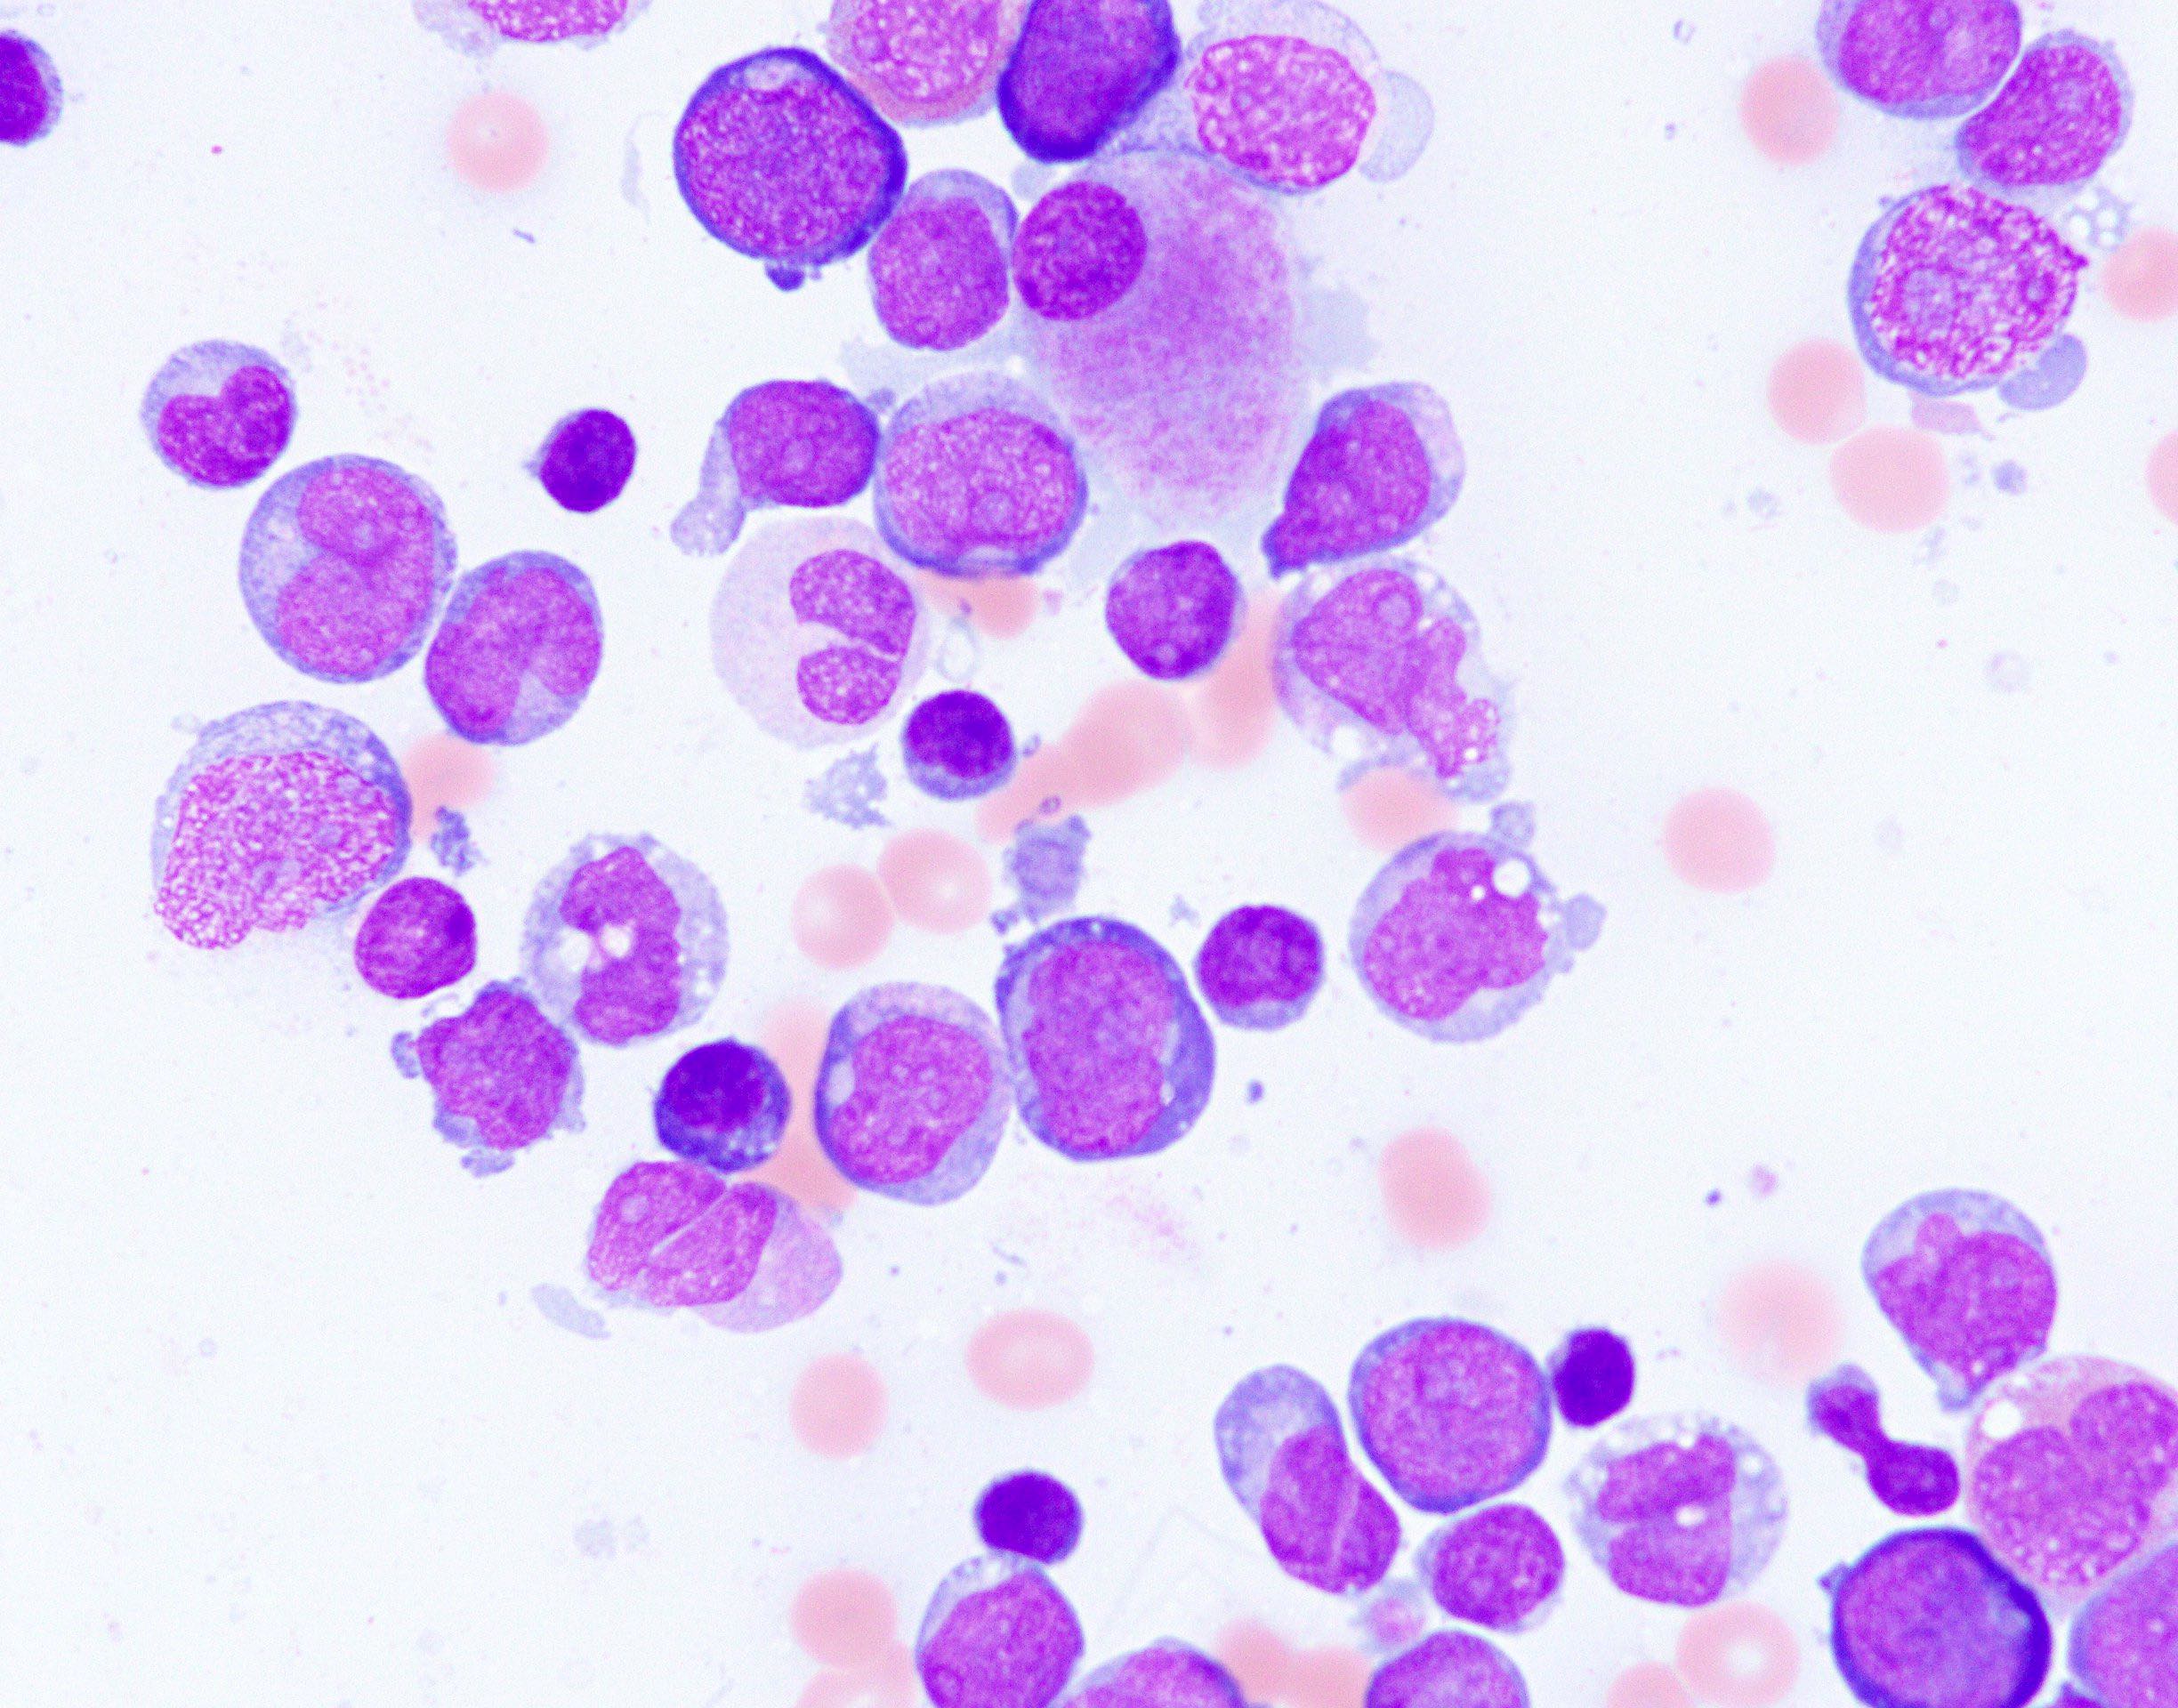
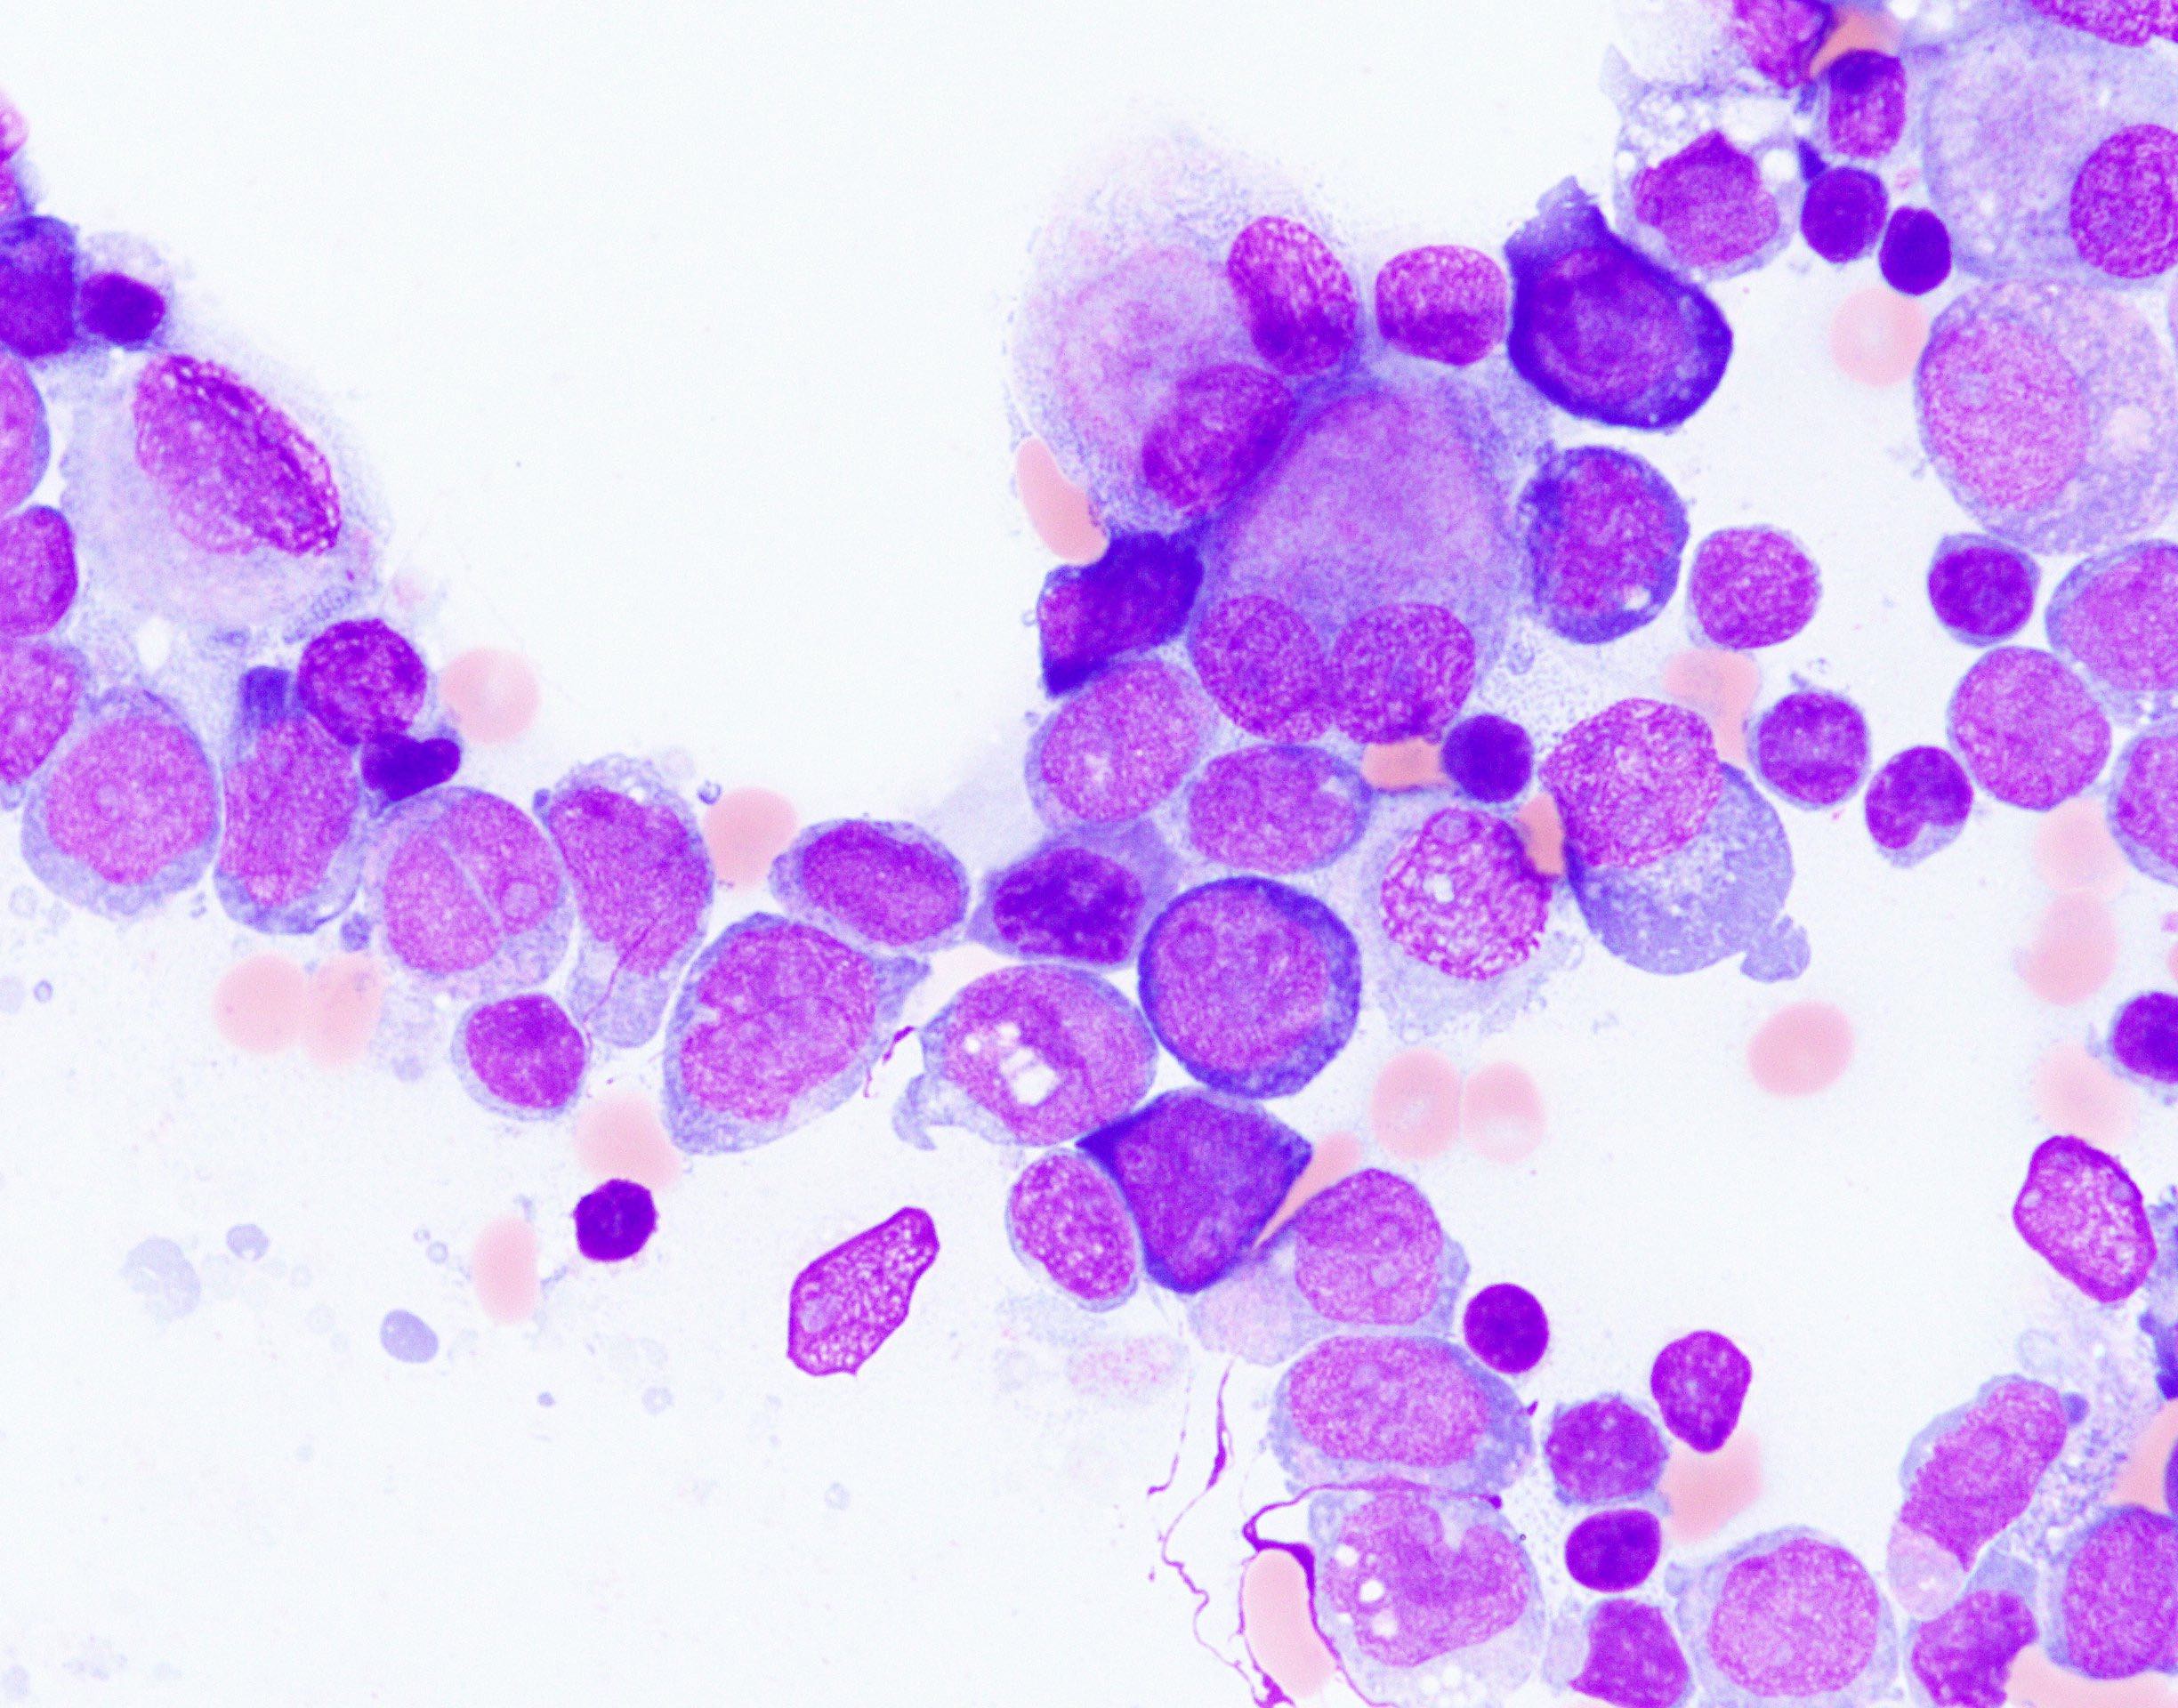
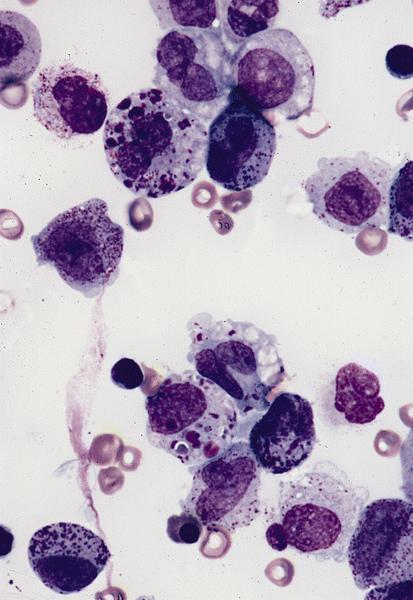
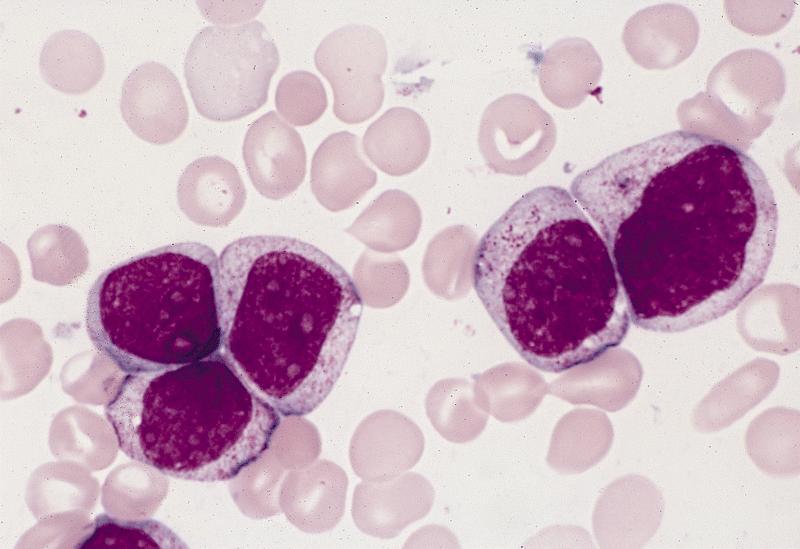
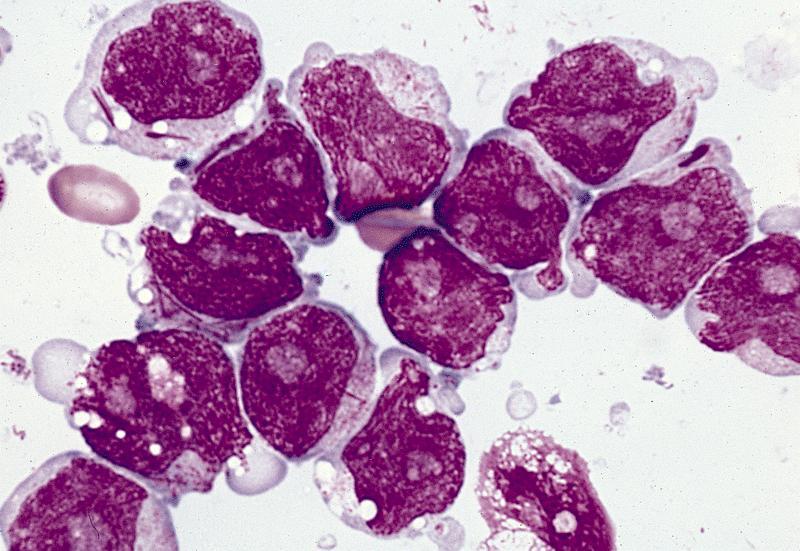
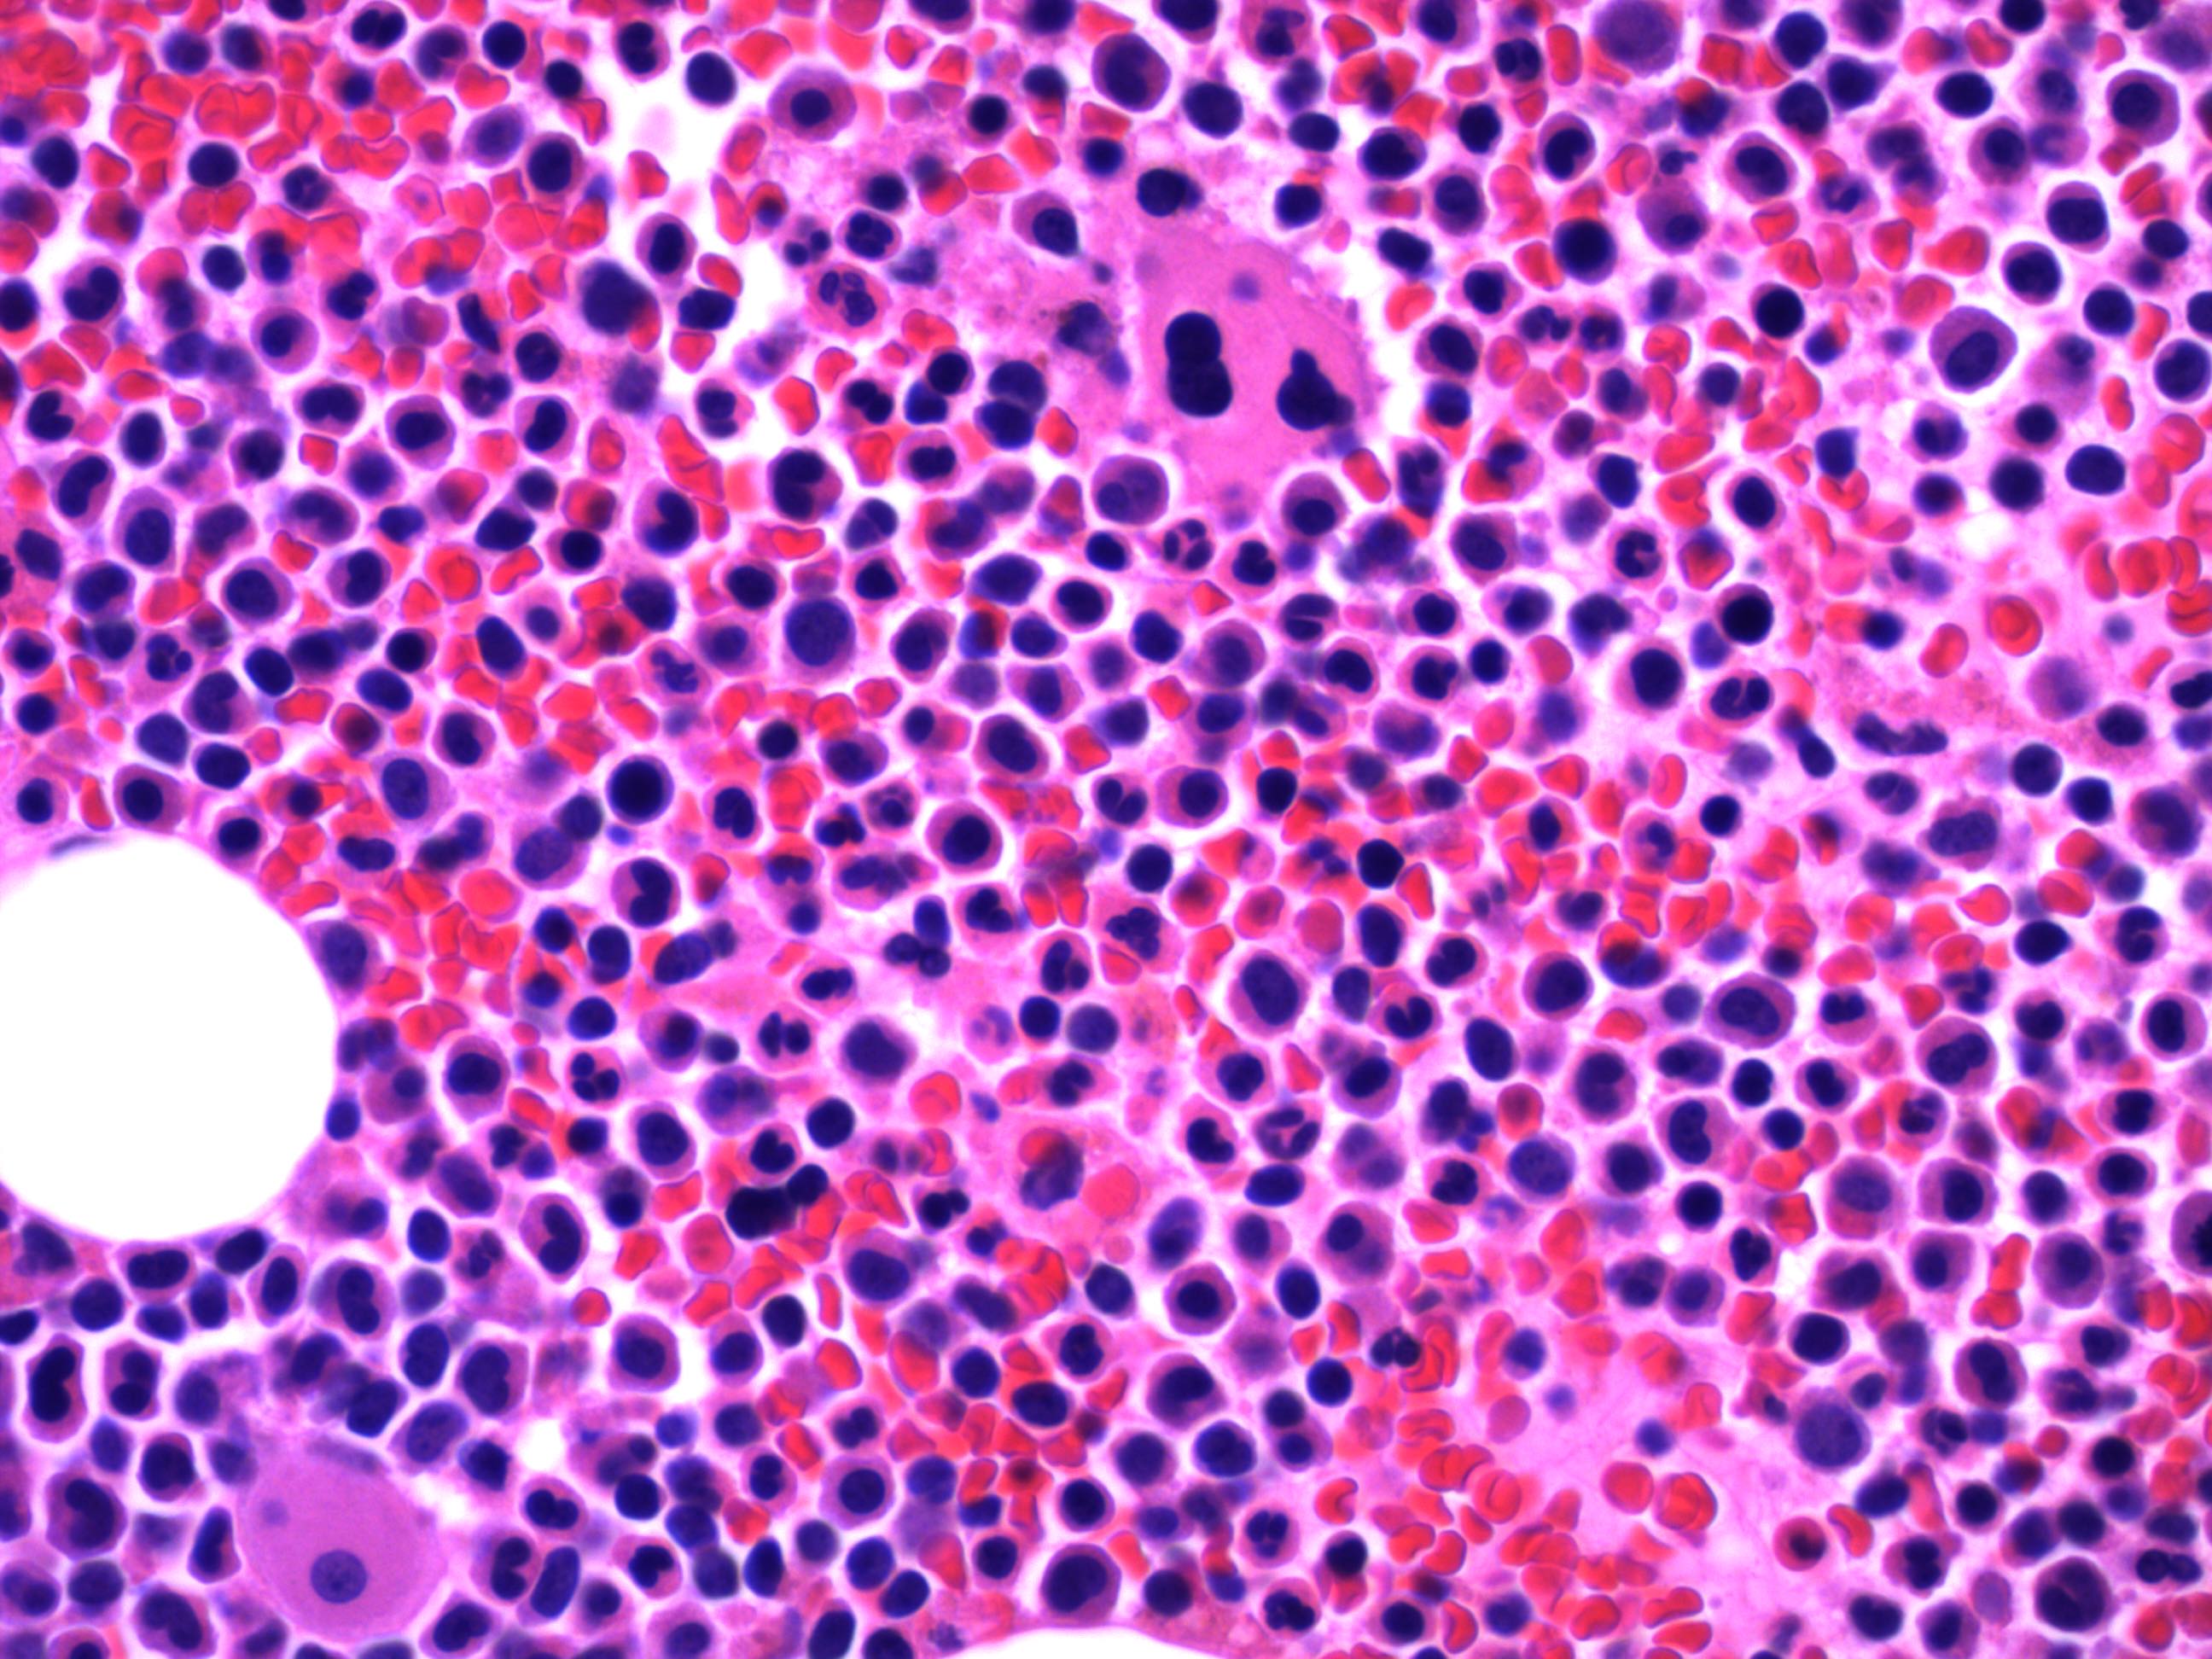
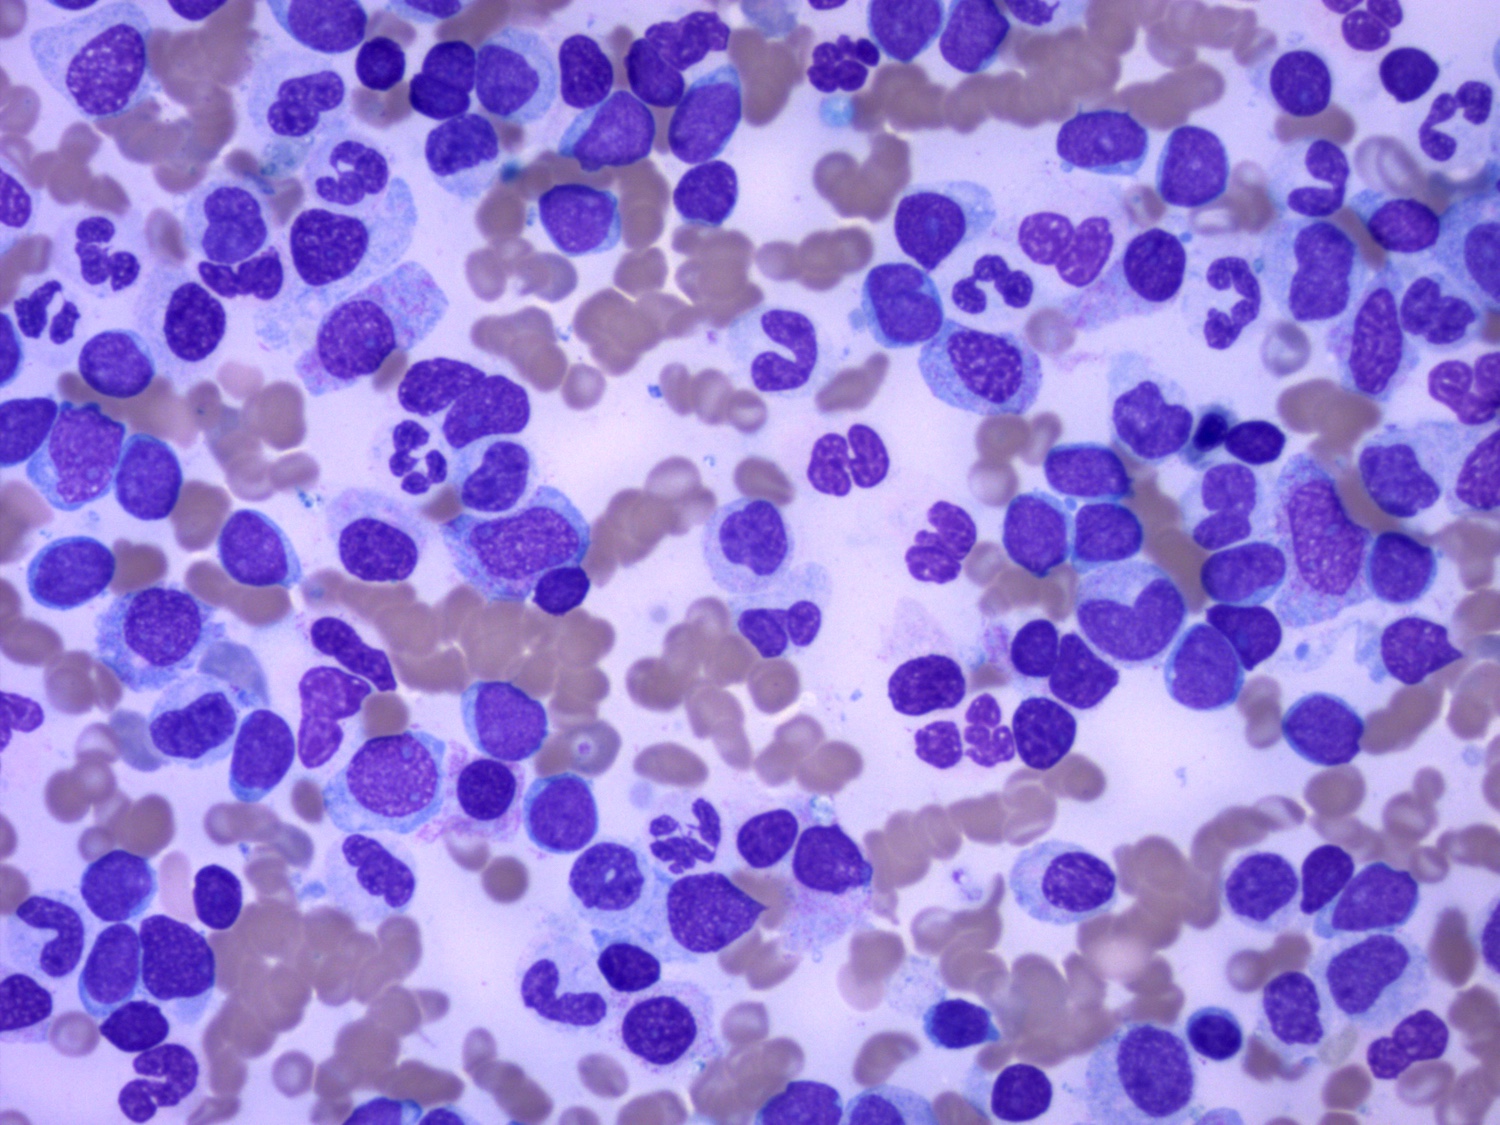
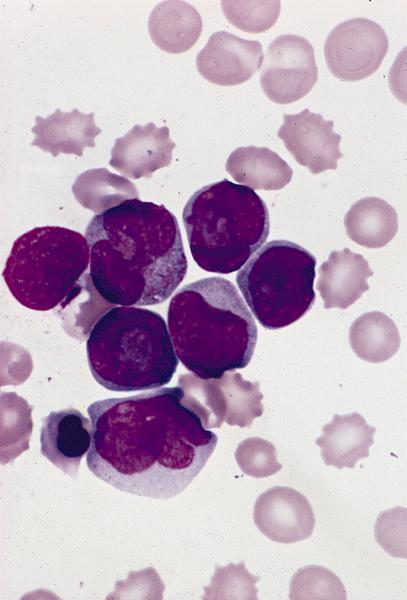
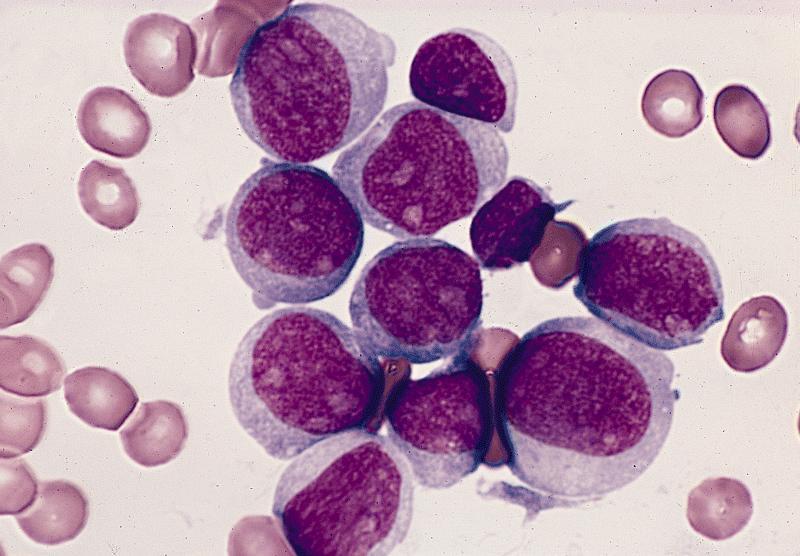
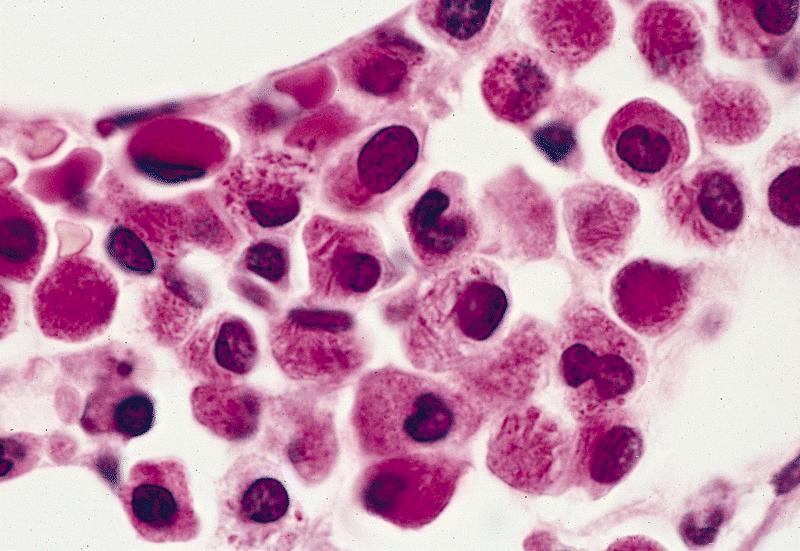
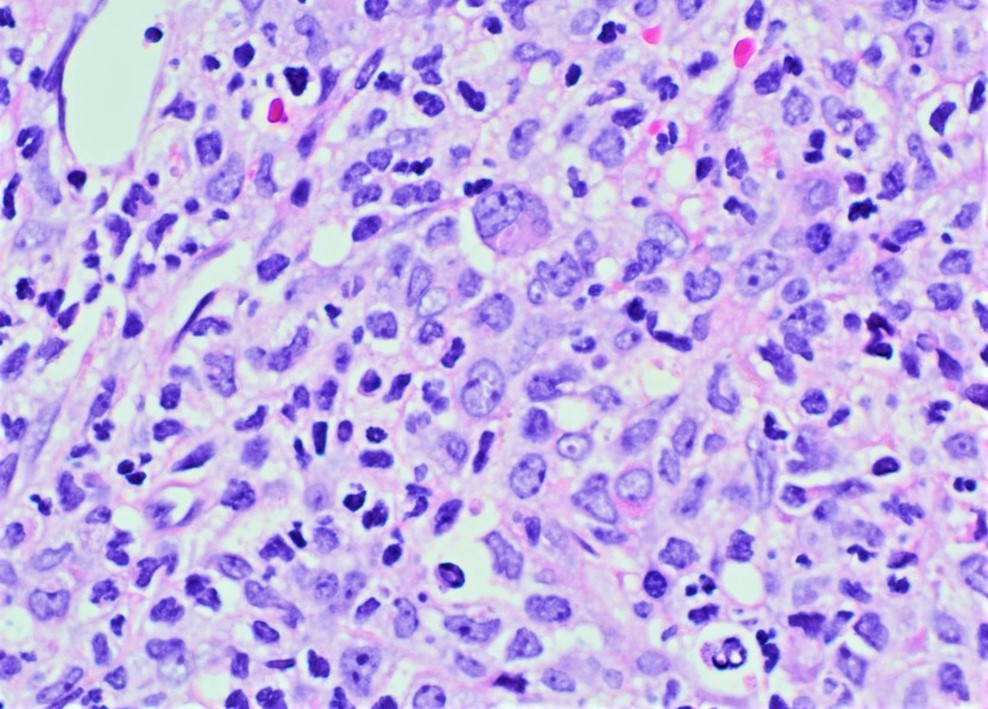
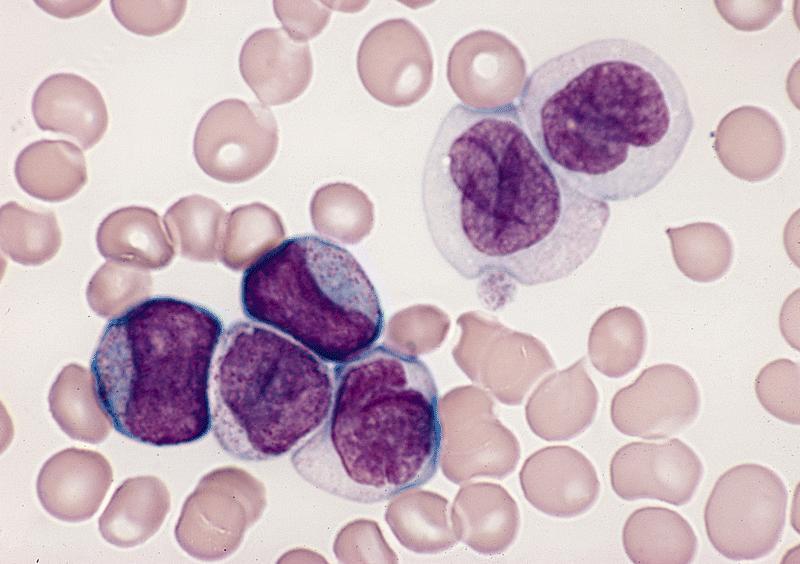
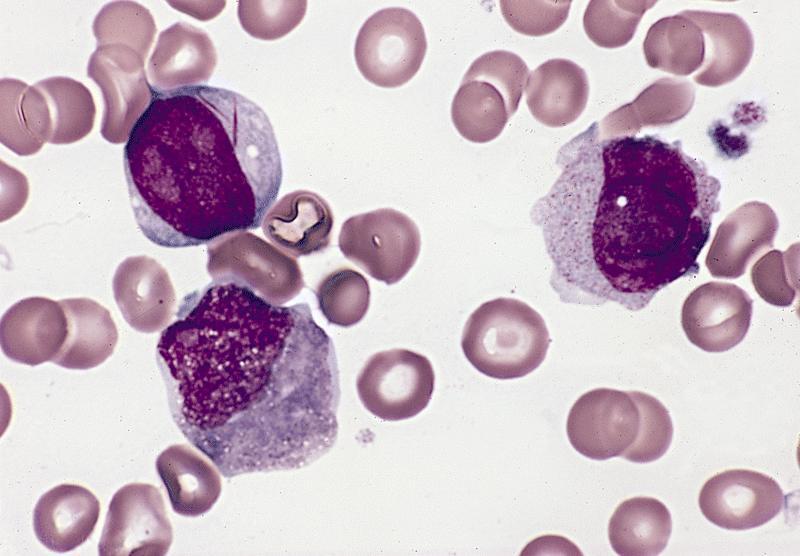
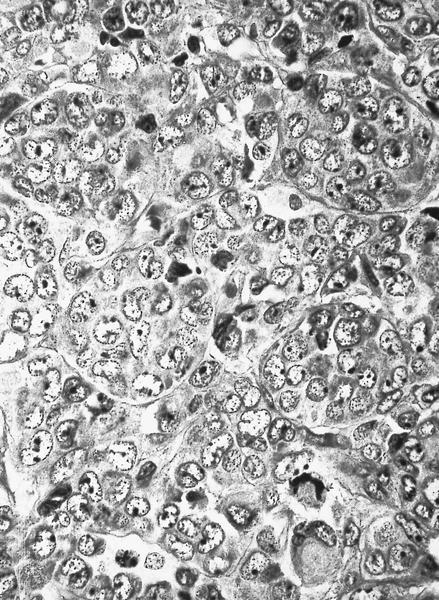
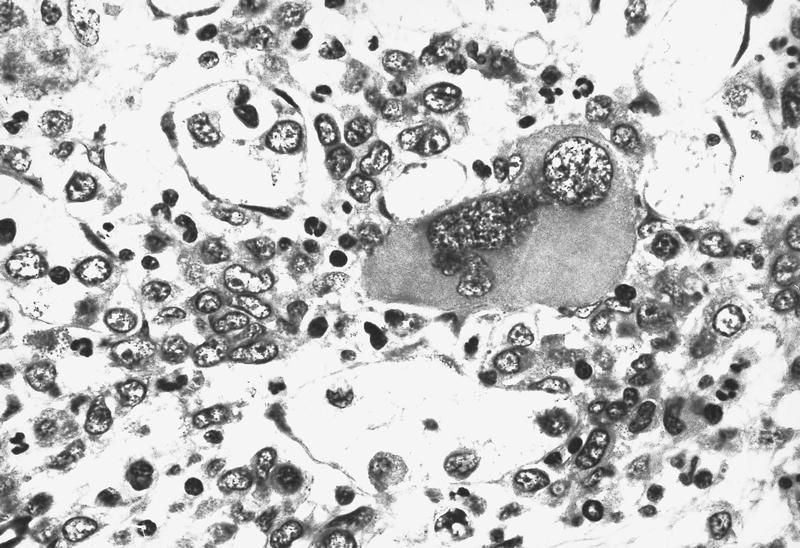
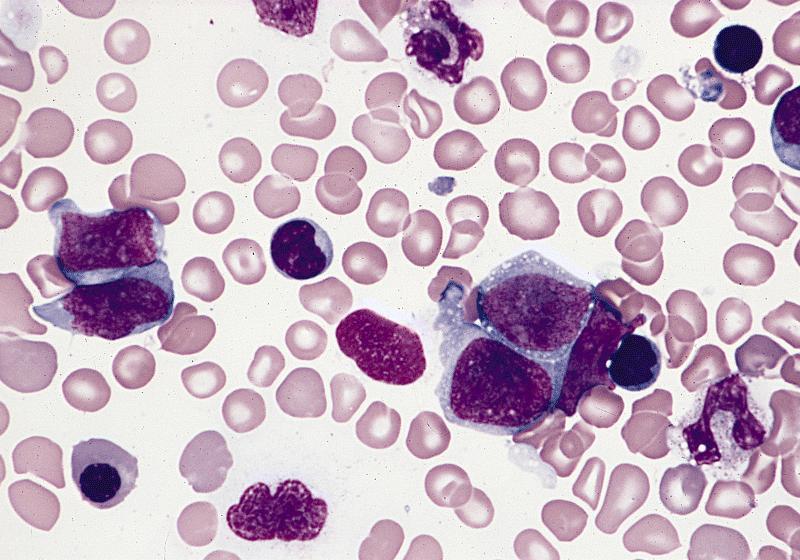
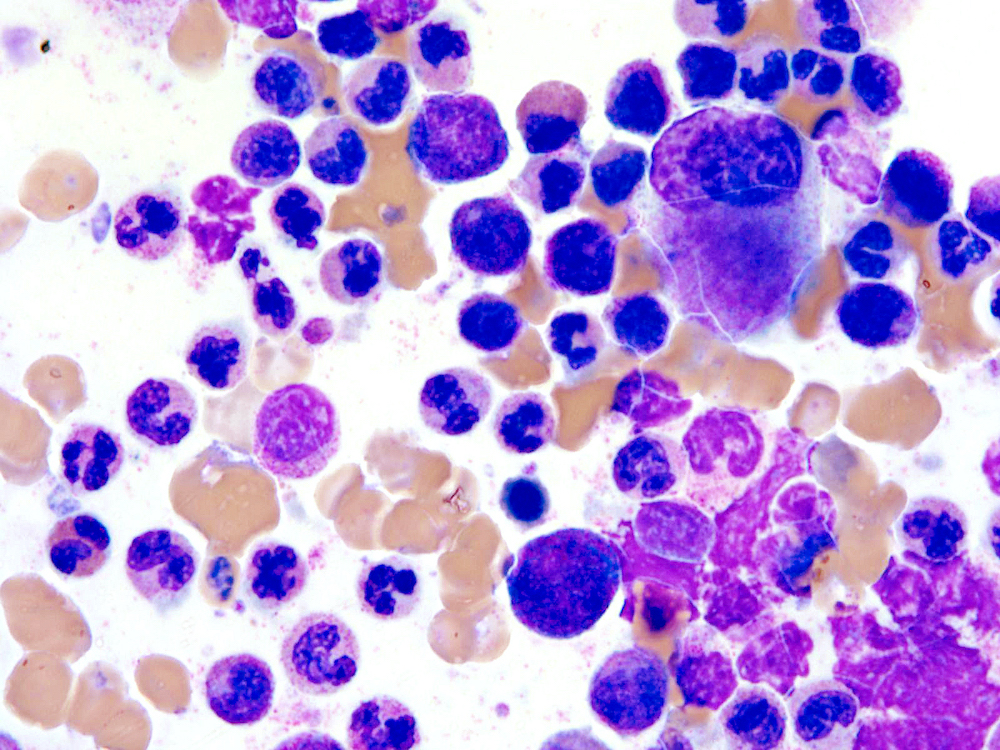
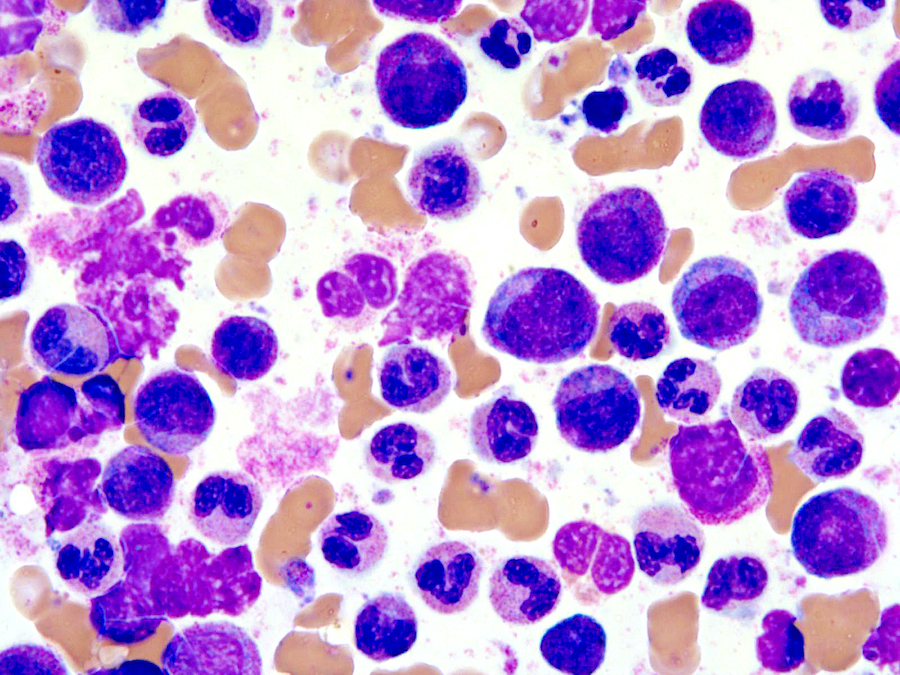
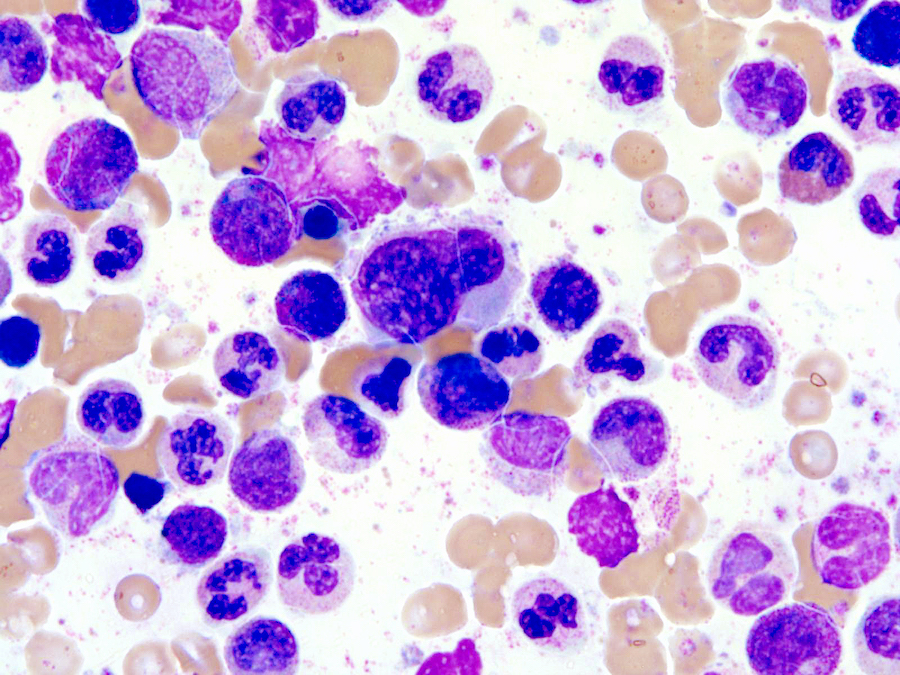
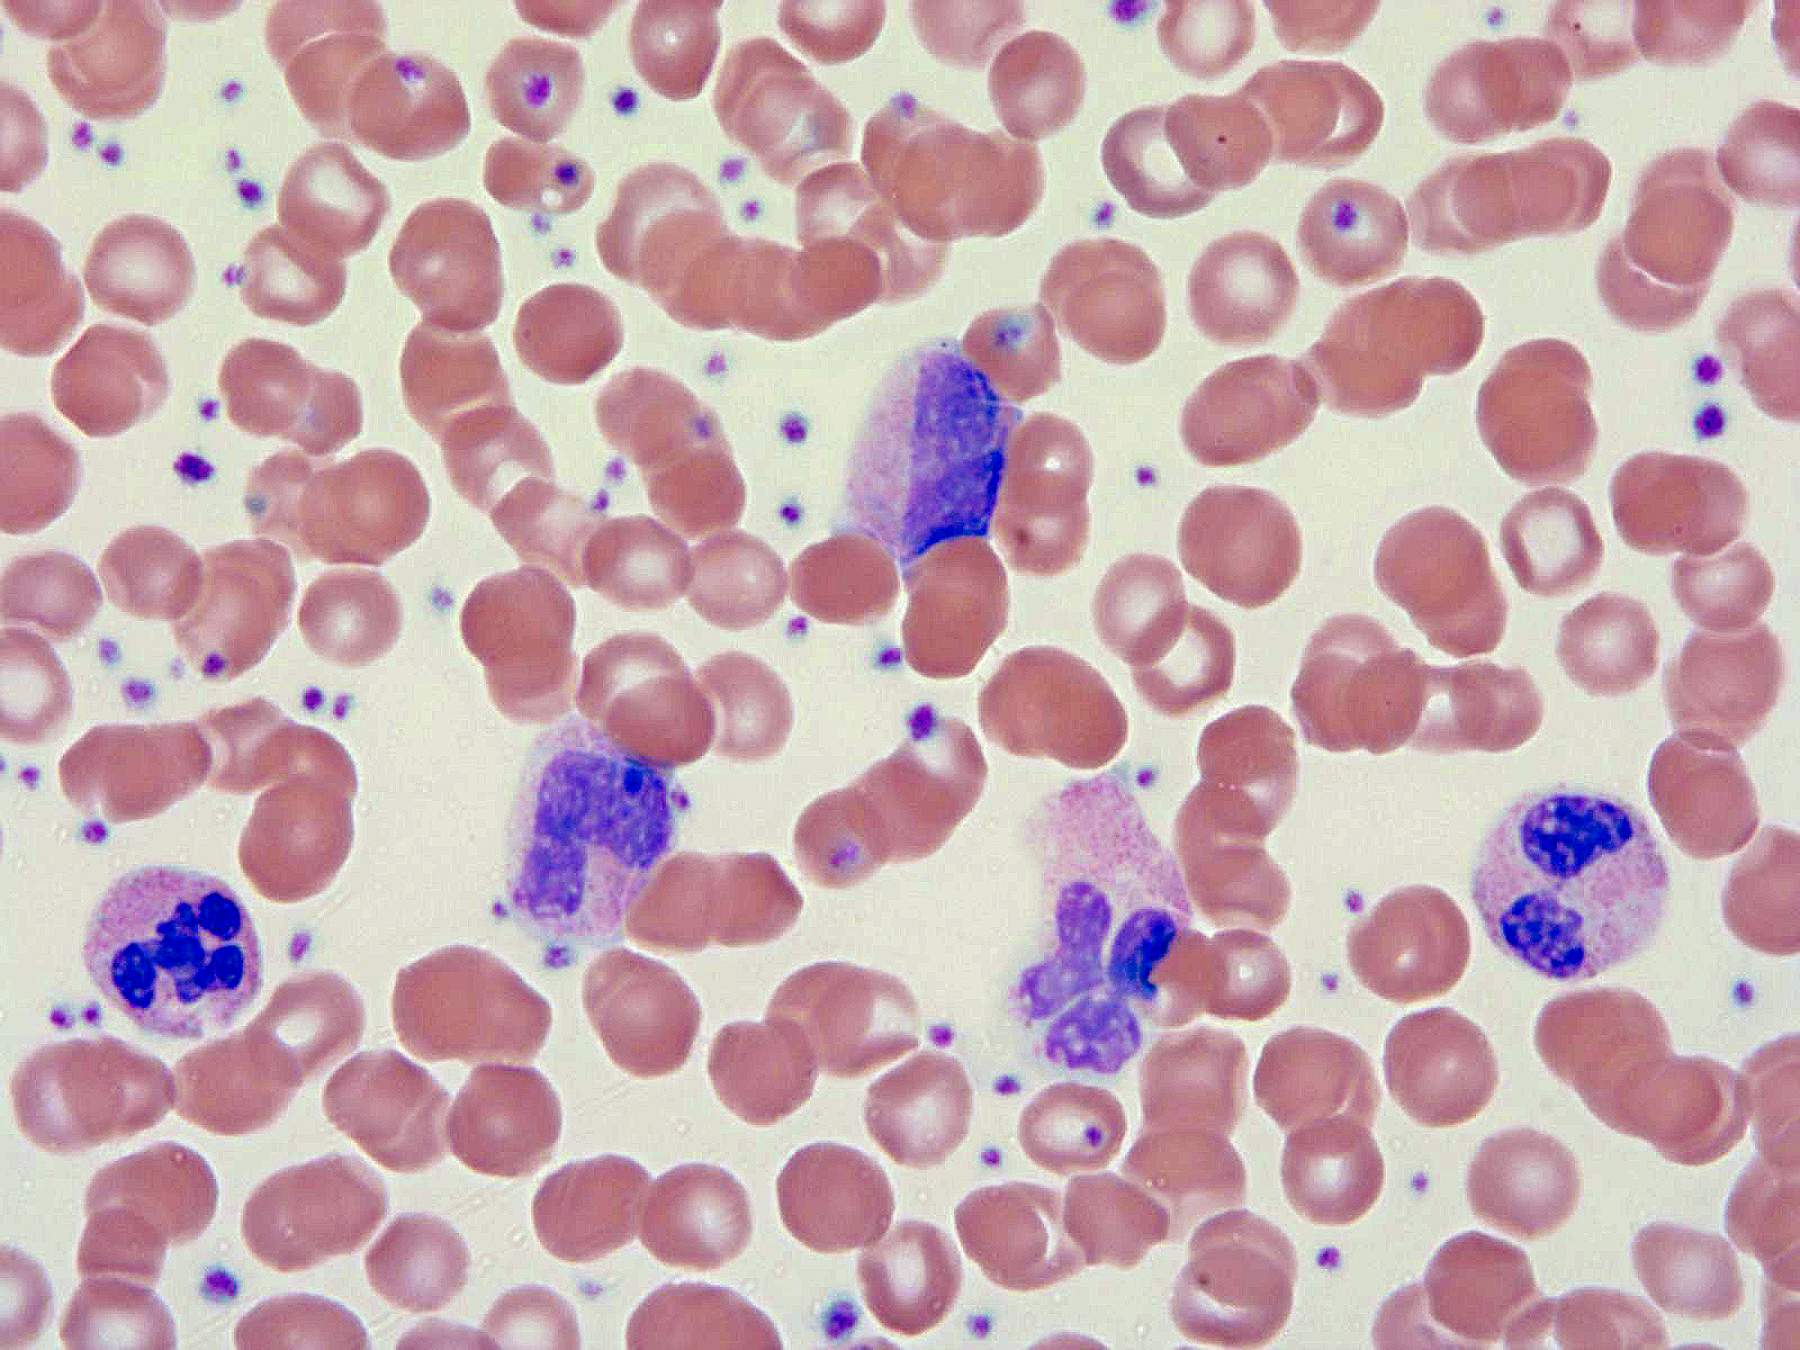
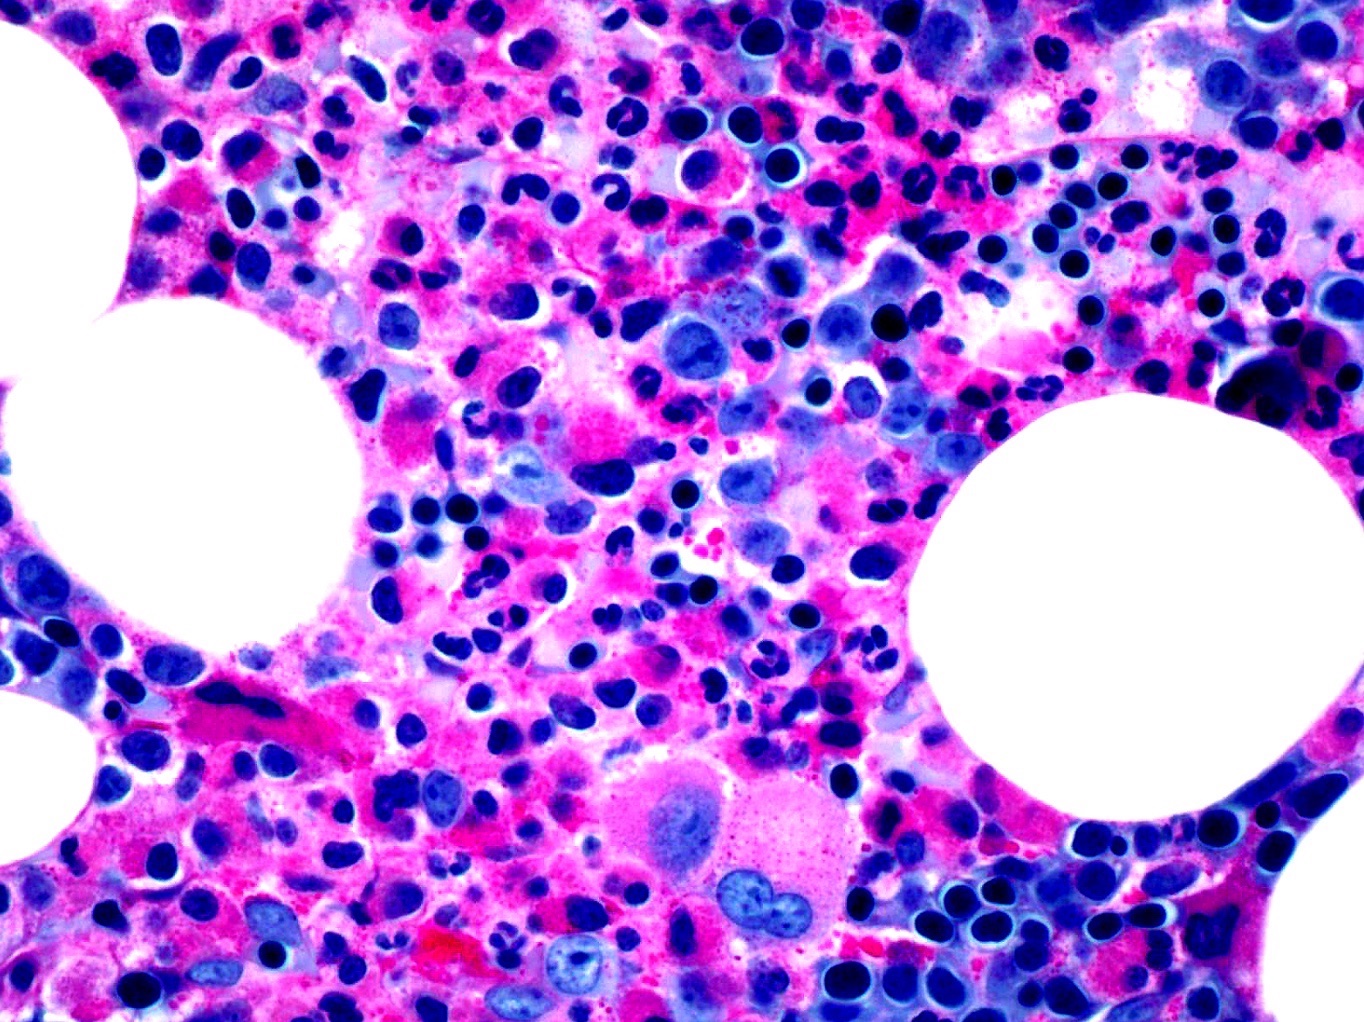
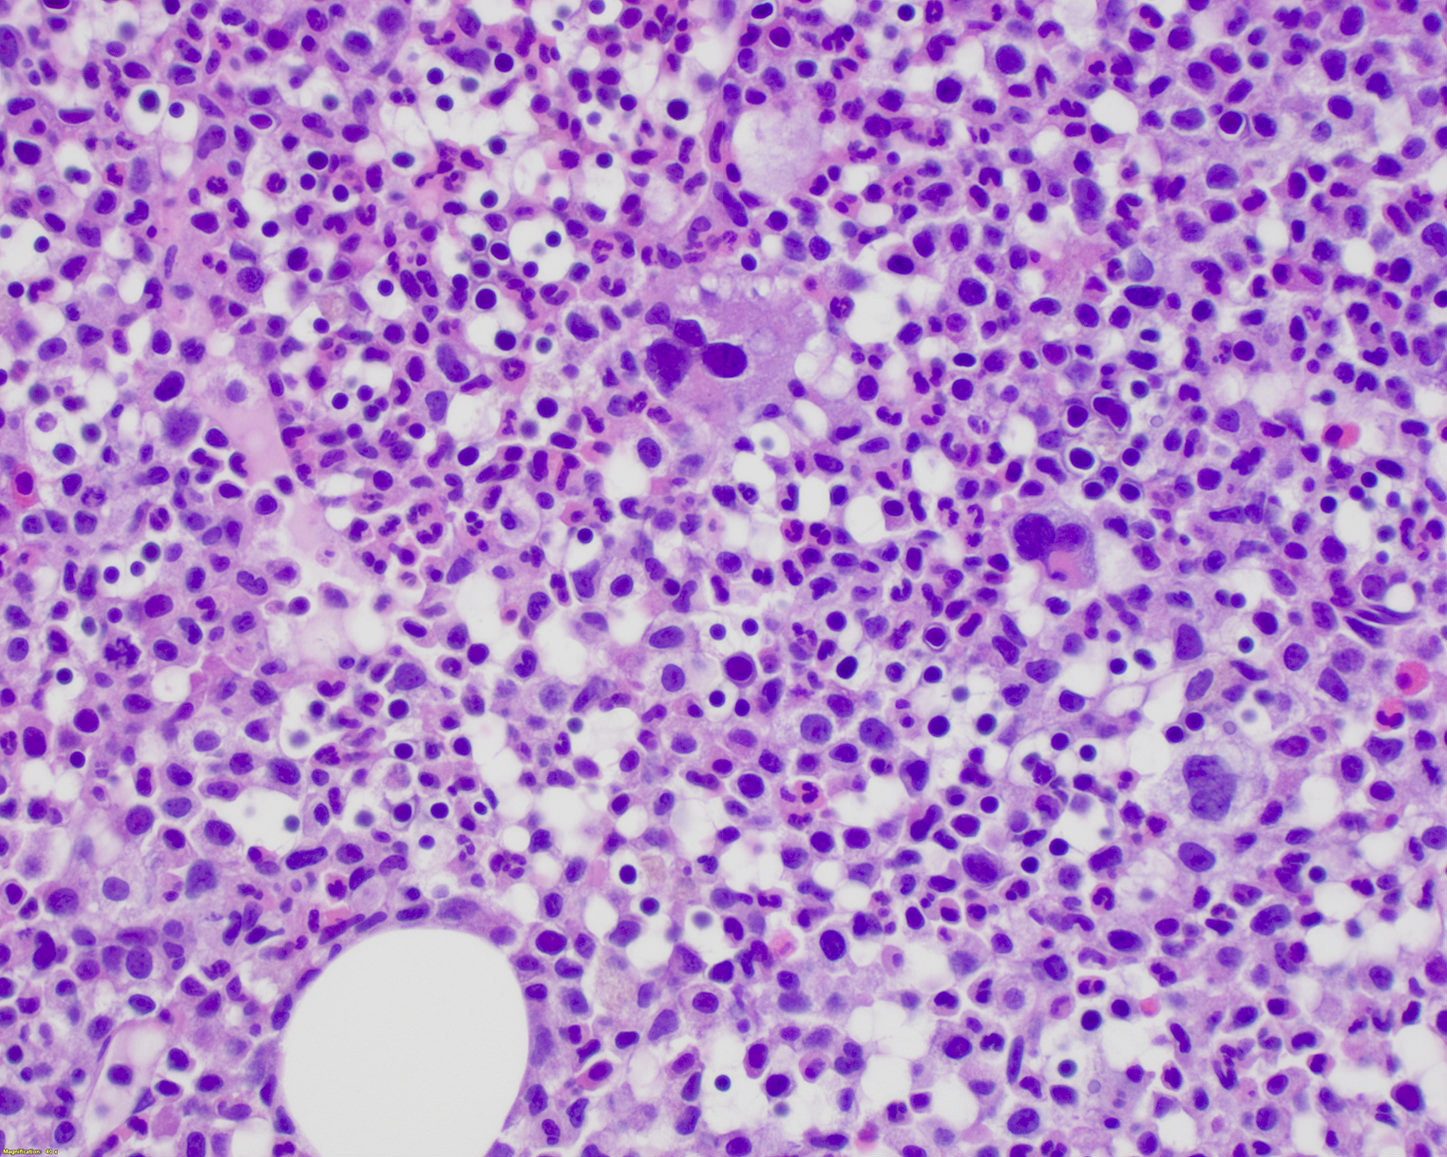
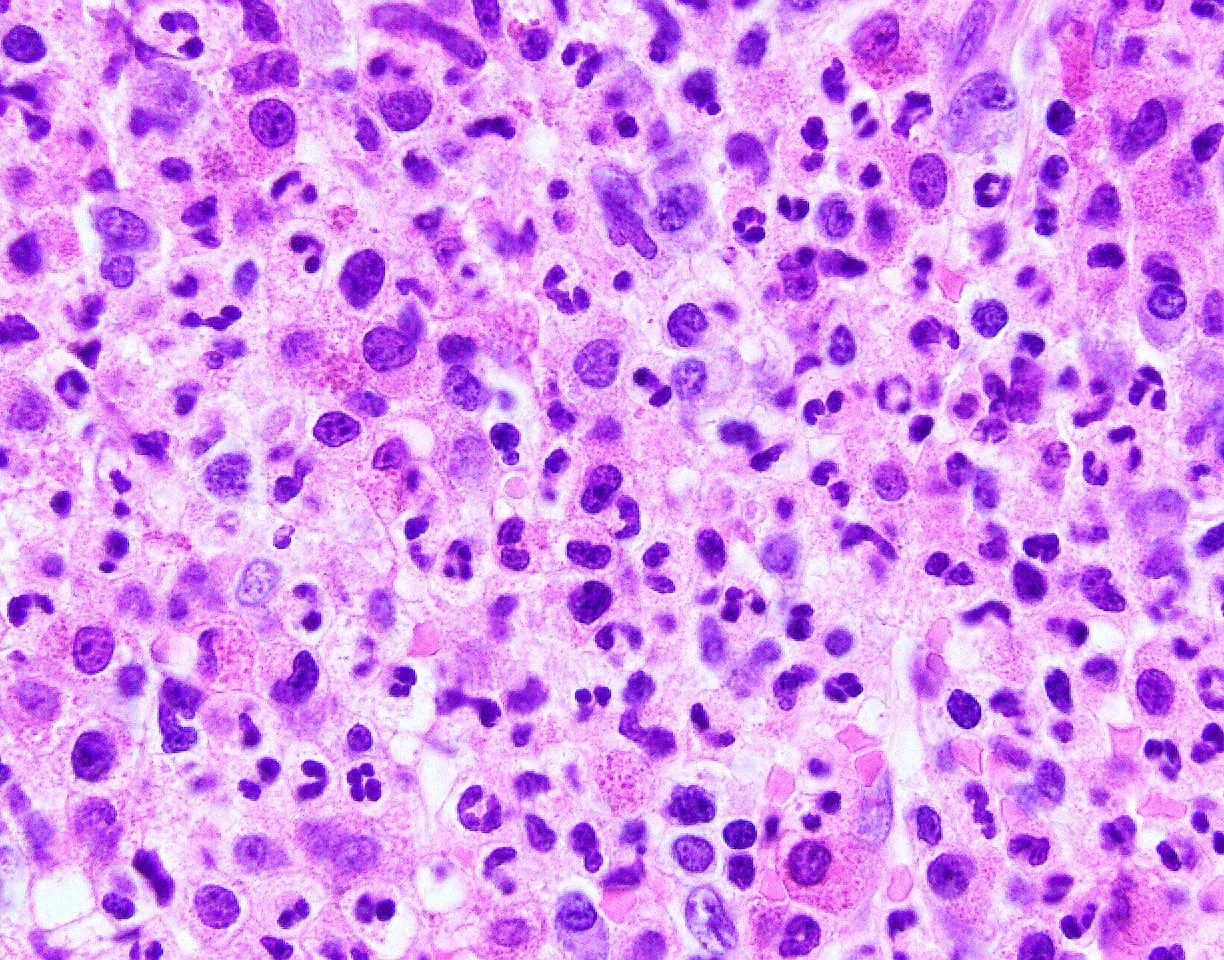
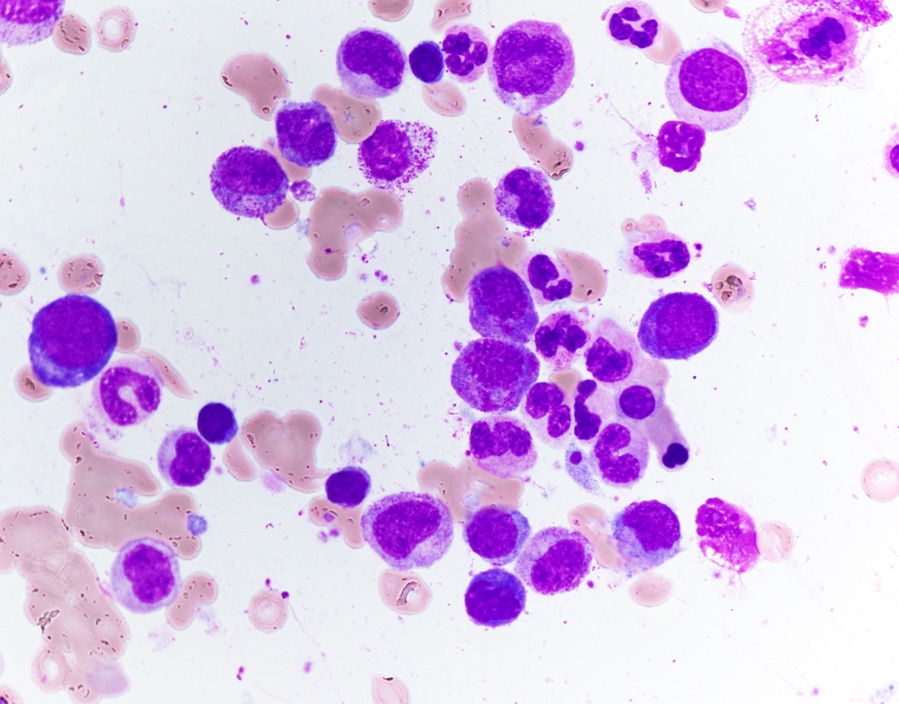
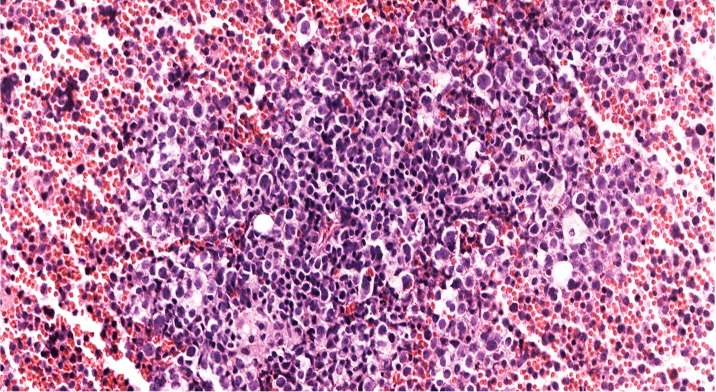
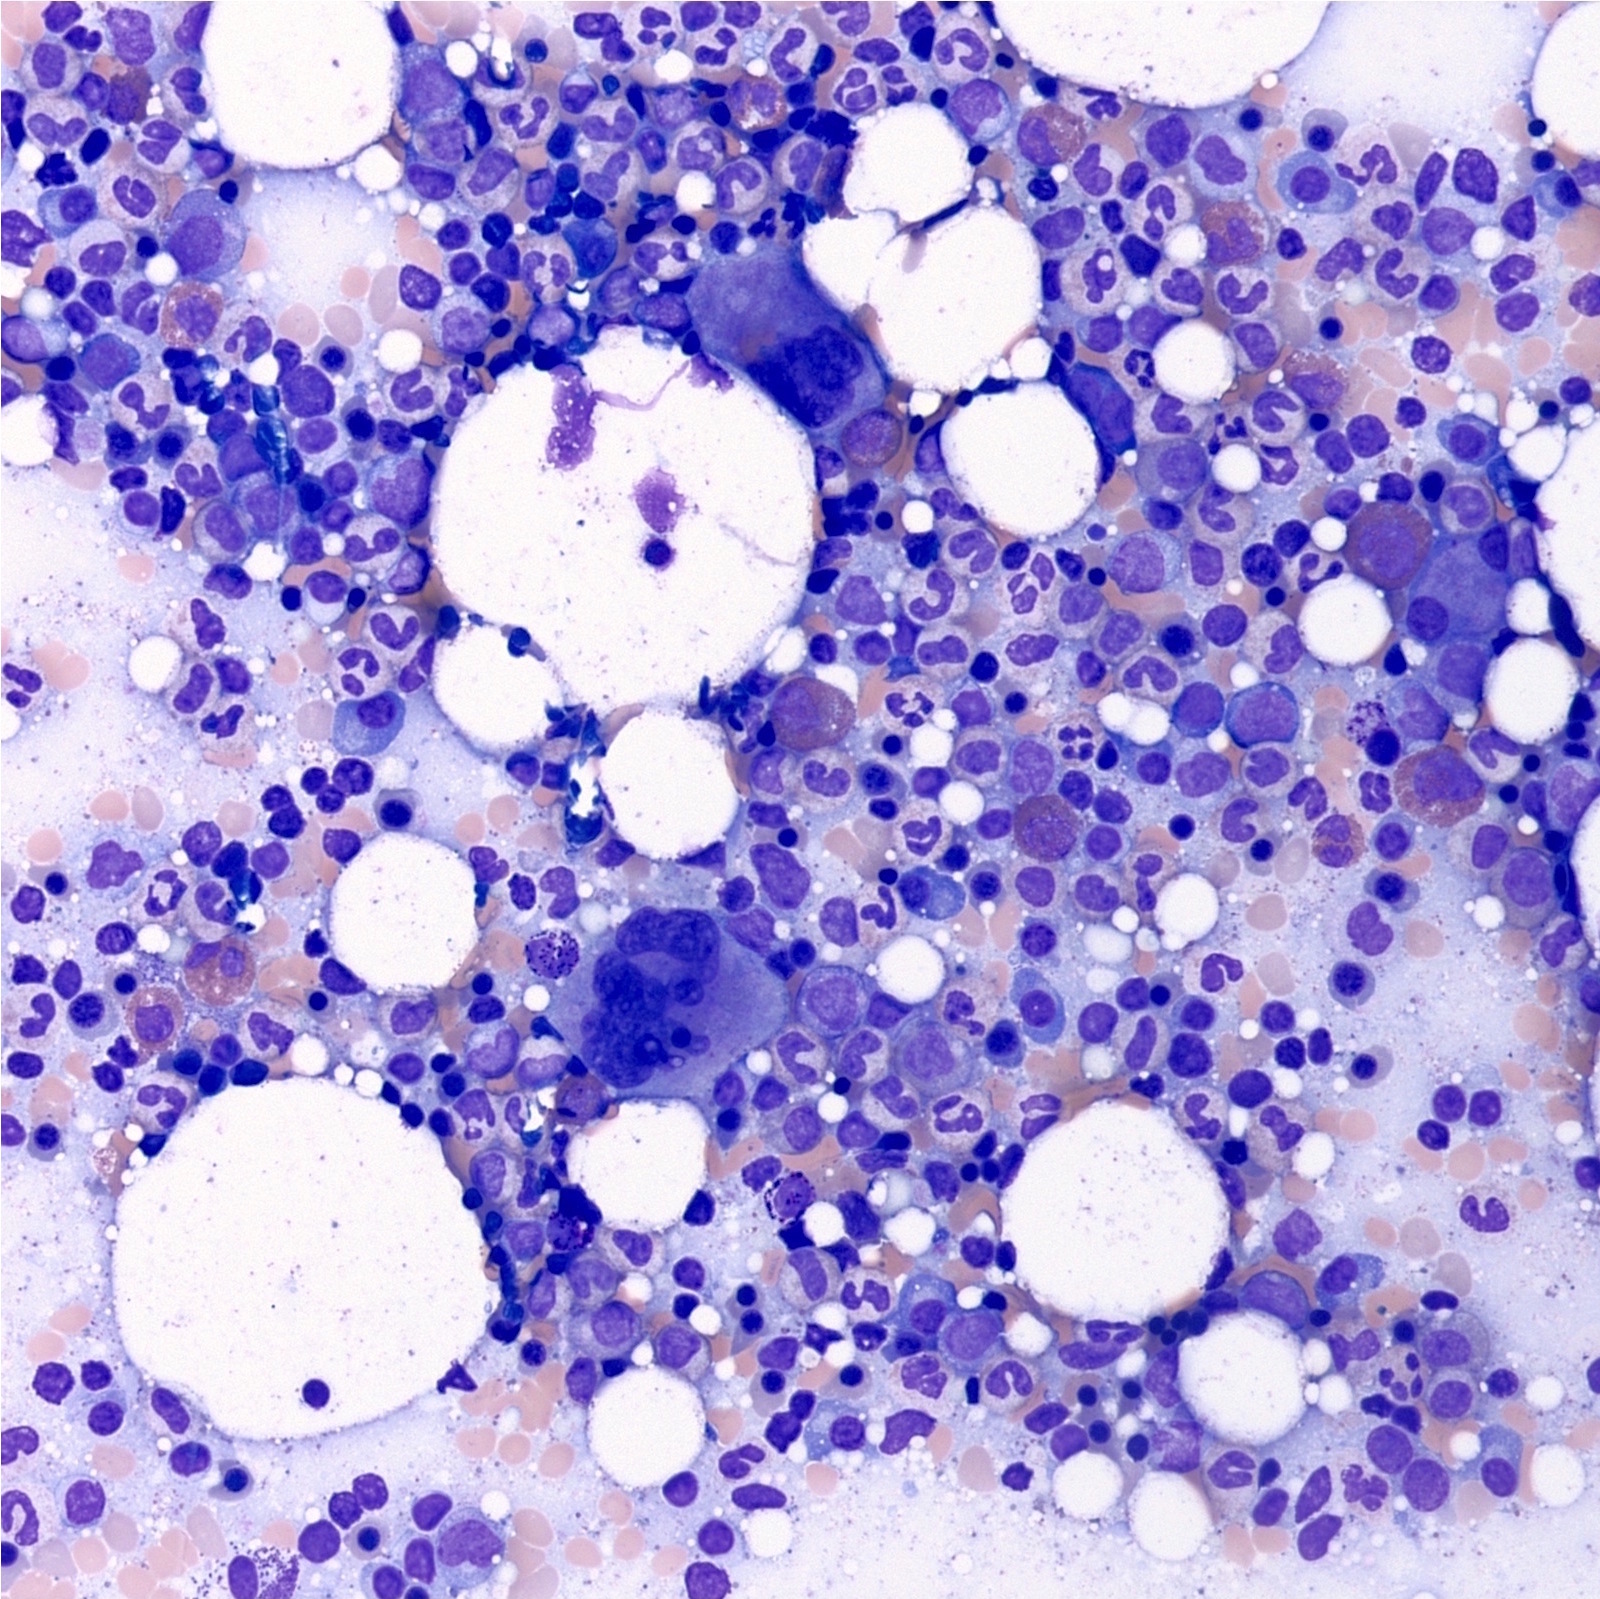
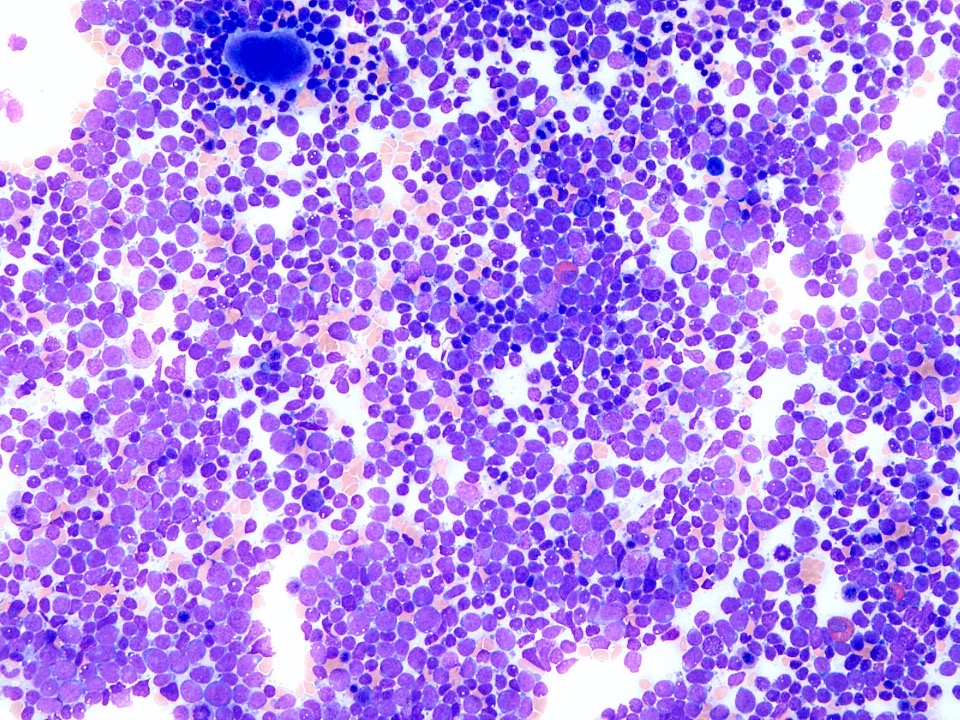
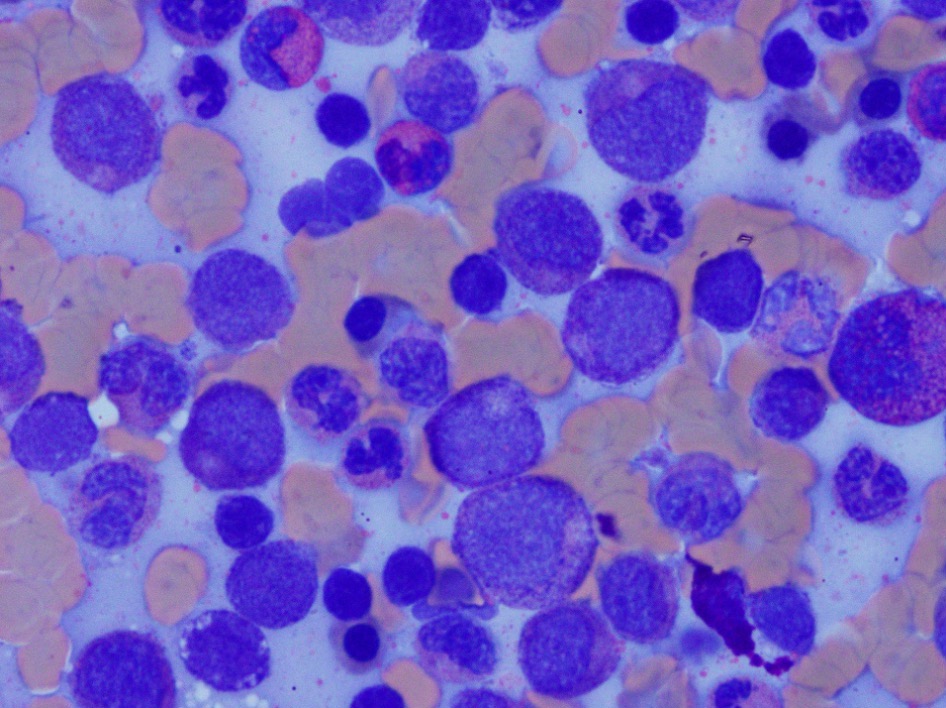
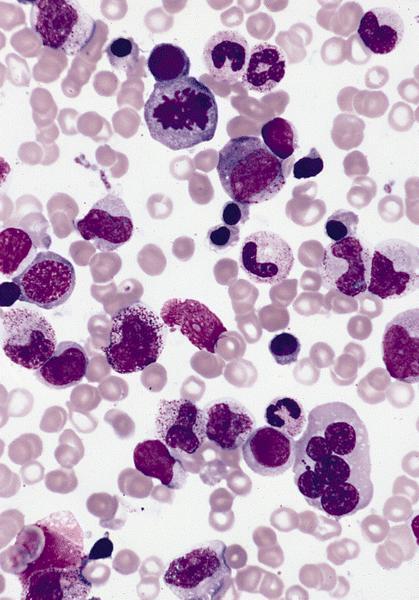
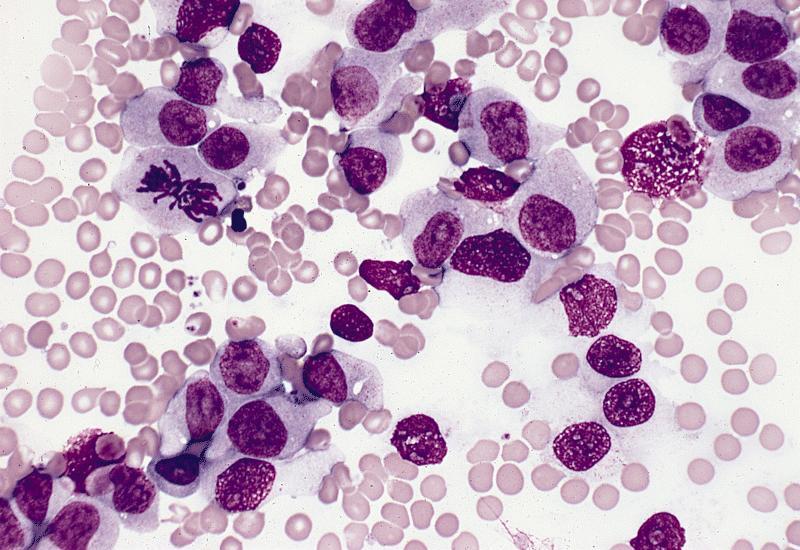
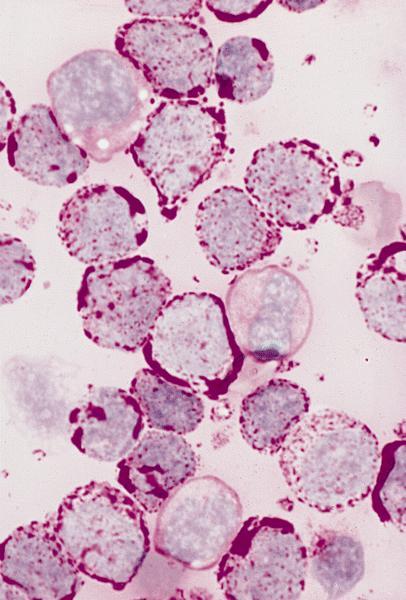
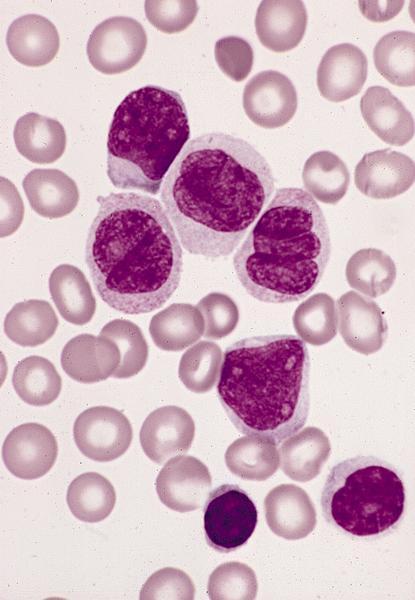
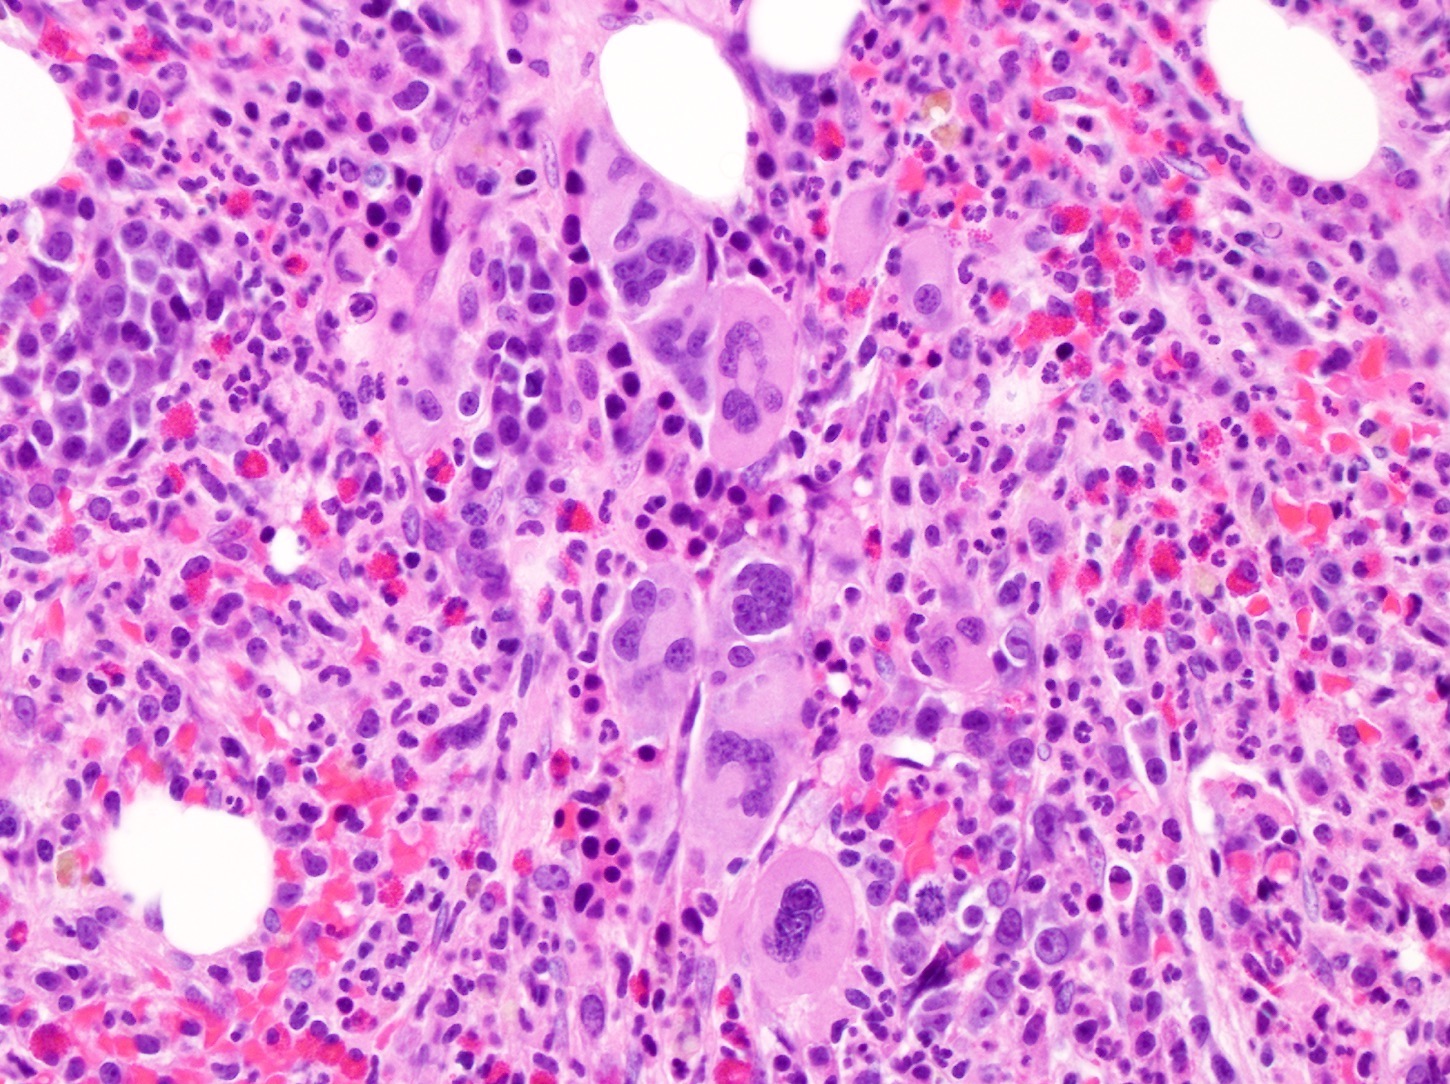
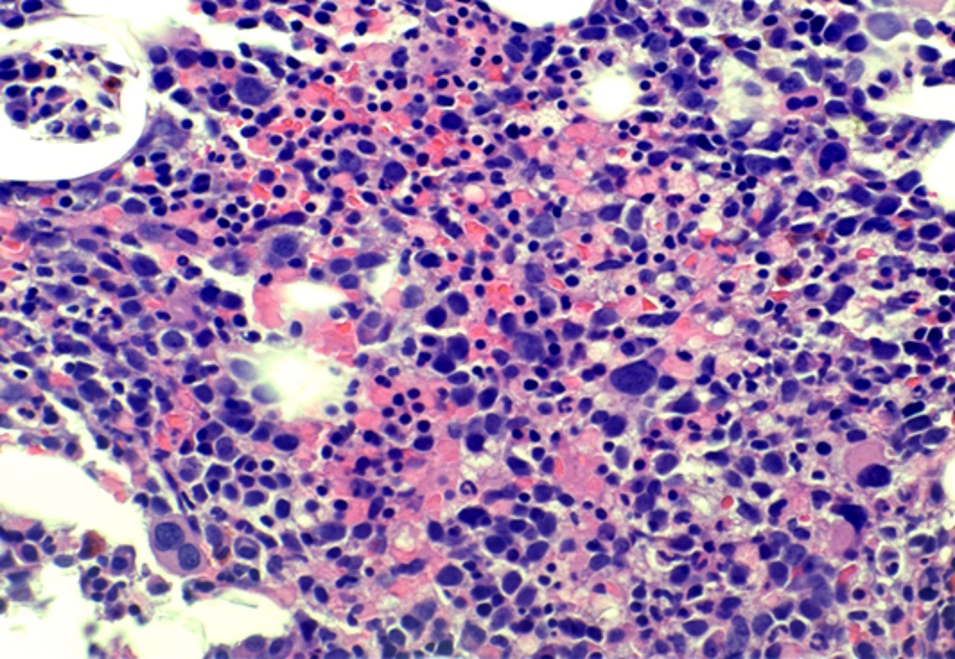
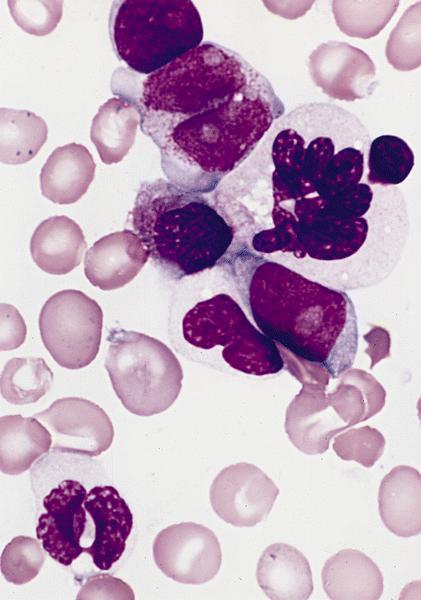
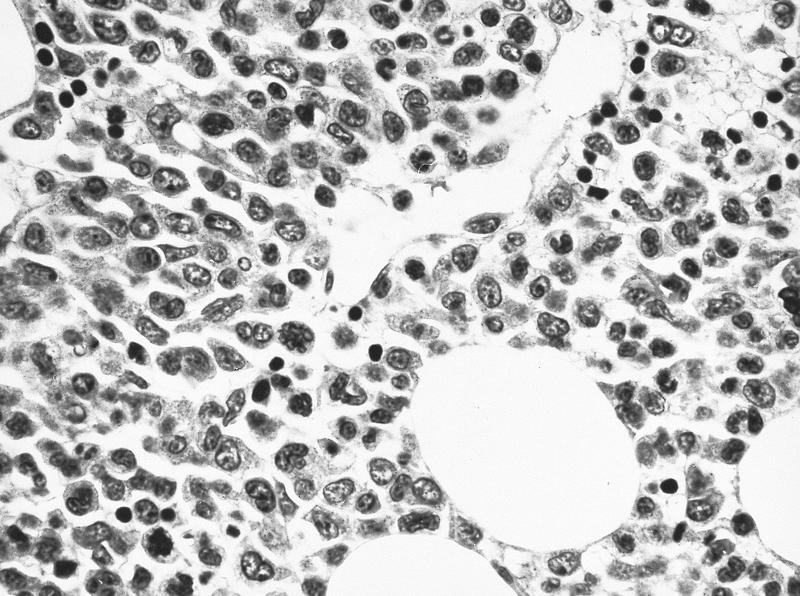
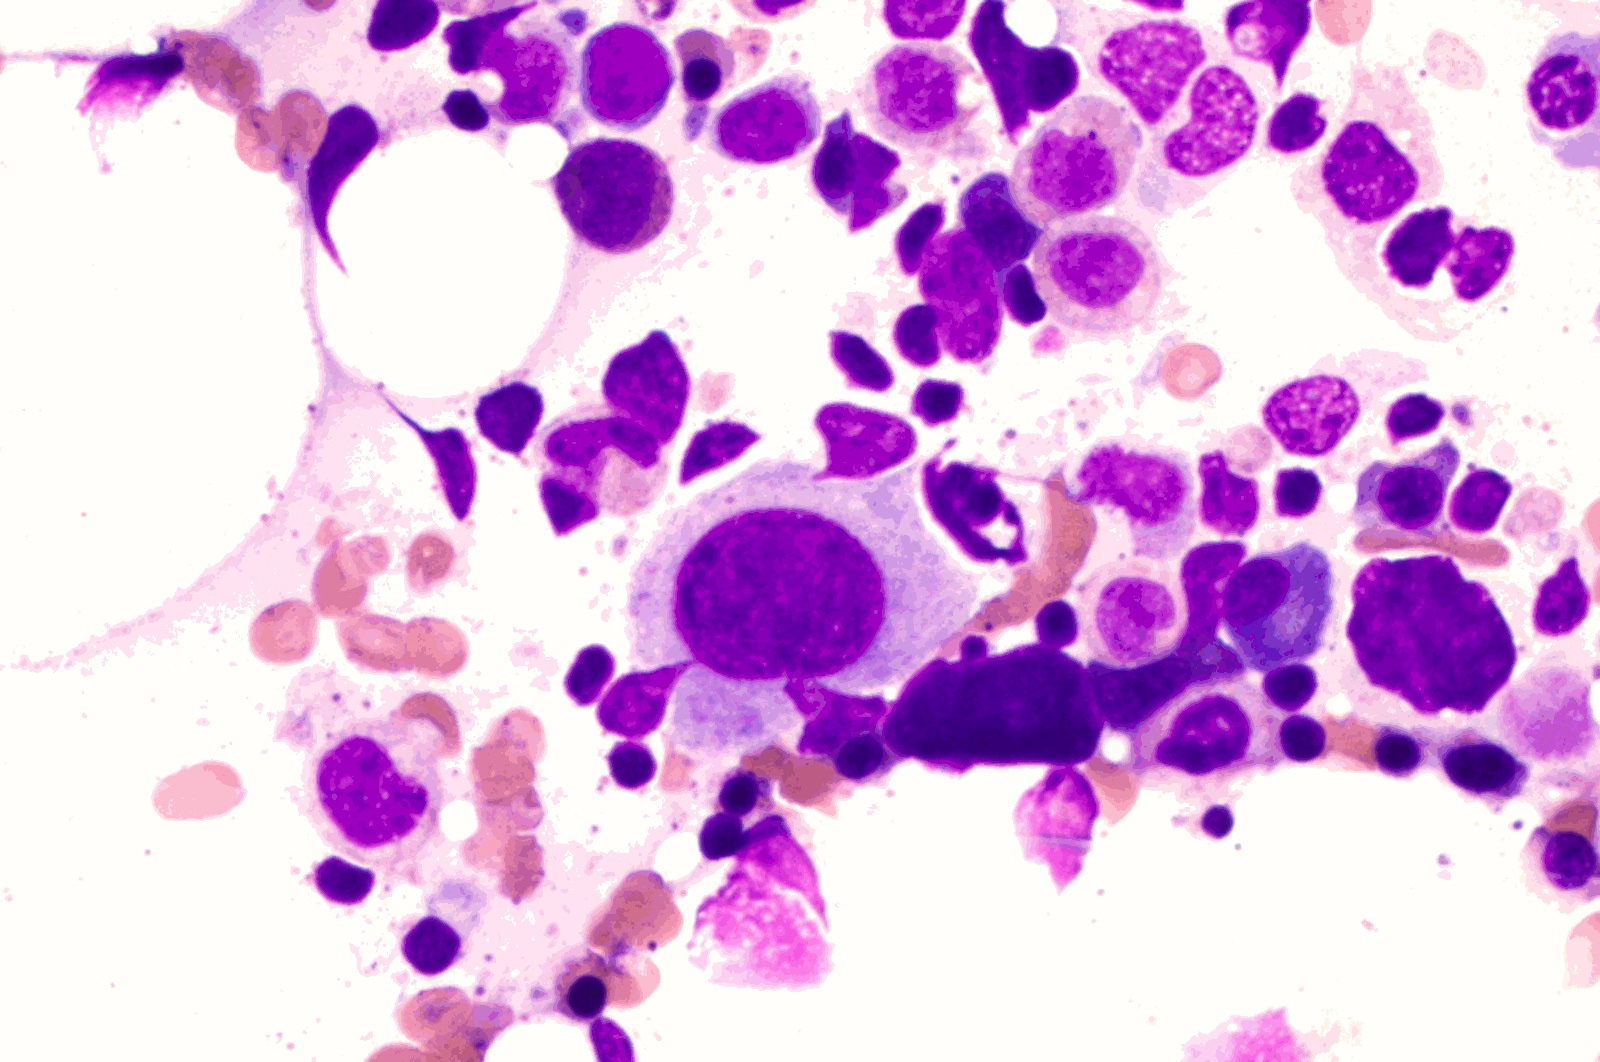
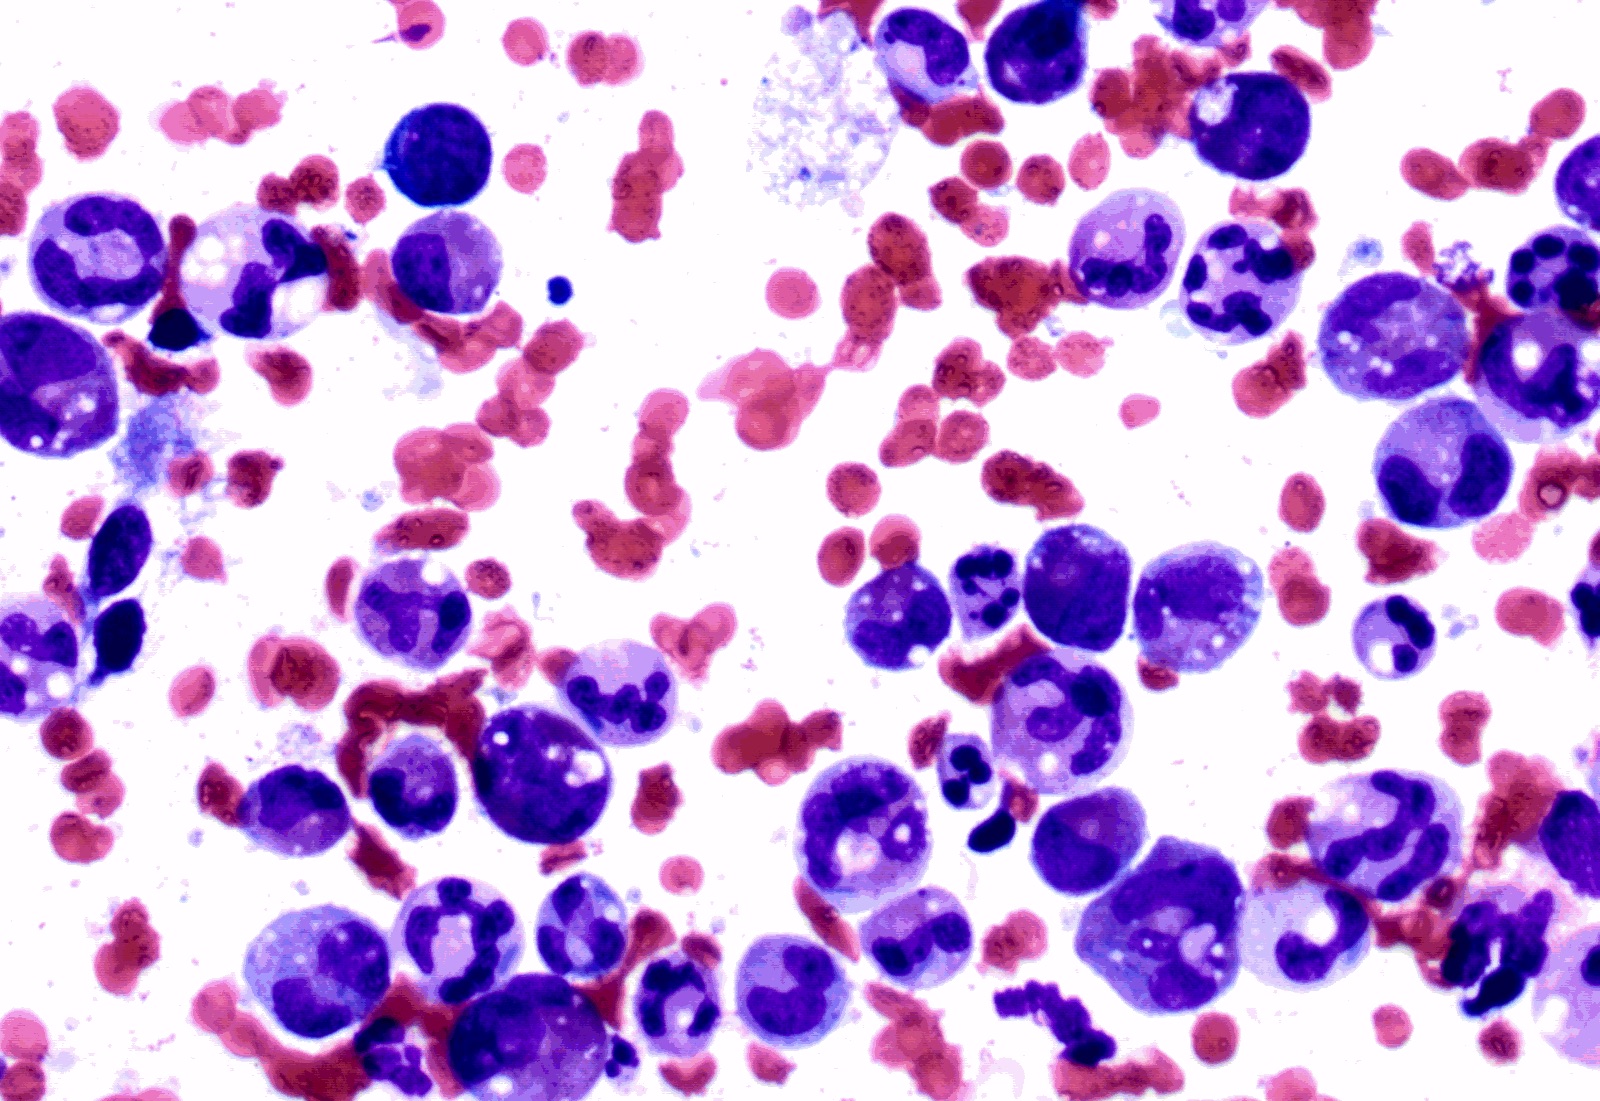
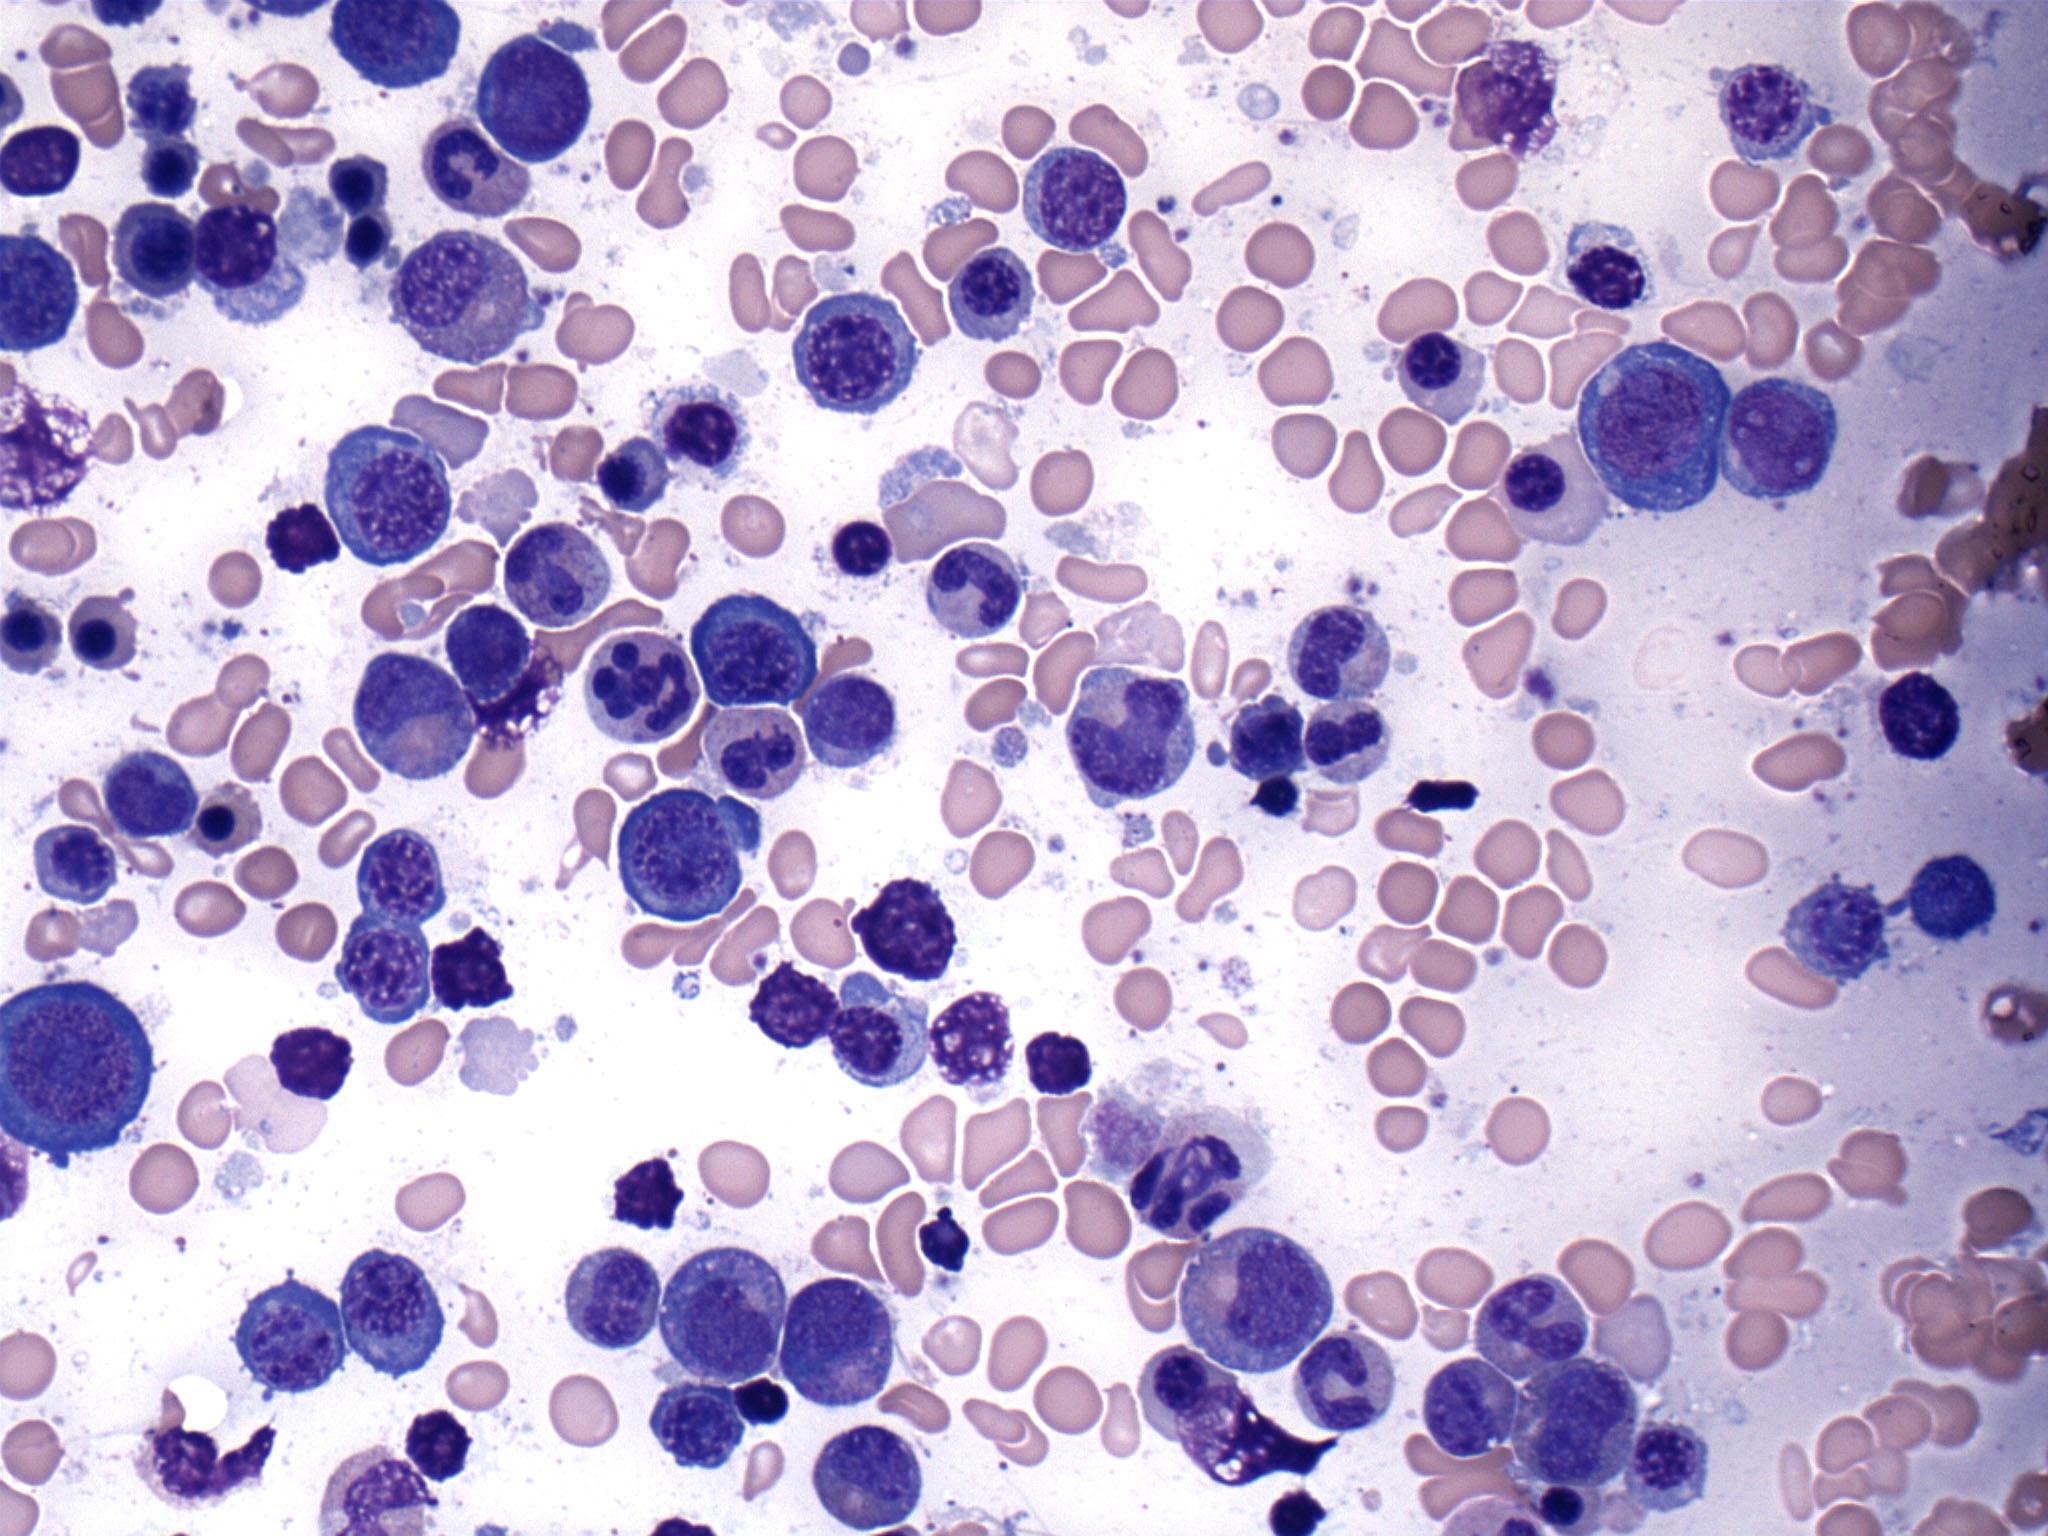
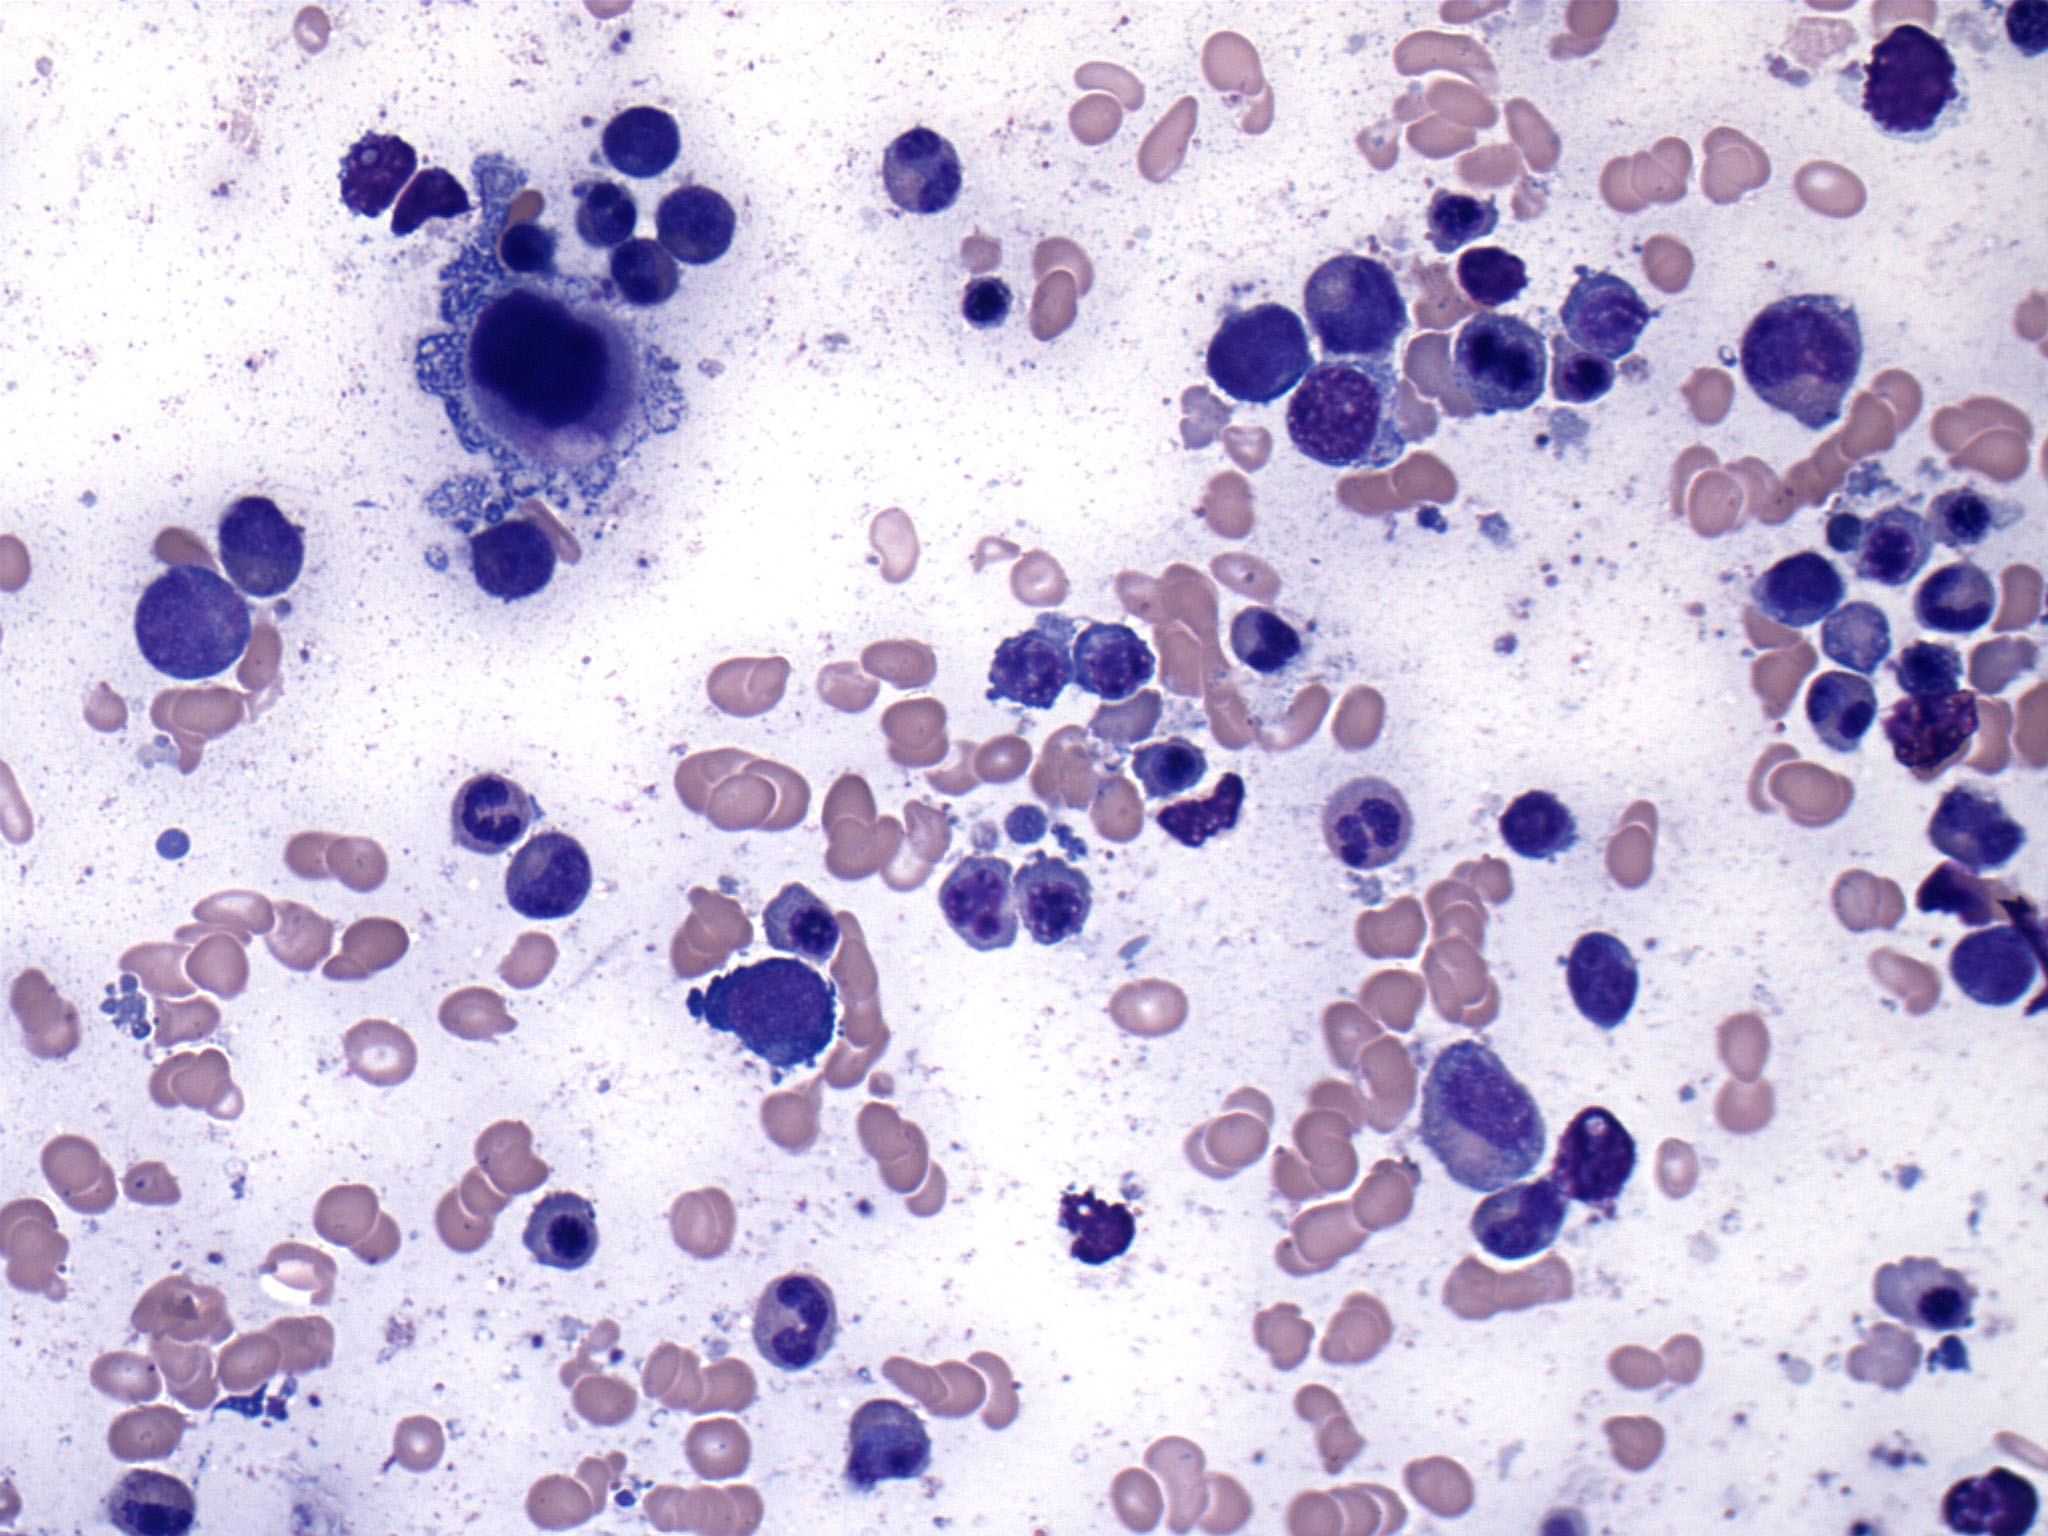
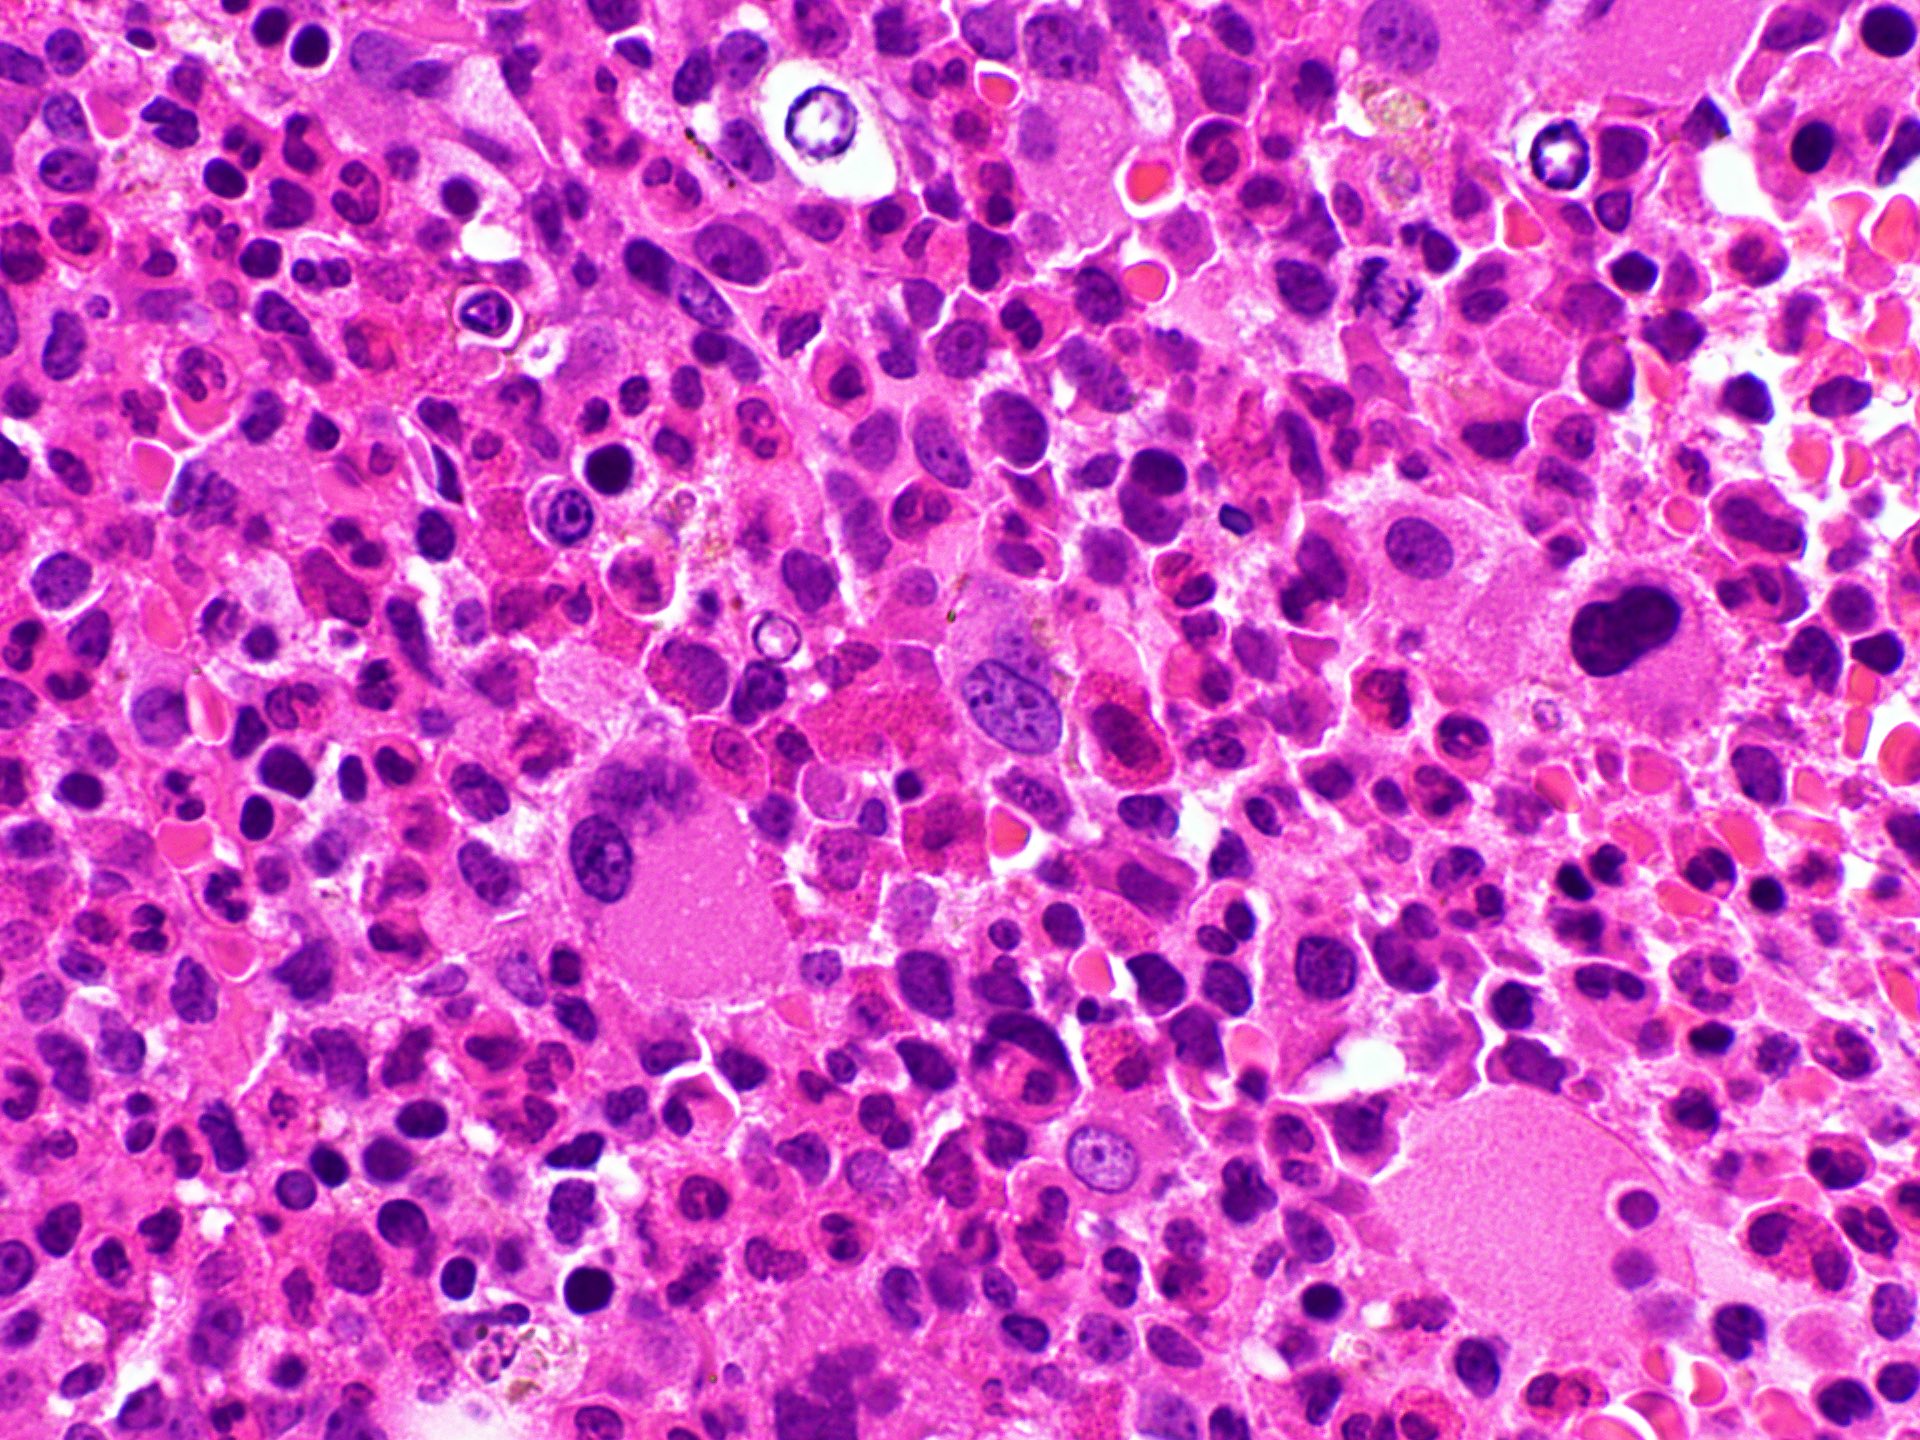
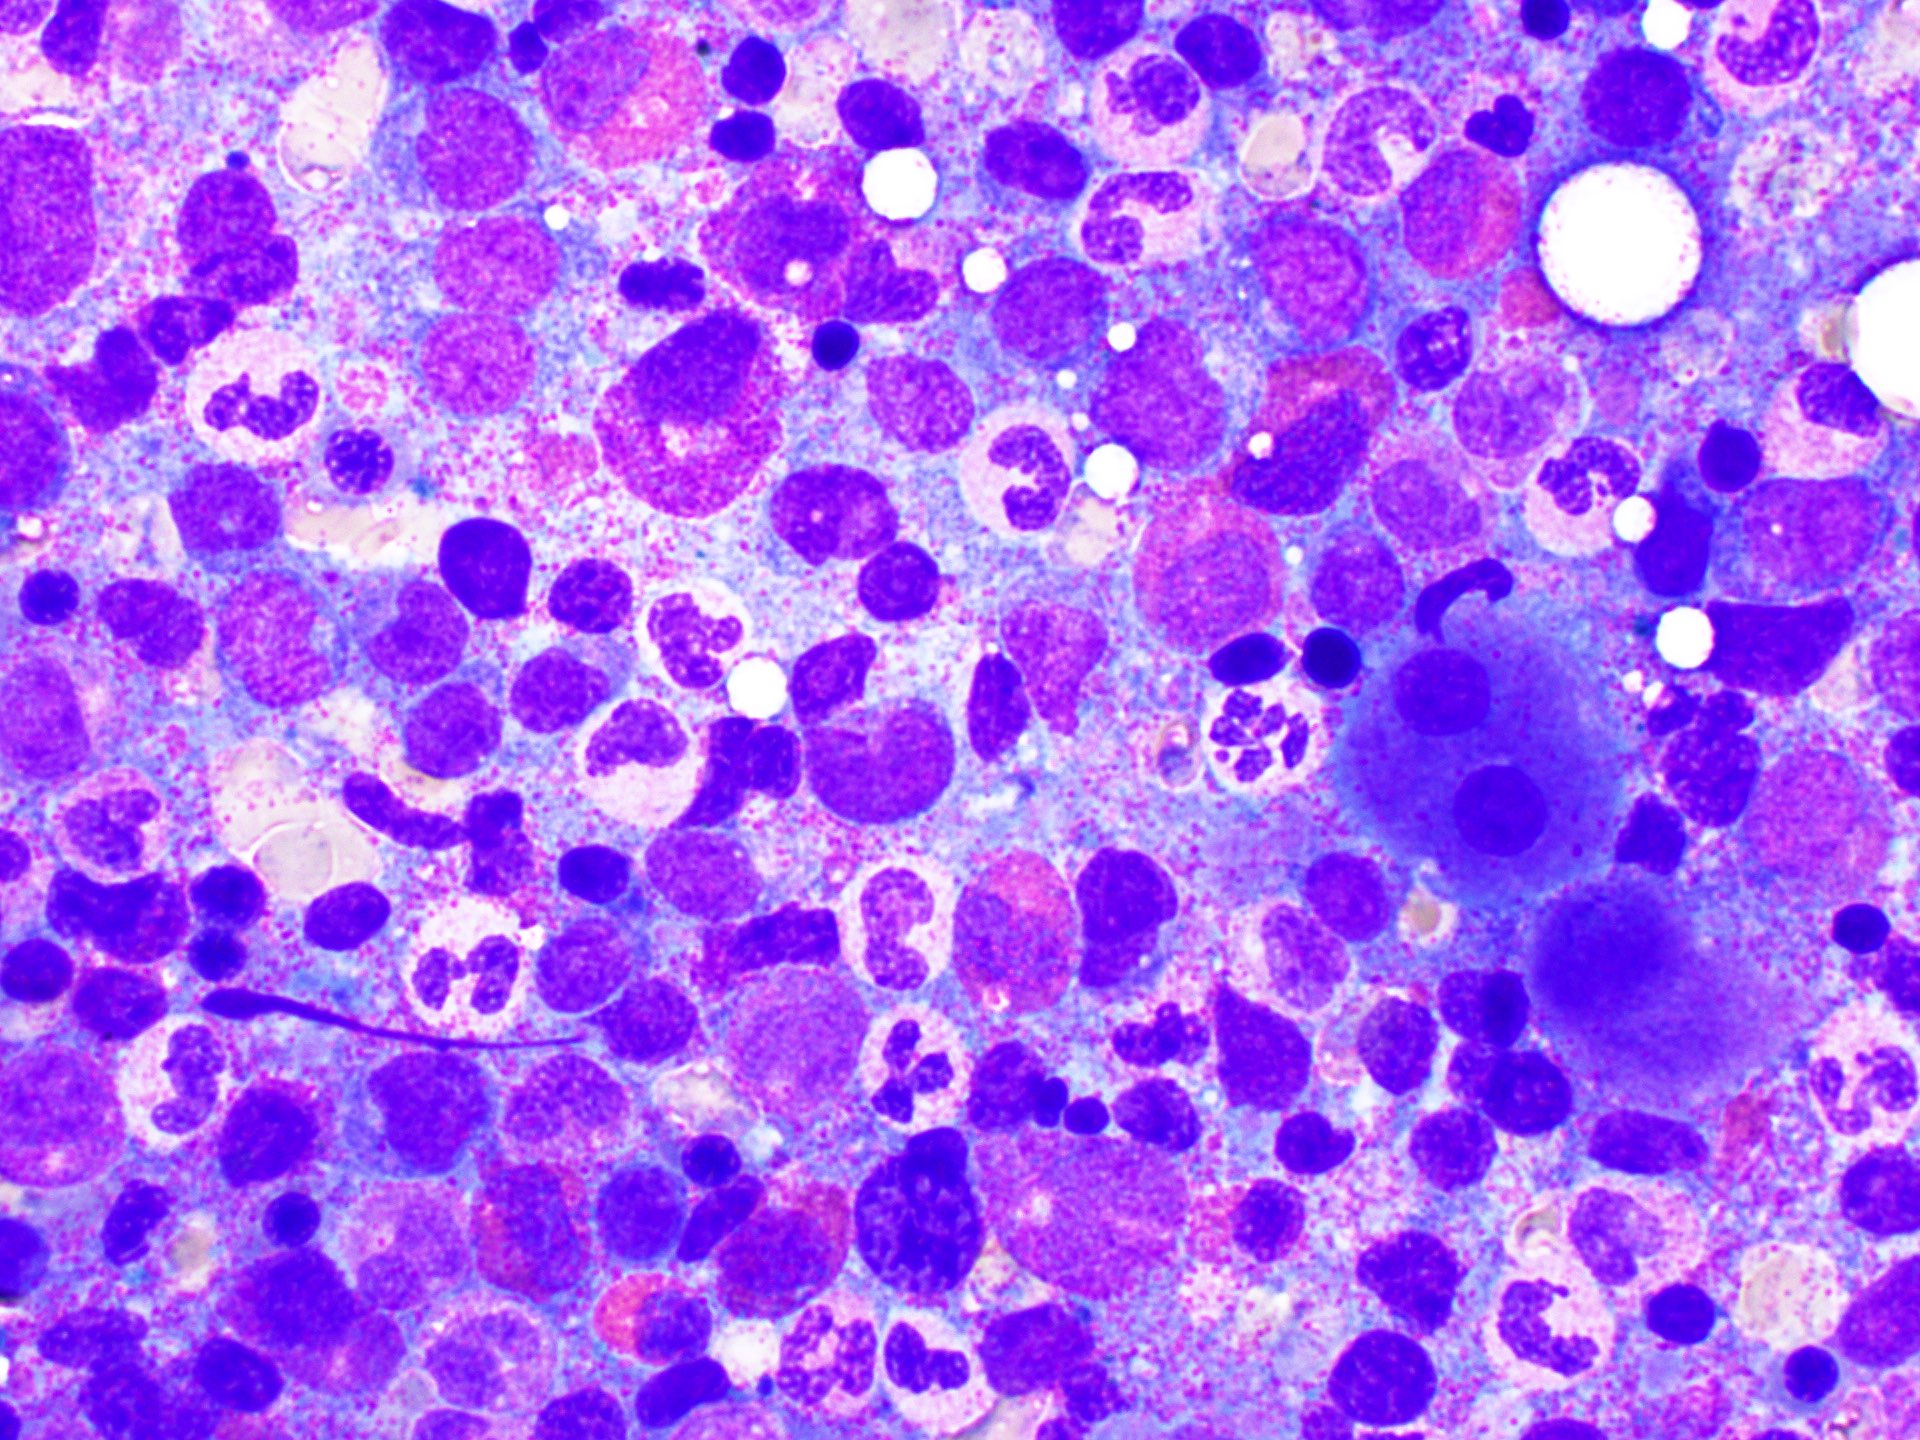
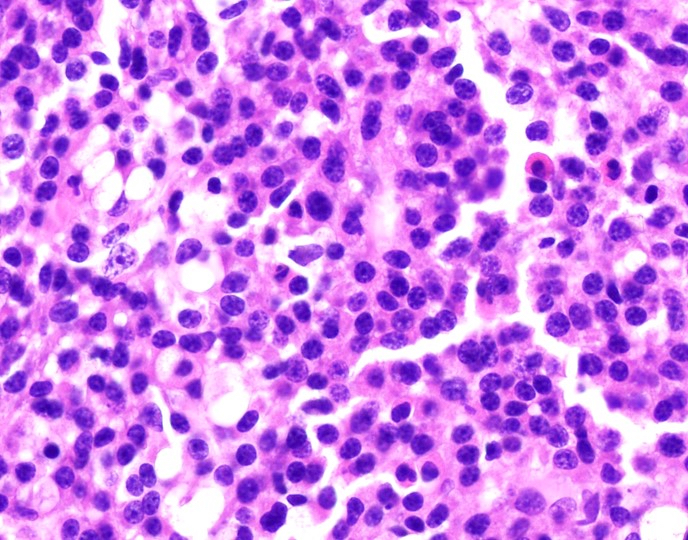
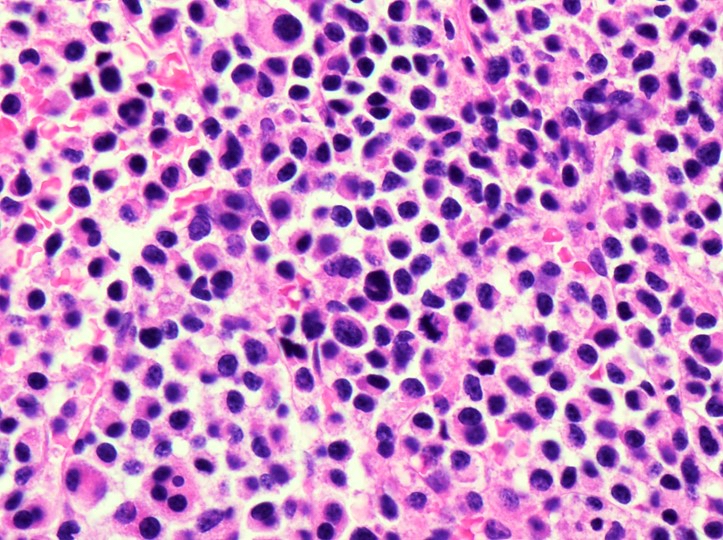
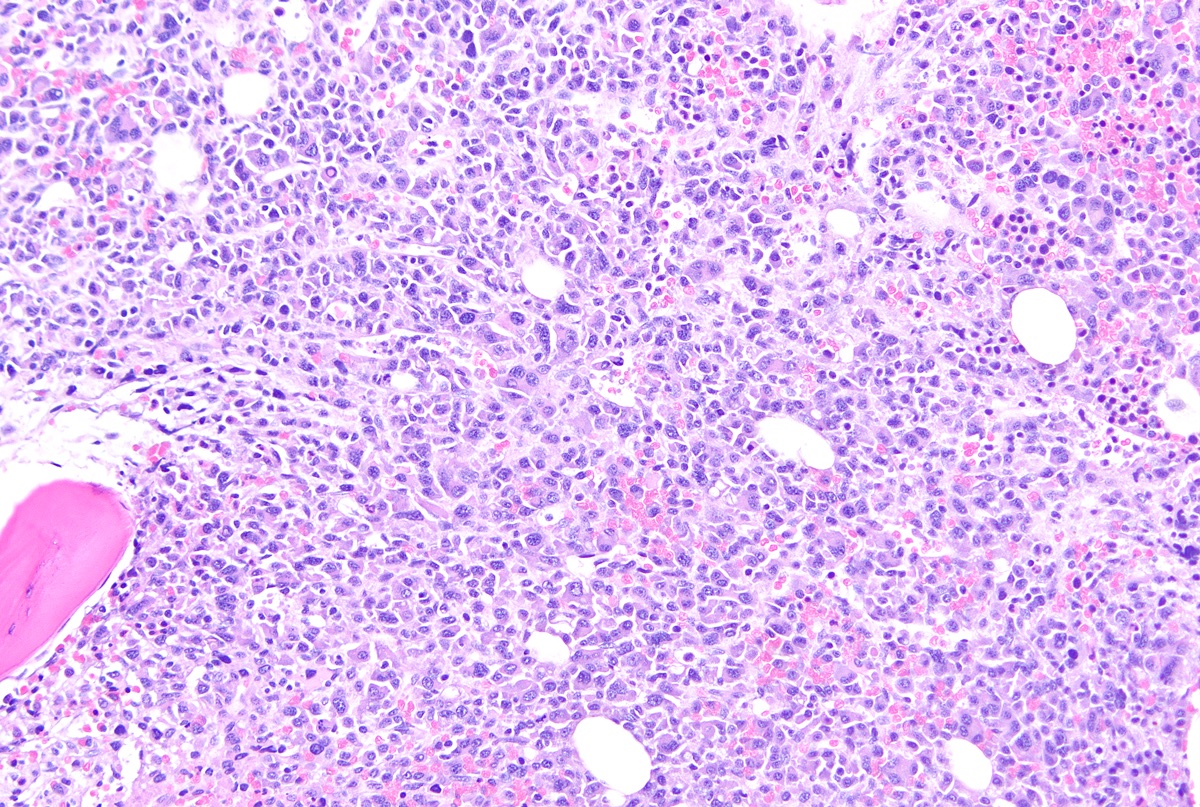
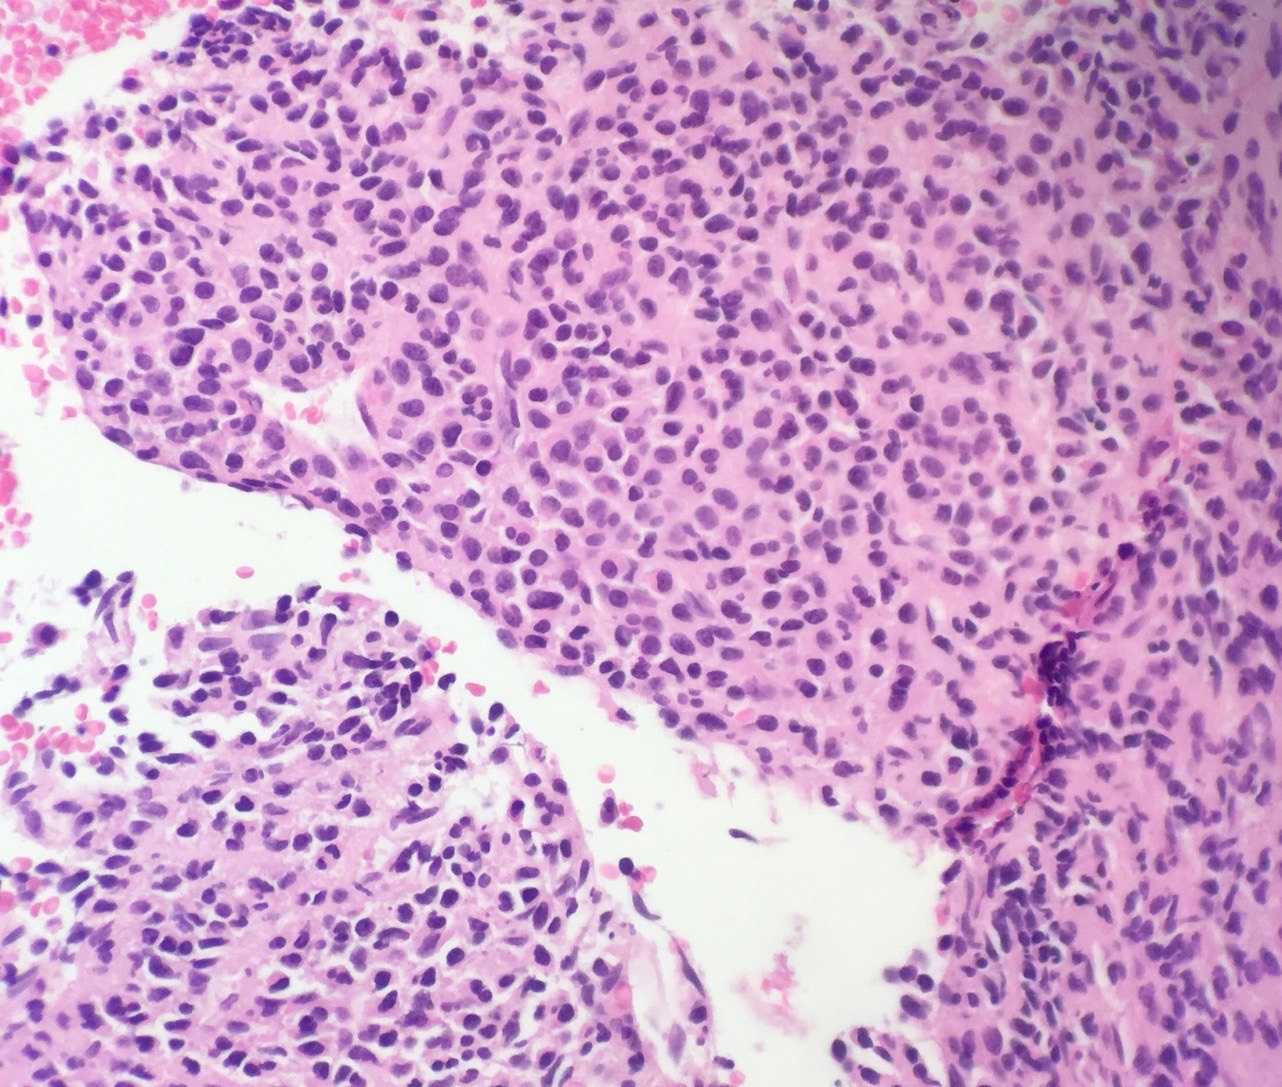
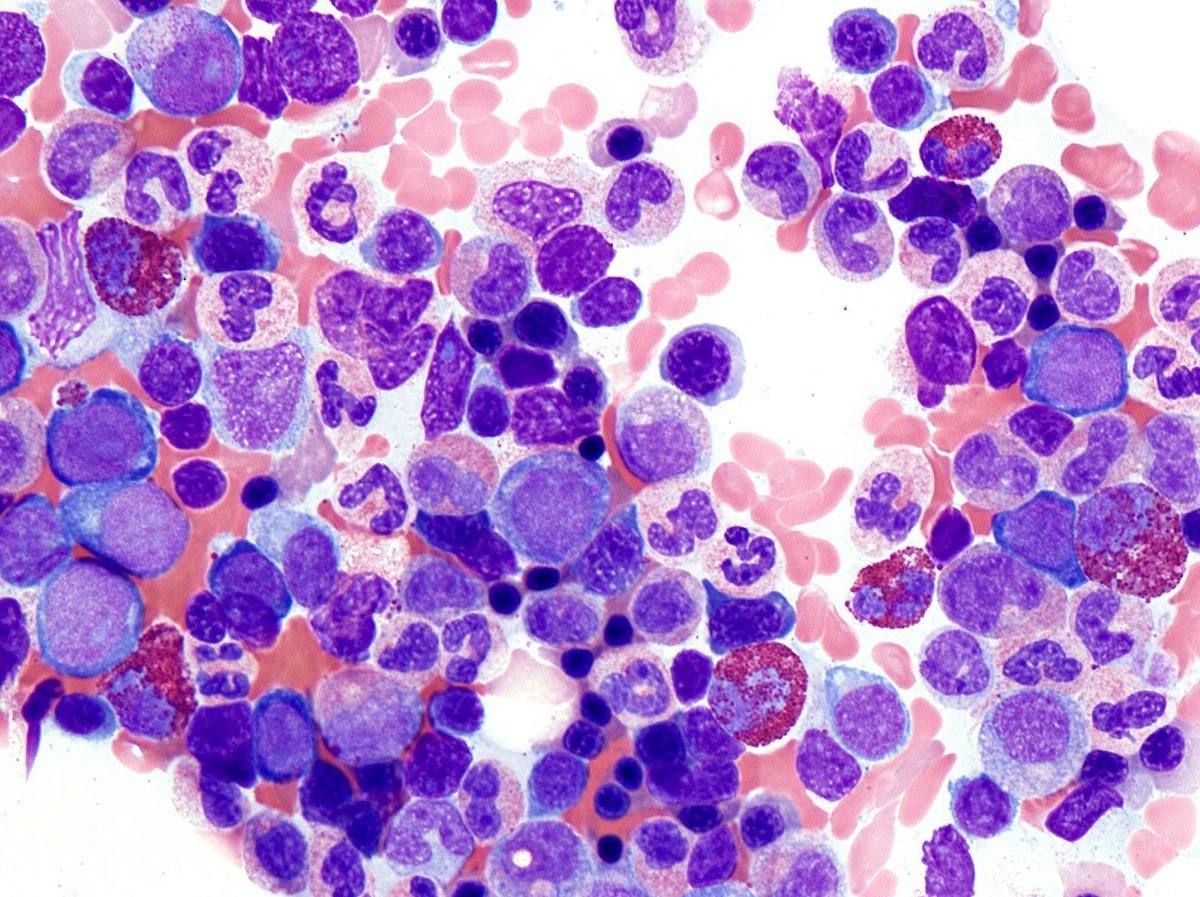
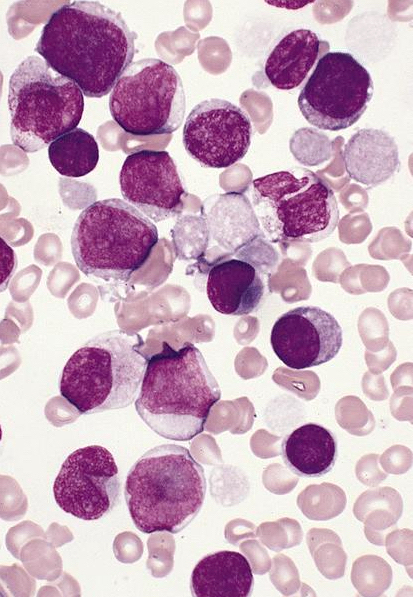
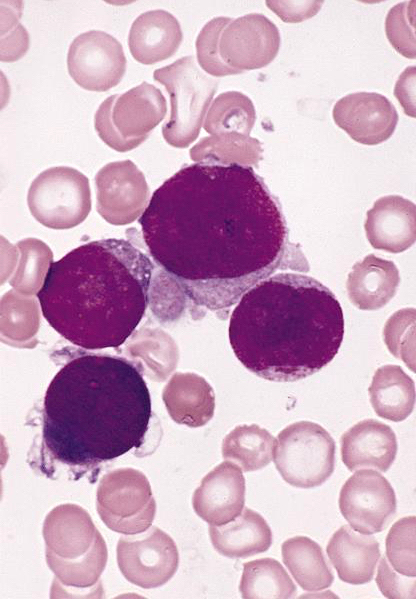
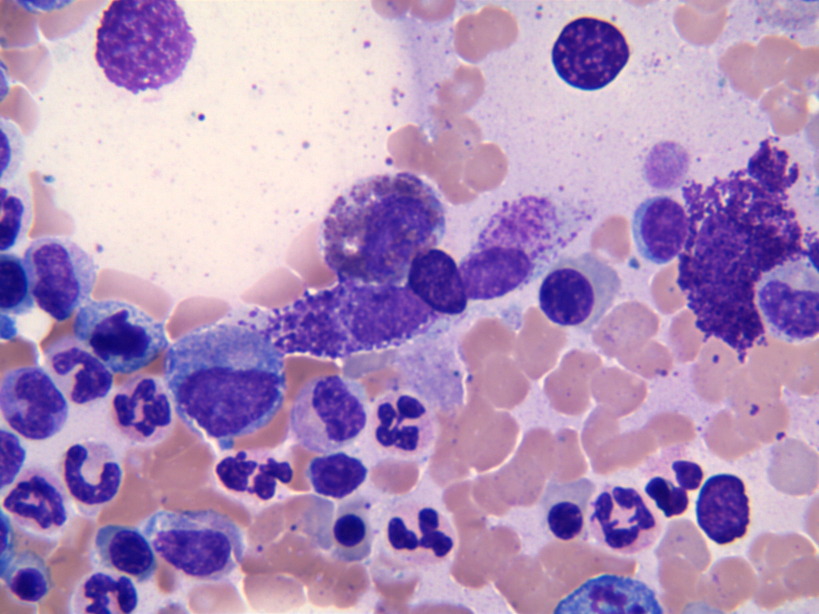
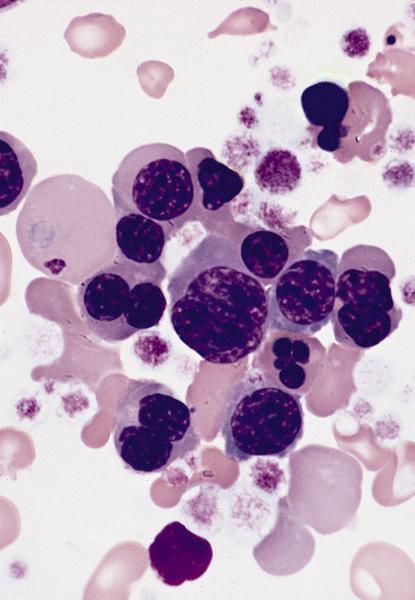
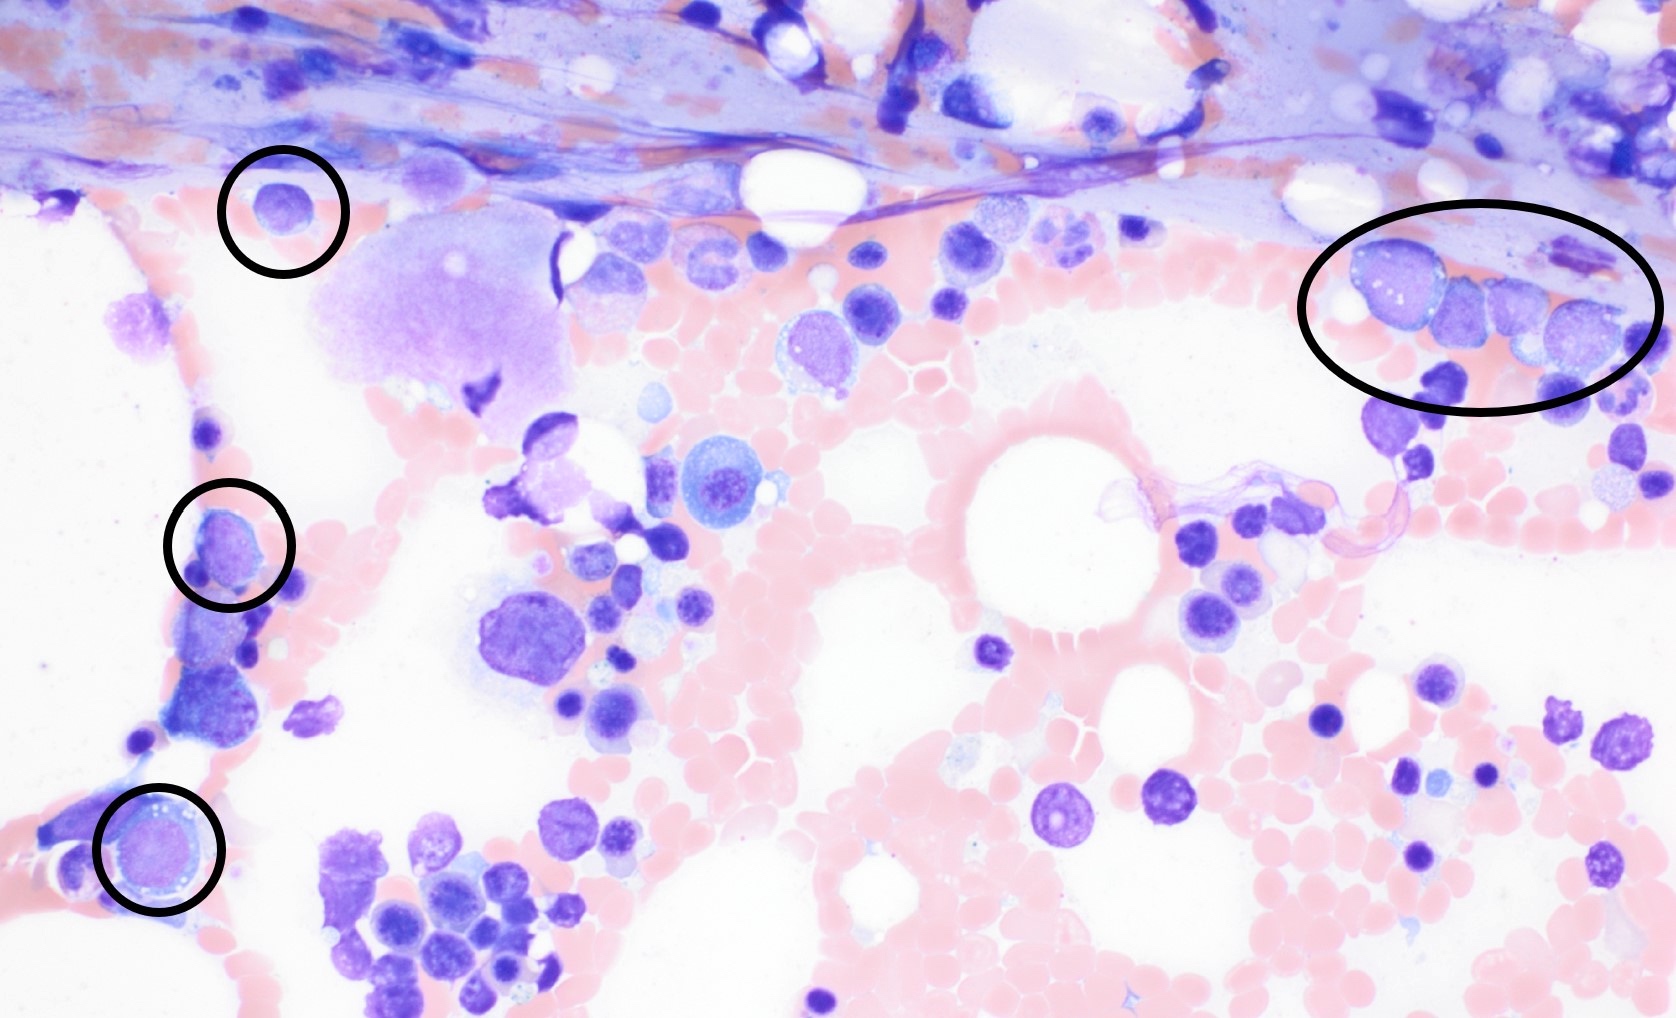
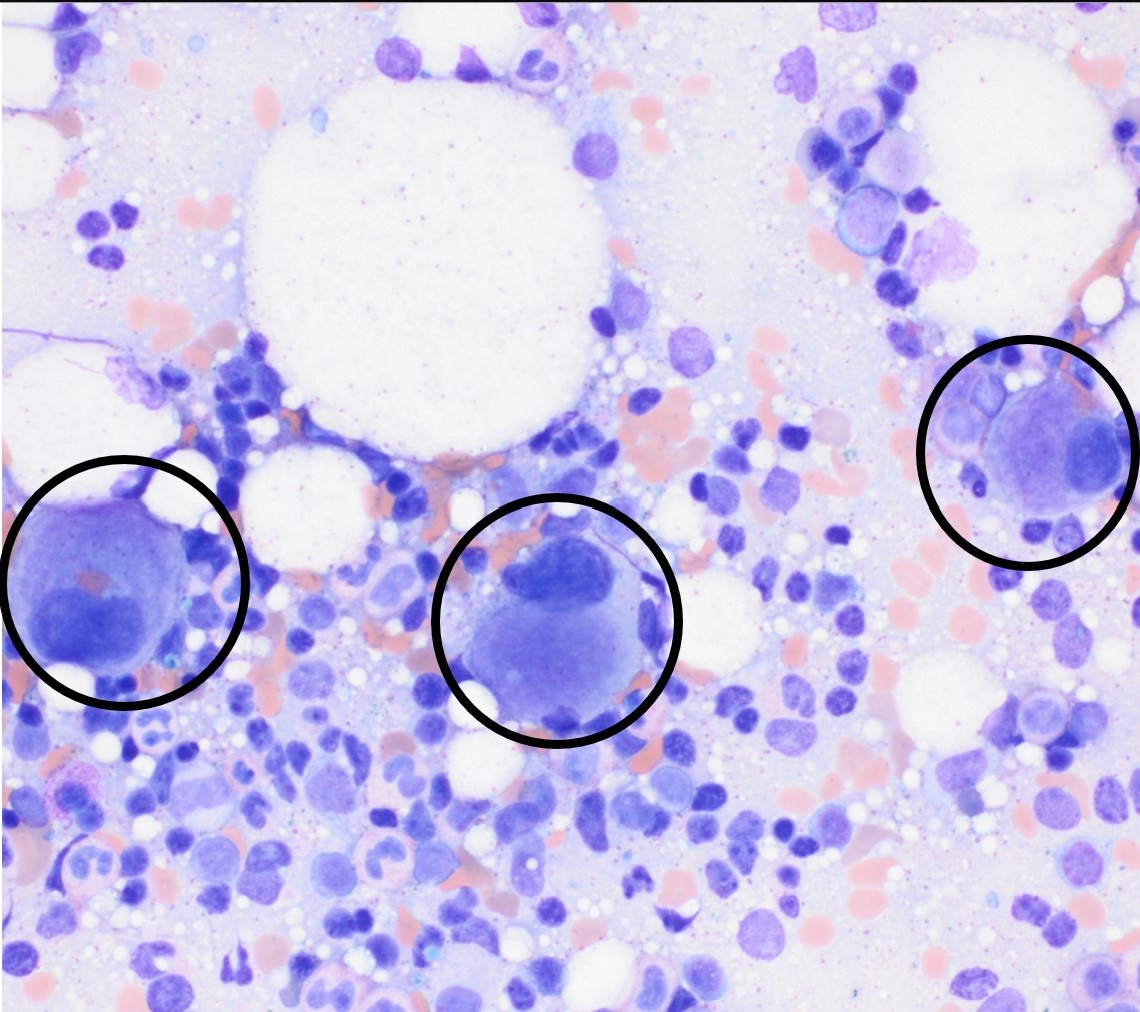
Promegakaryocytes and large blasts
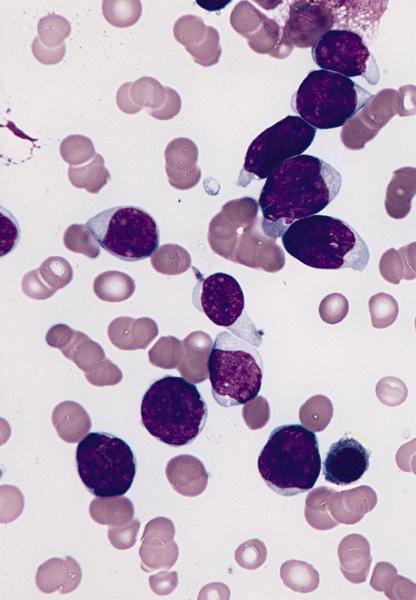
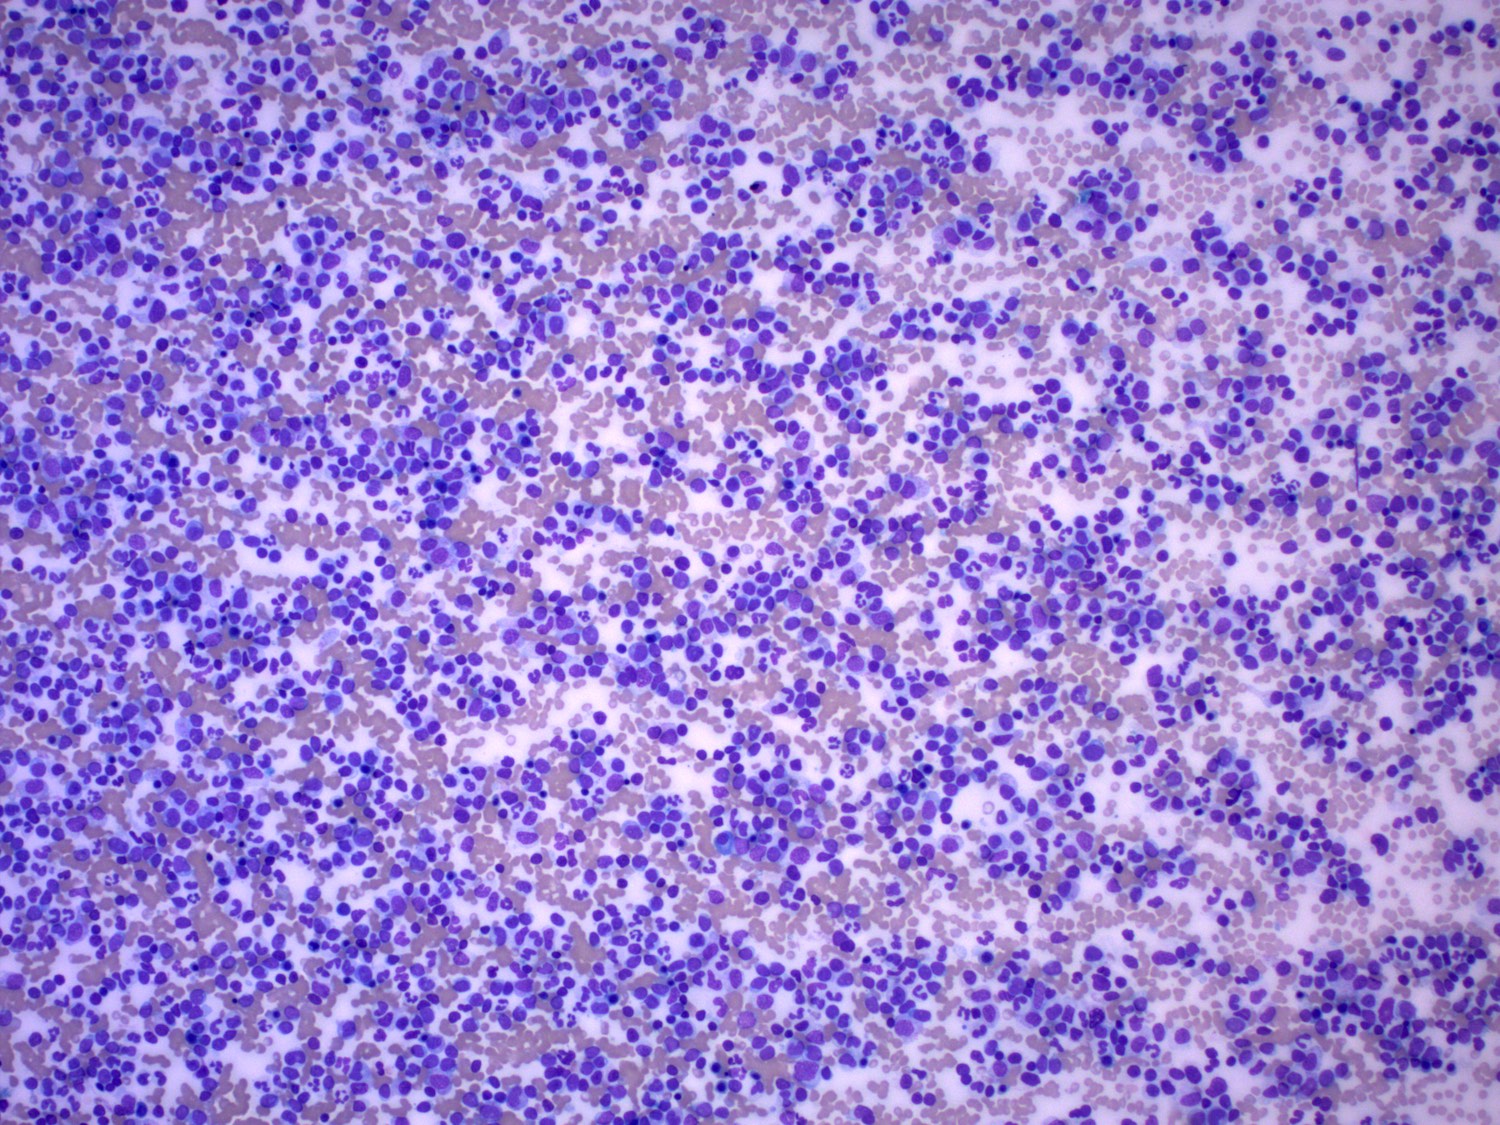
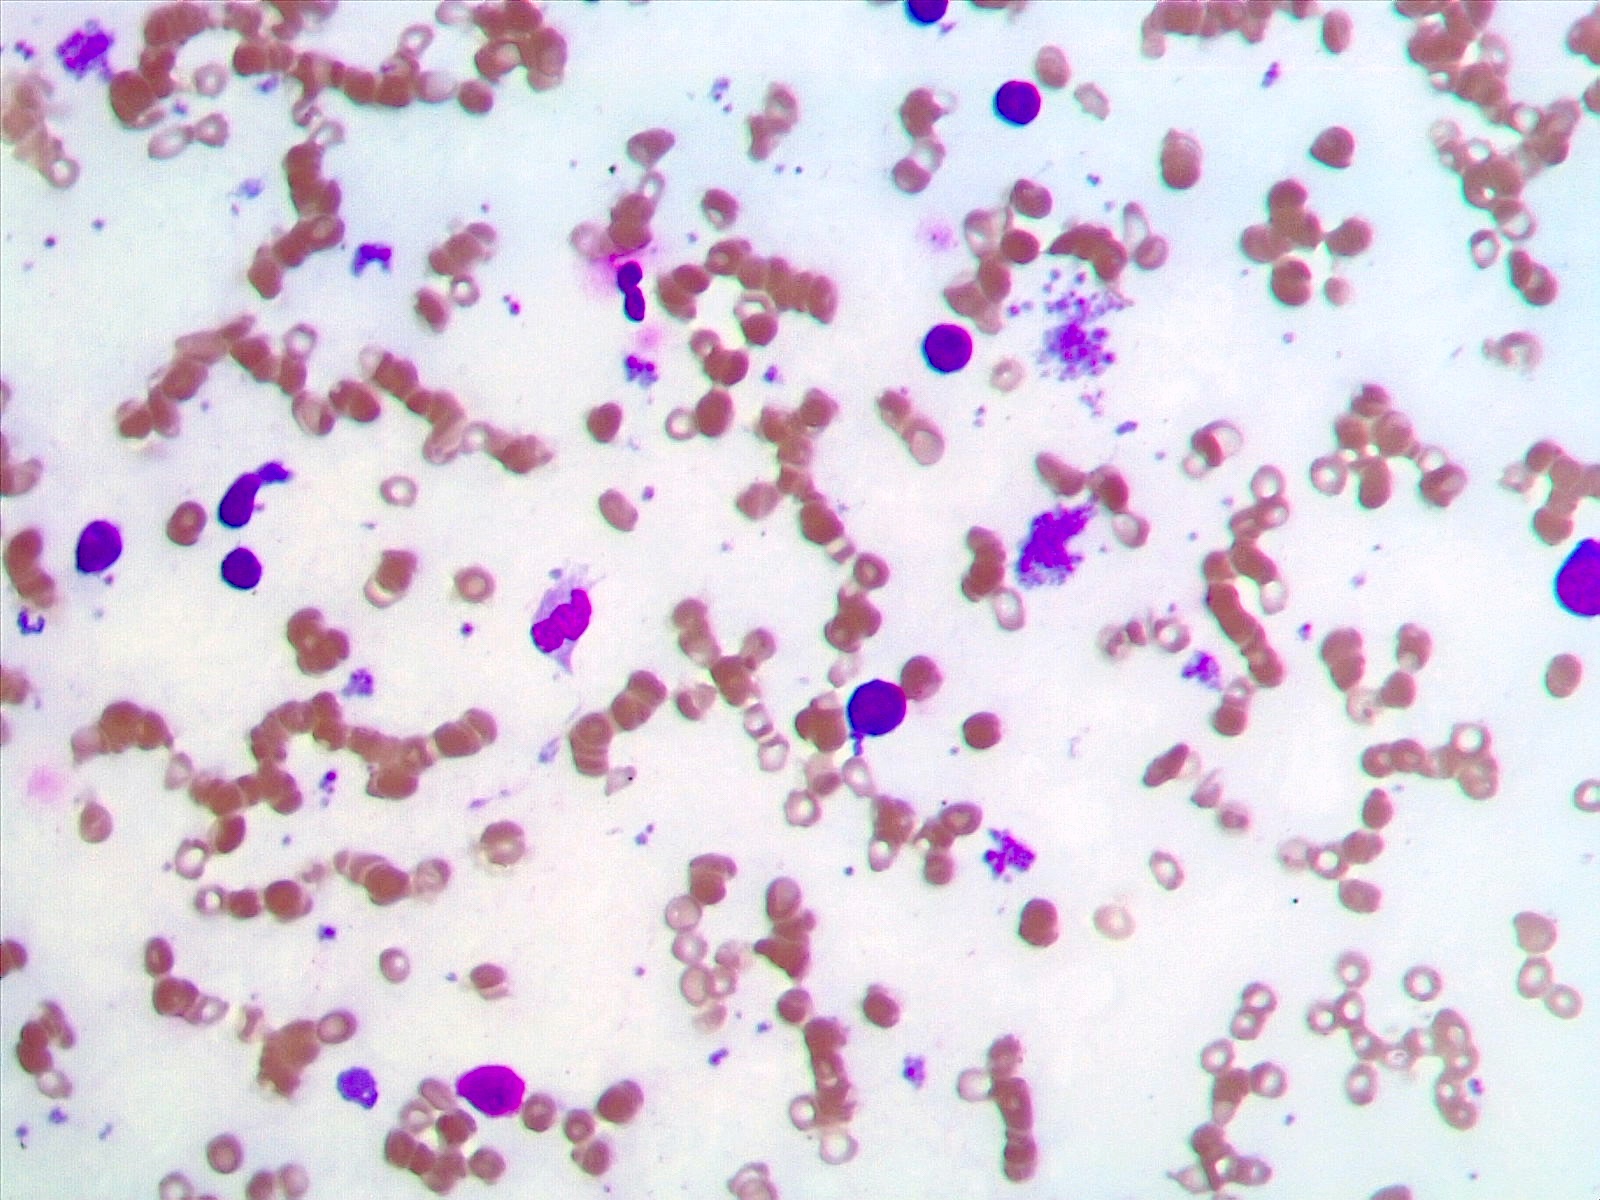
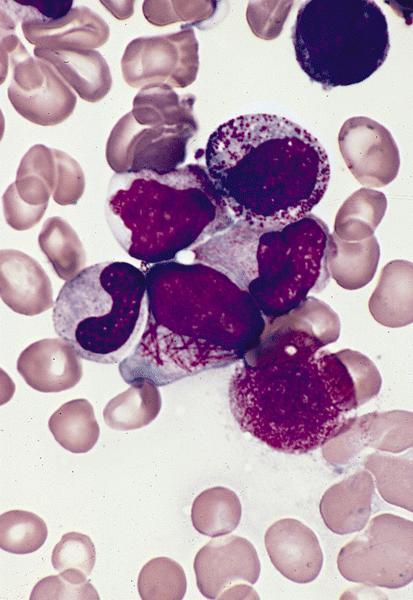
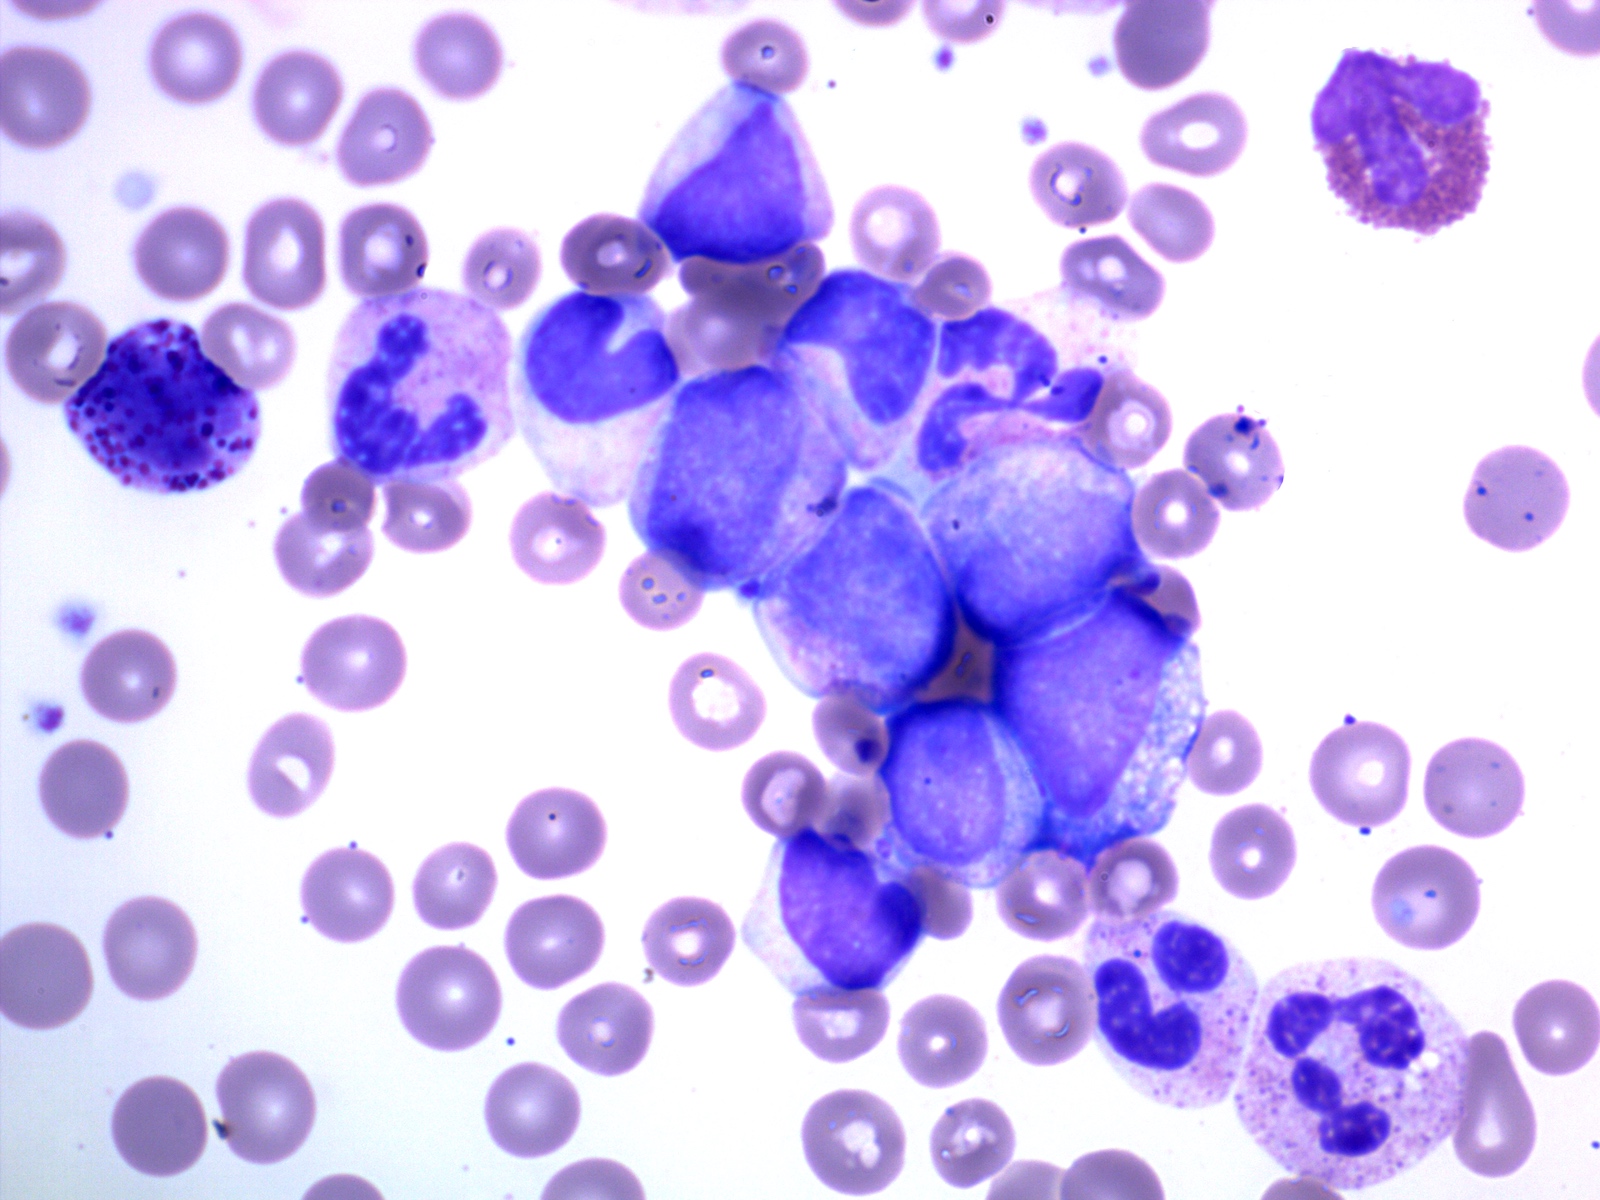
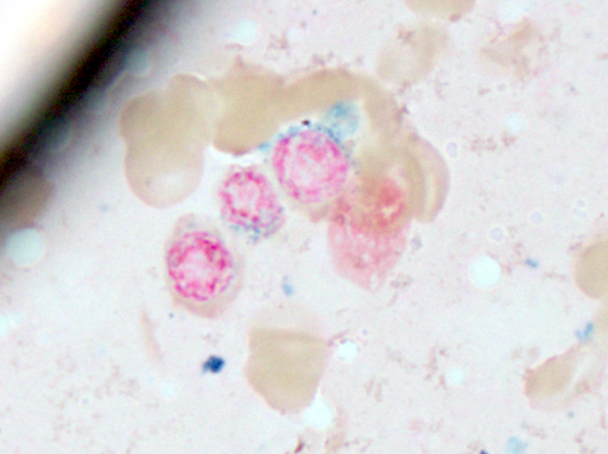
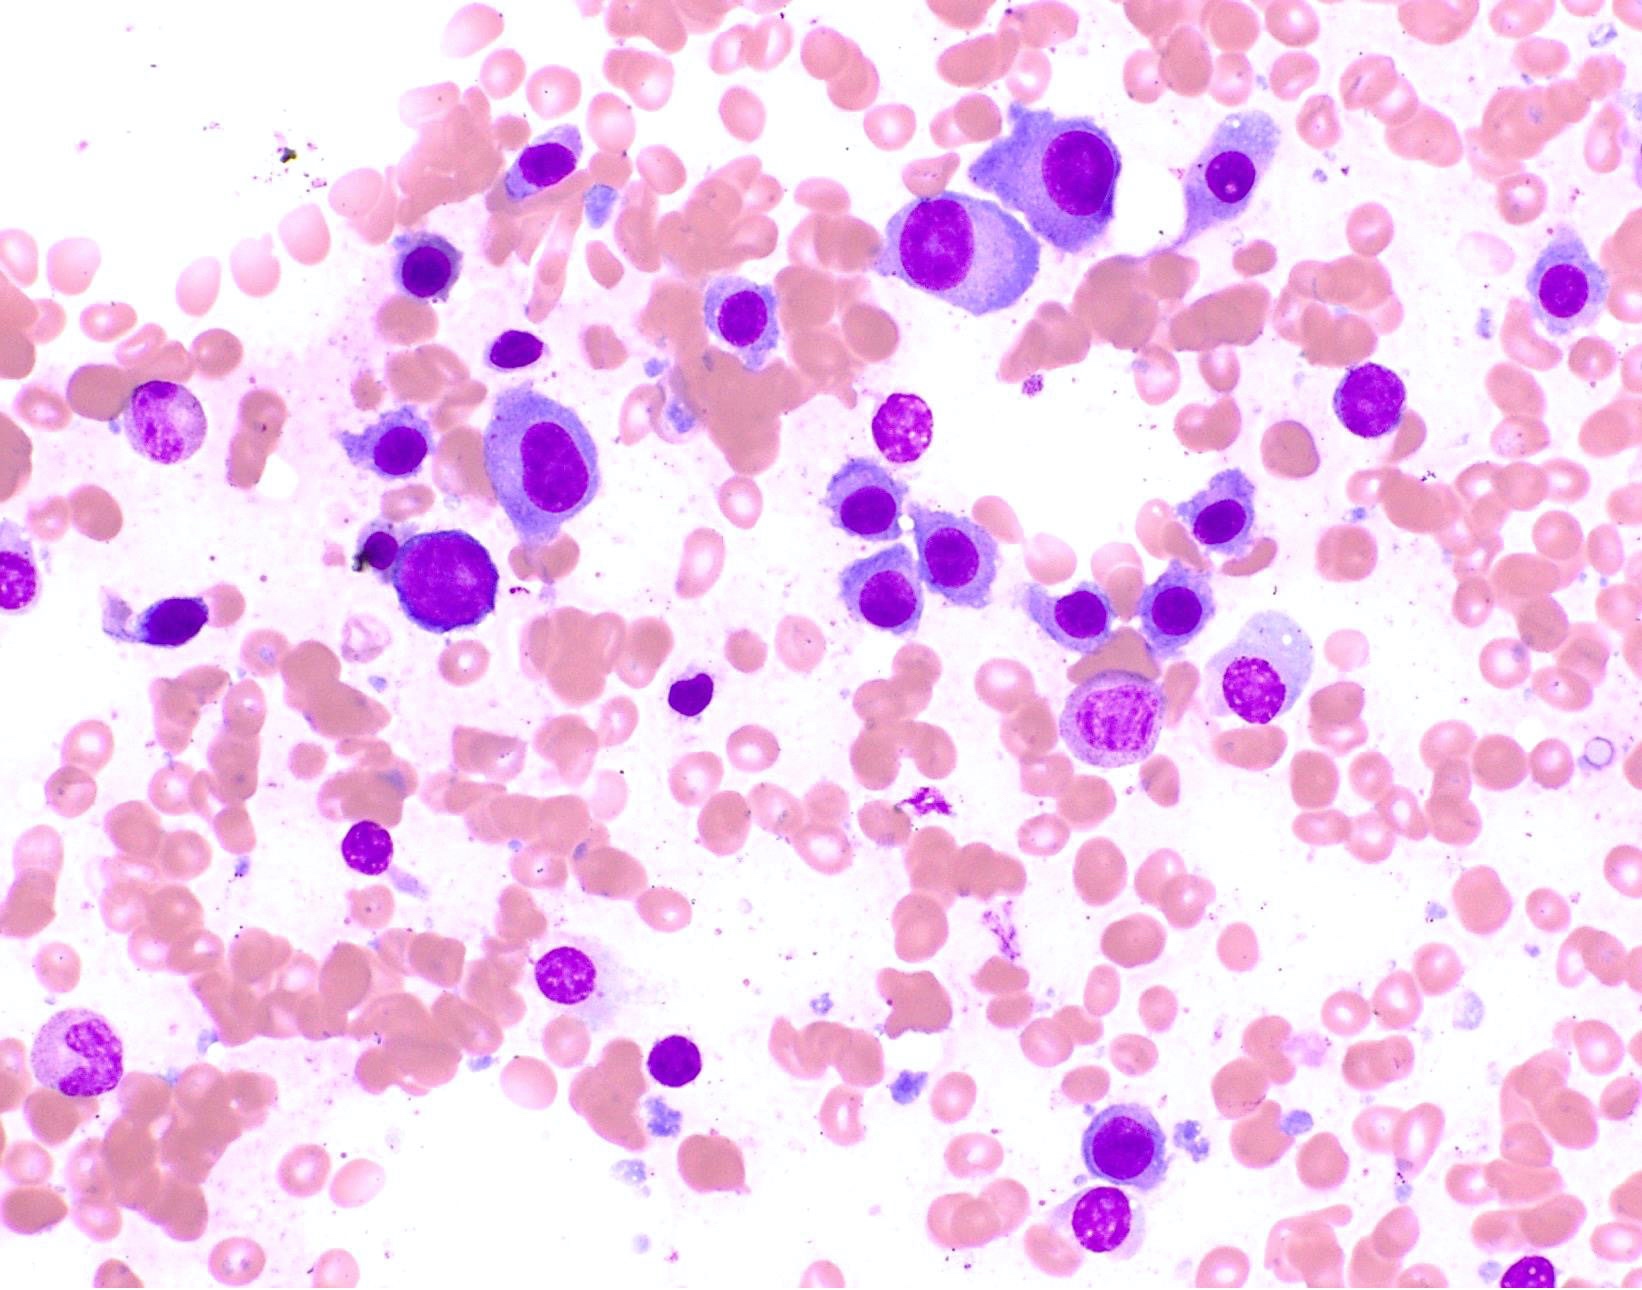
Touch prep shows 3 blasts
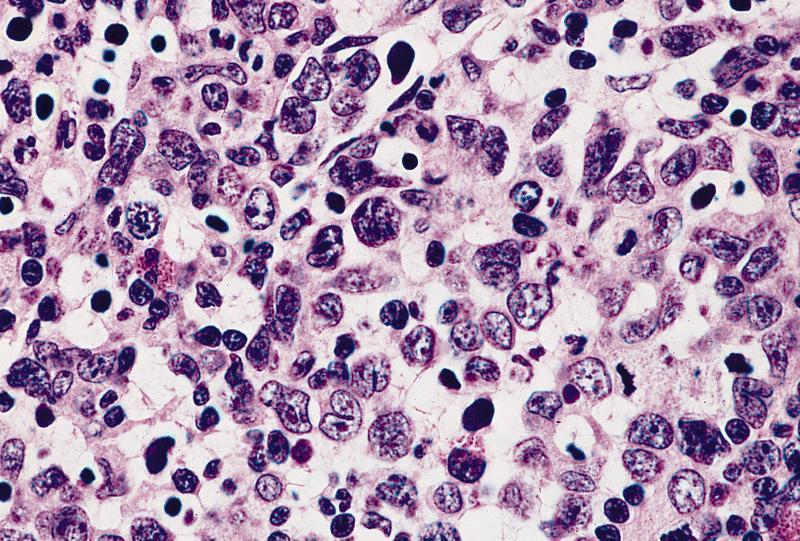
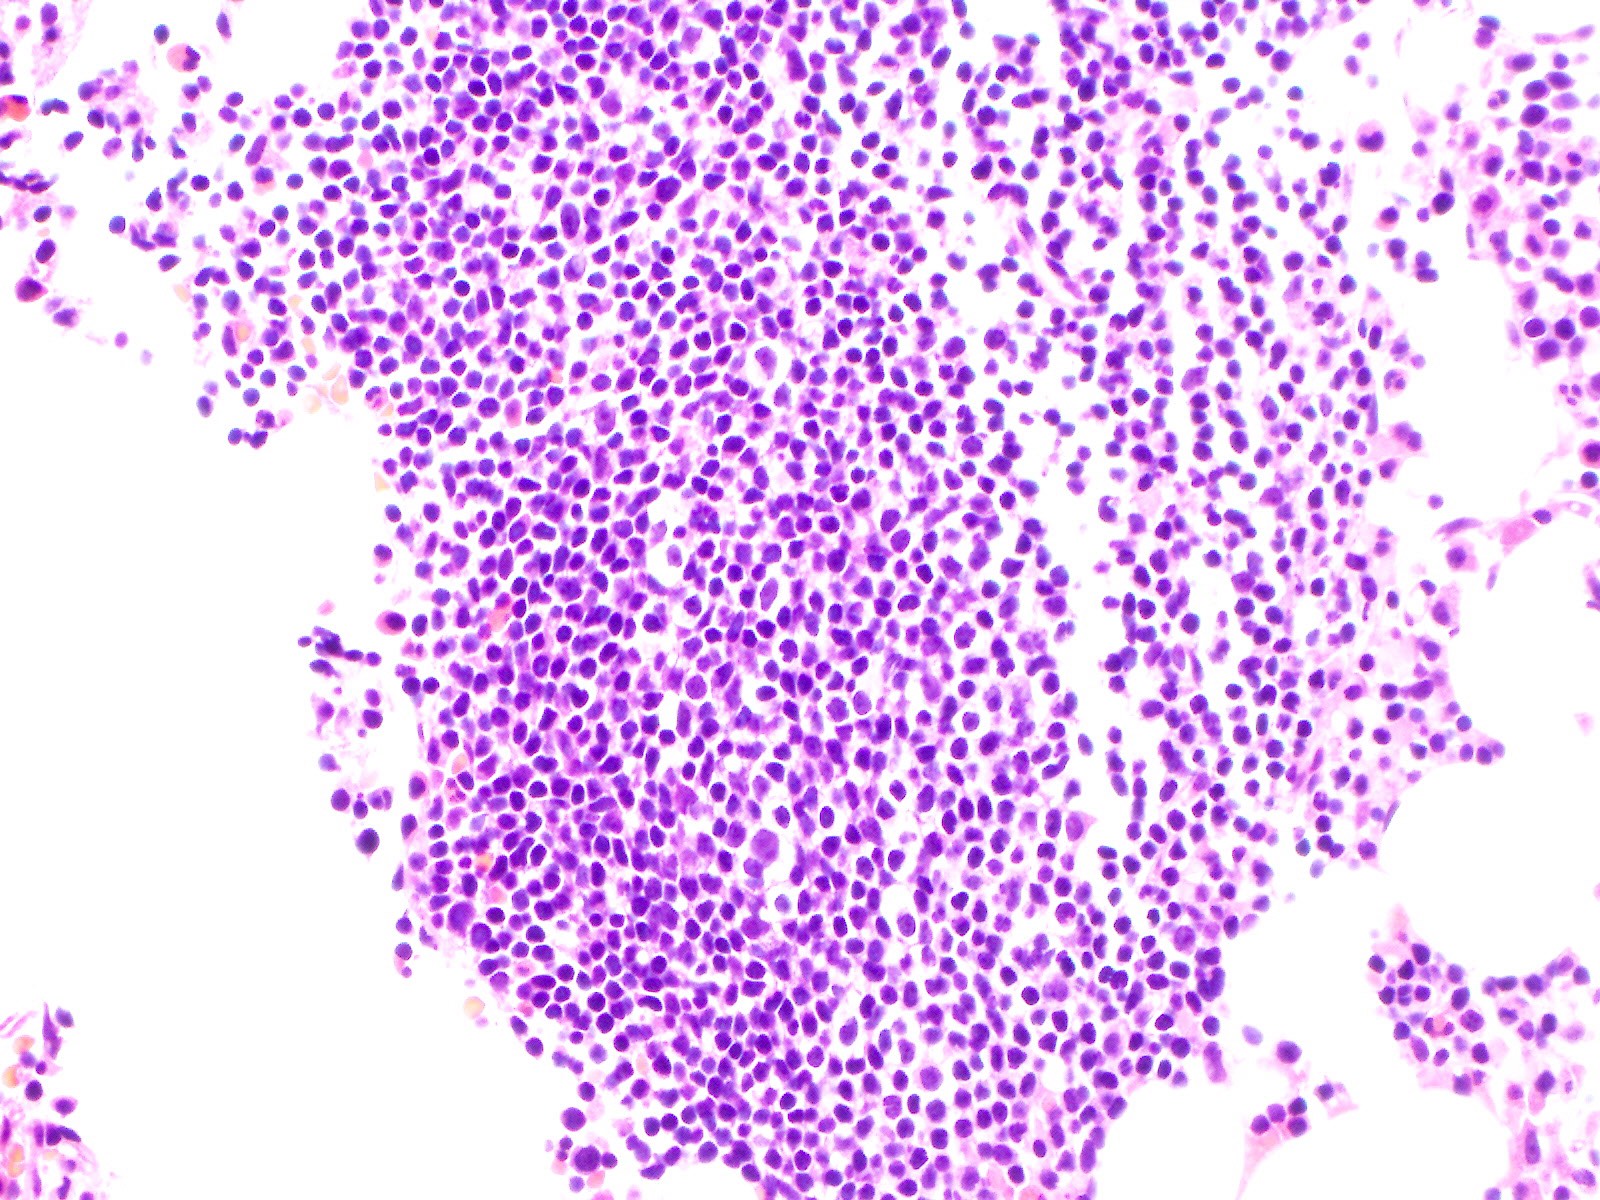
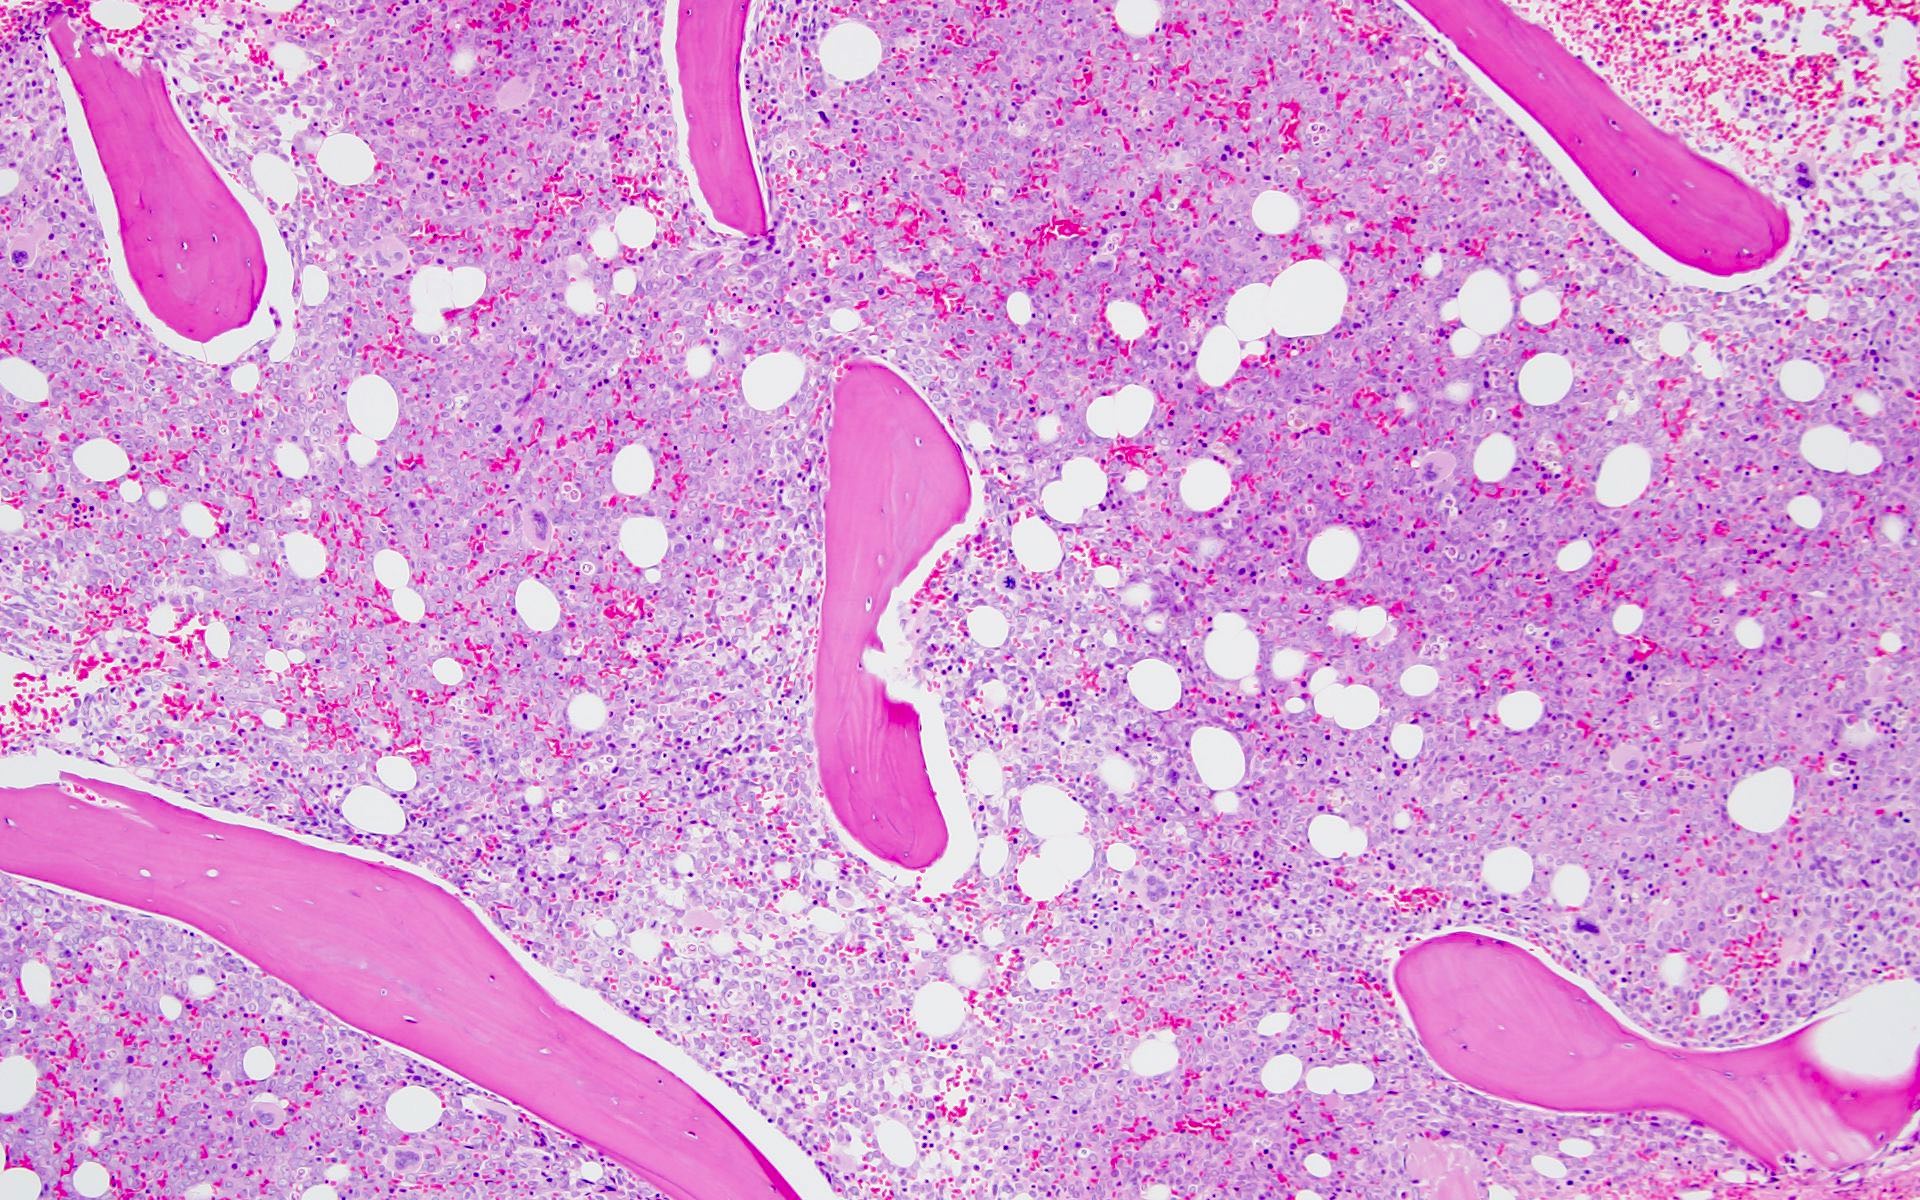
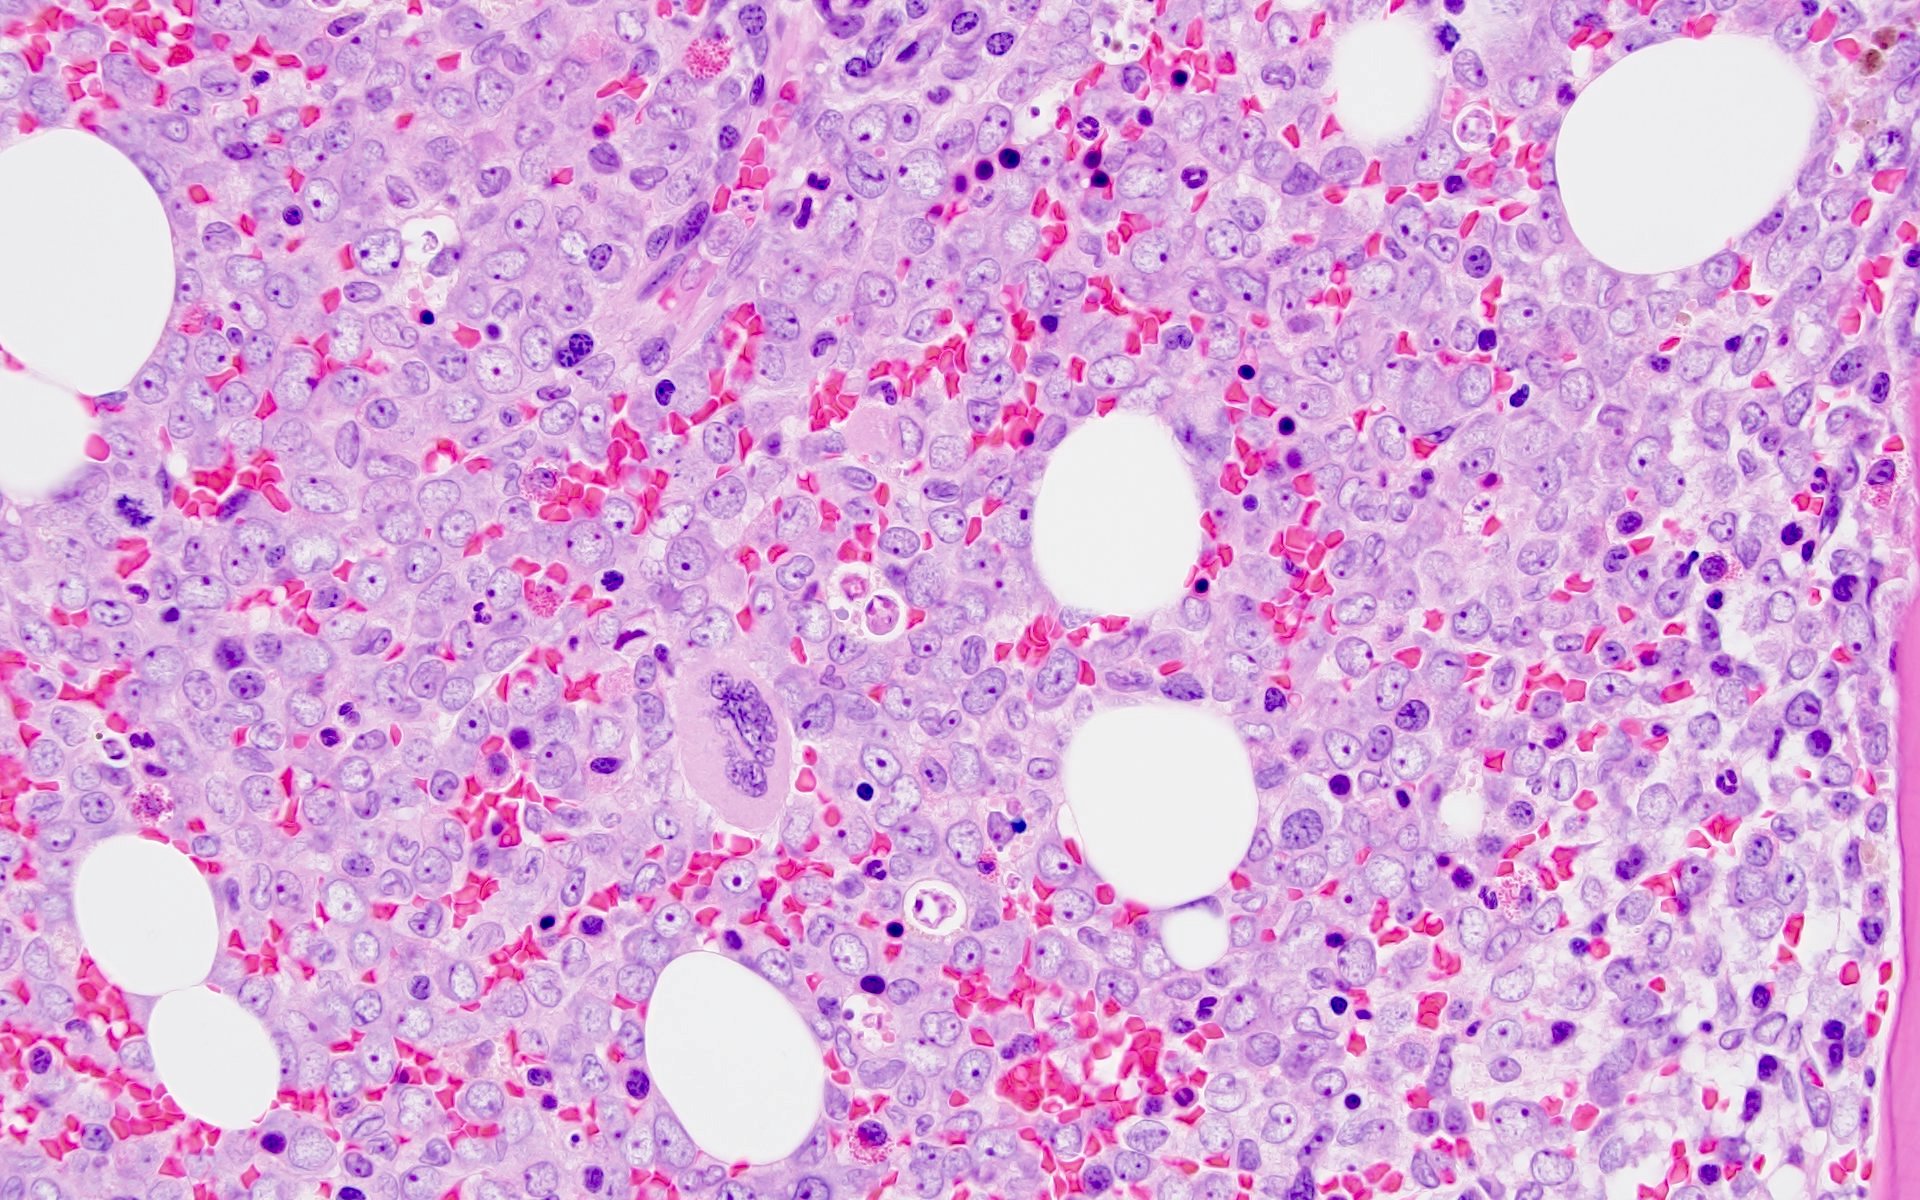
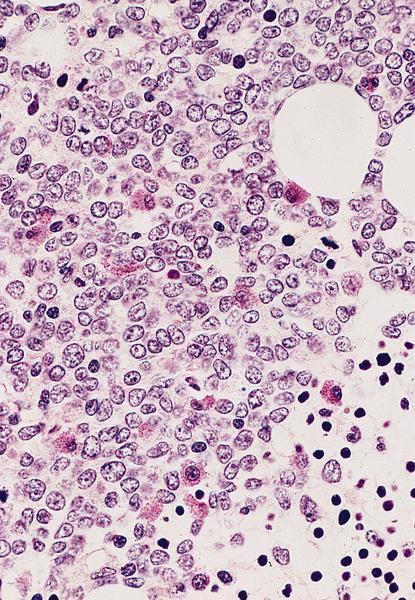
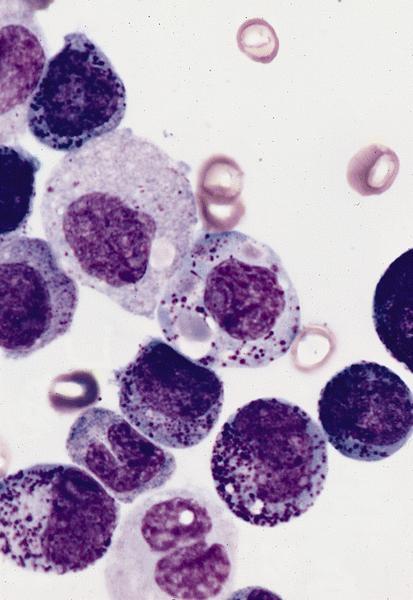
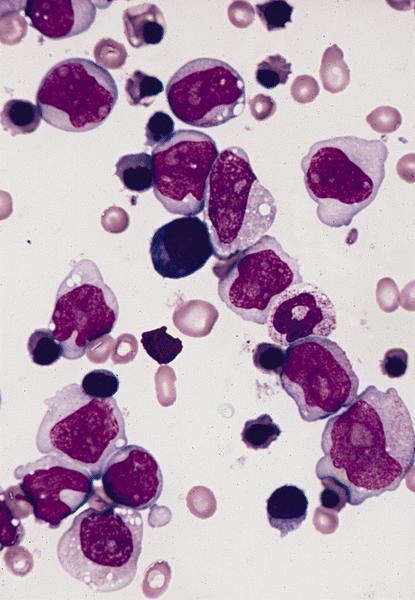
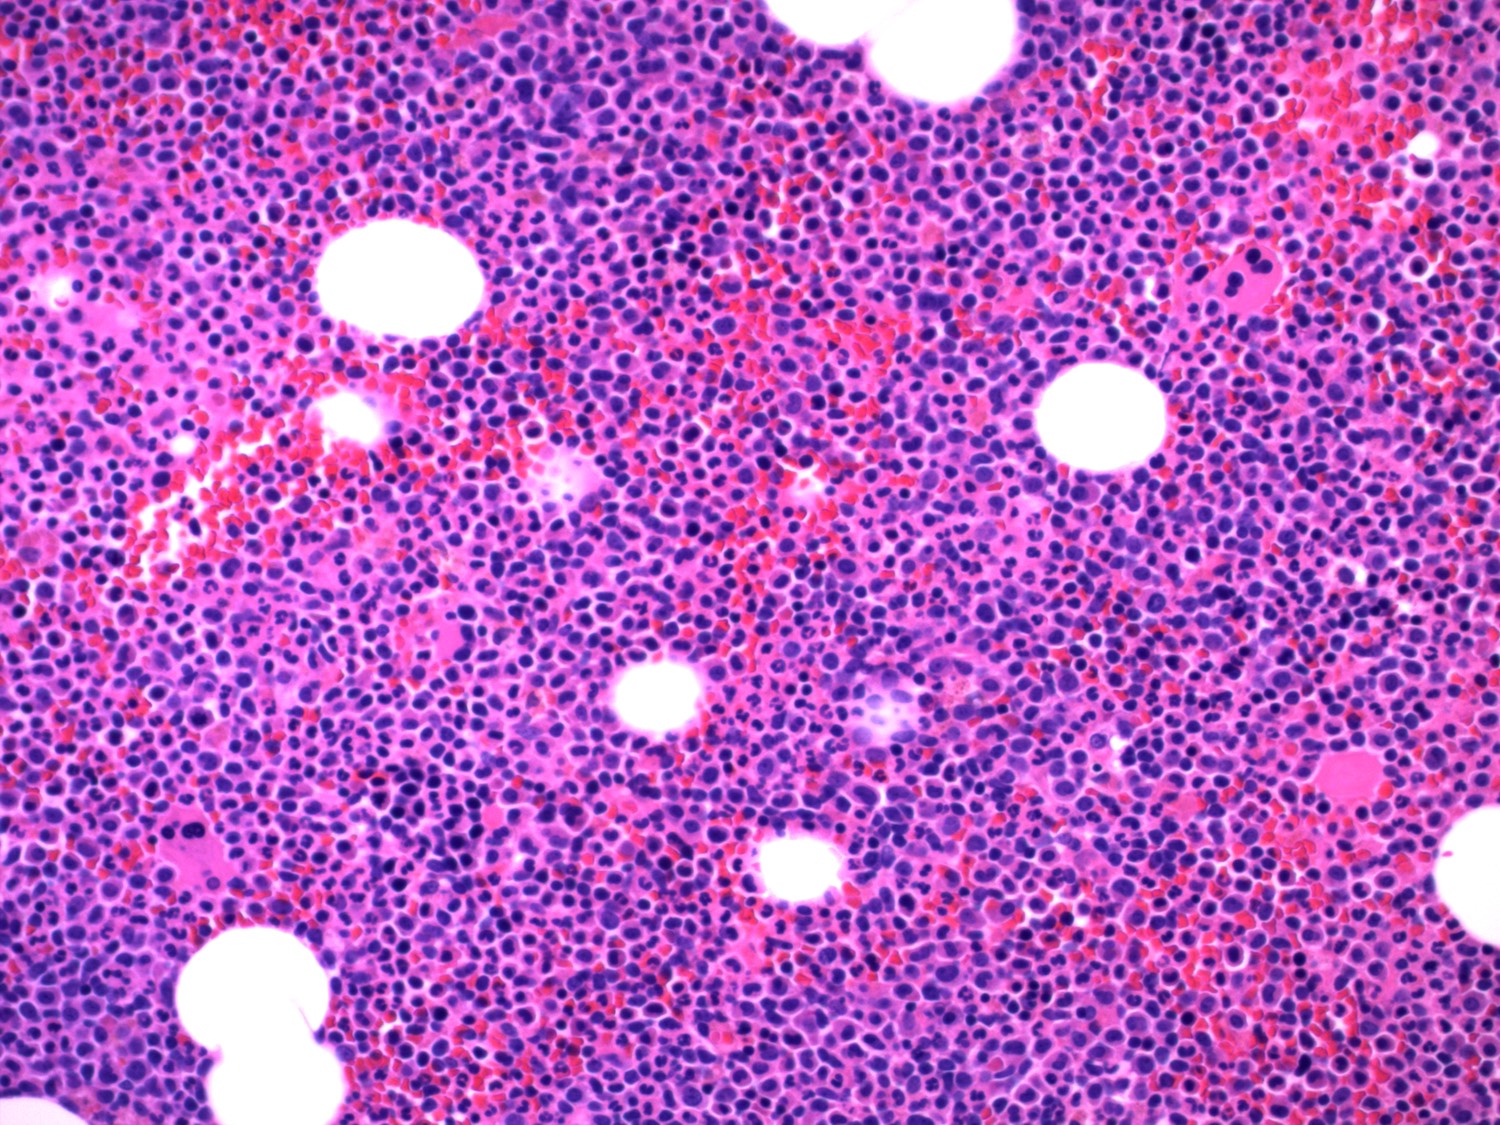
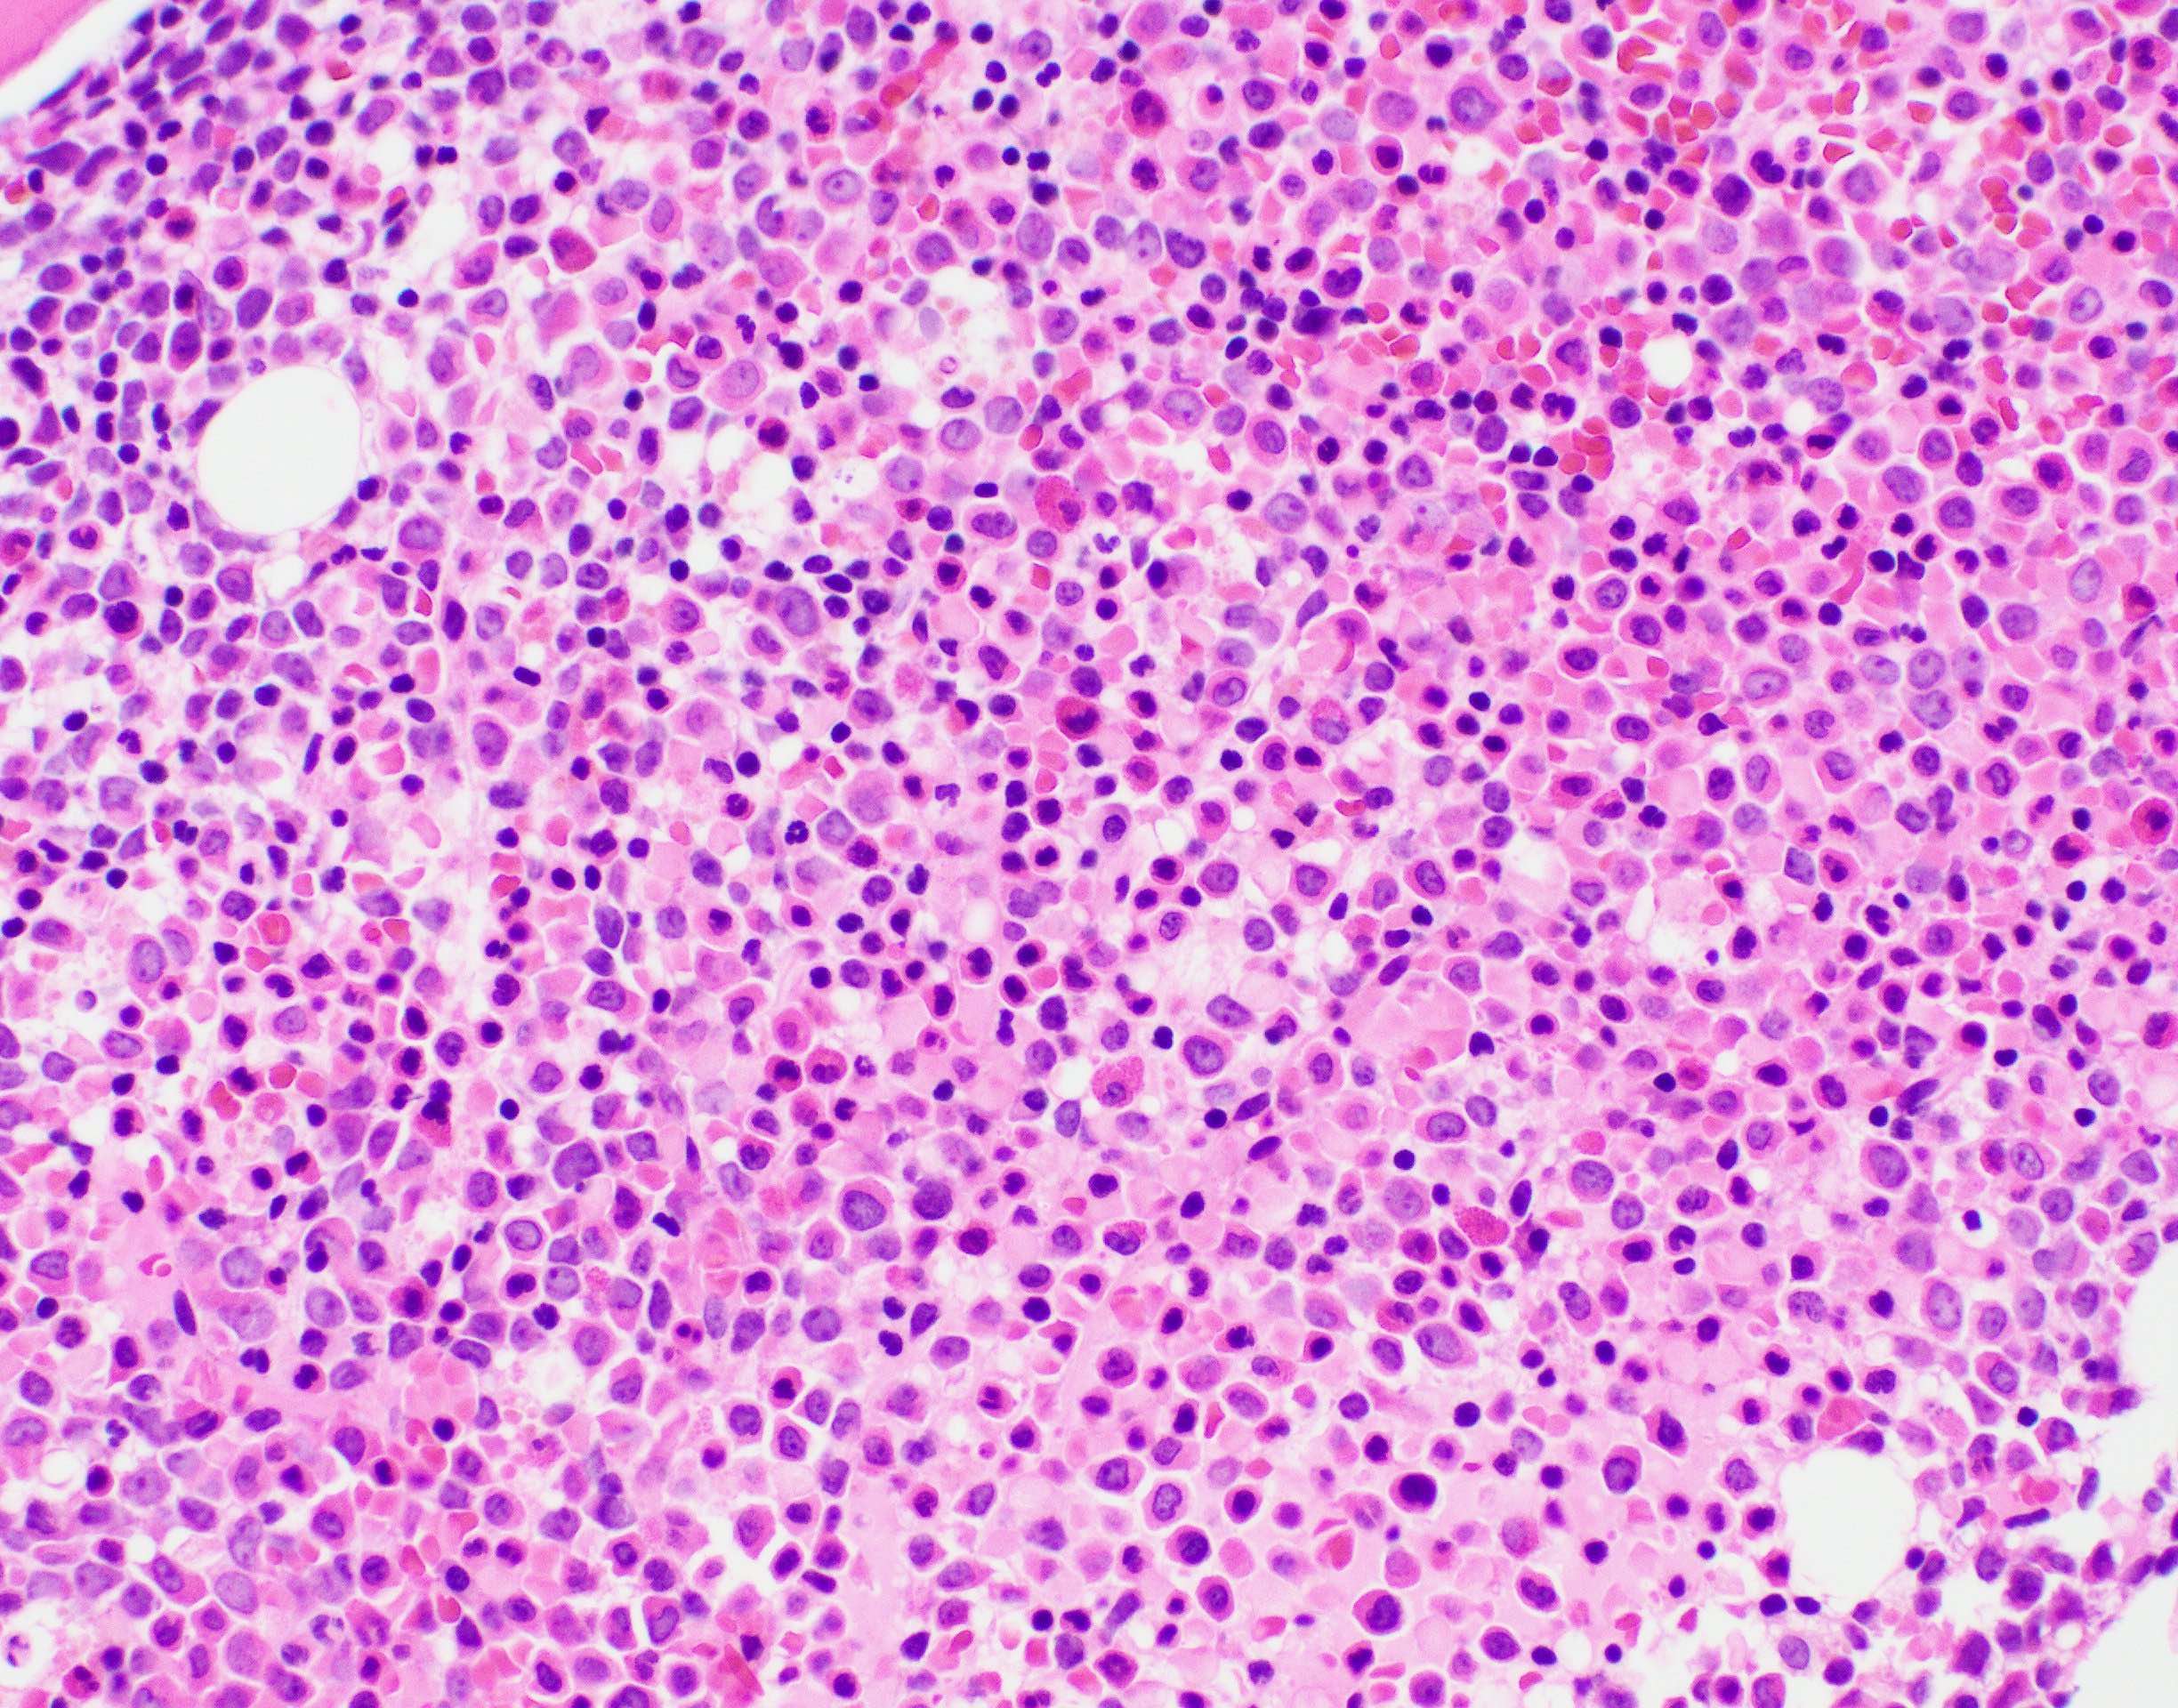
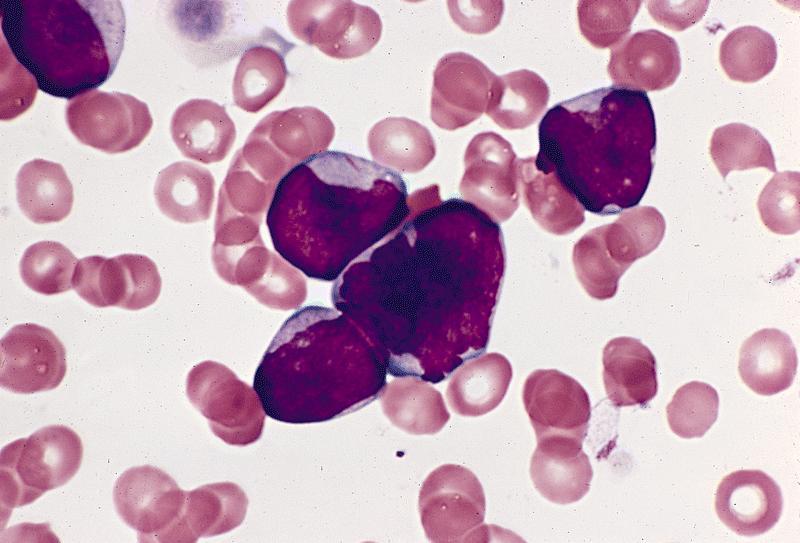
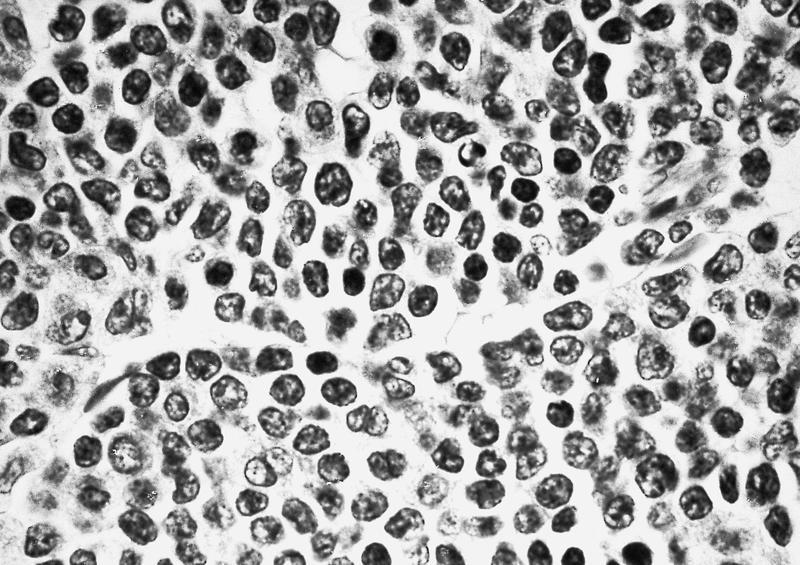
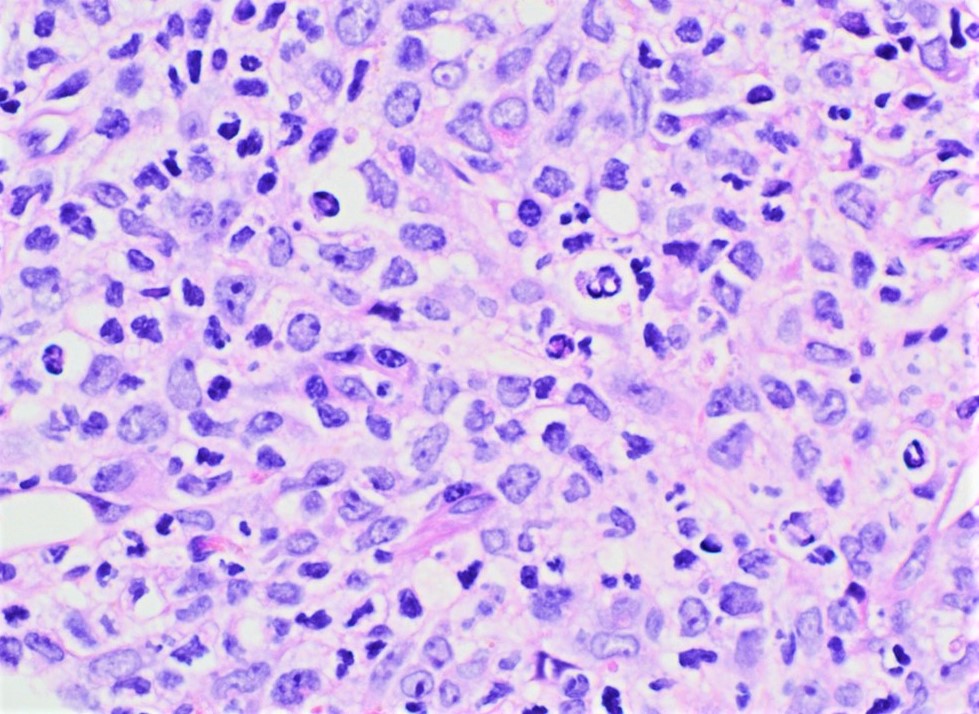
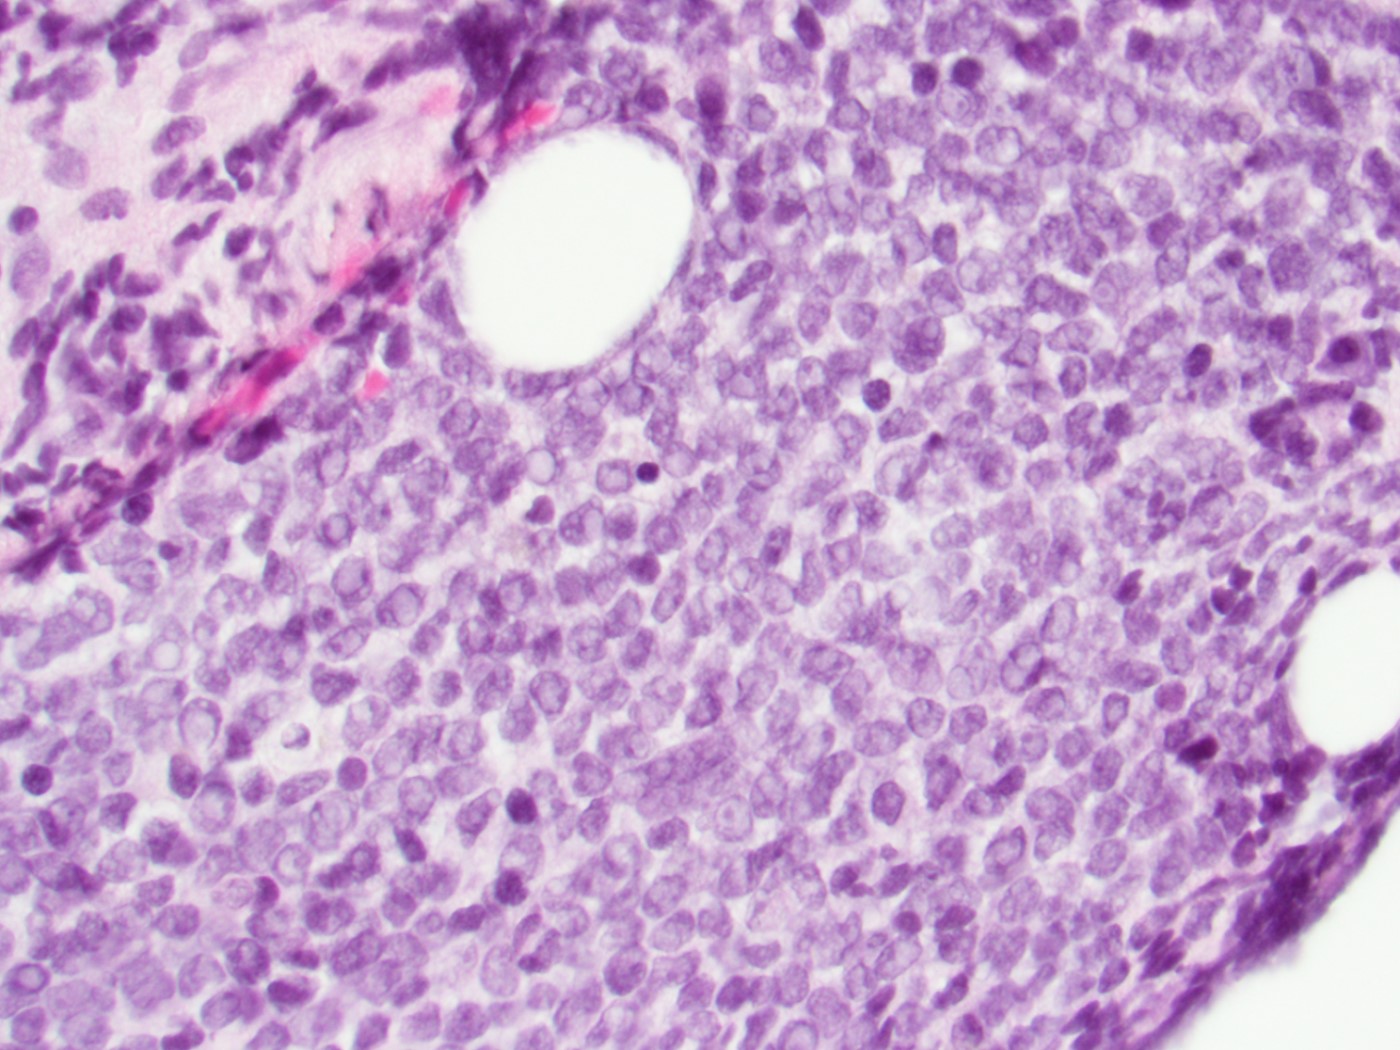
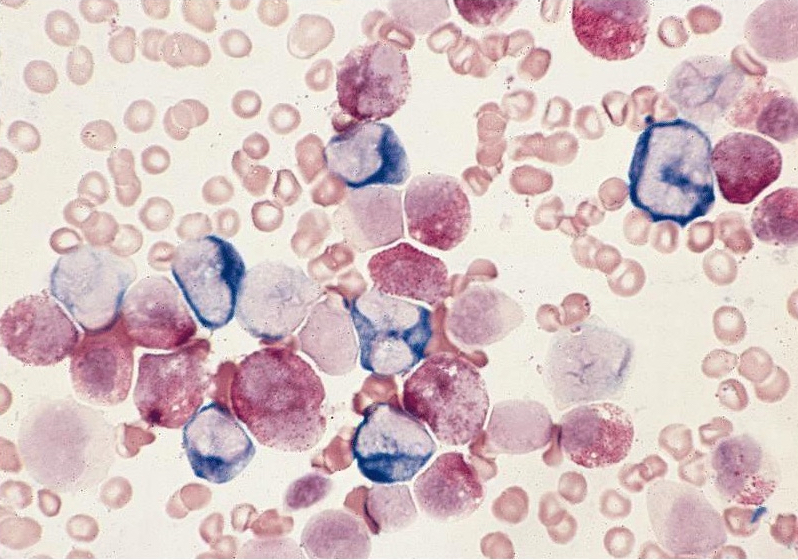
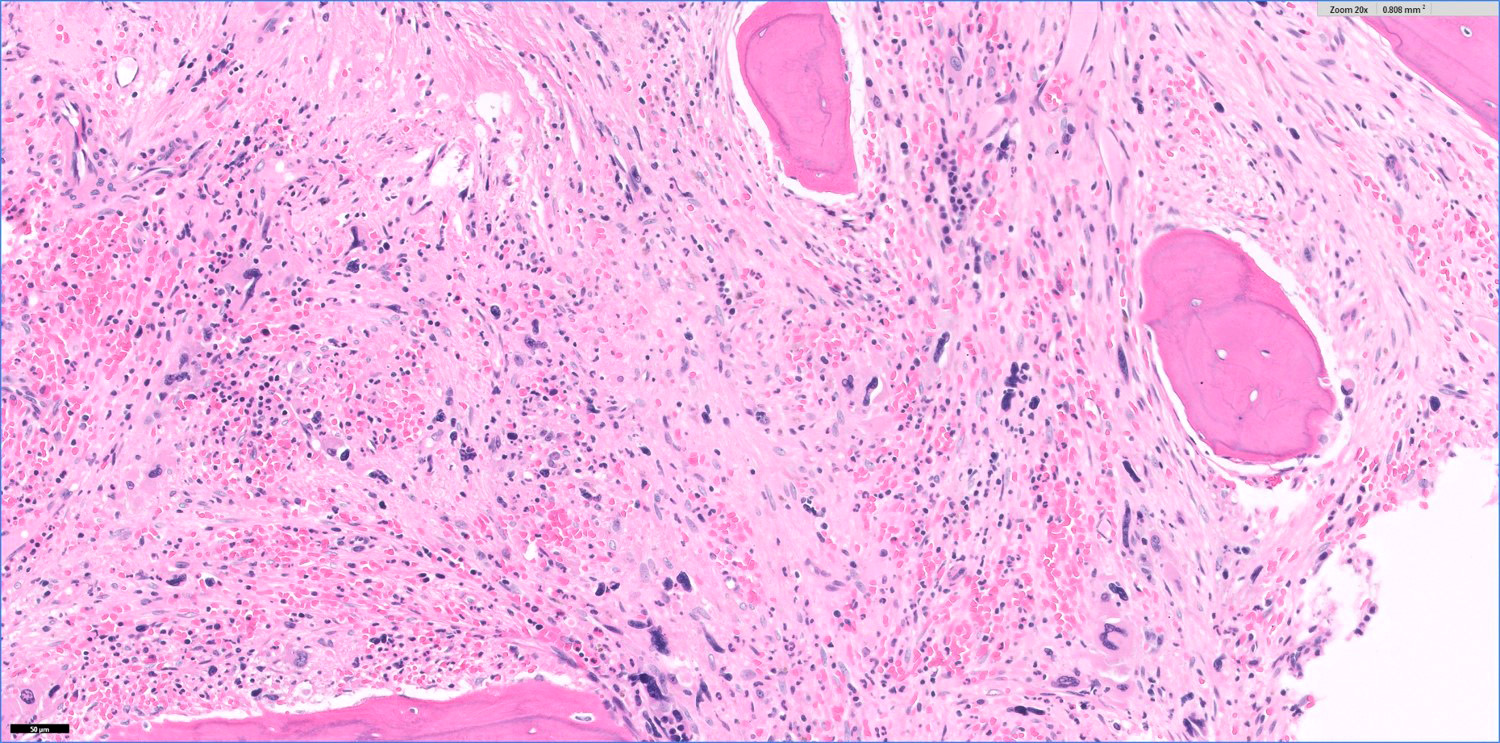
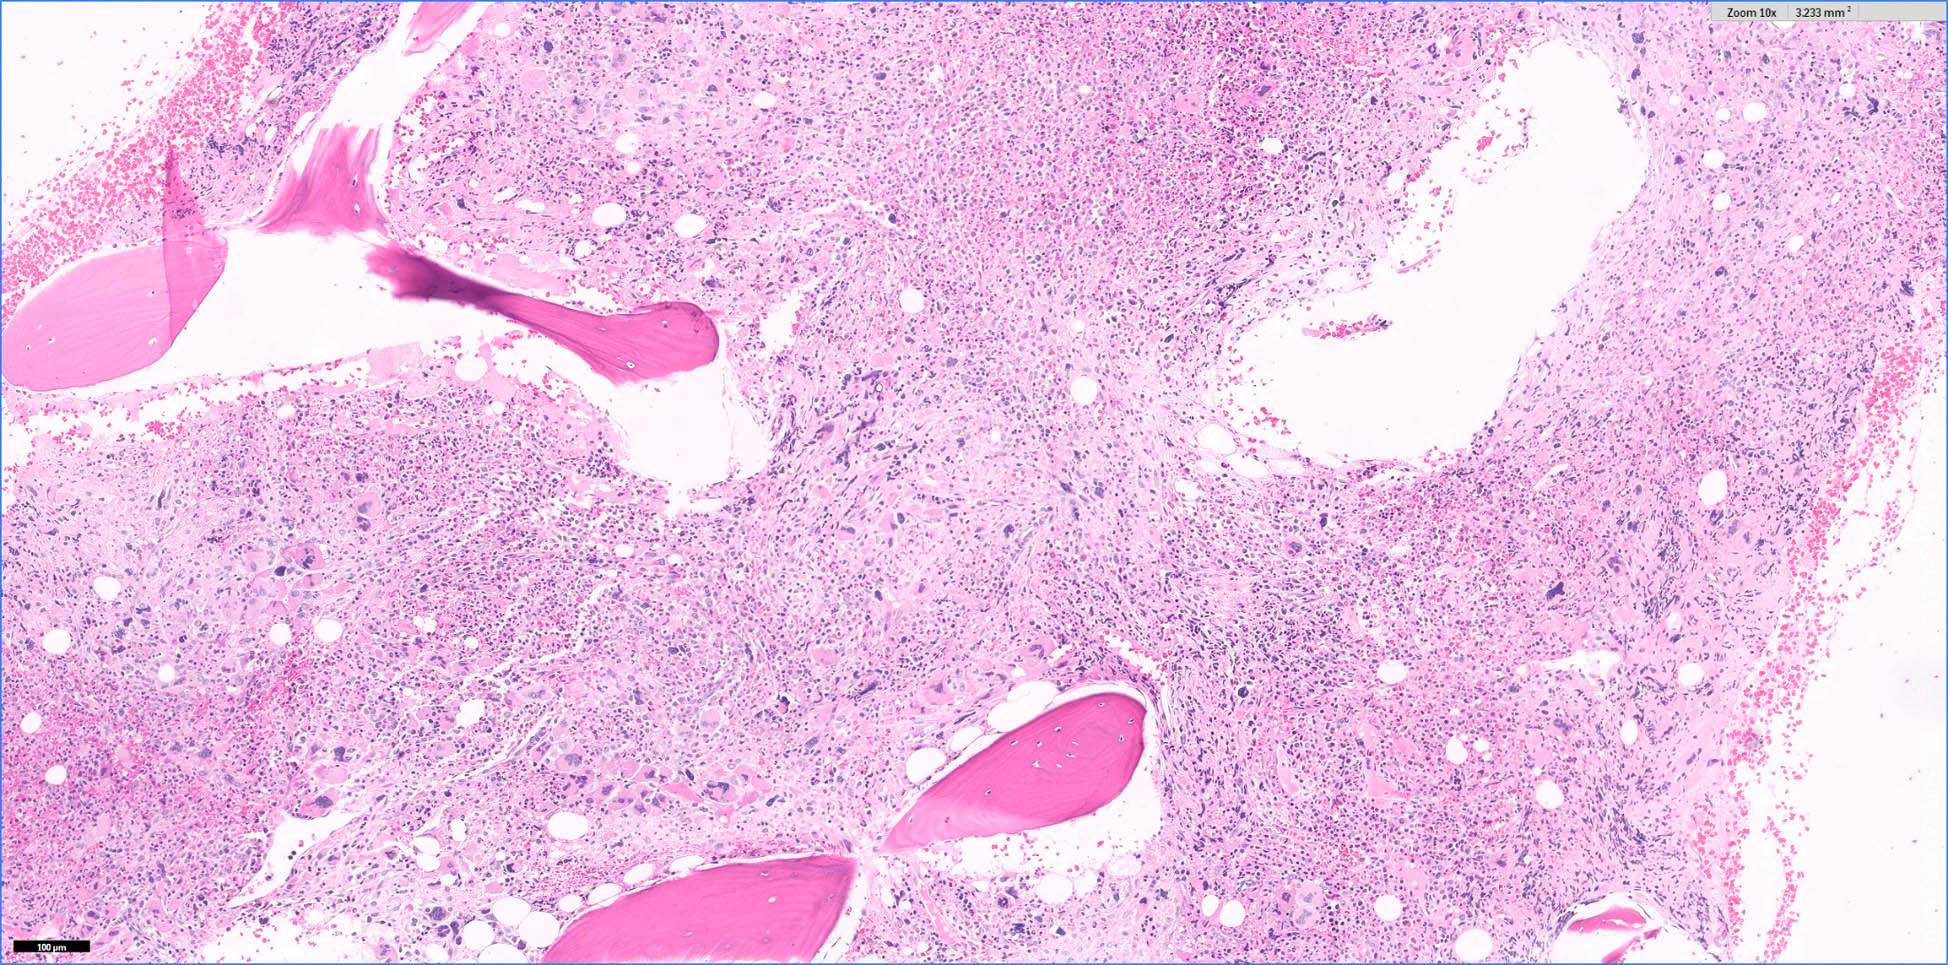
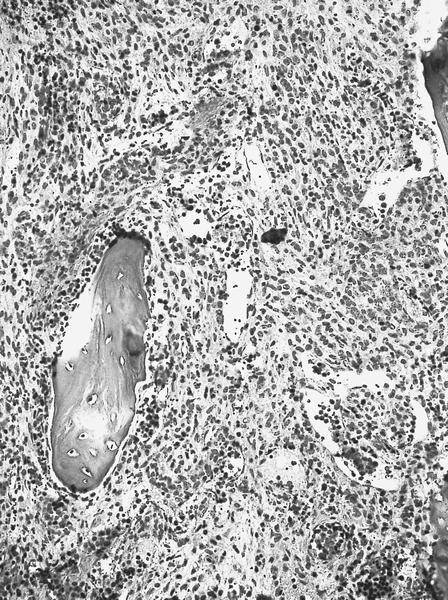
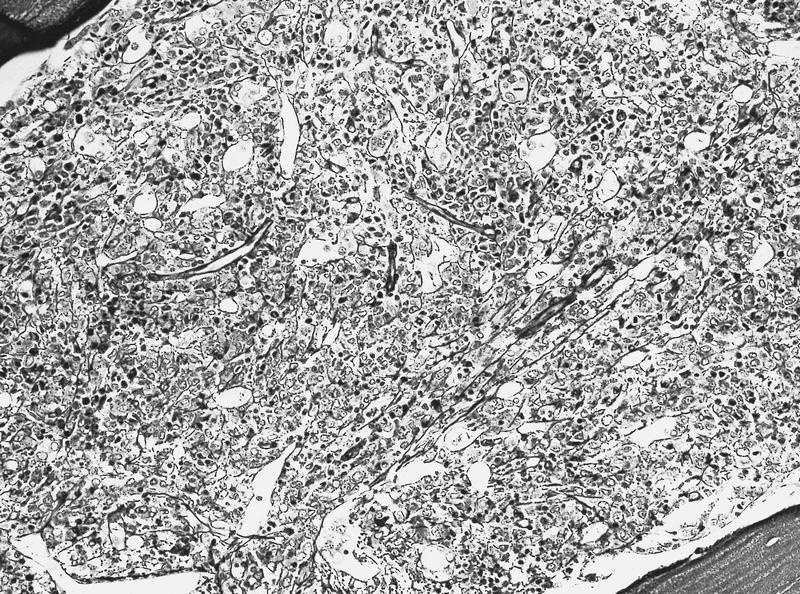
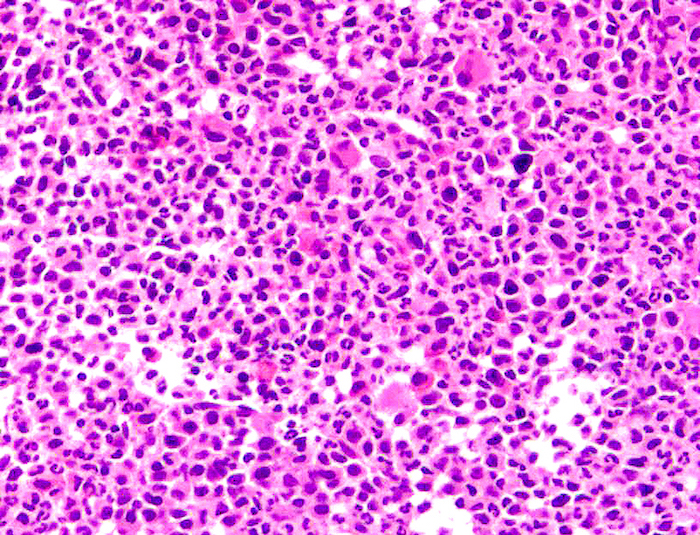
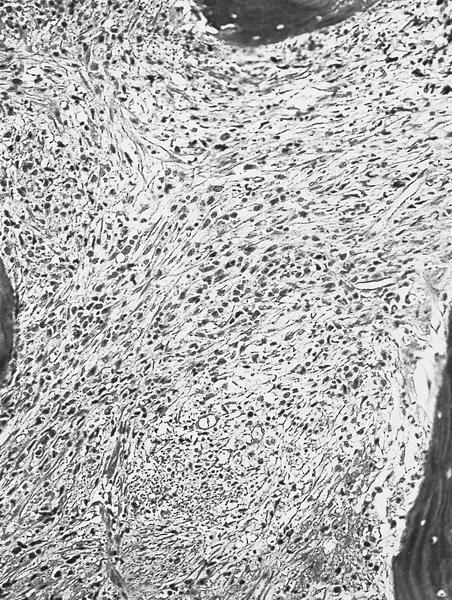
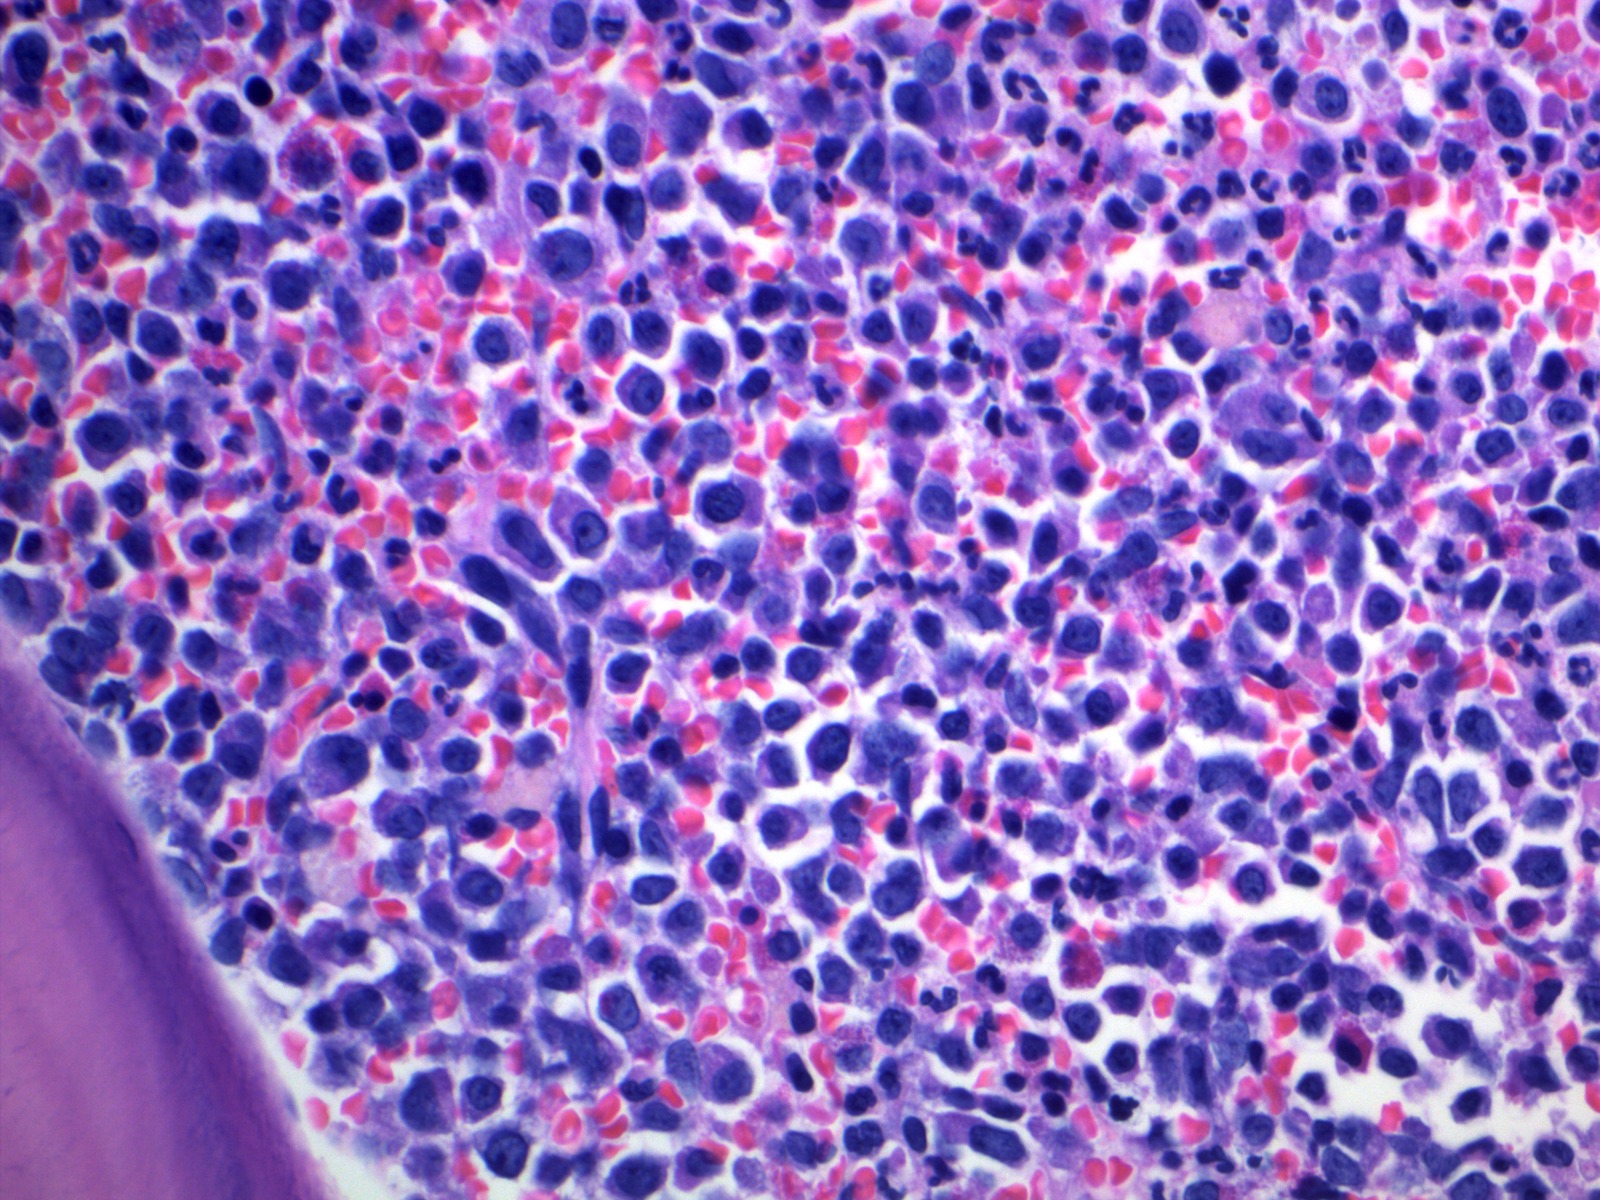
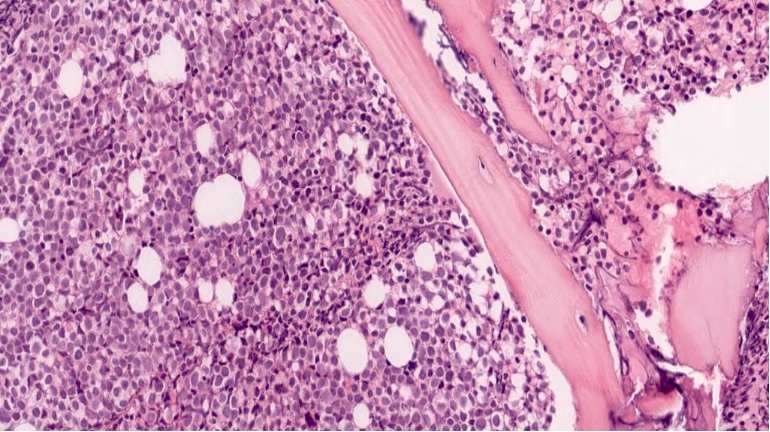
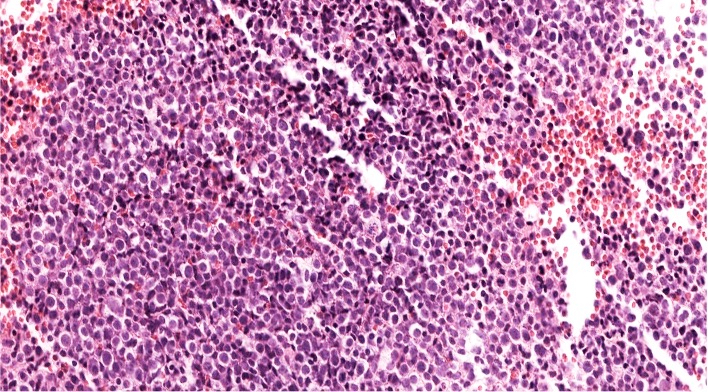
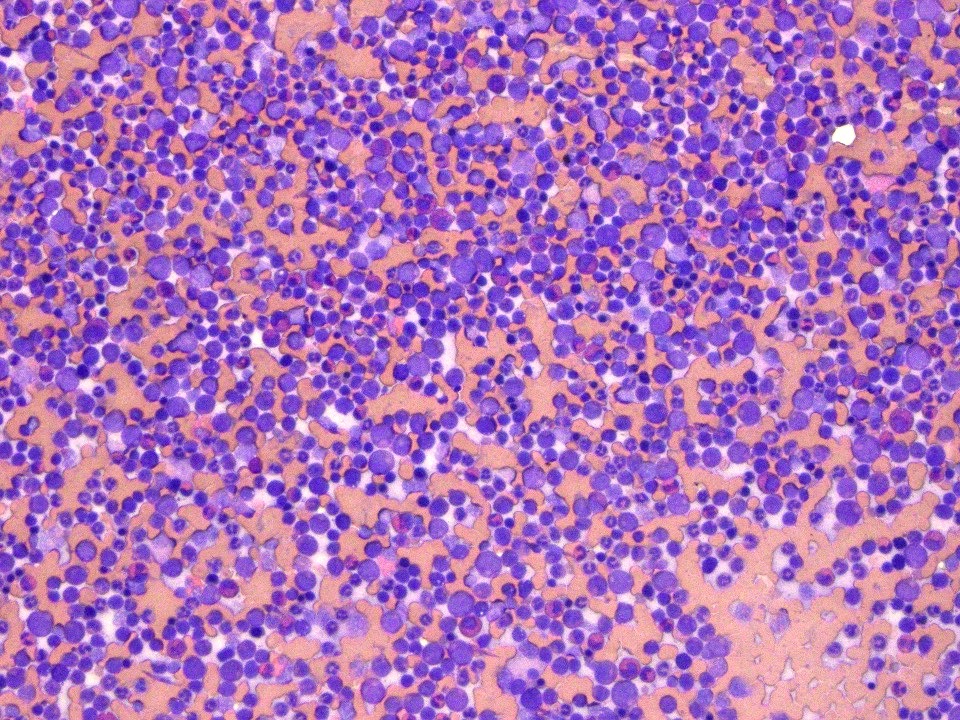
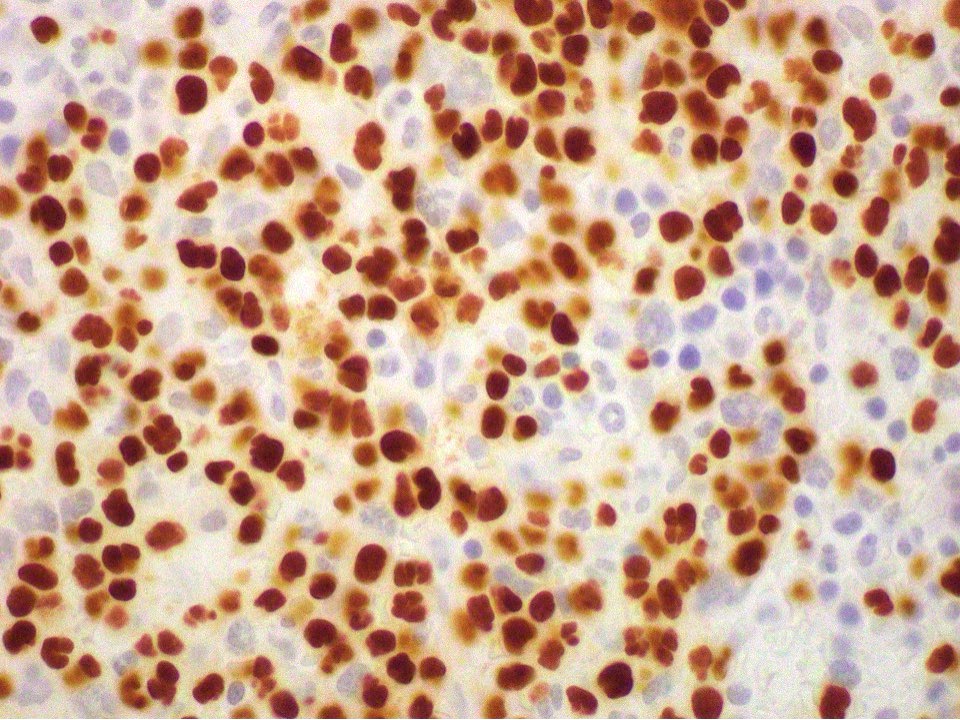
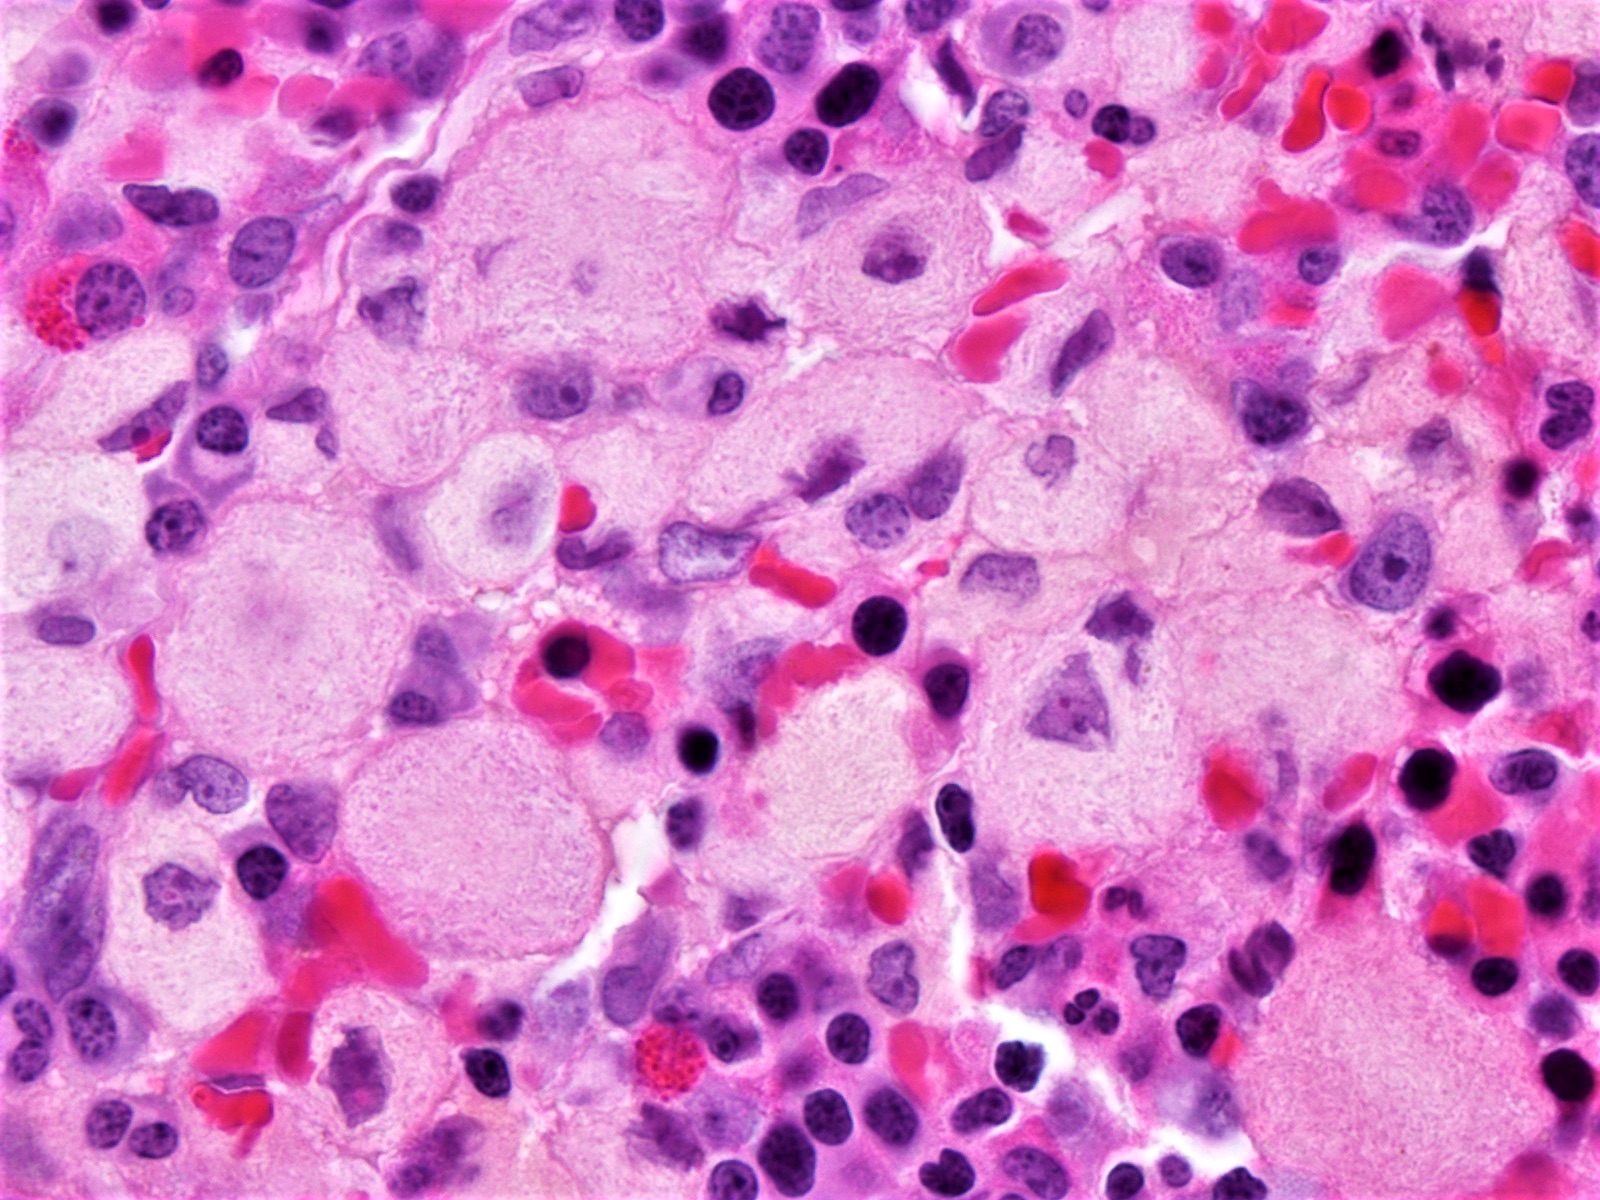
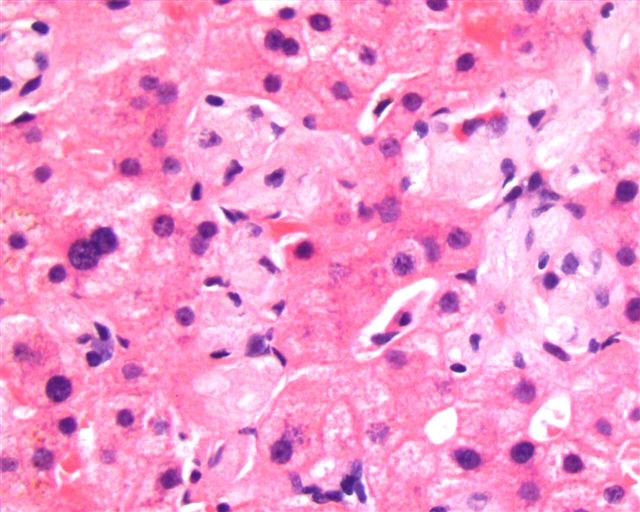
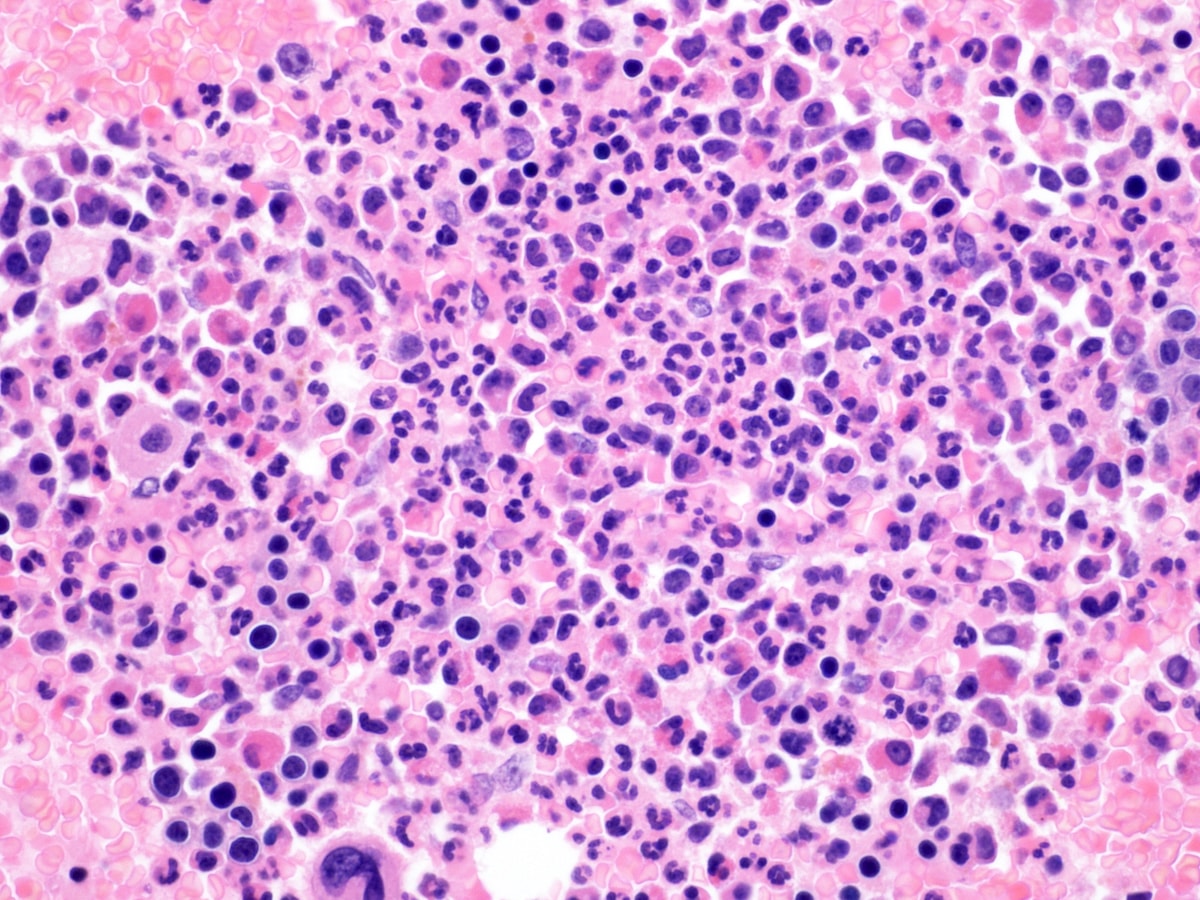
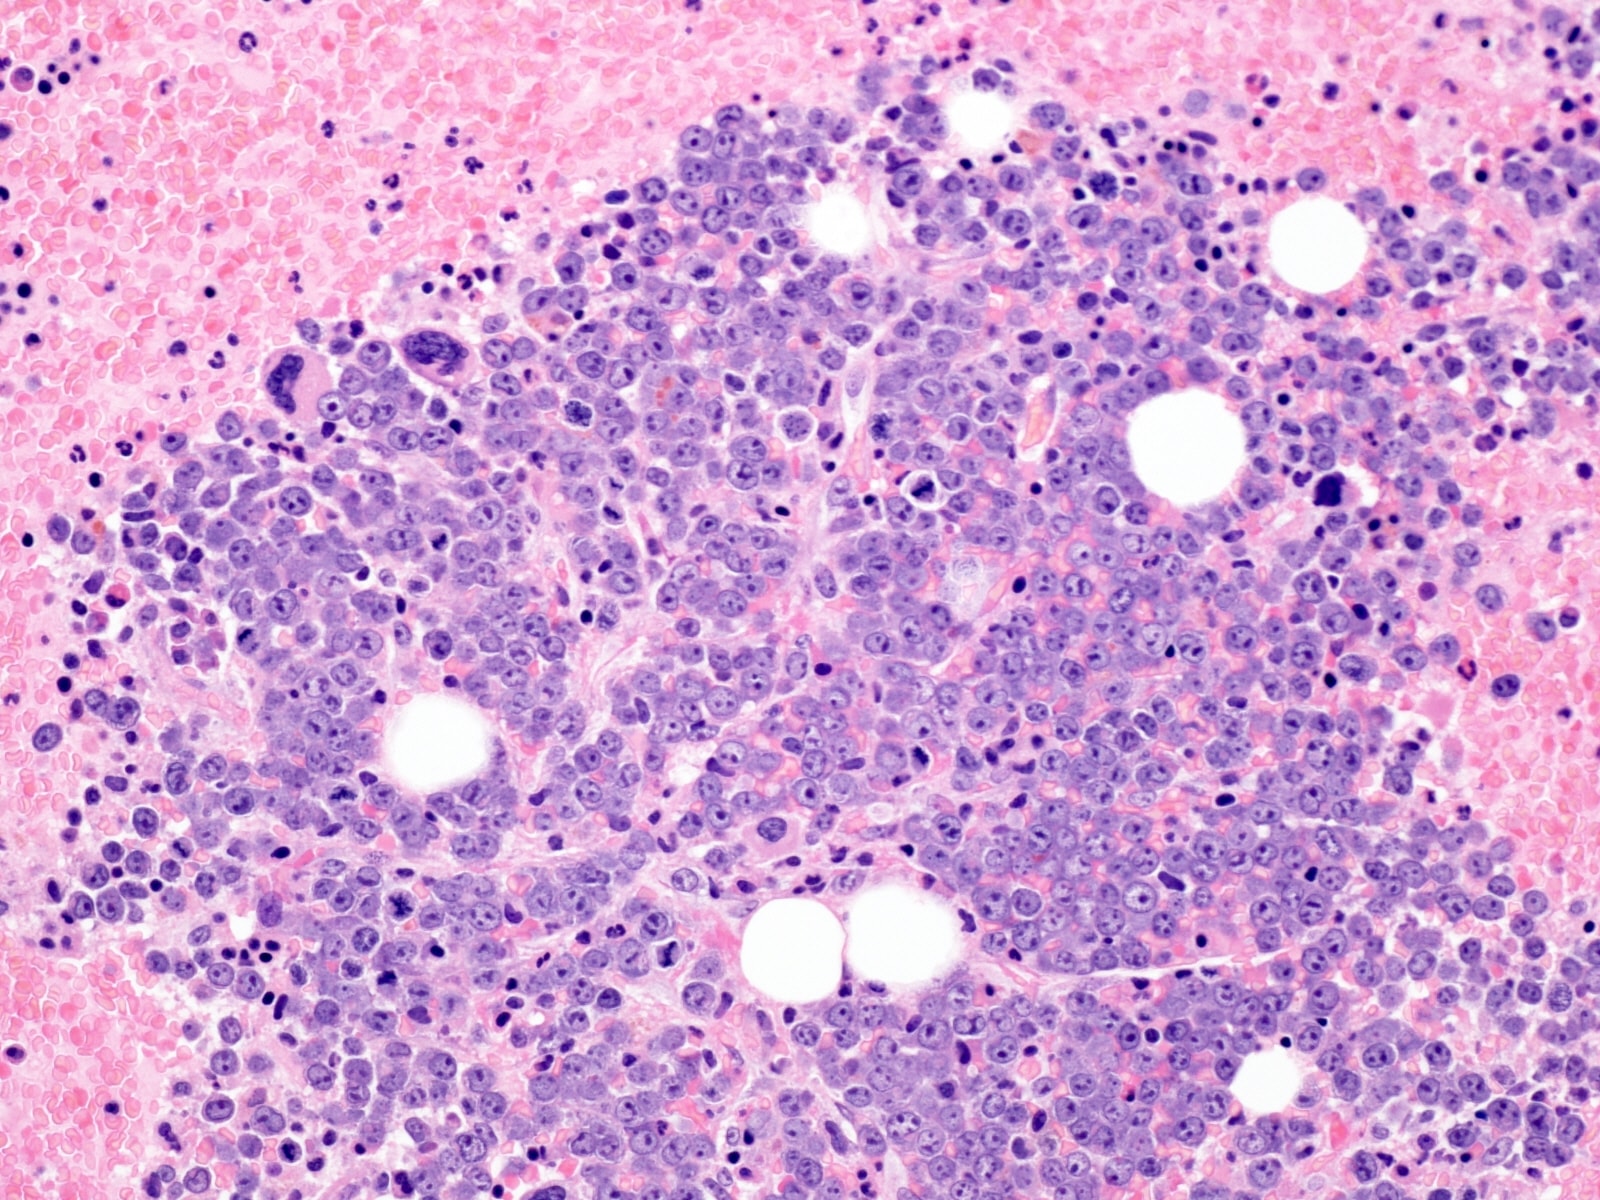
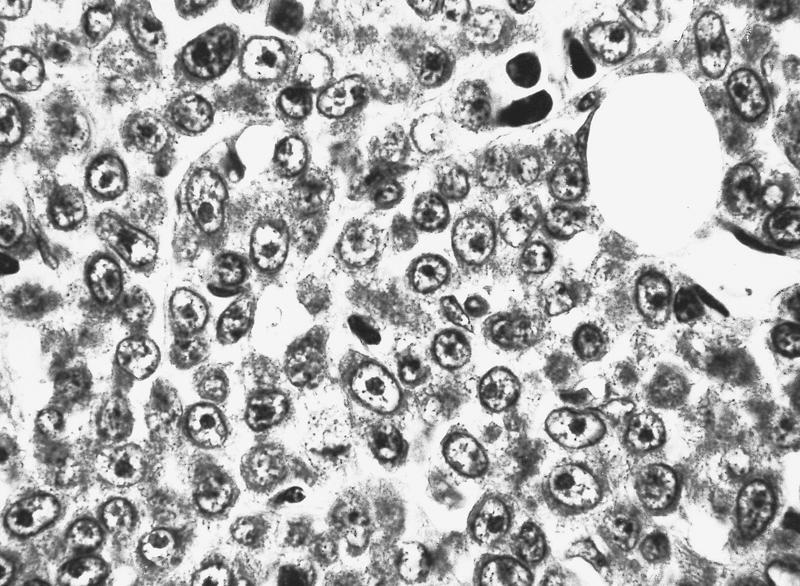
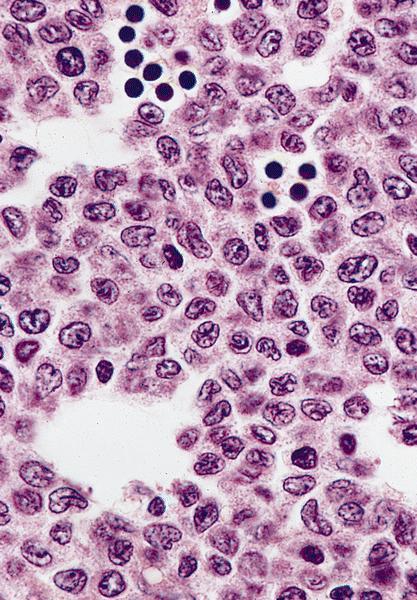
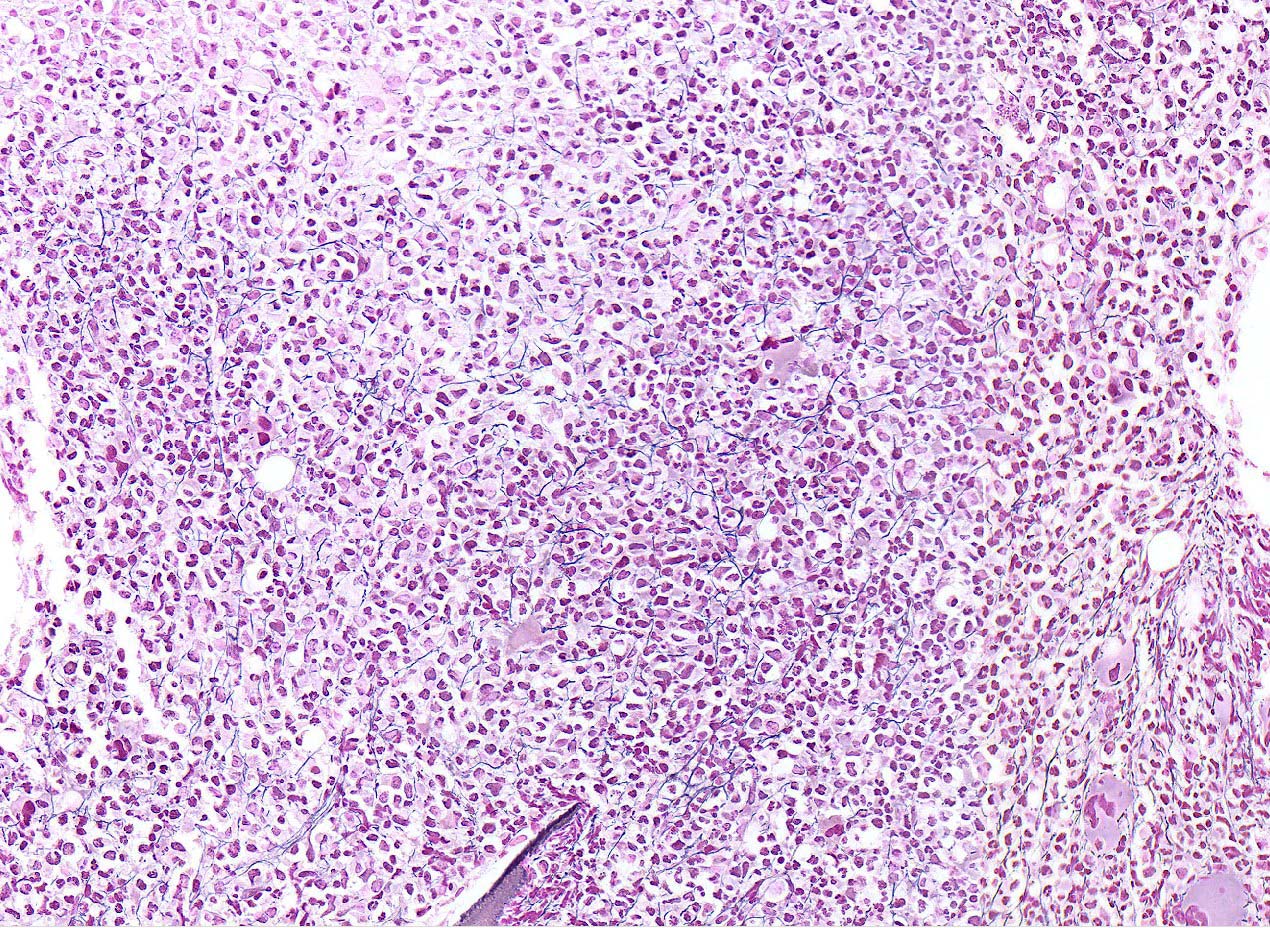
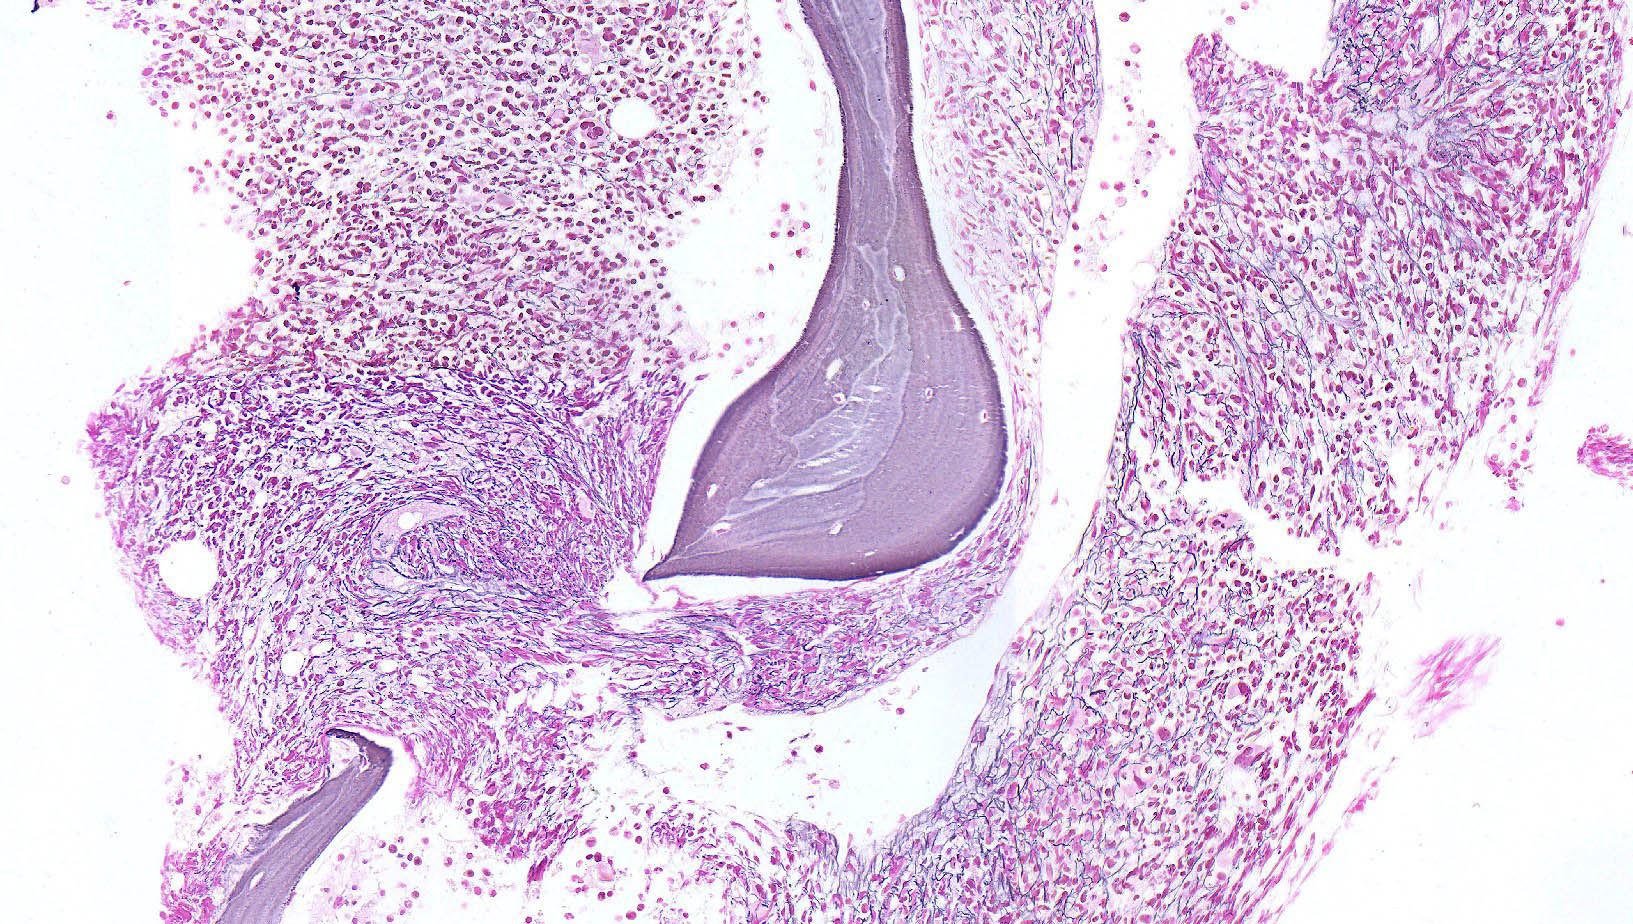
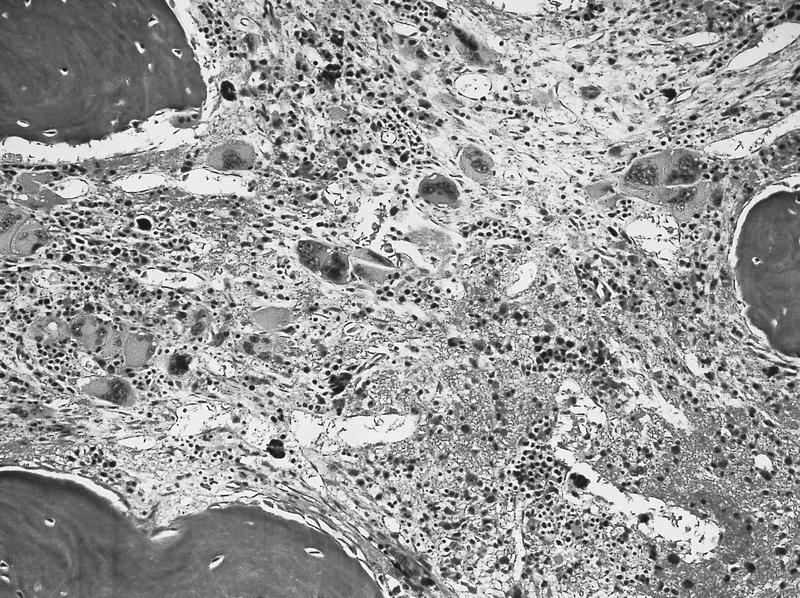
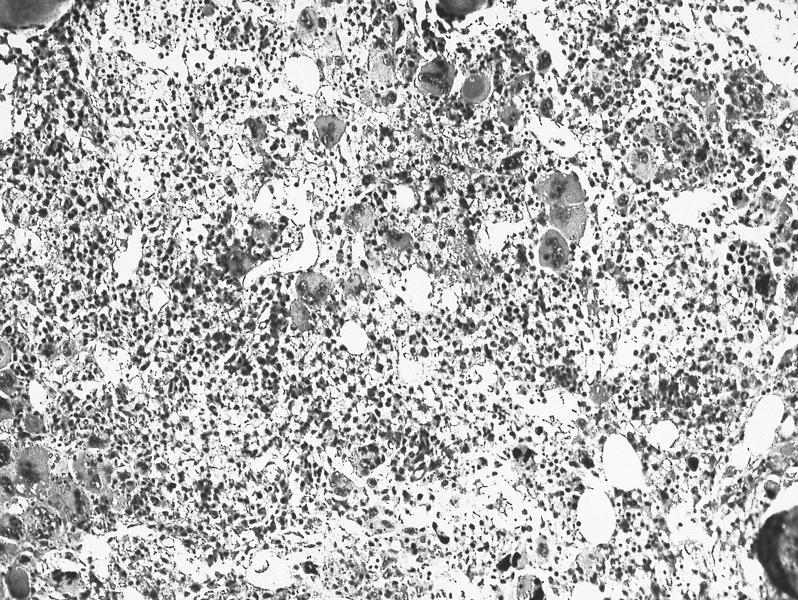
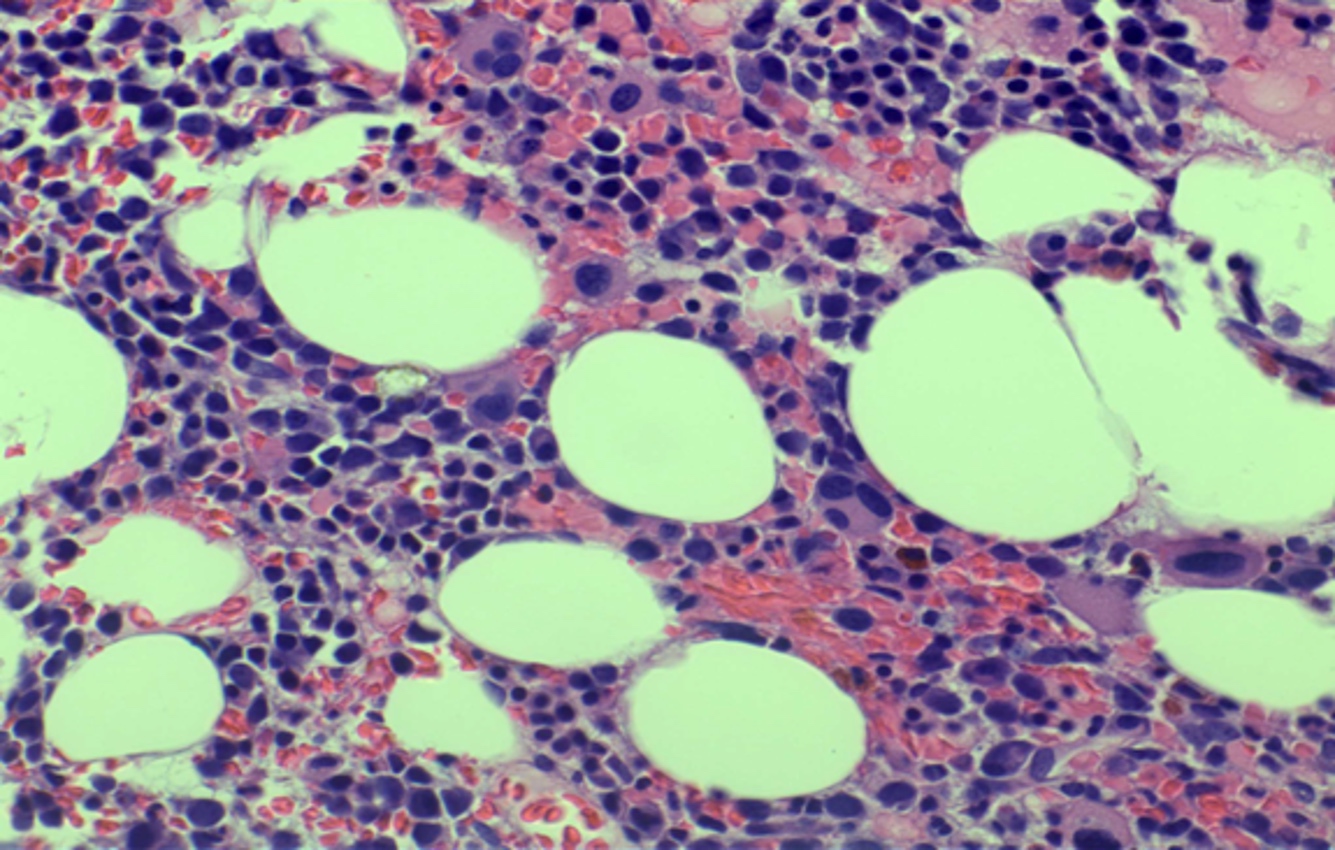
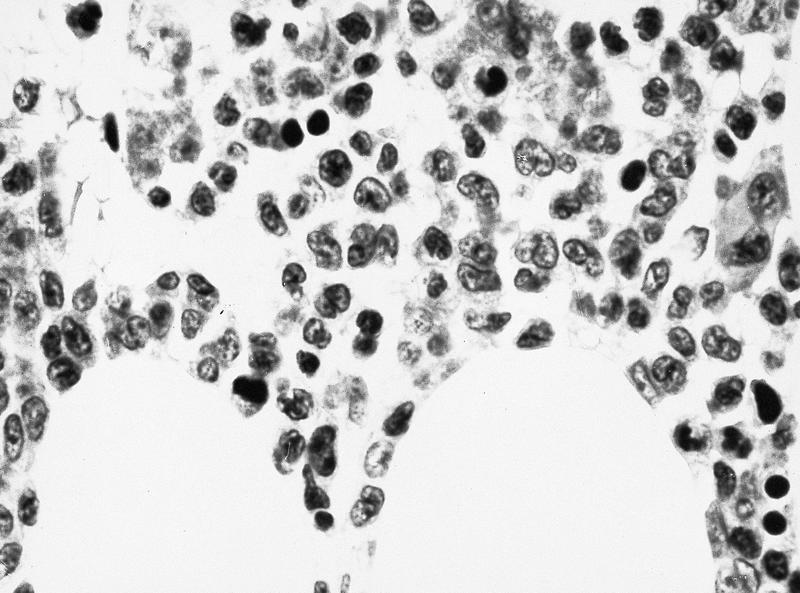
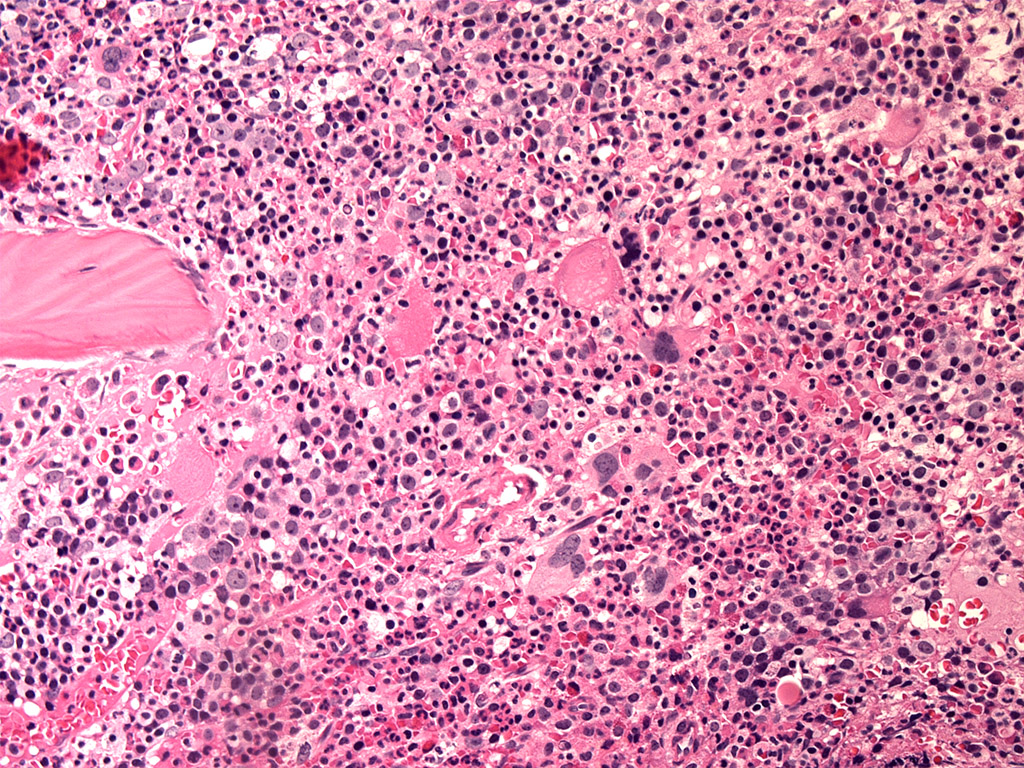
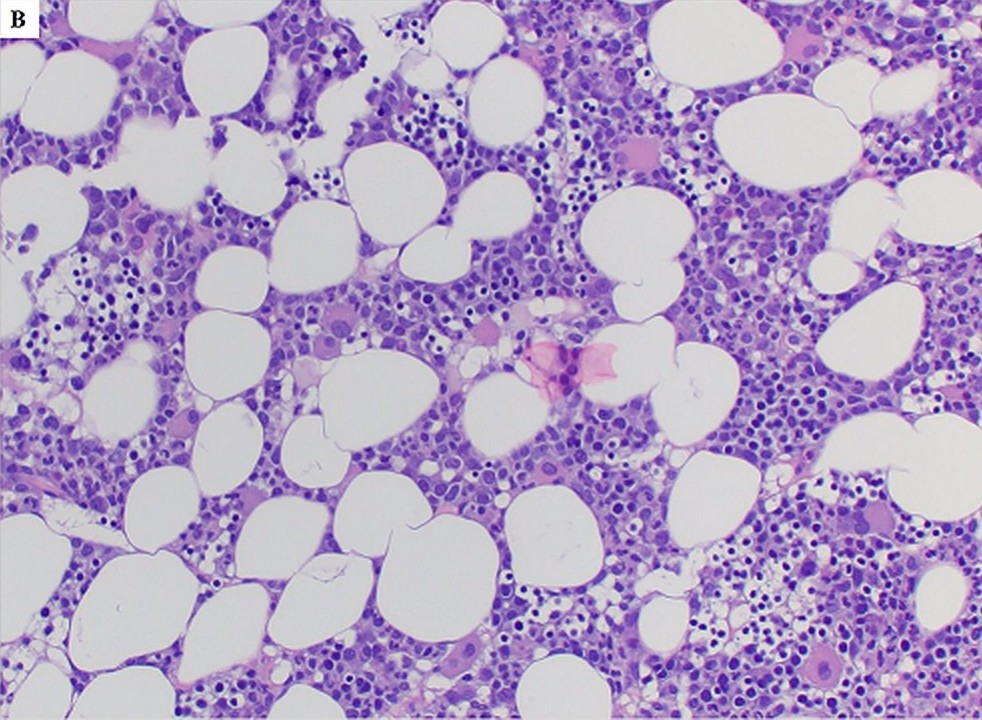
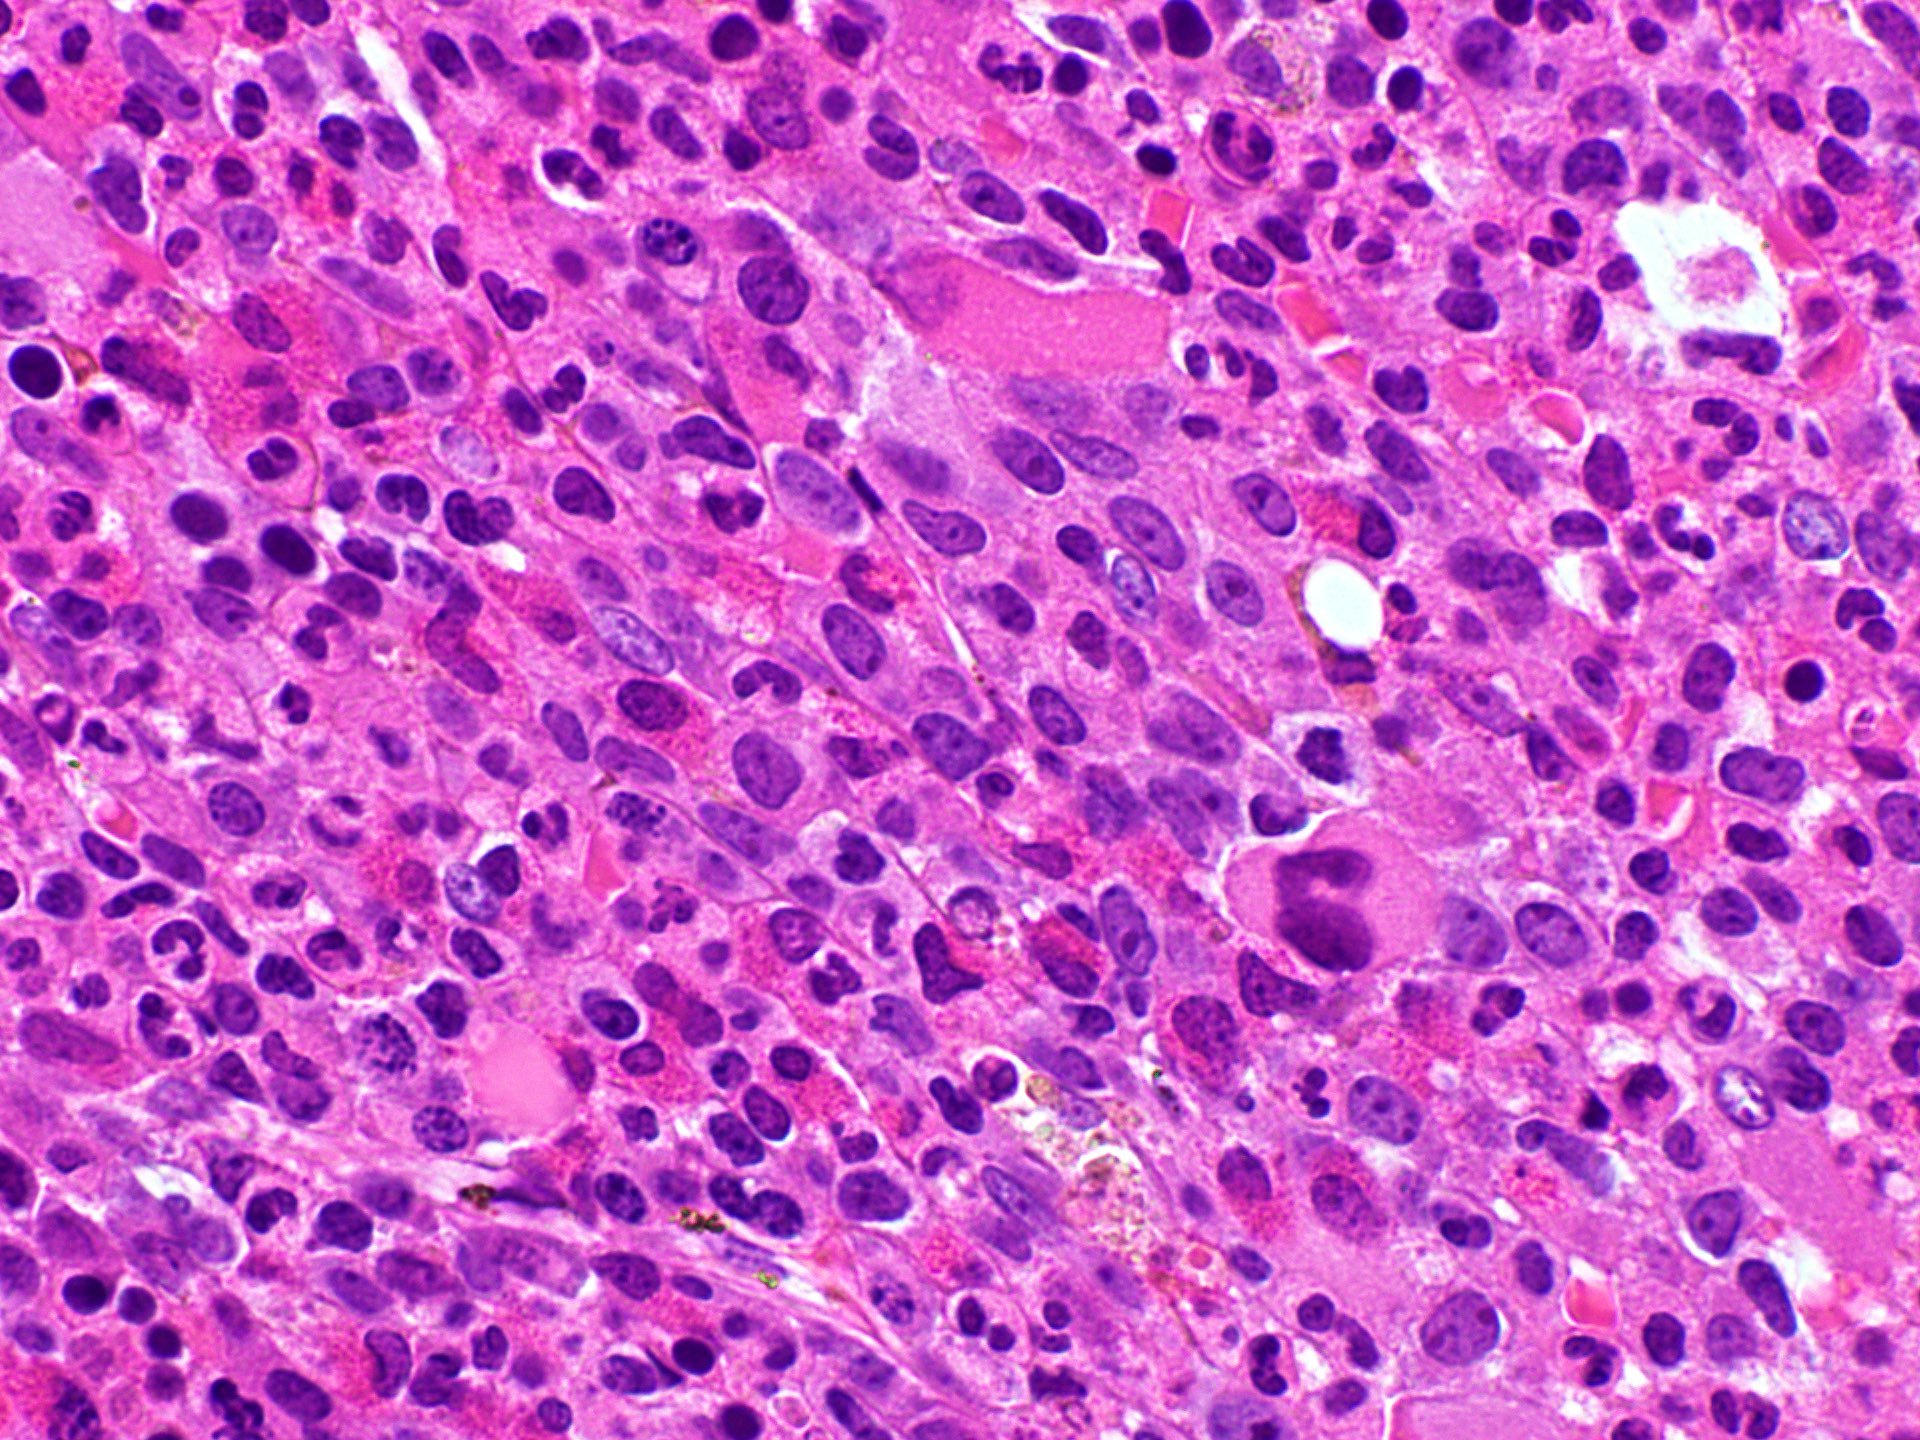
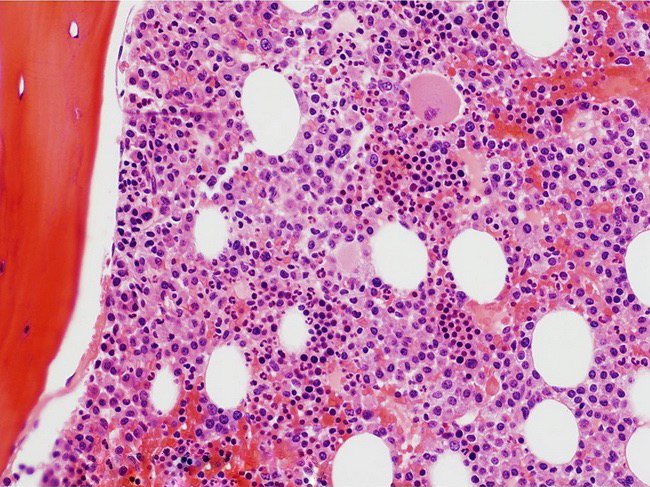
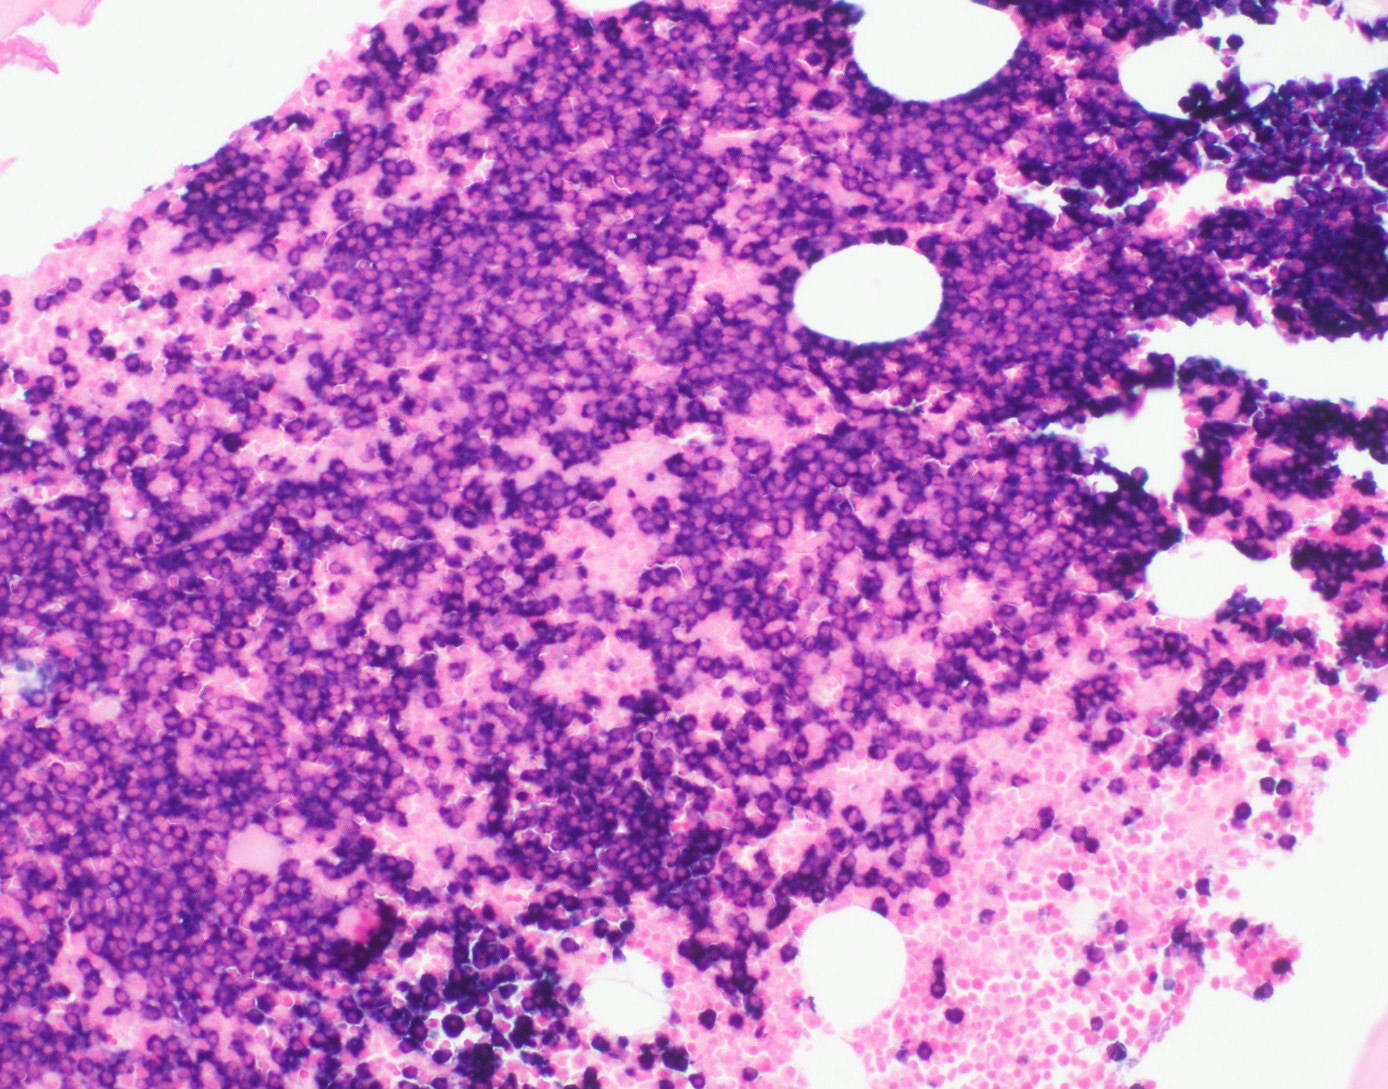
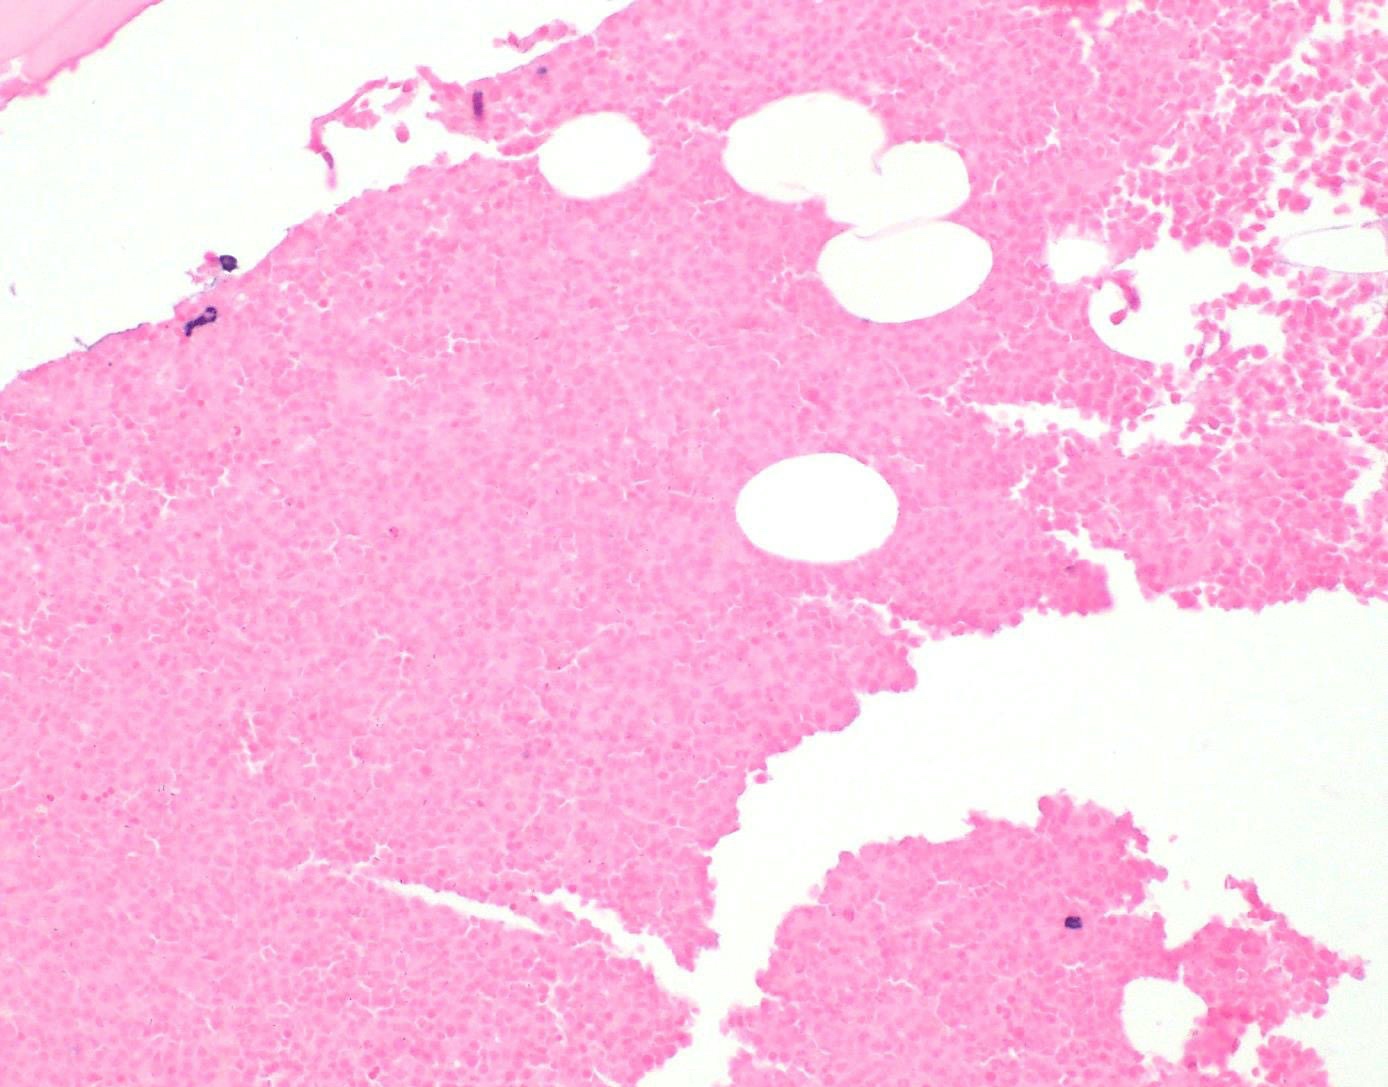
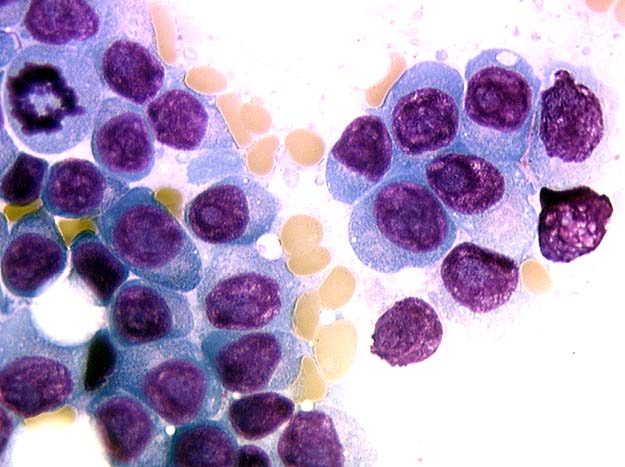
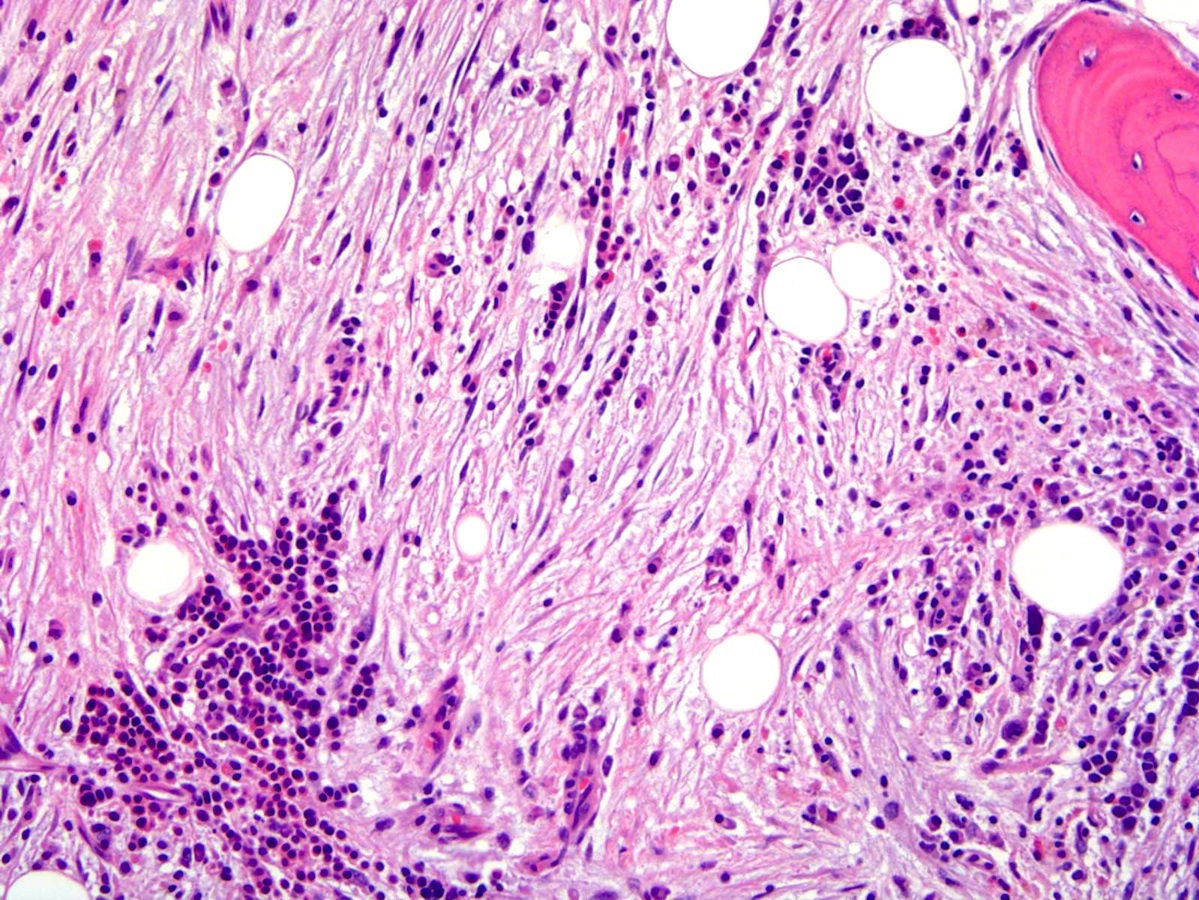
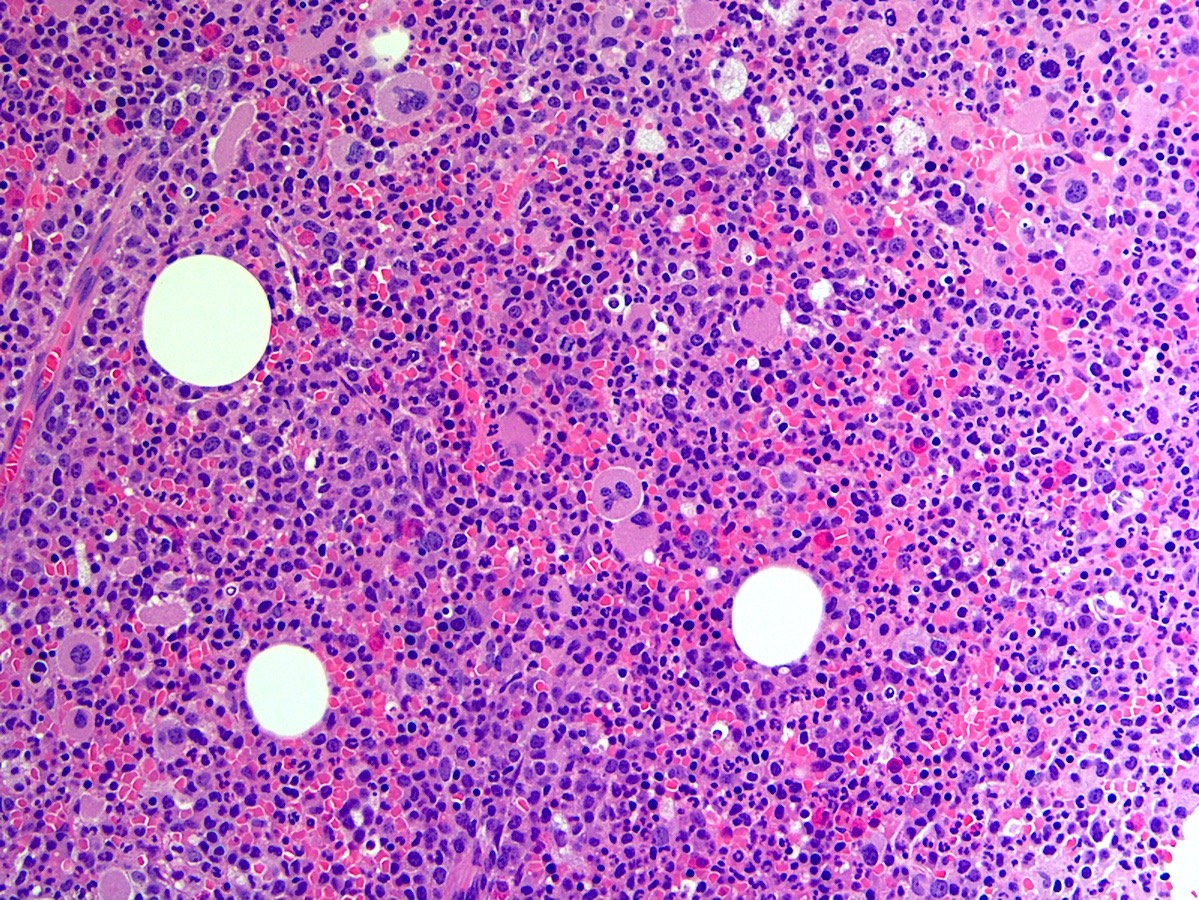
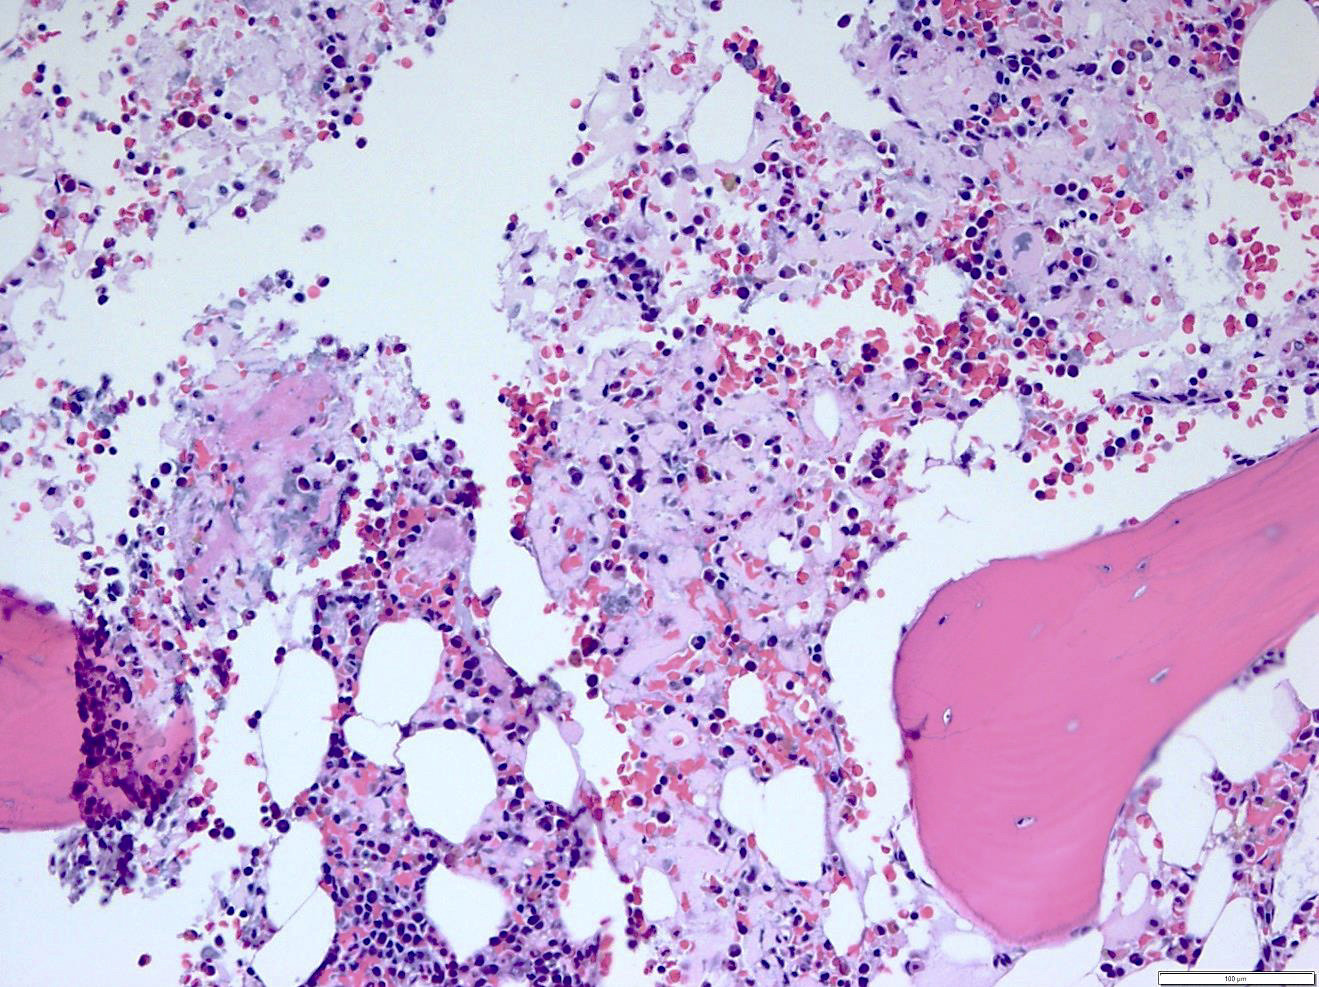
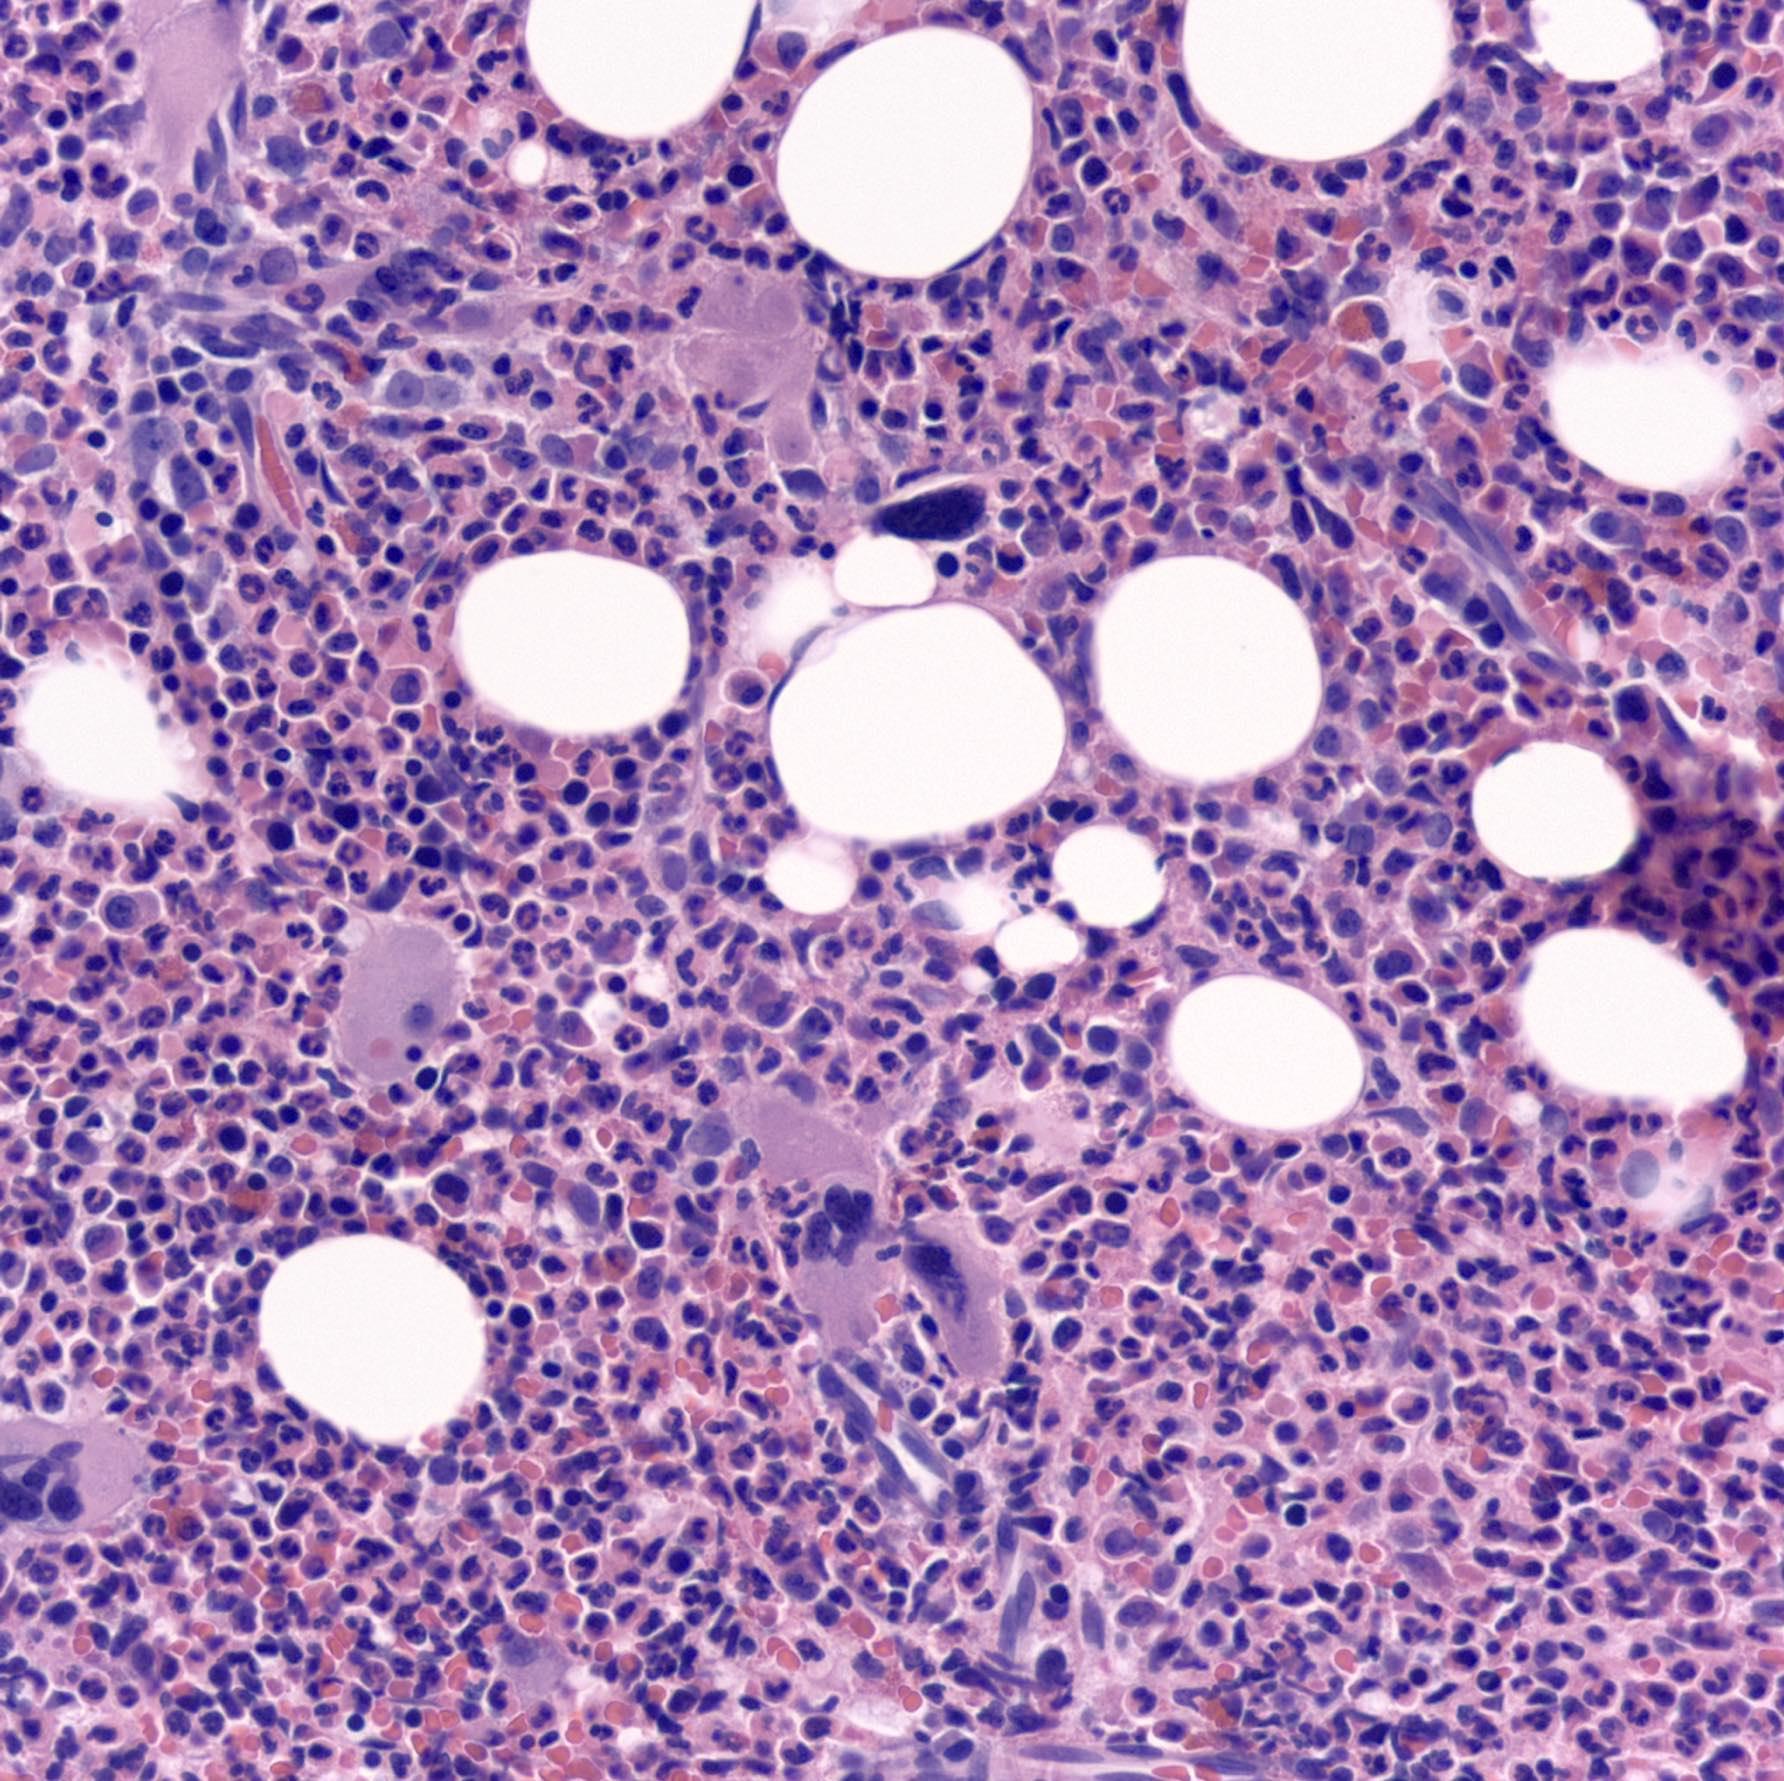
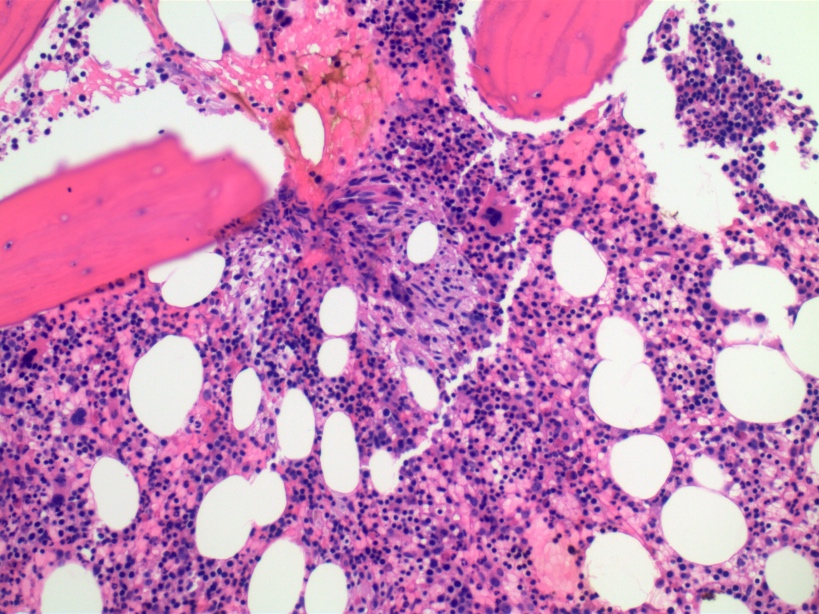
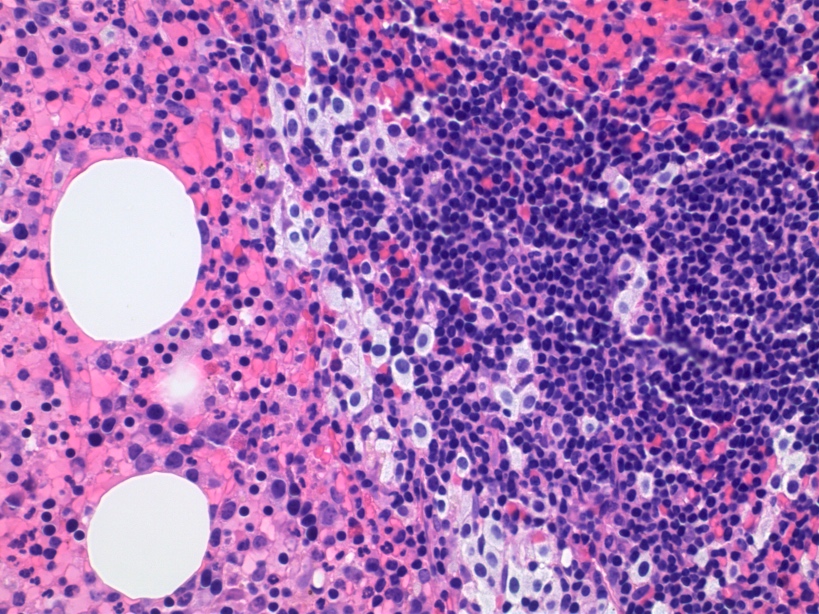
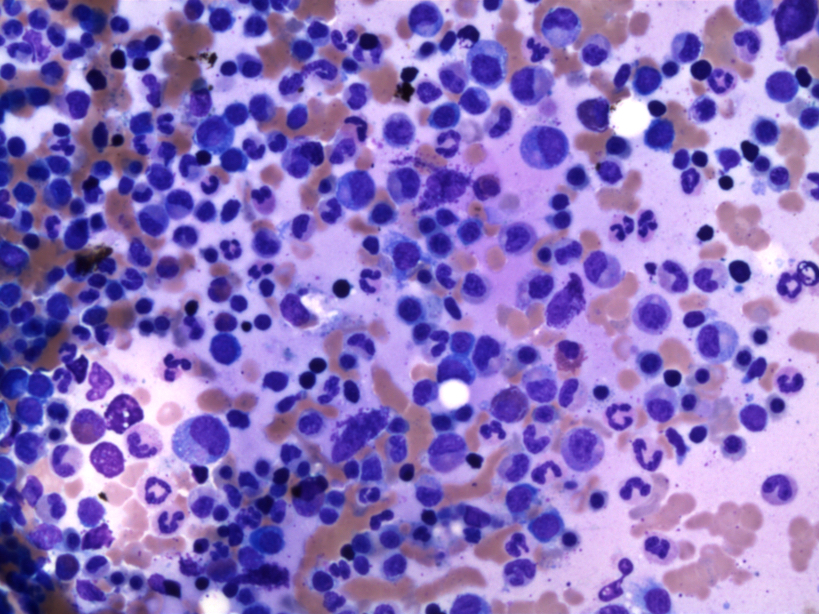
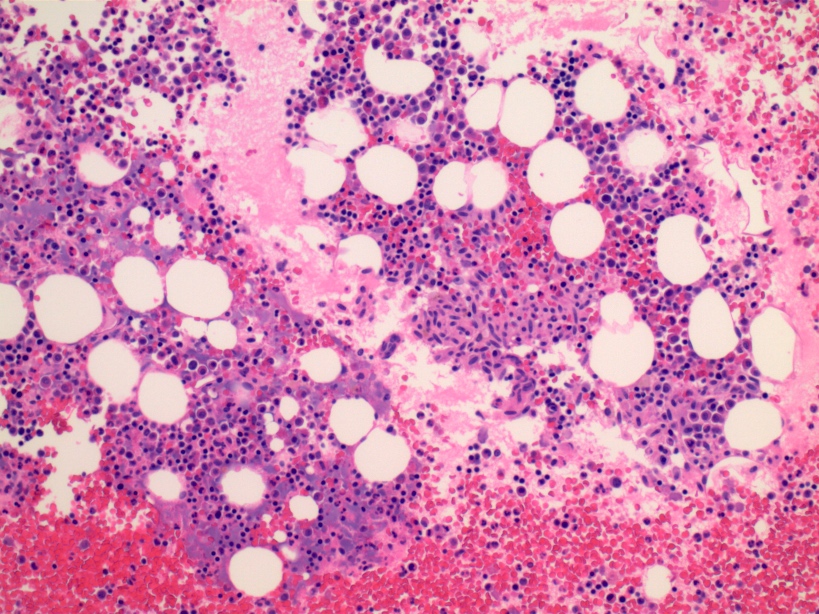
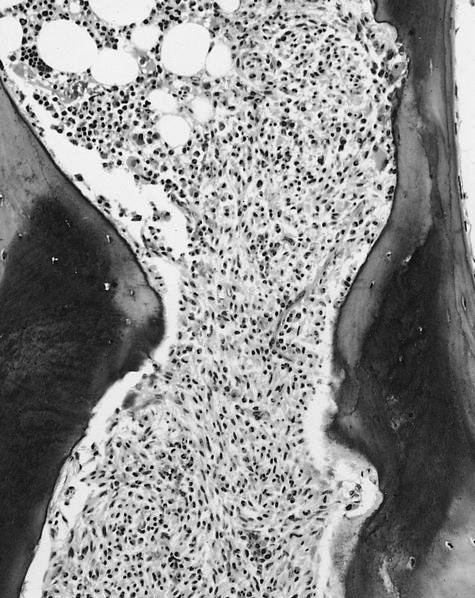
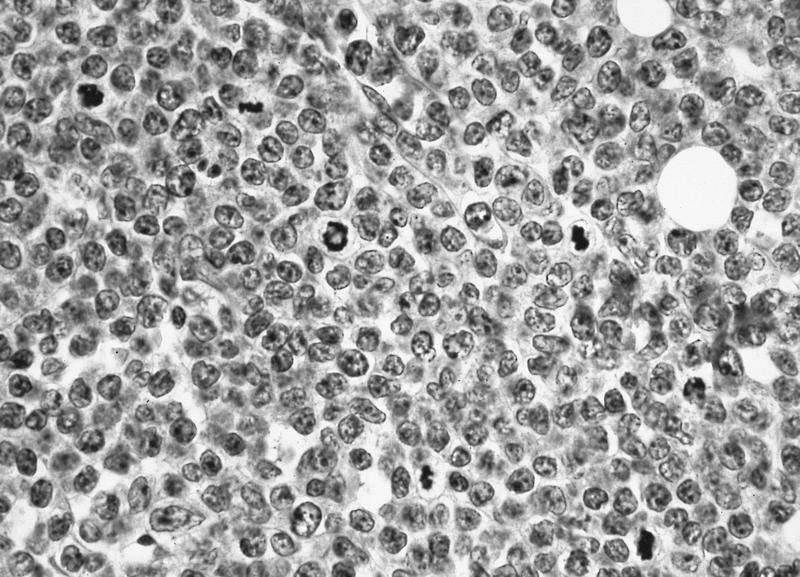
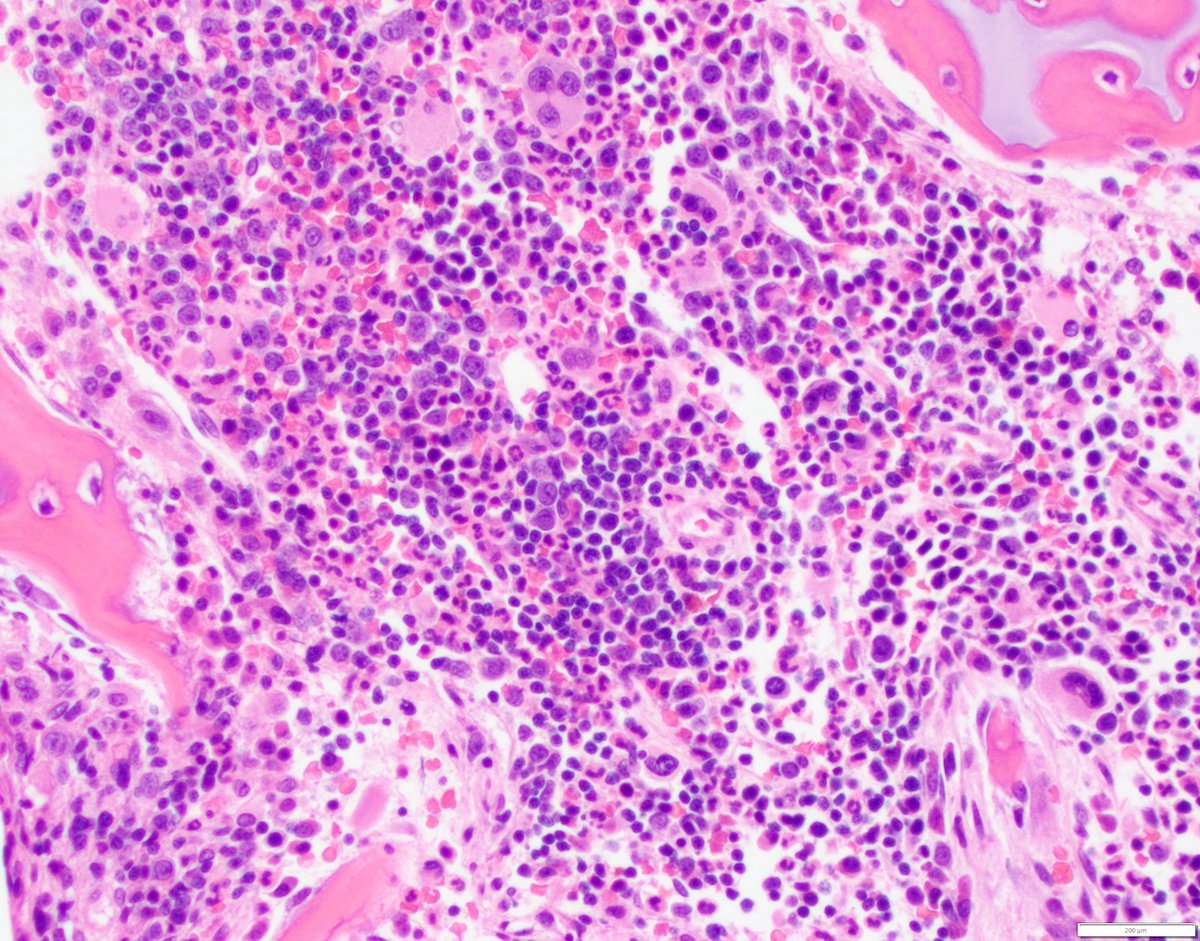
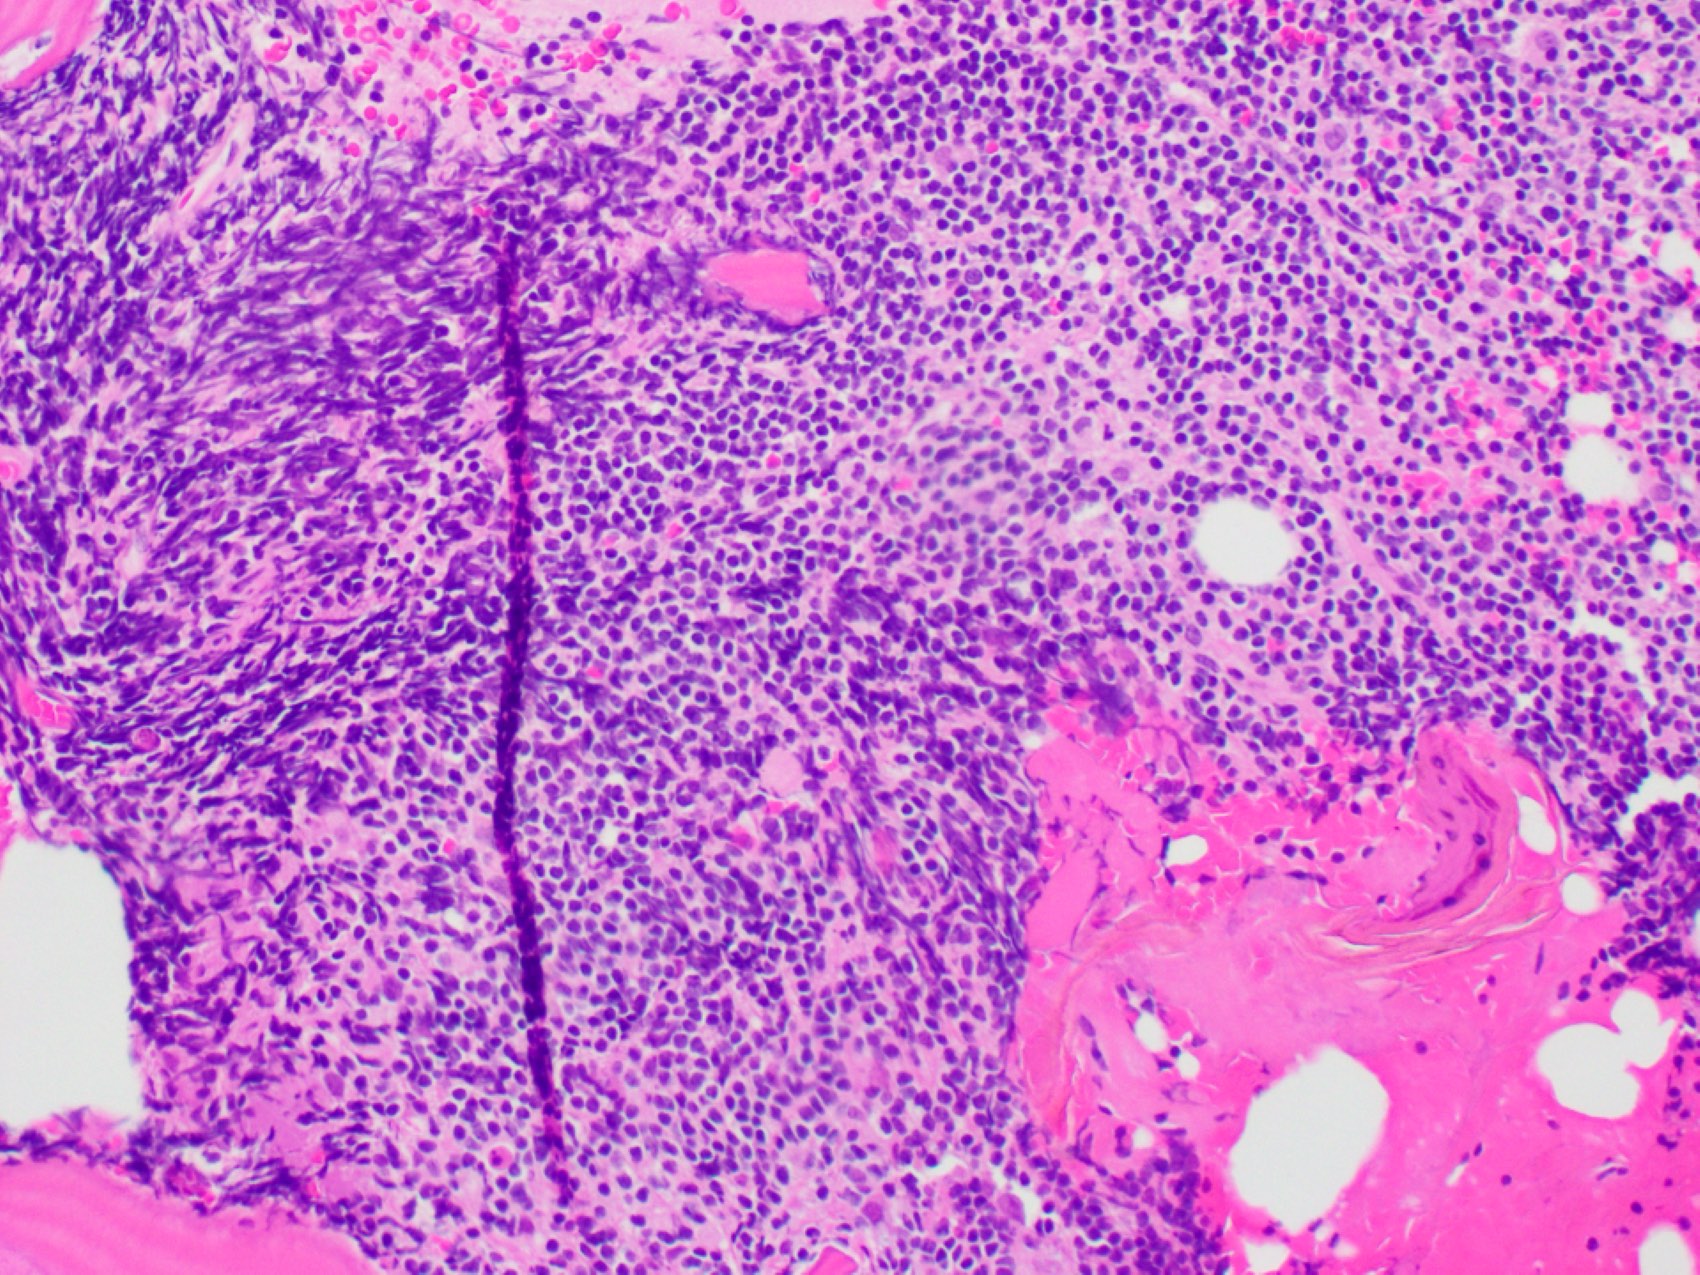
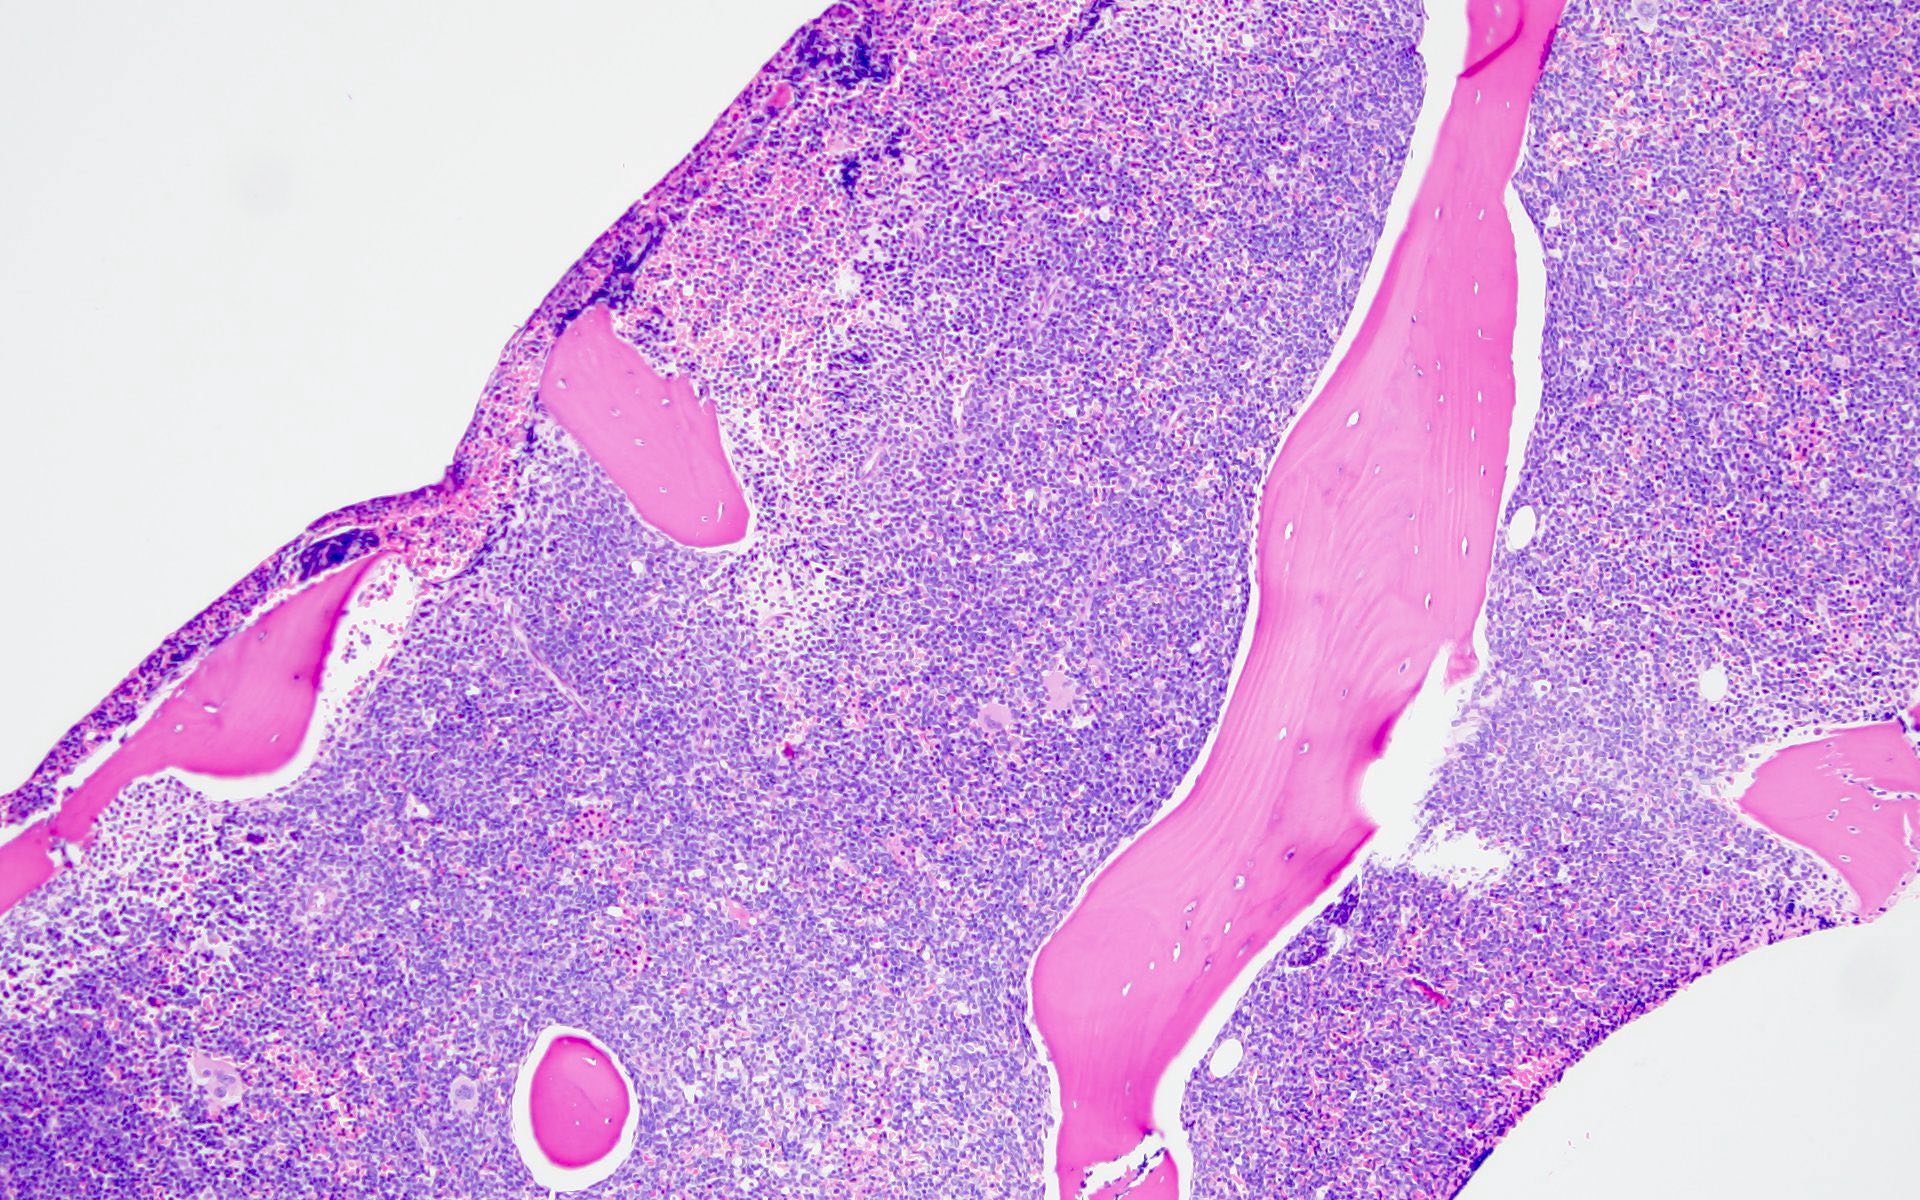
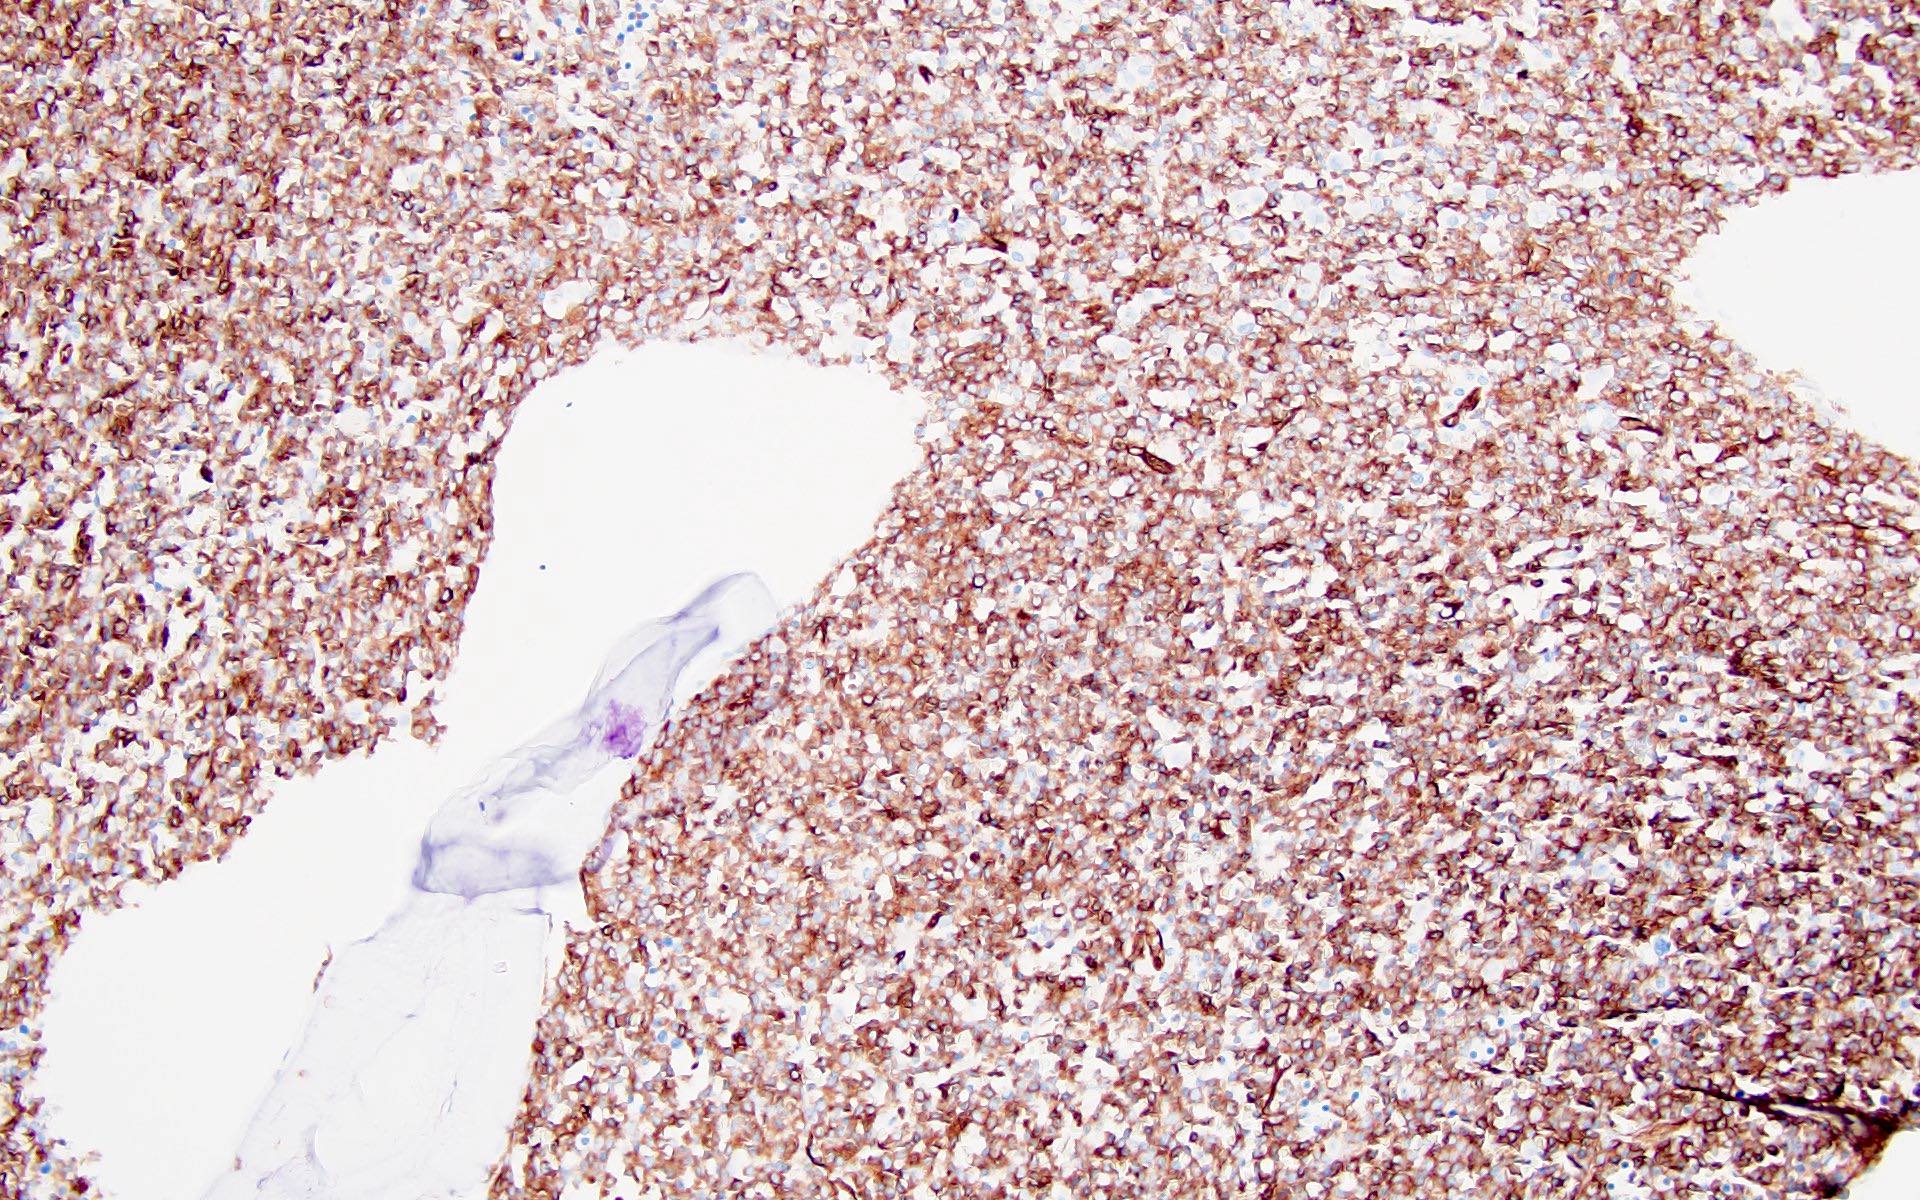
Extensive infiltration by blasts
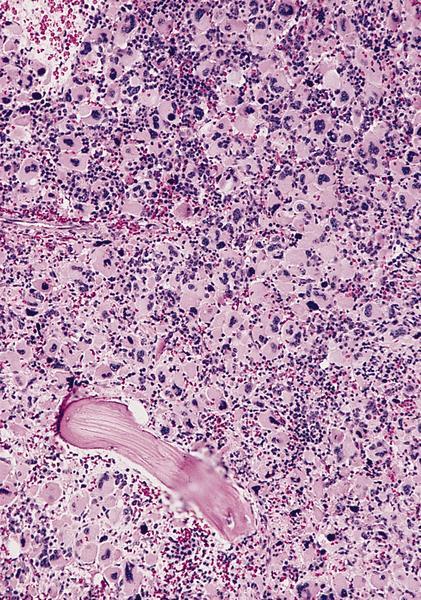
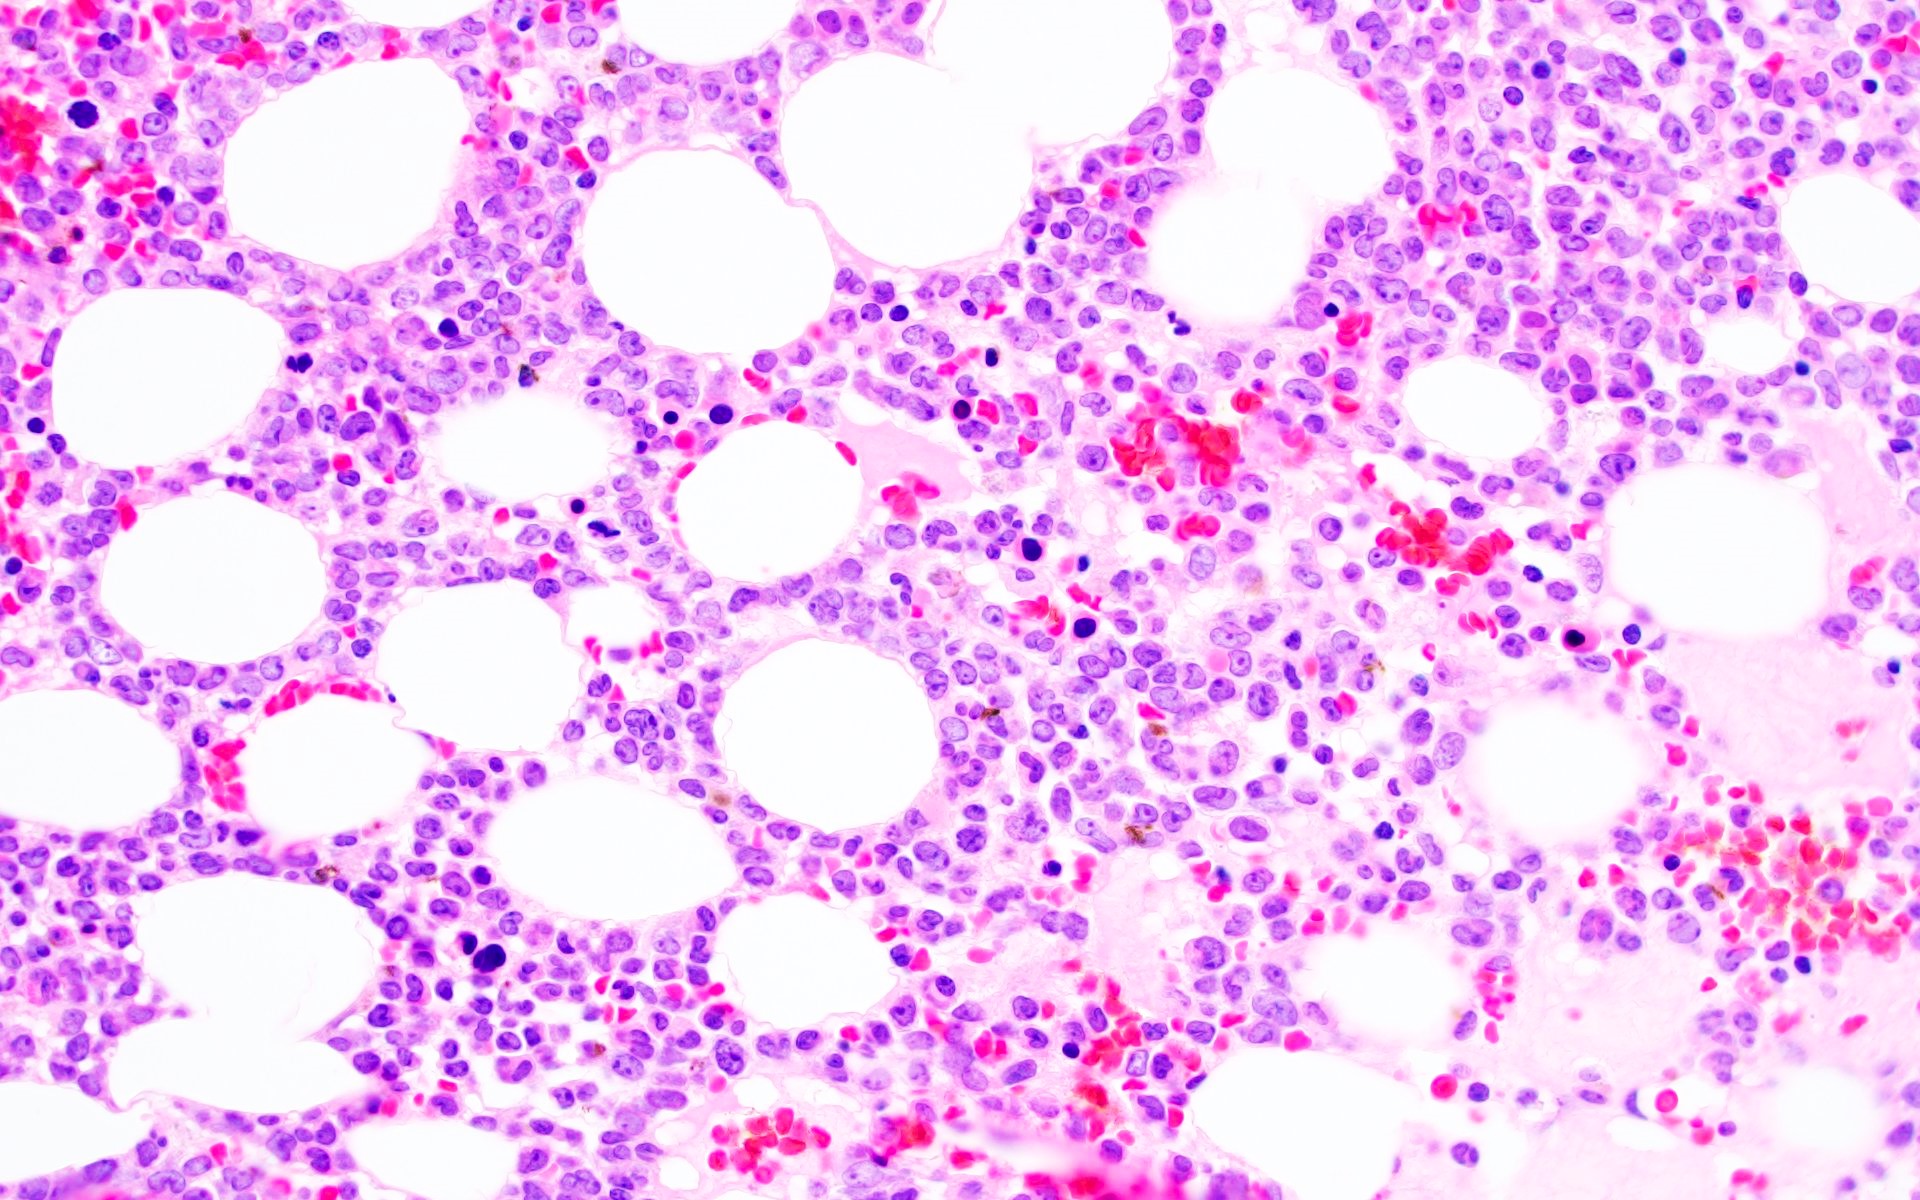
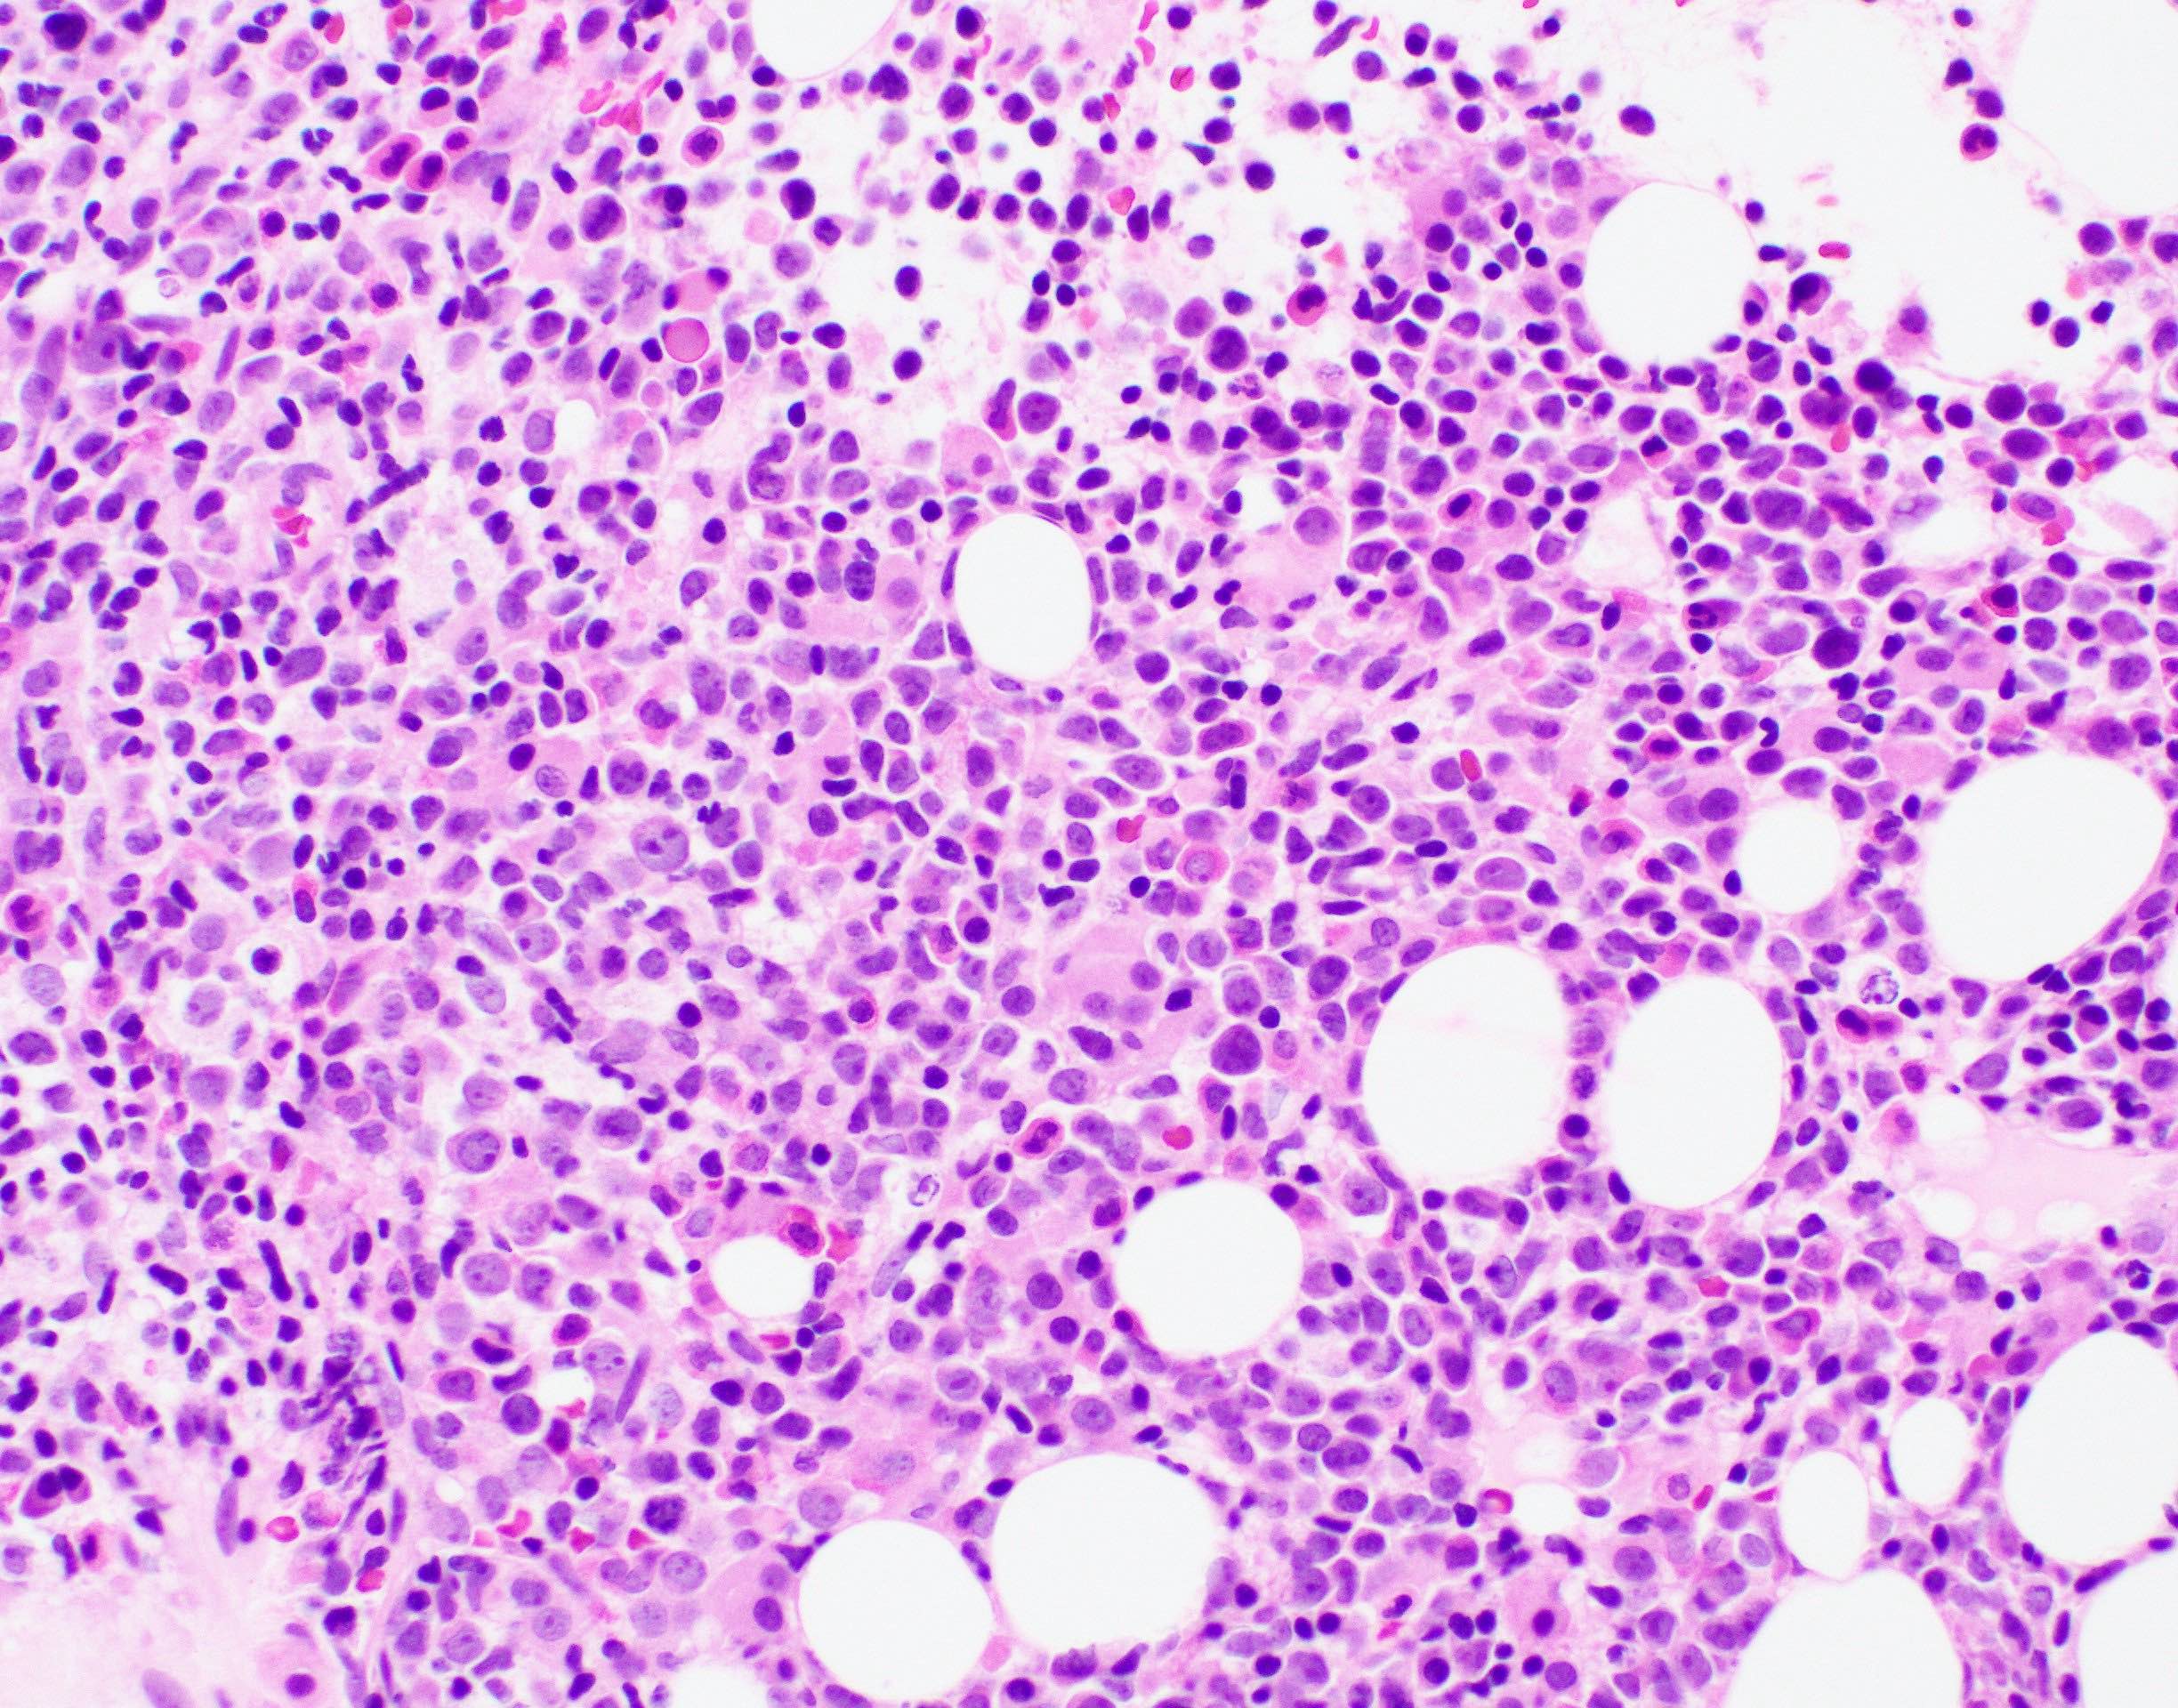
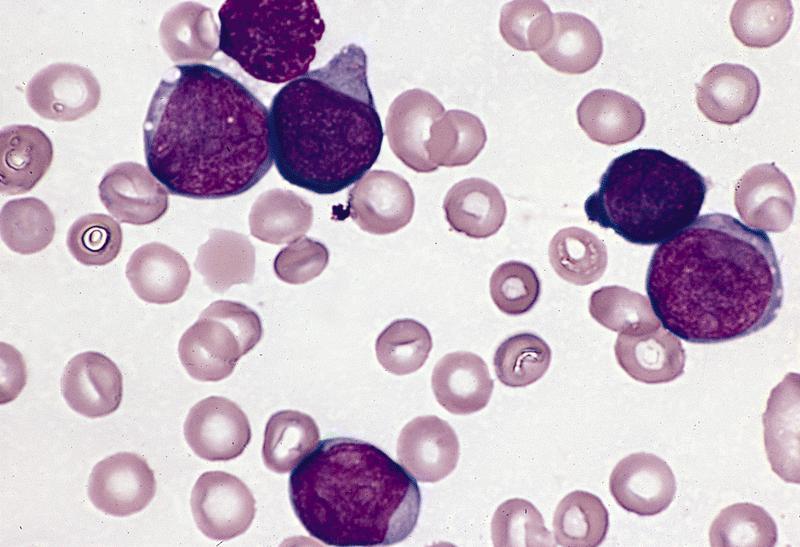
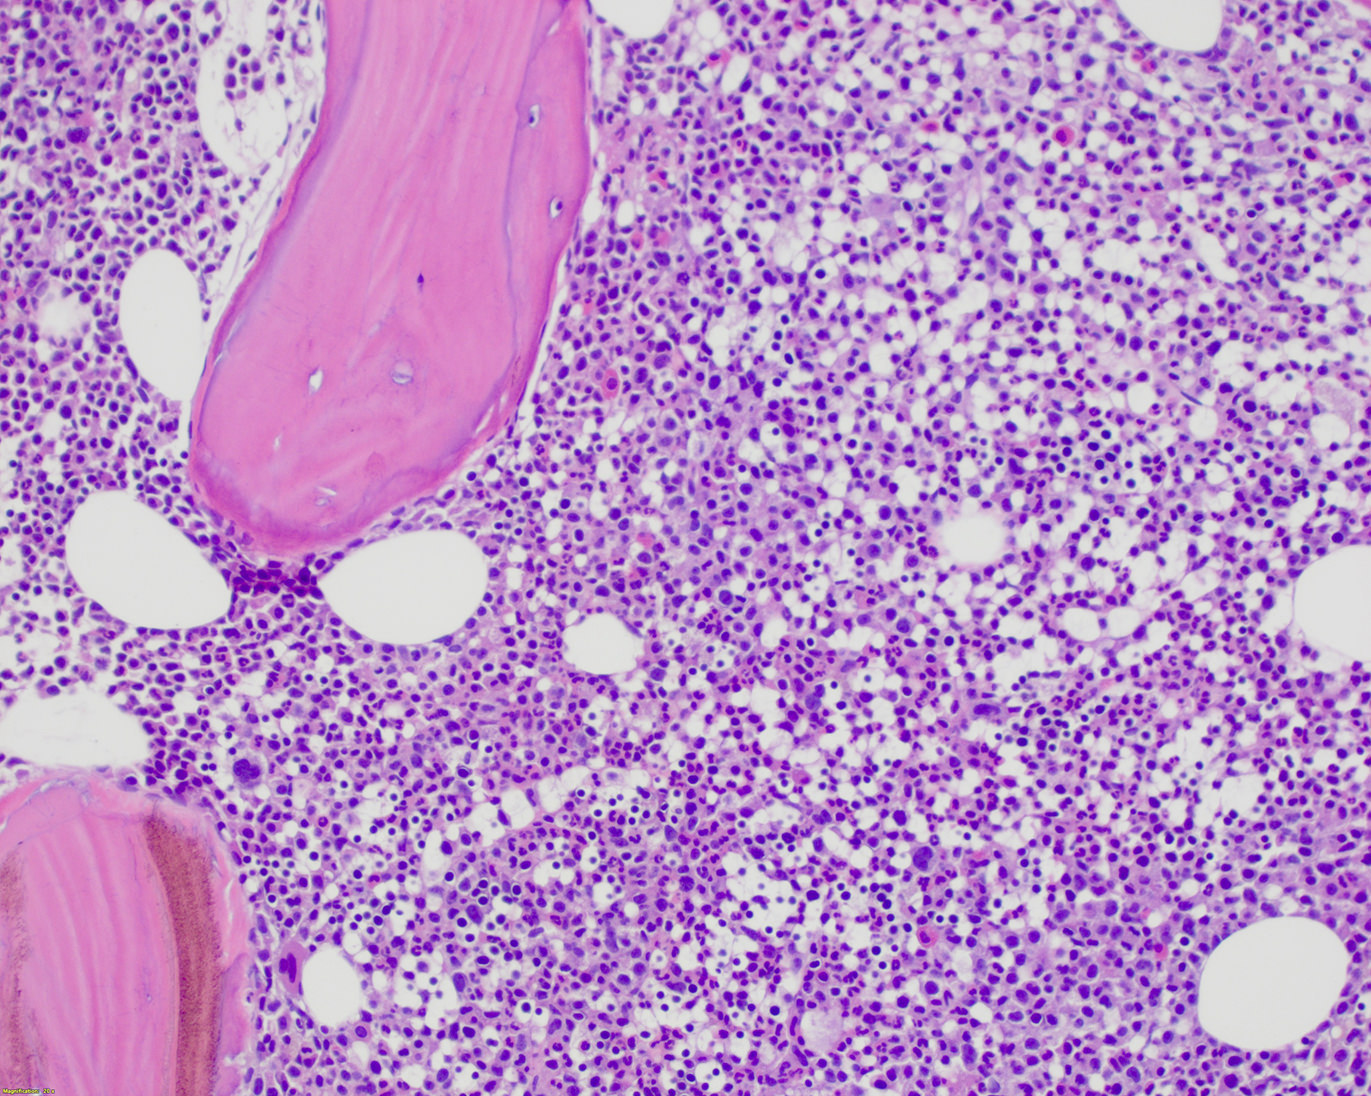
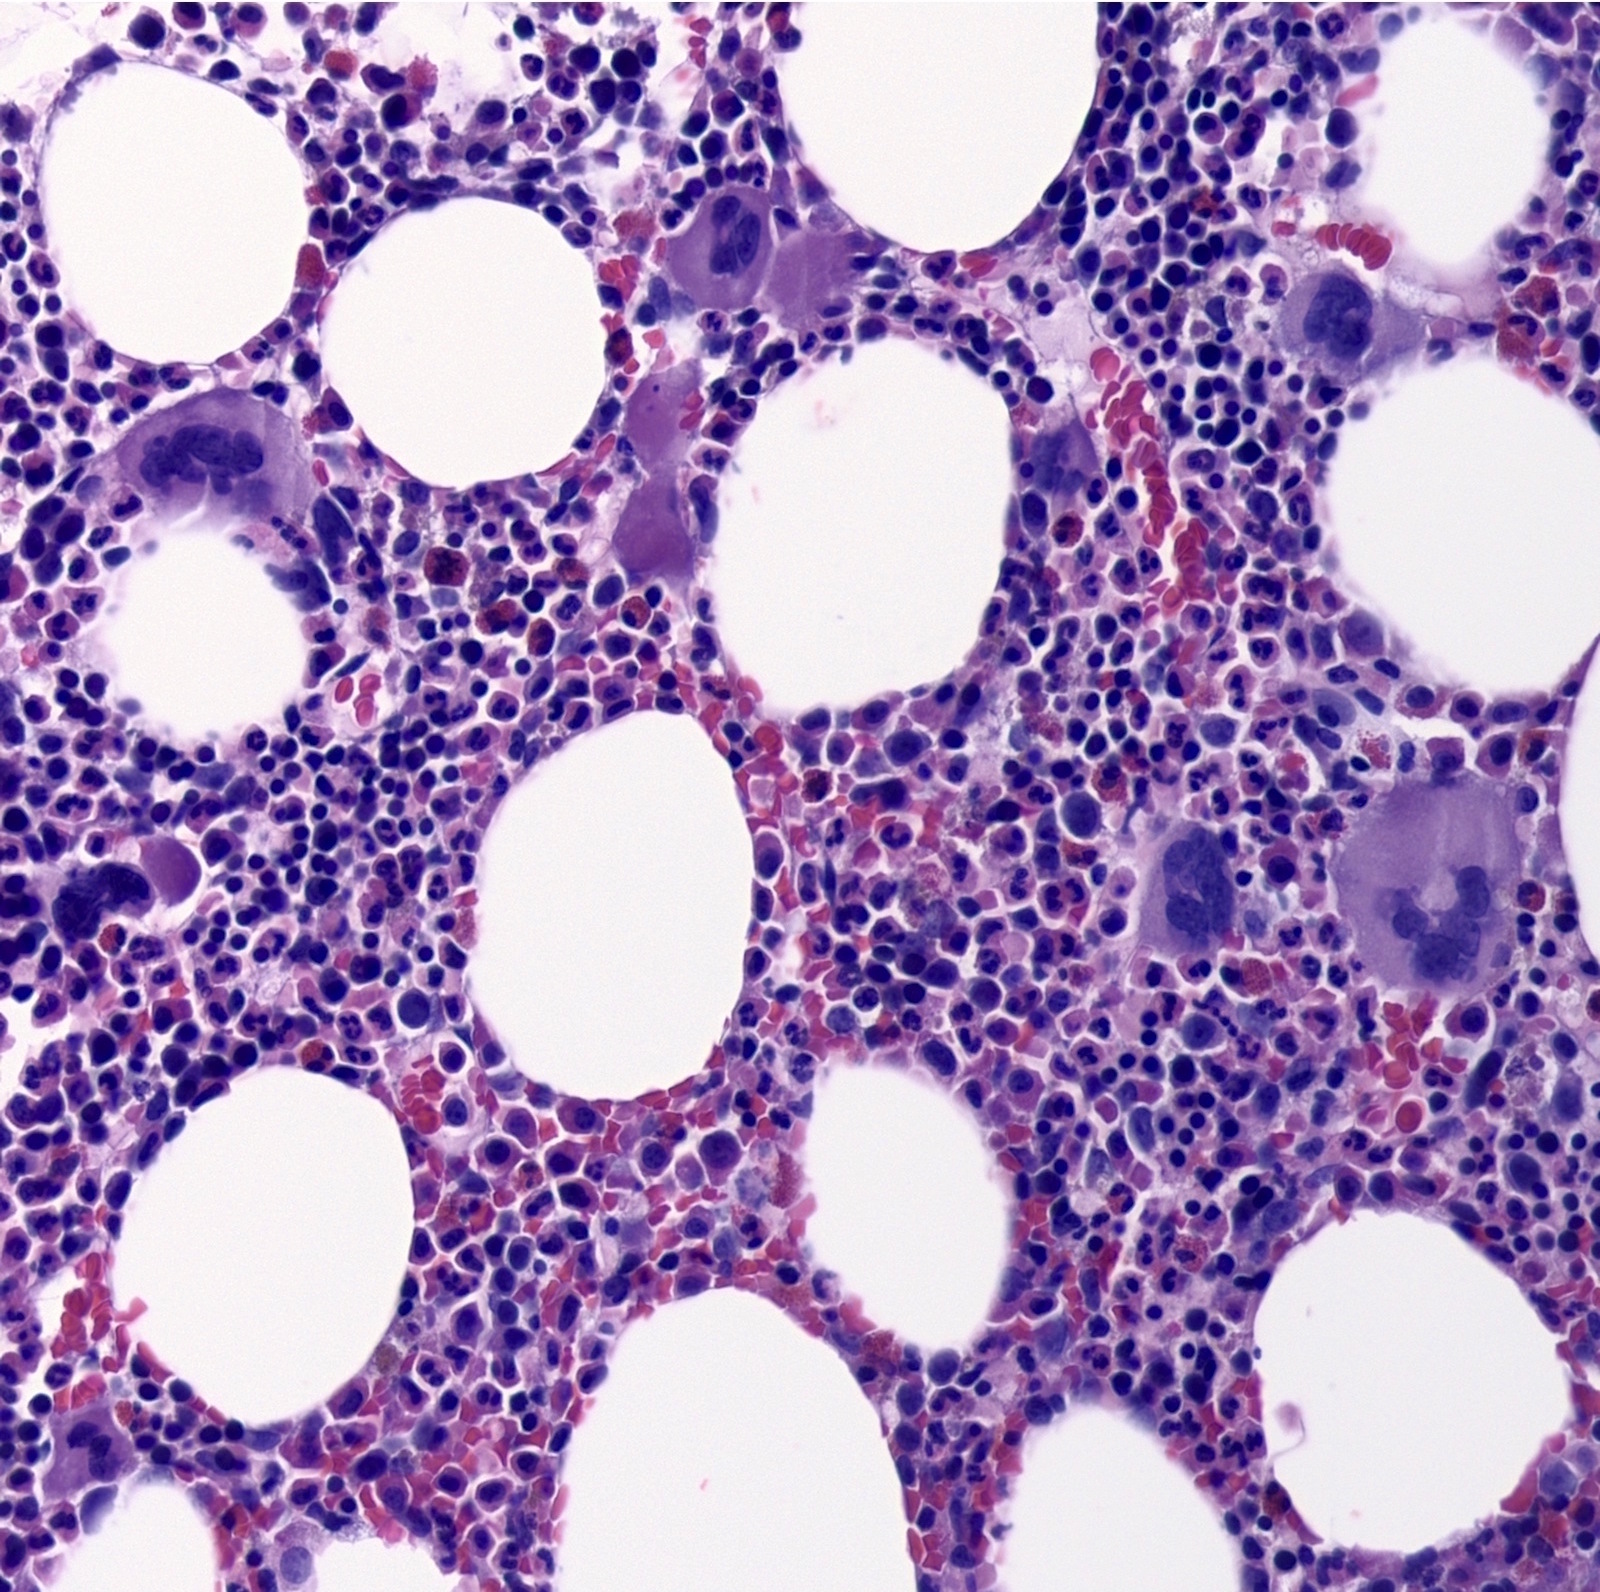
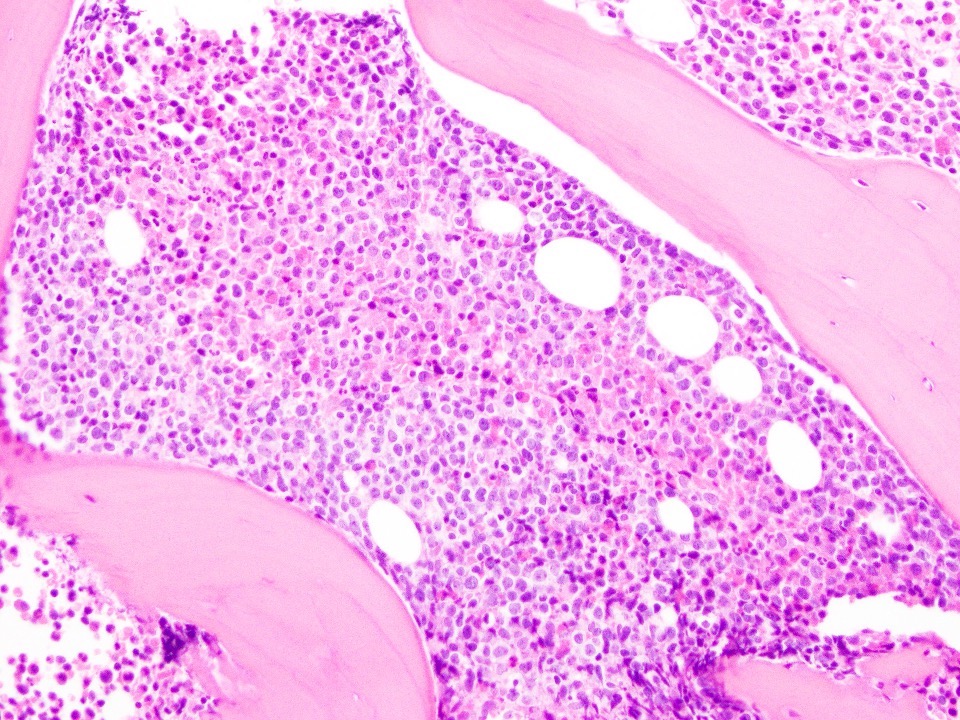
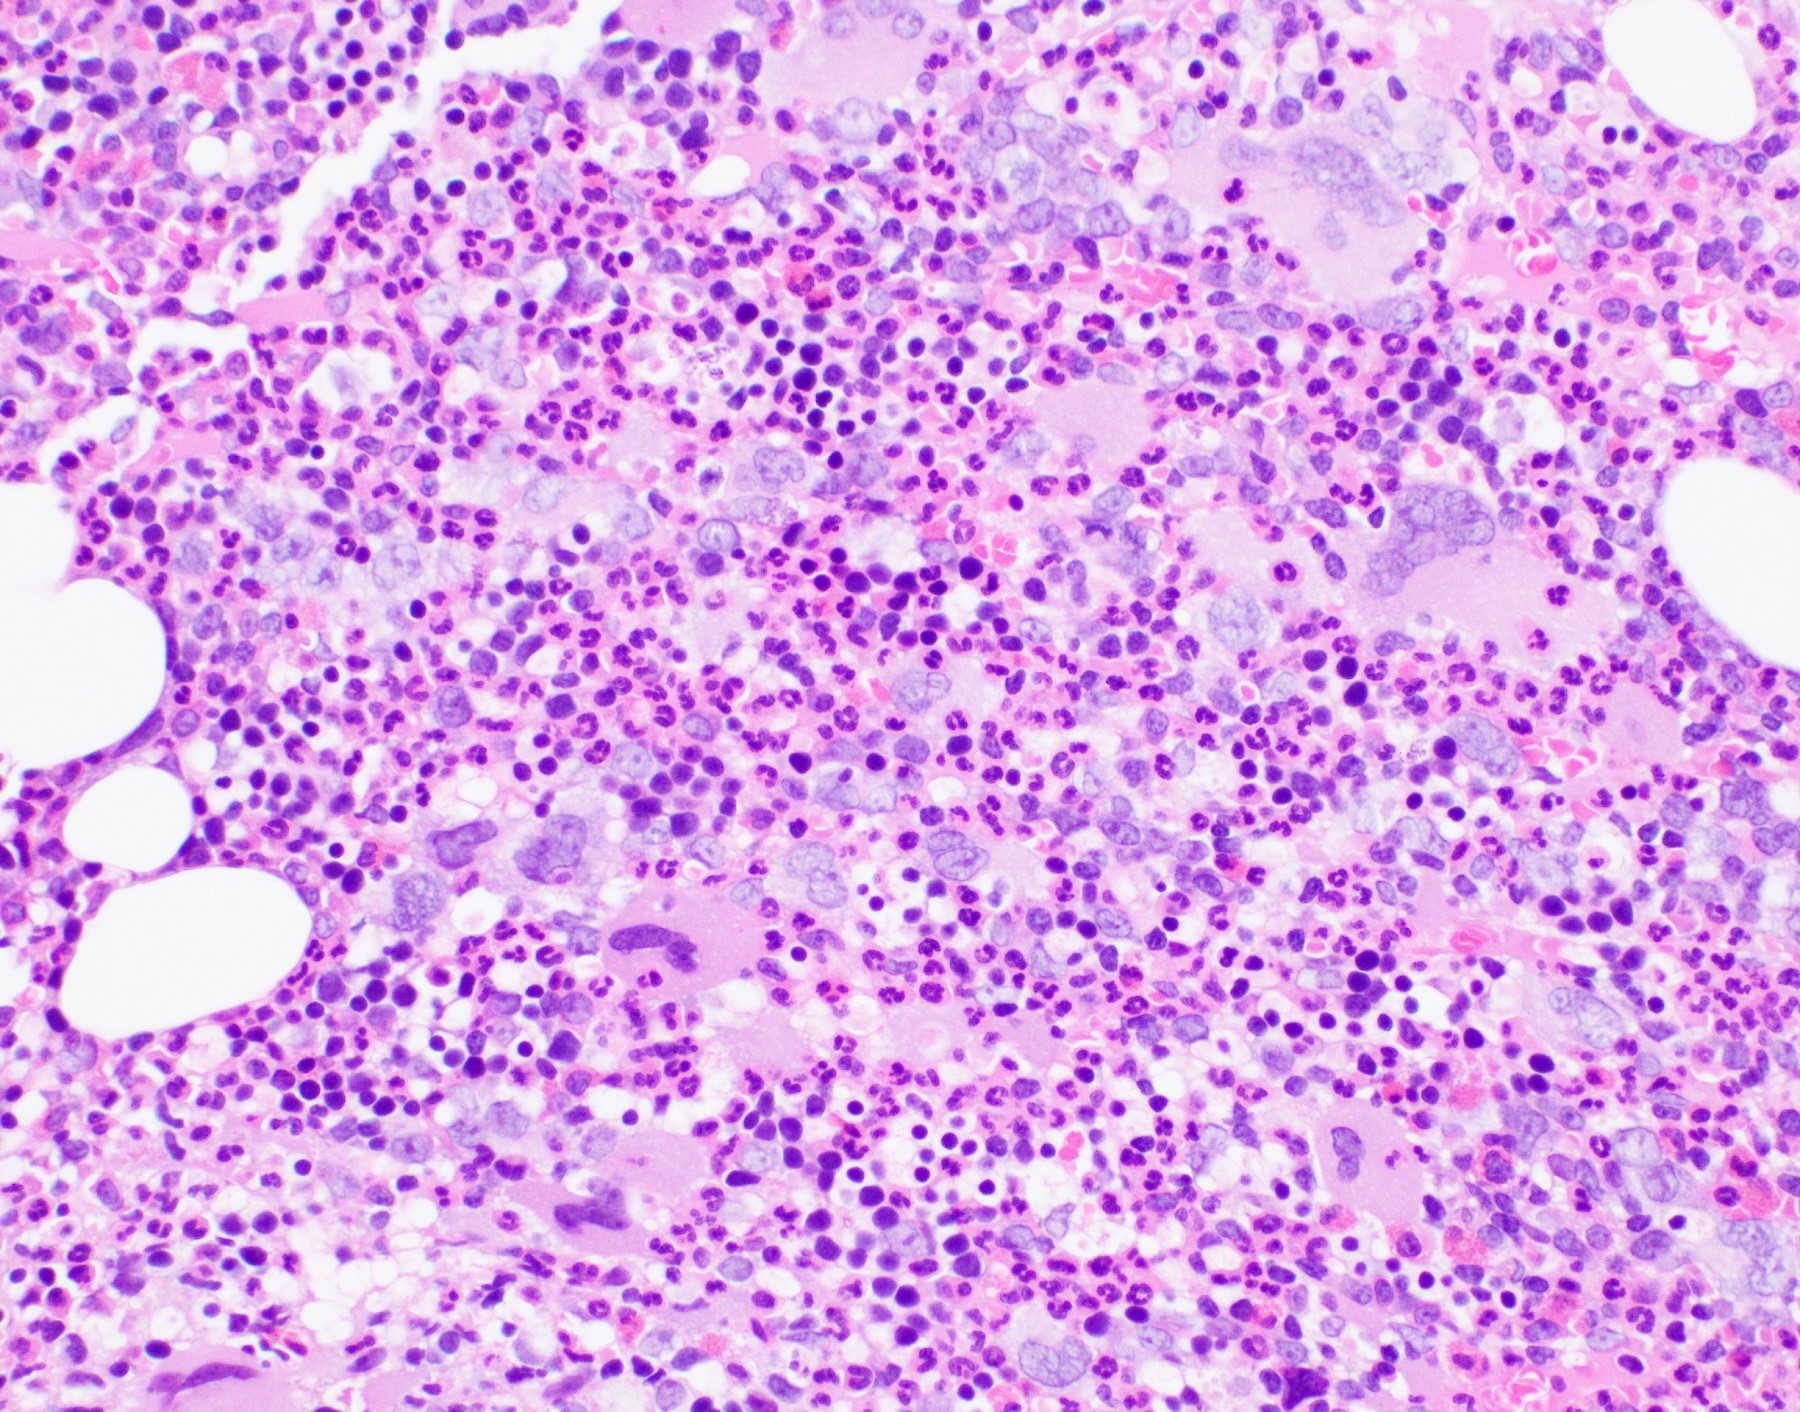
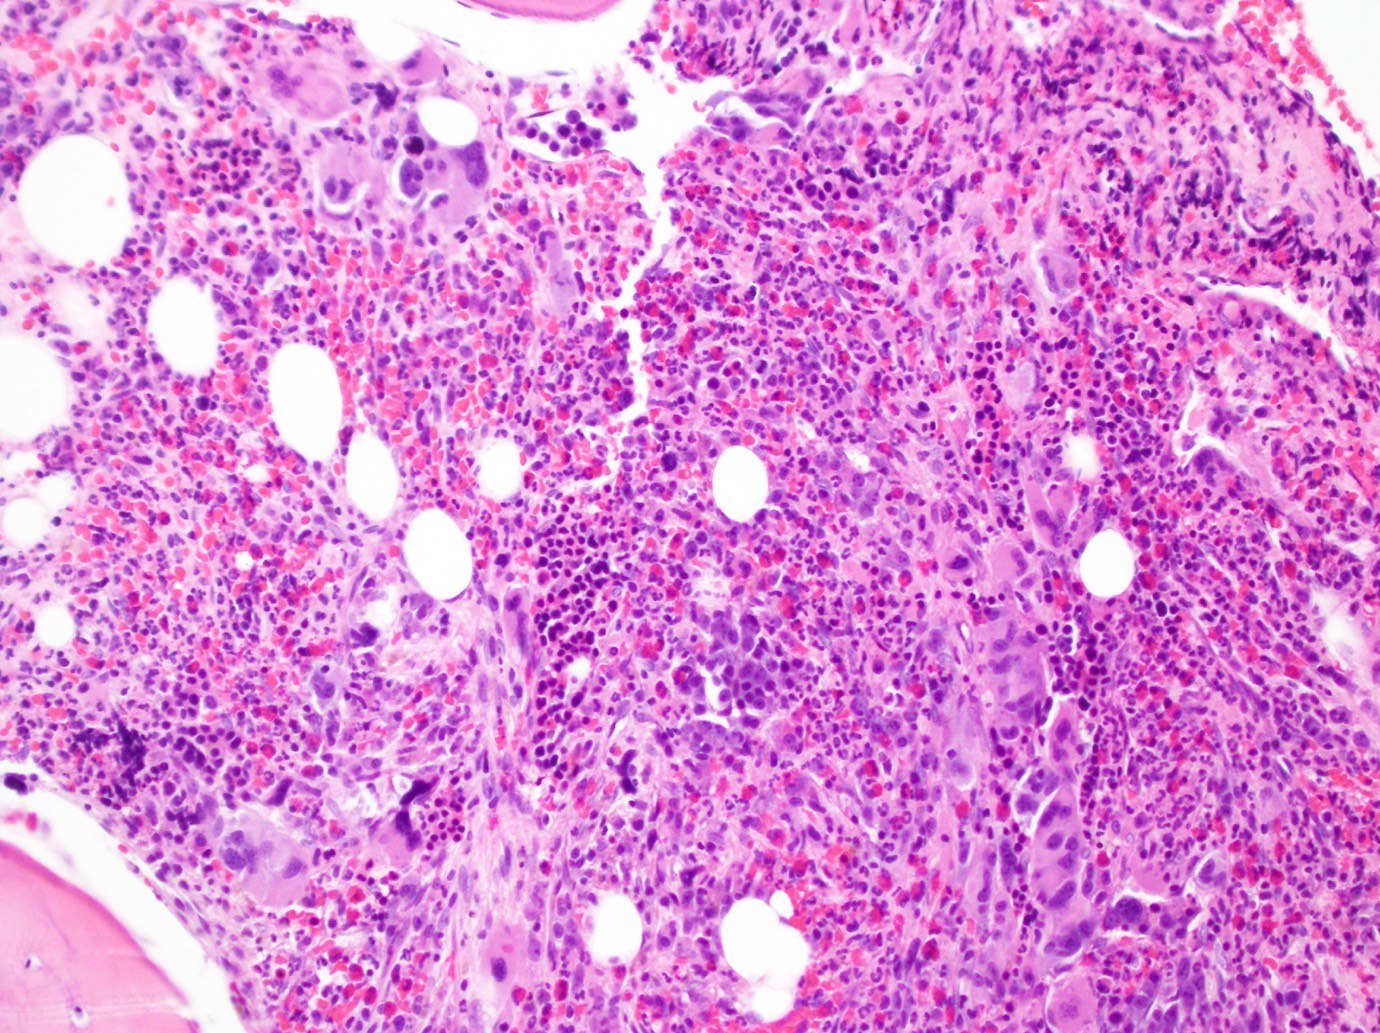
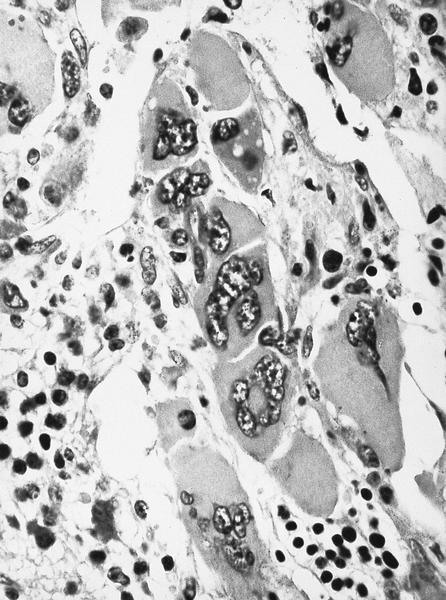
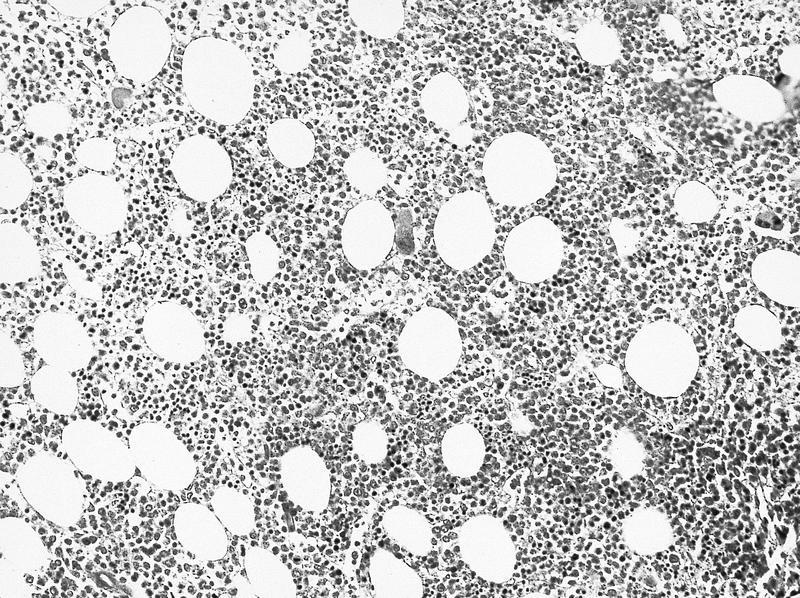
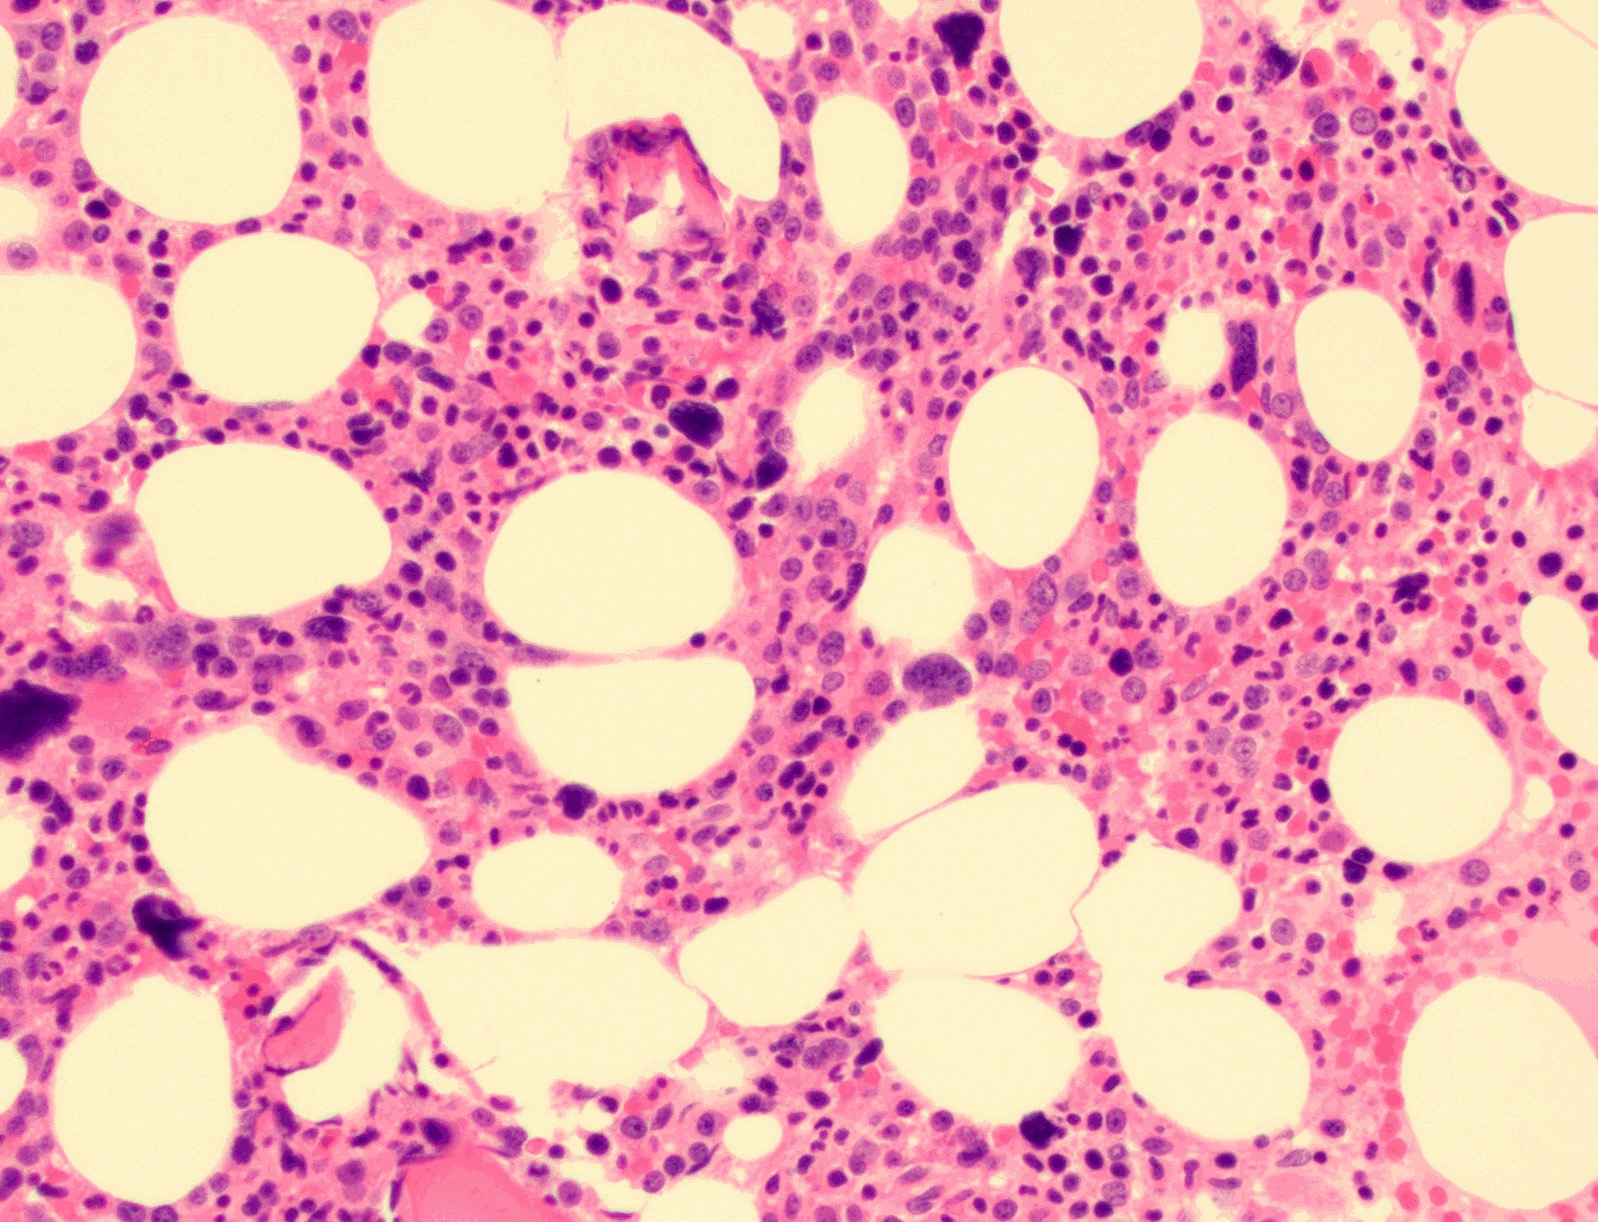
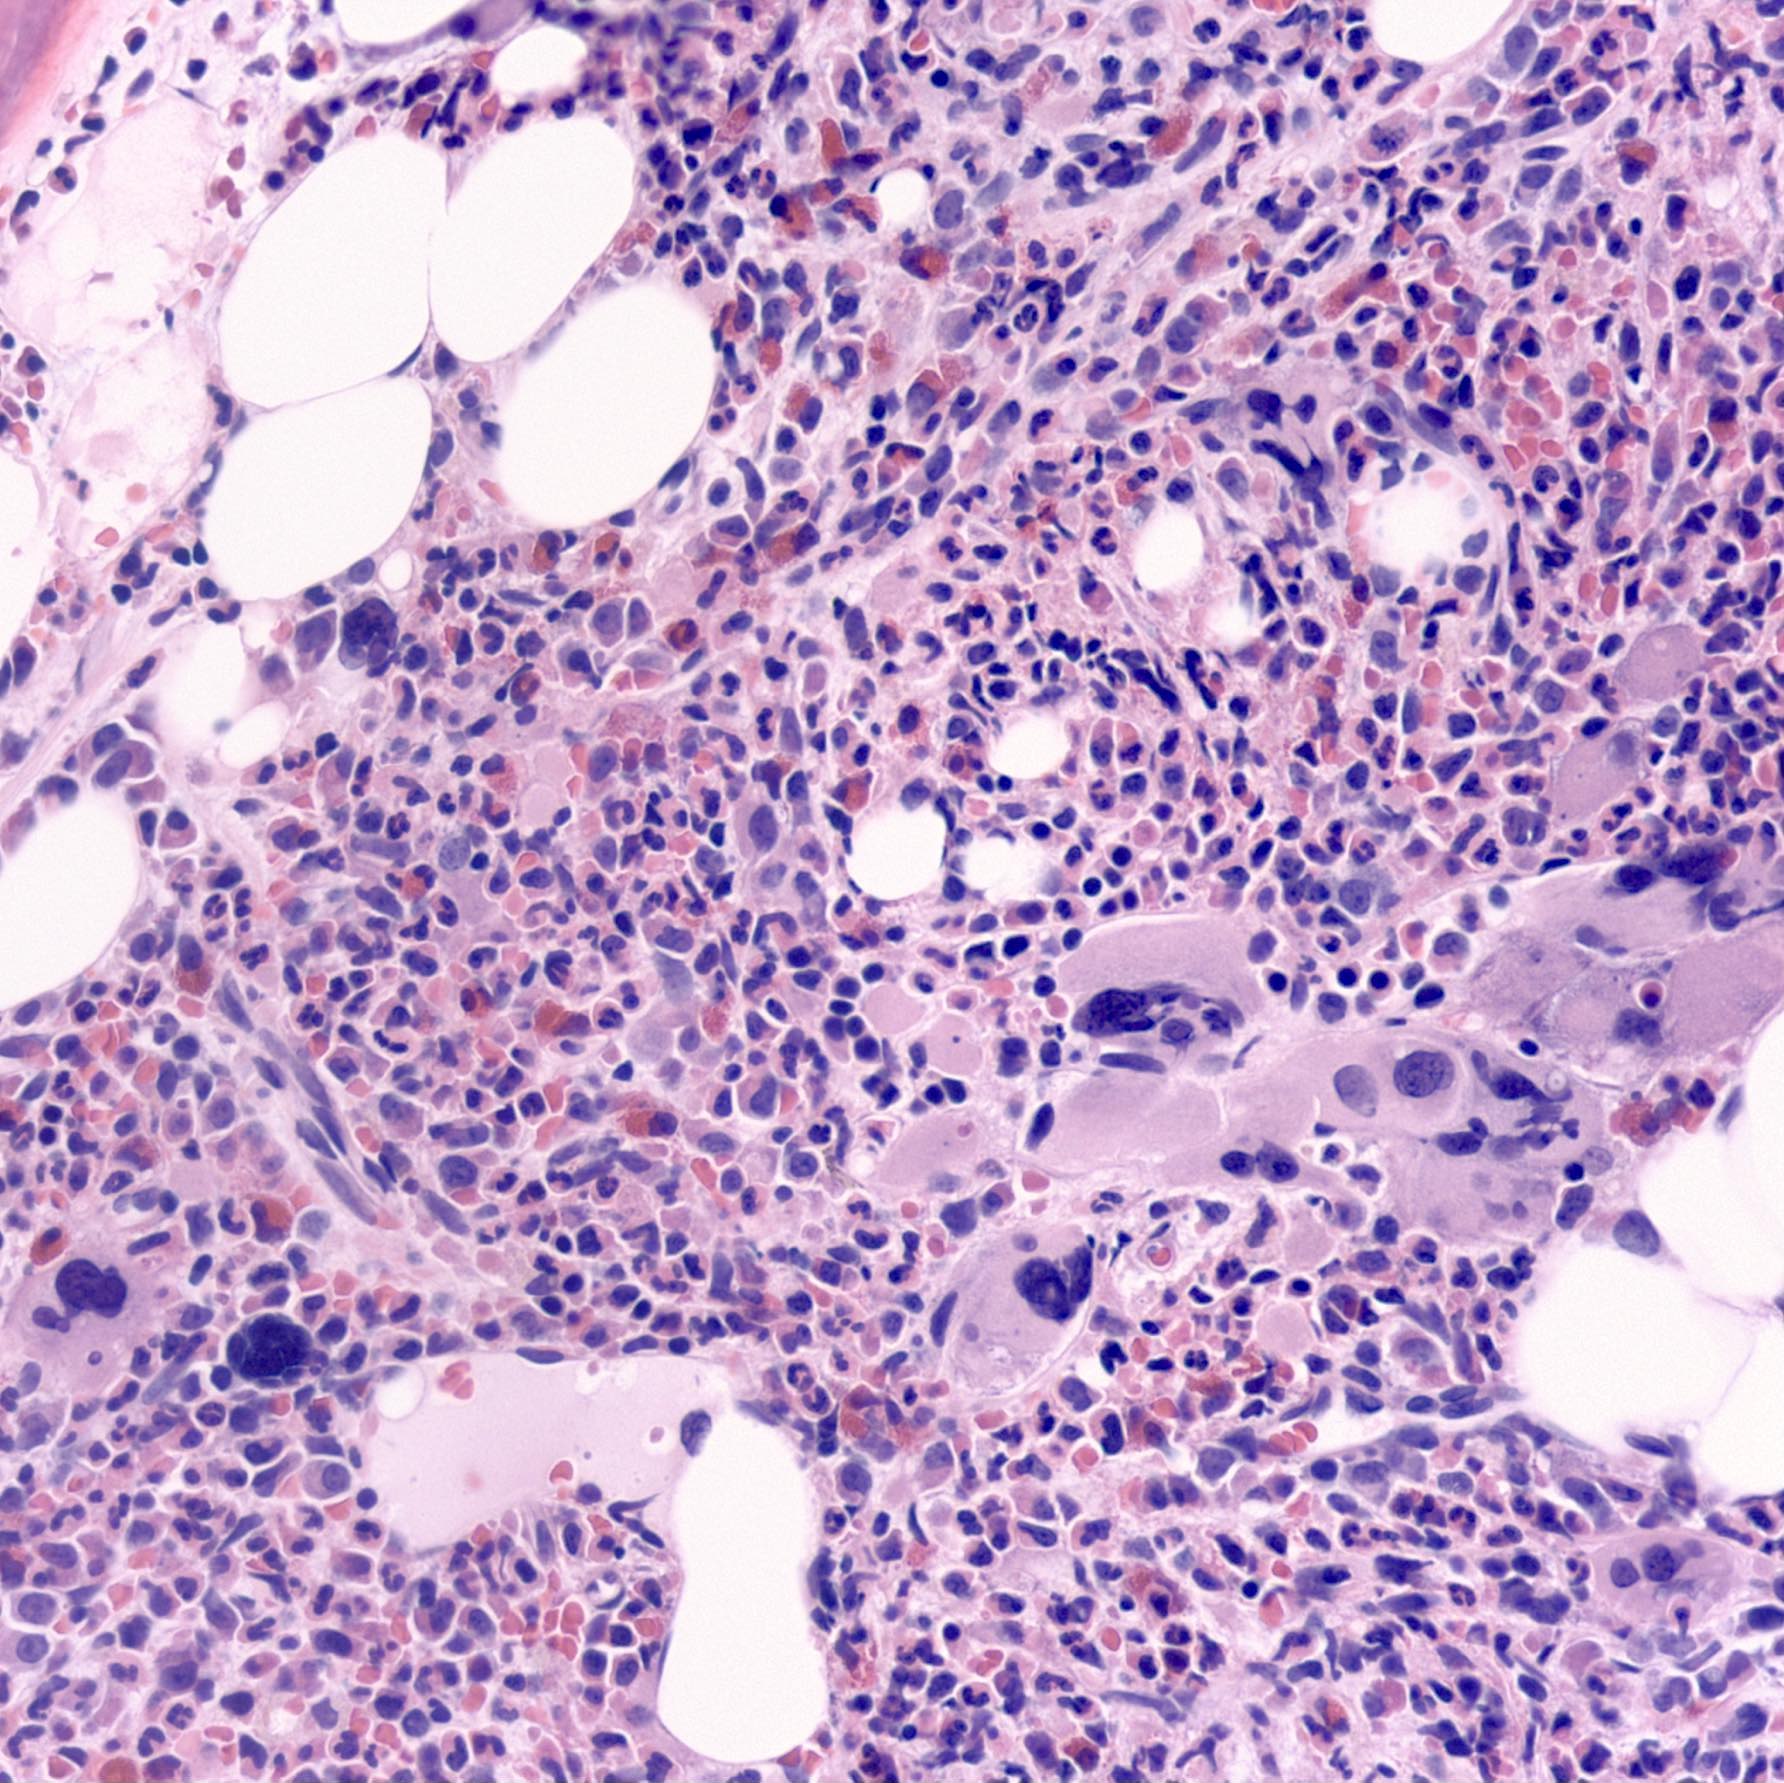
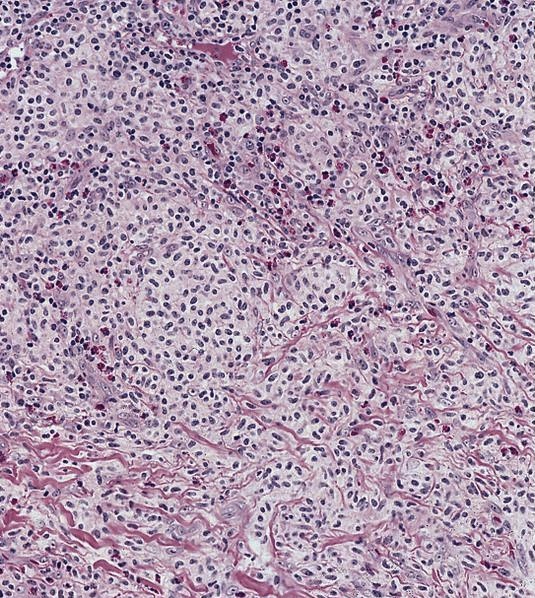
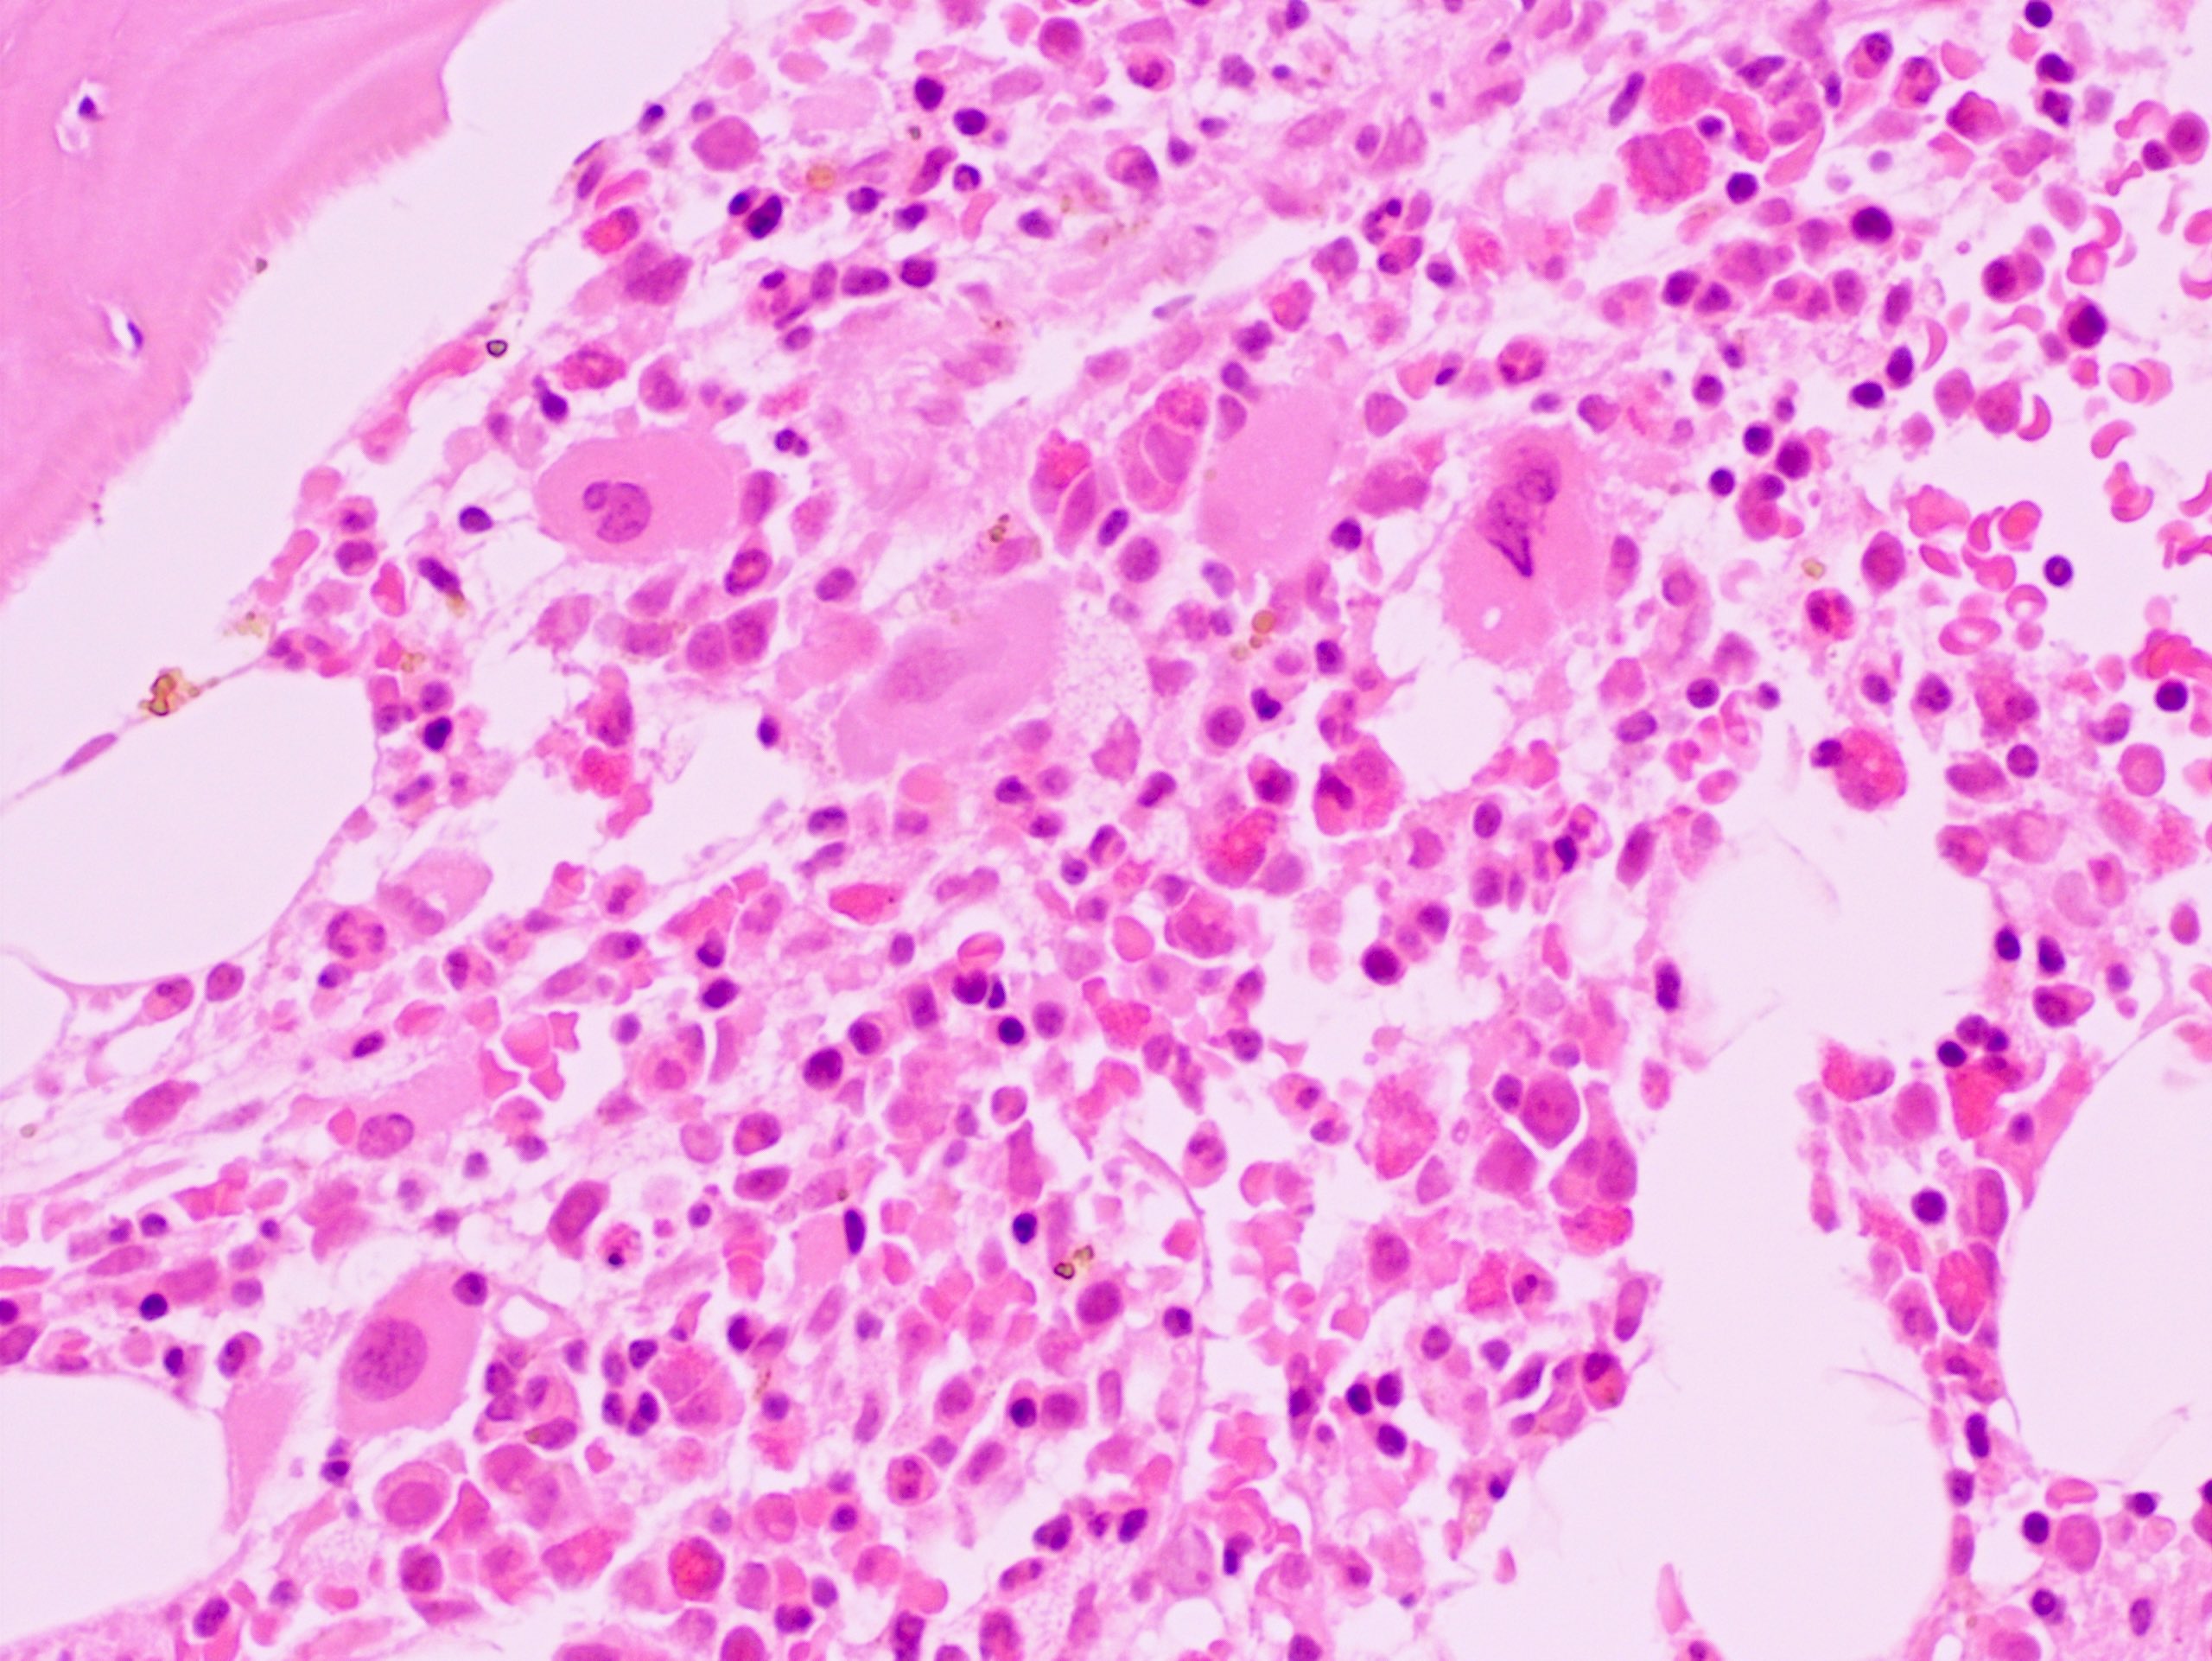
Marked proliferation of megakaryocytes
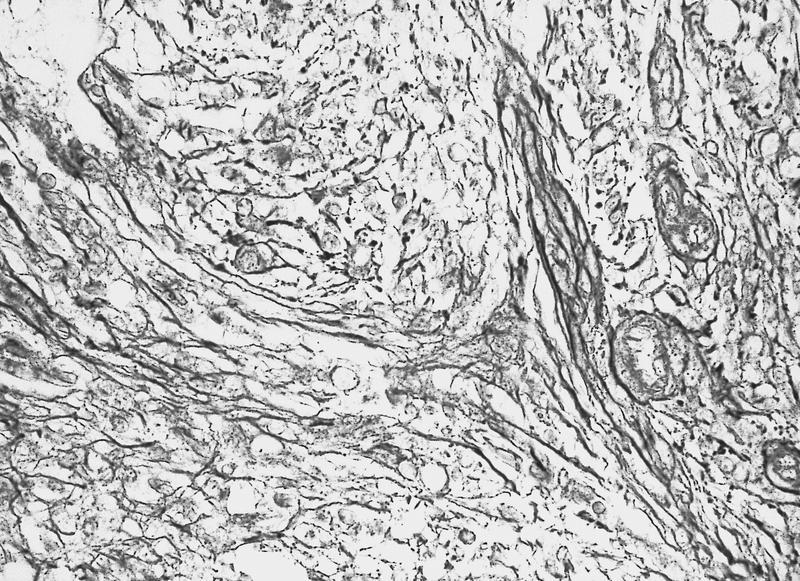
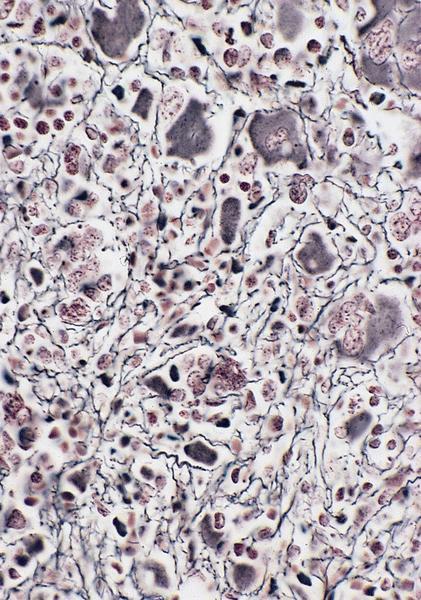
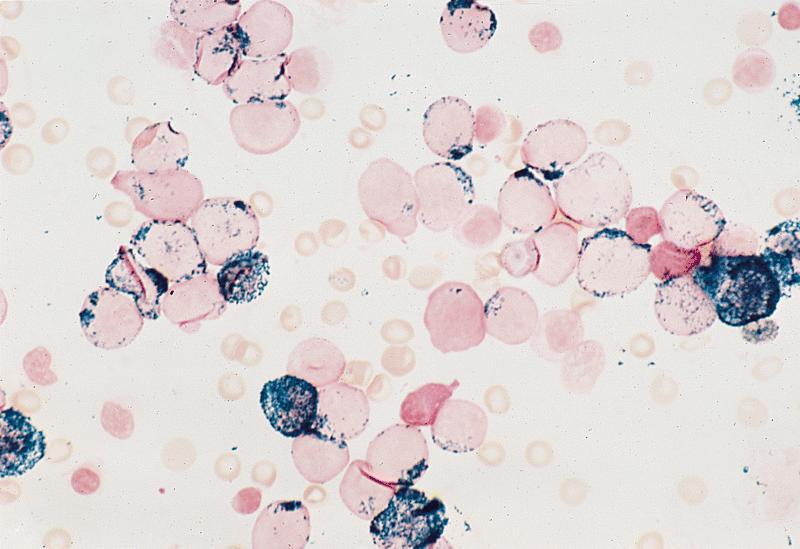
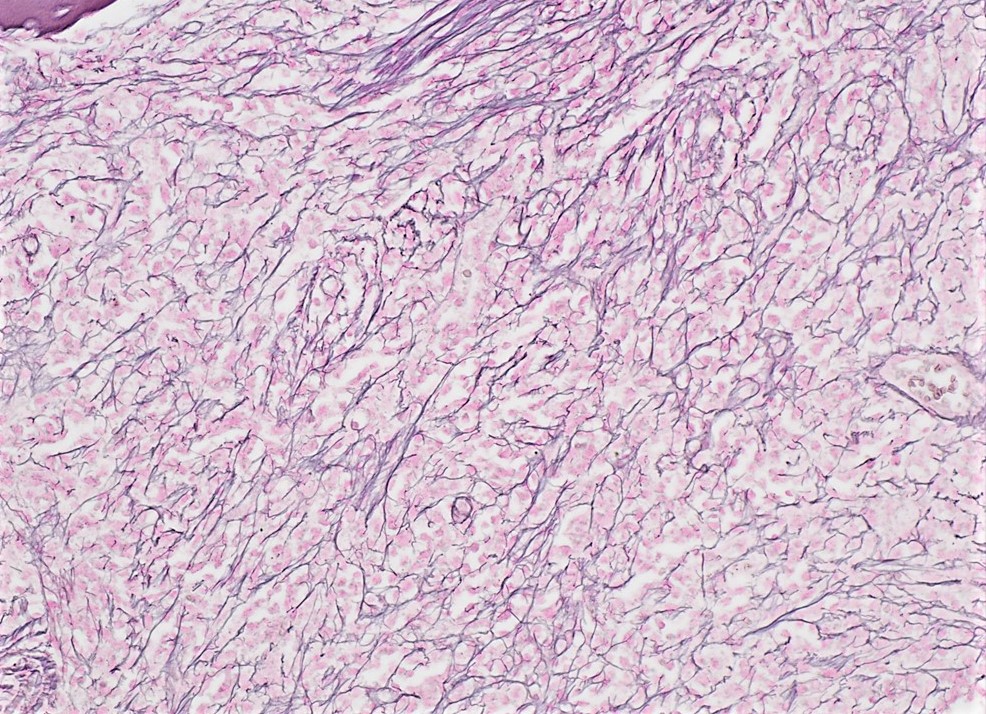
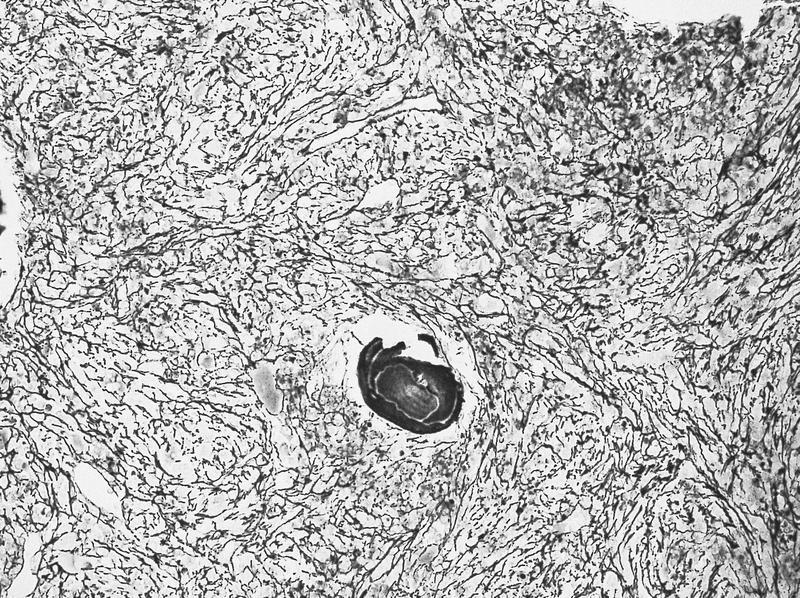
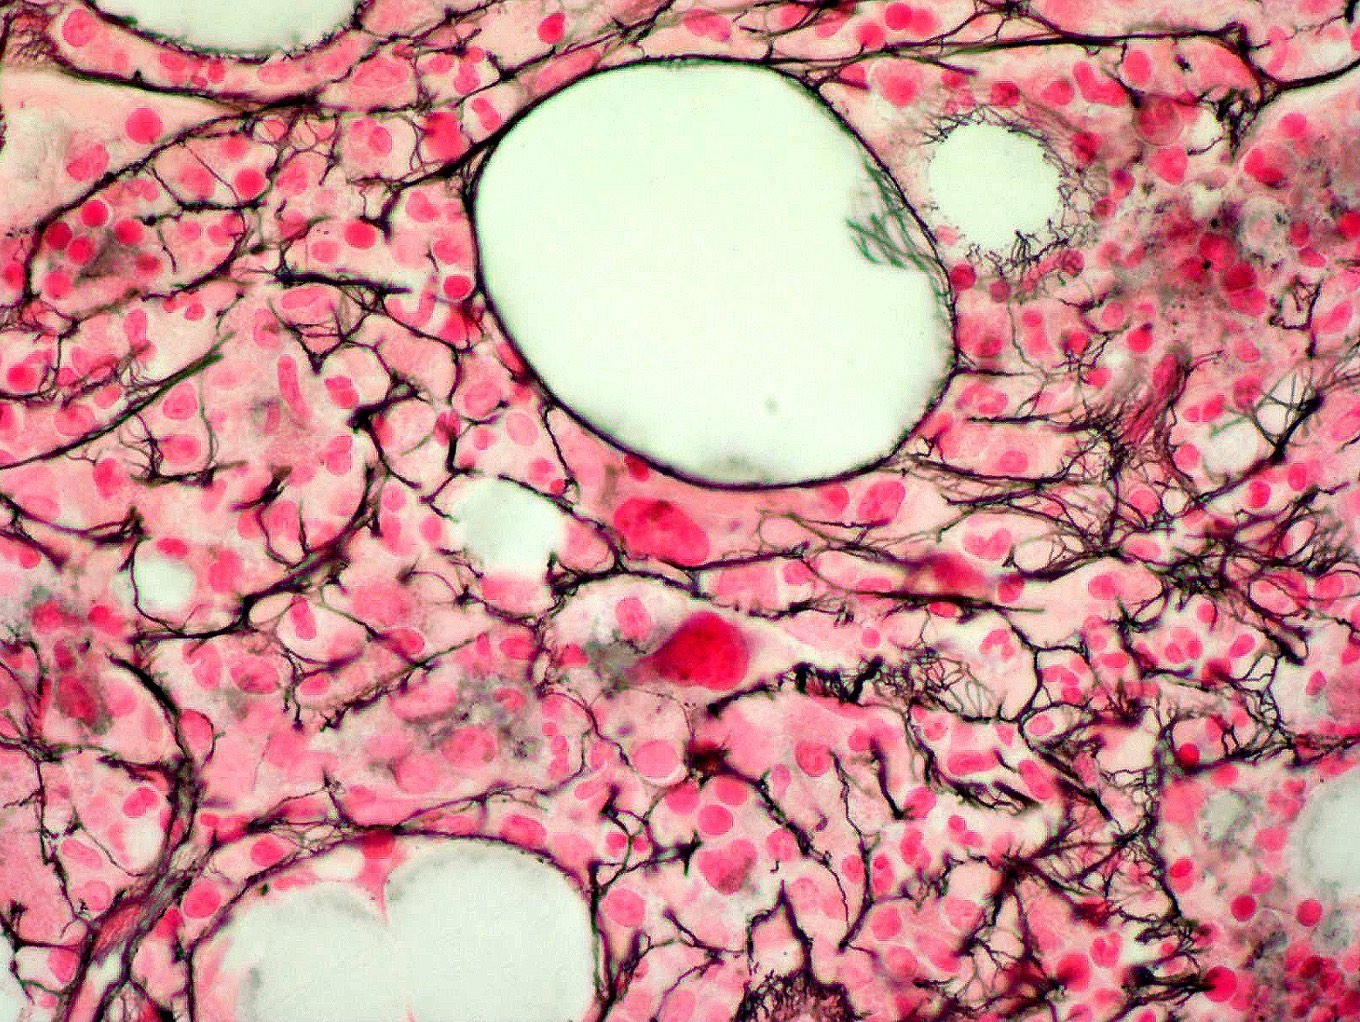
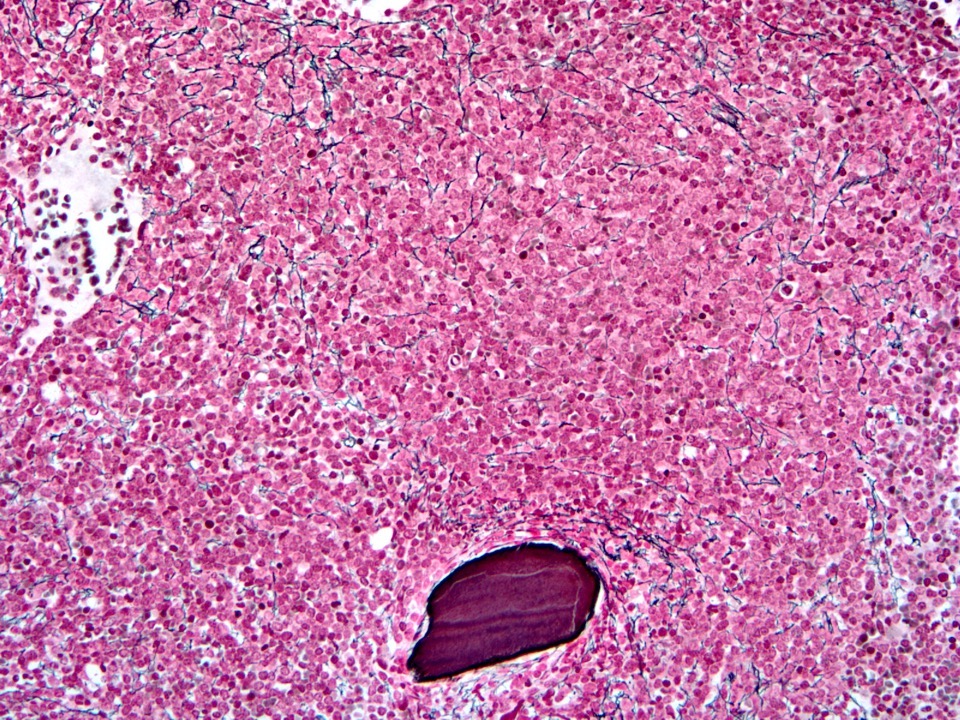
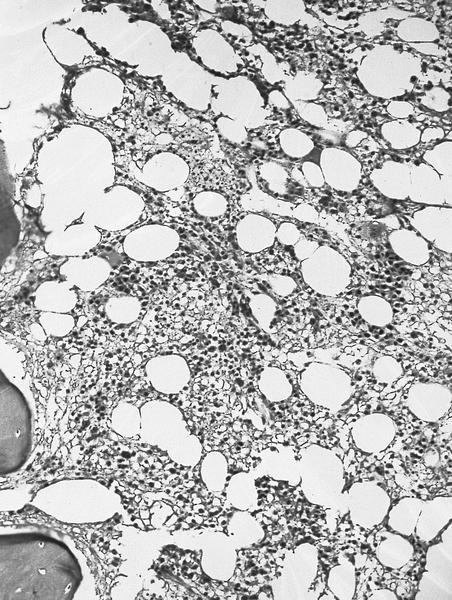
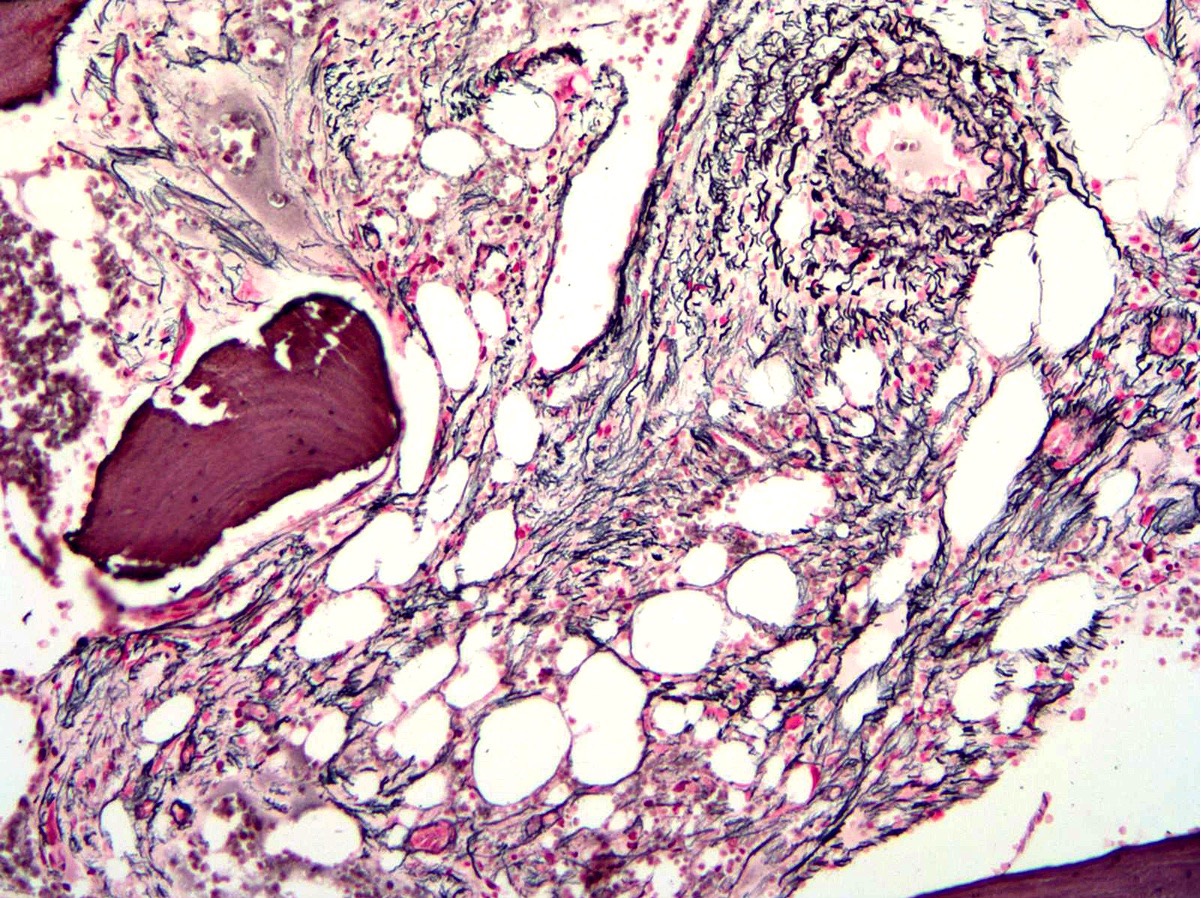
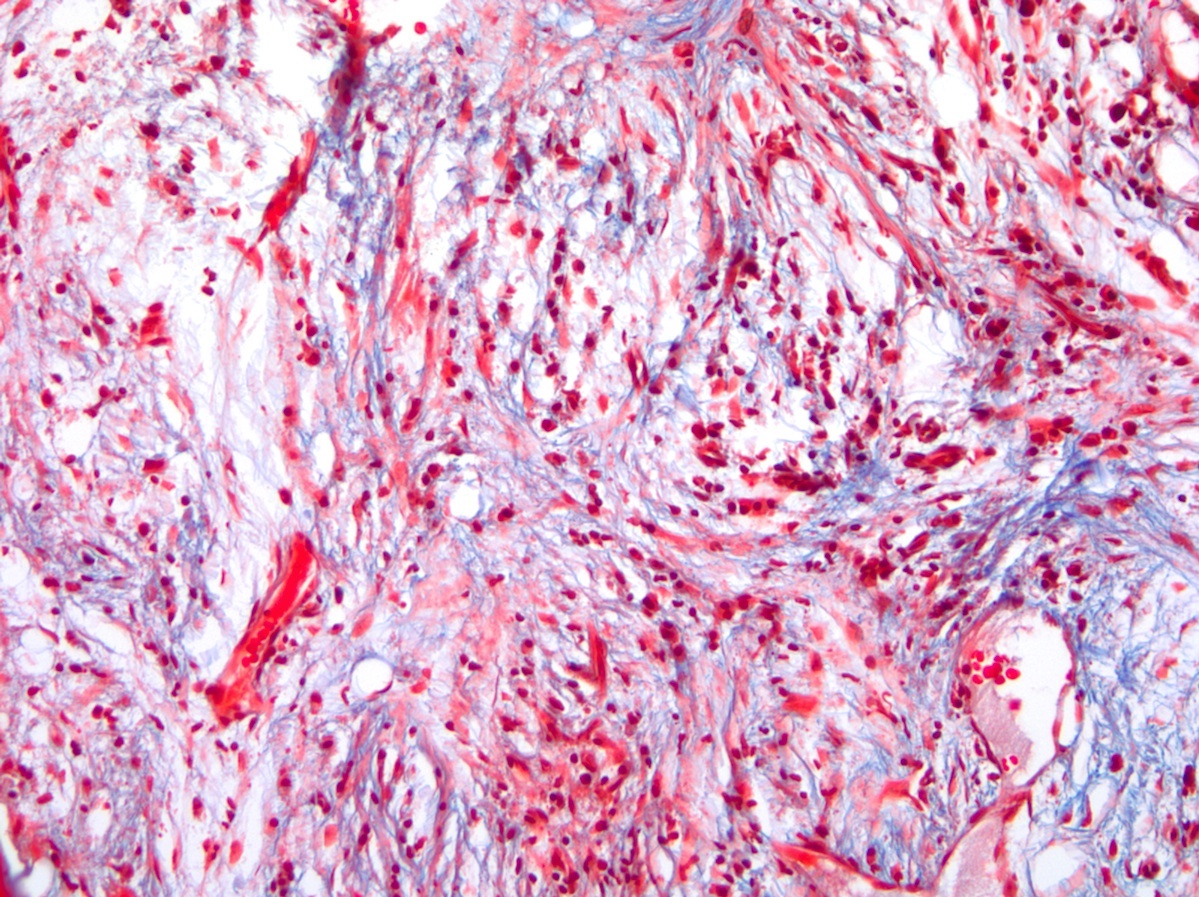
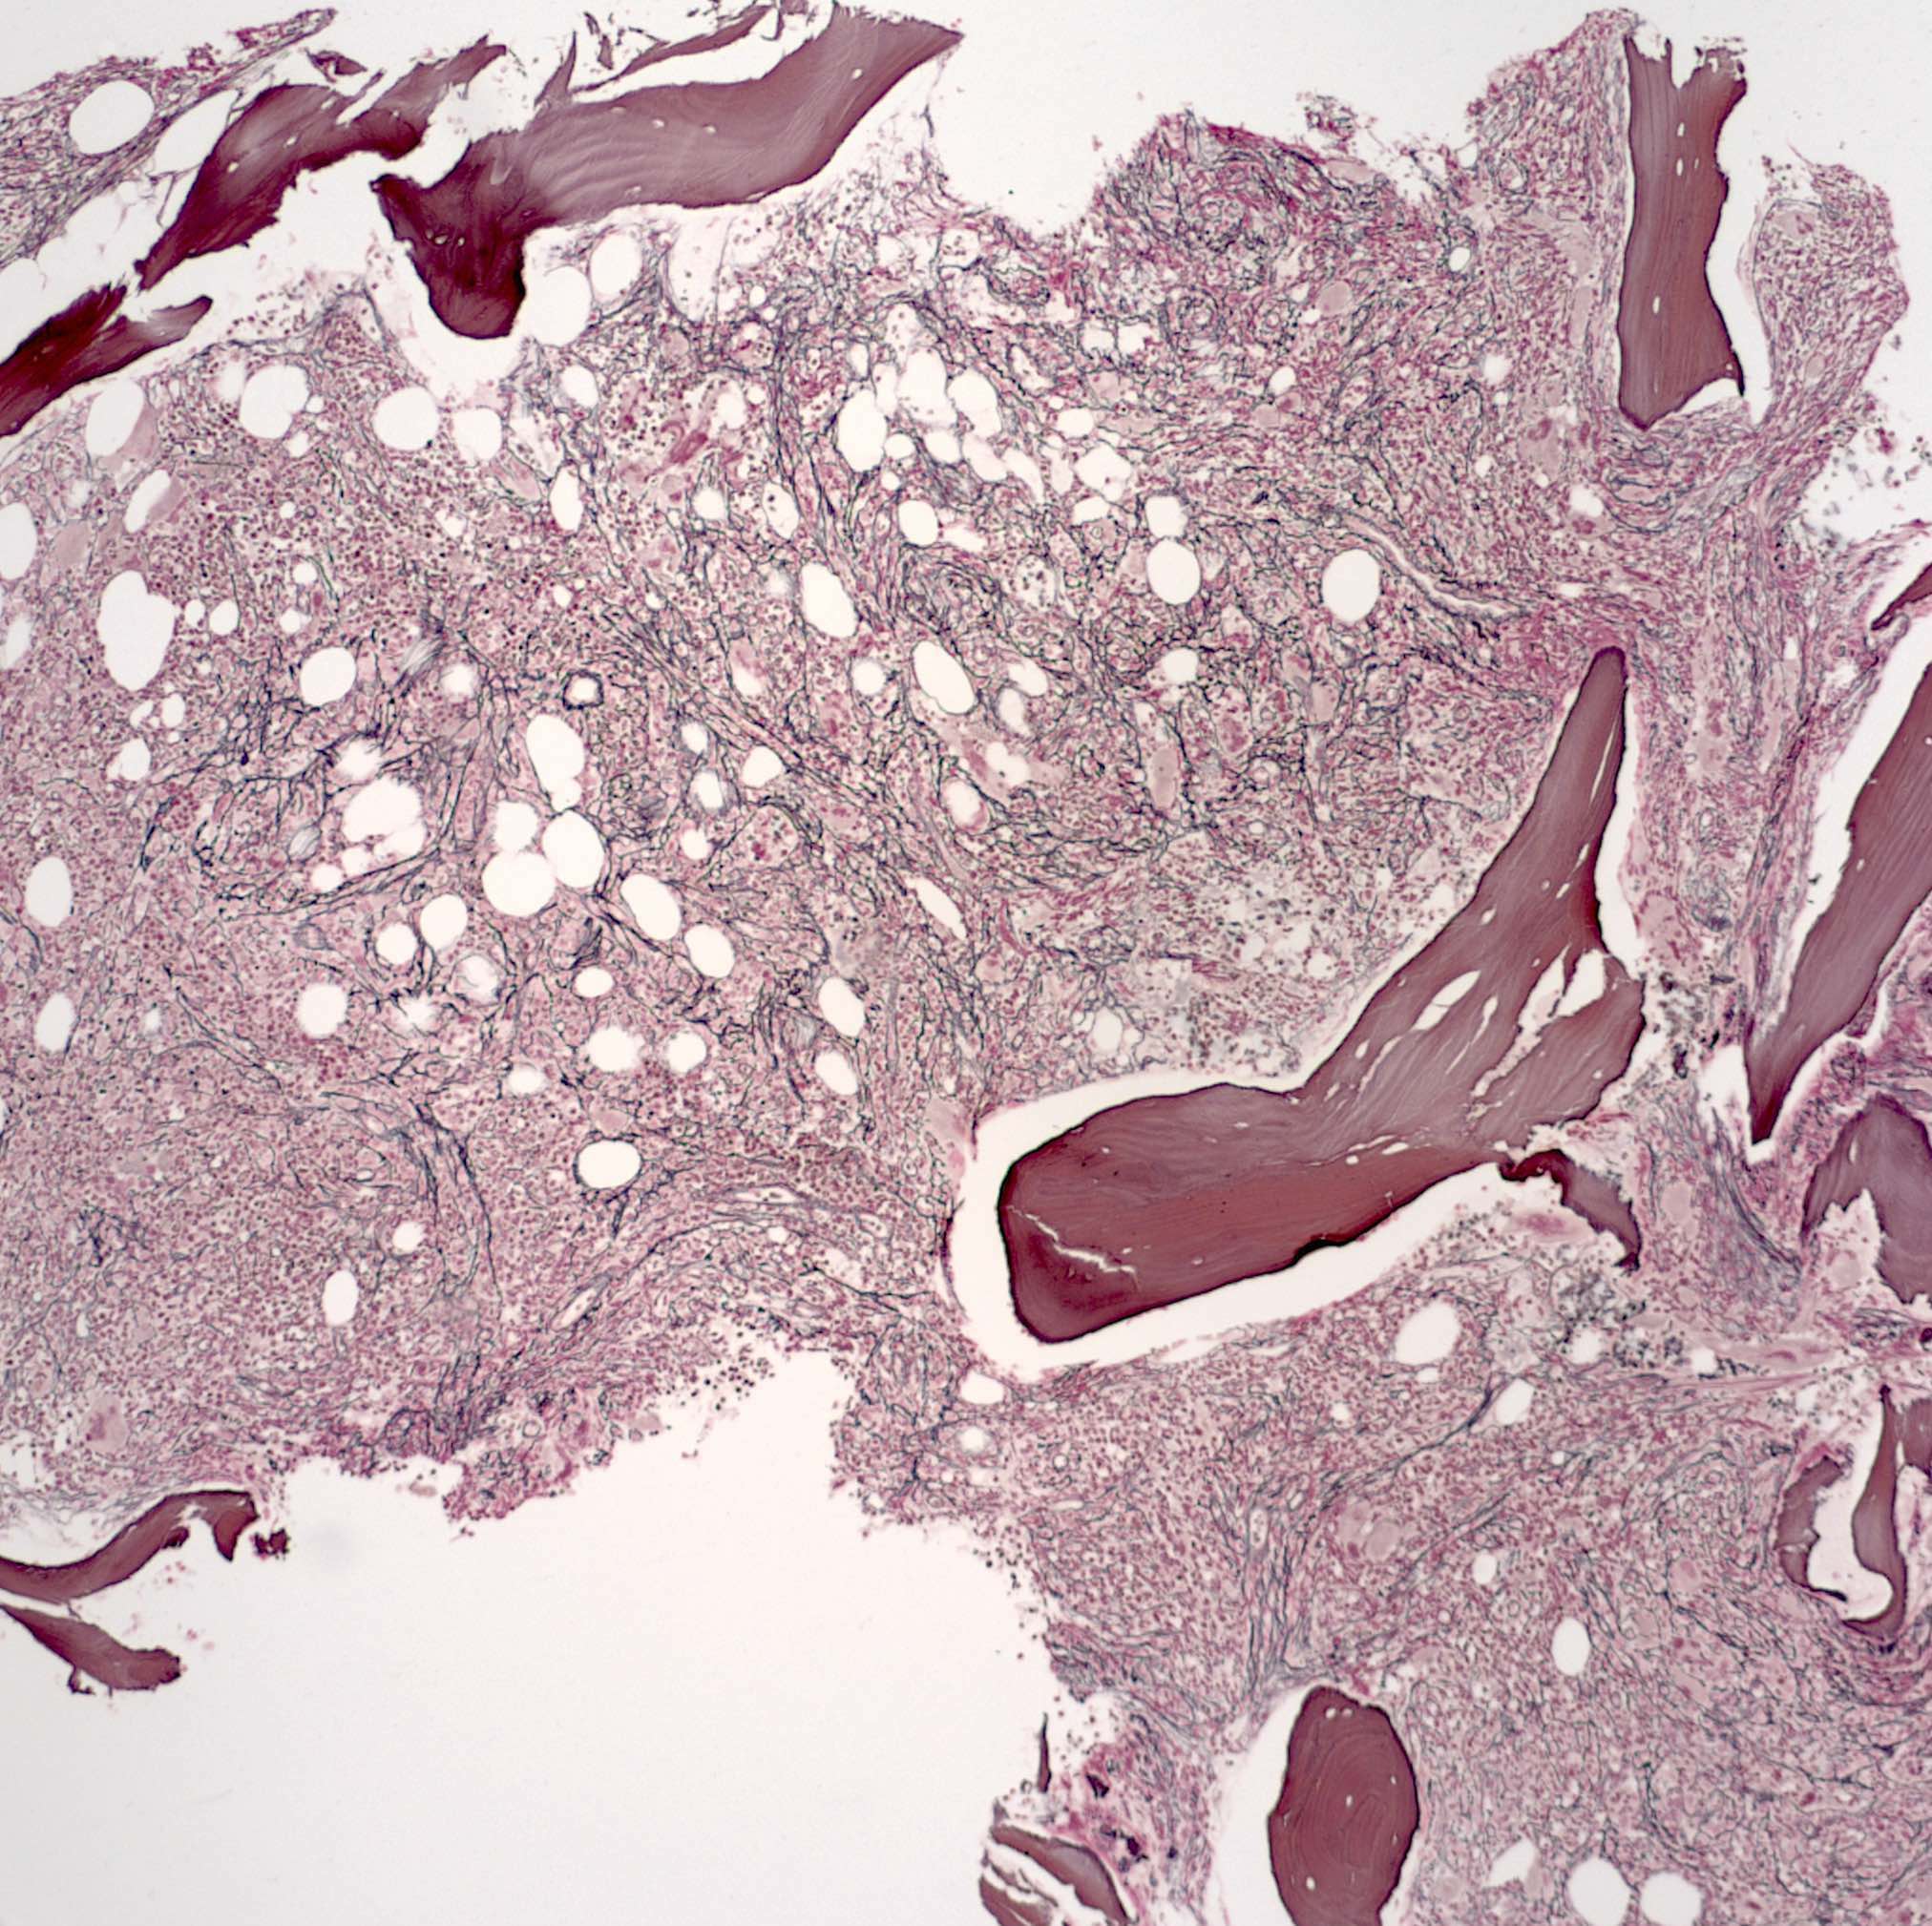
Reticulin stain shows marked increase in reticulin fibers
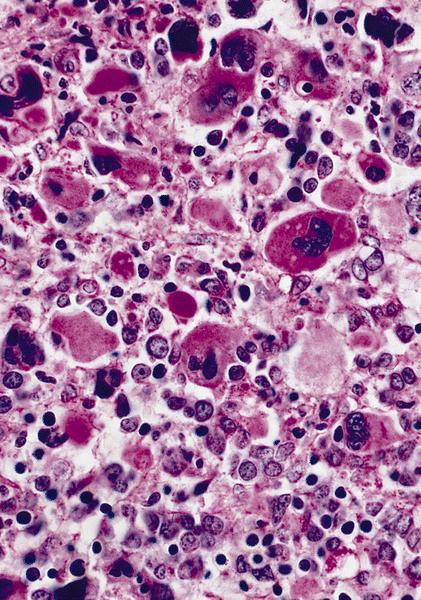
PAS+
Images hosted on other servers:

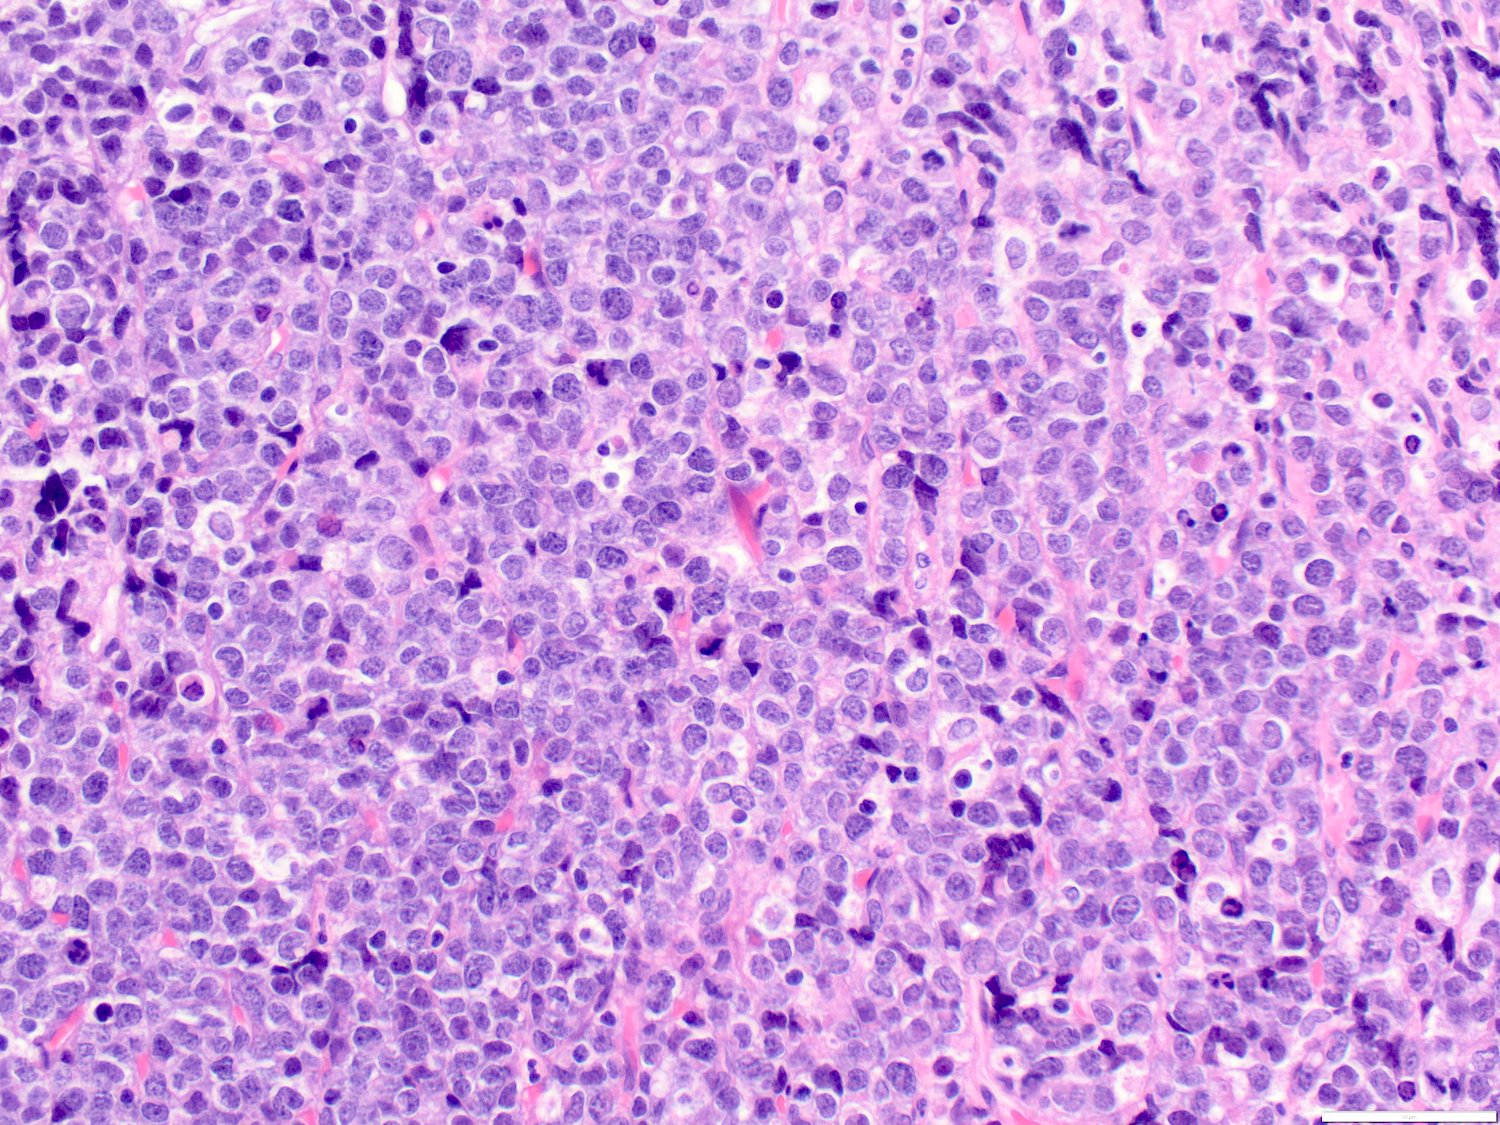
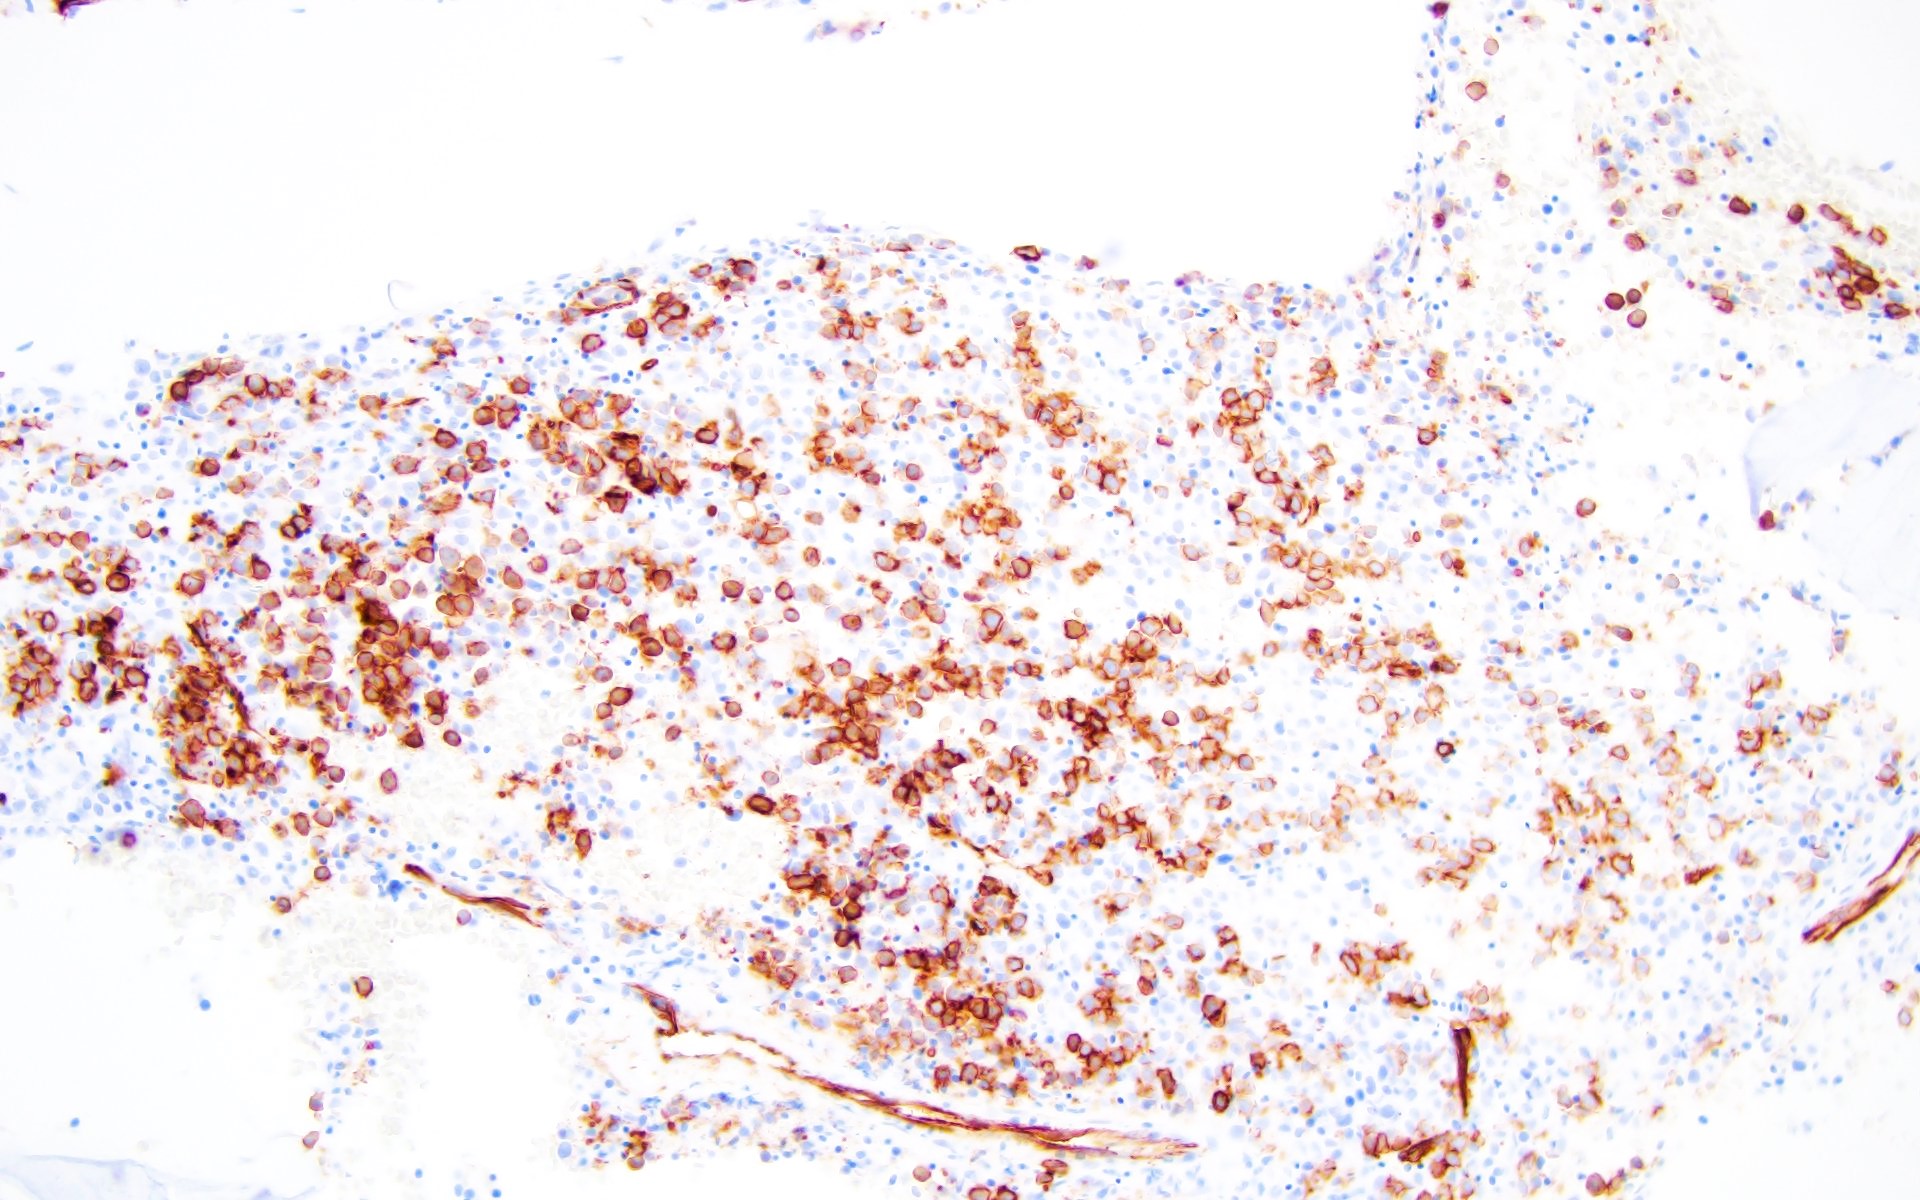
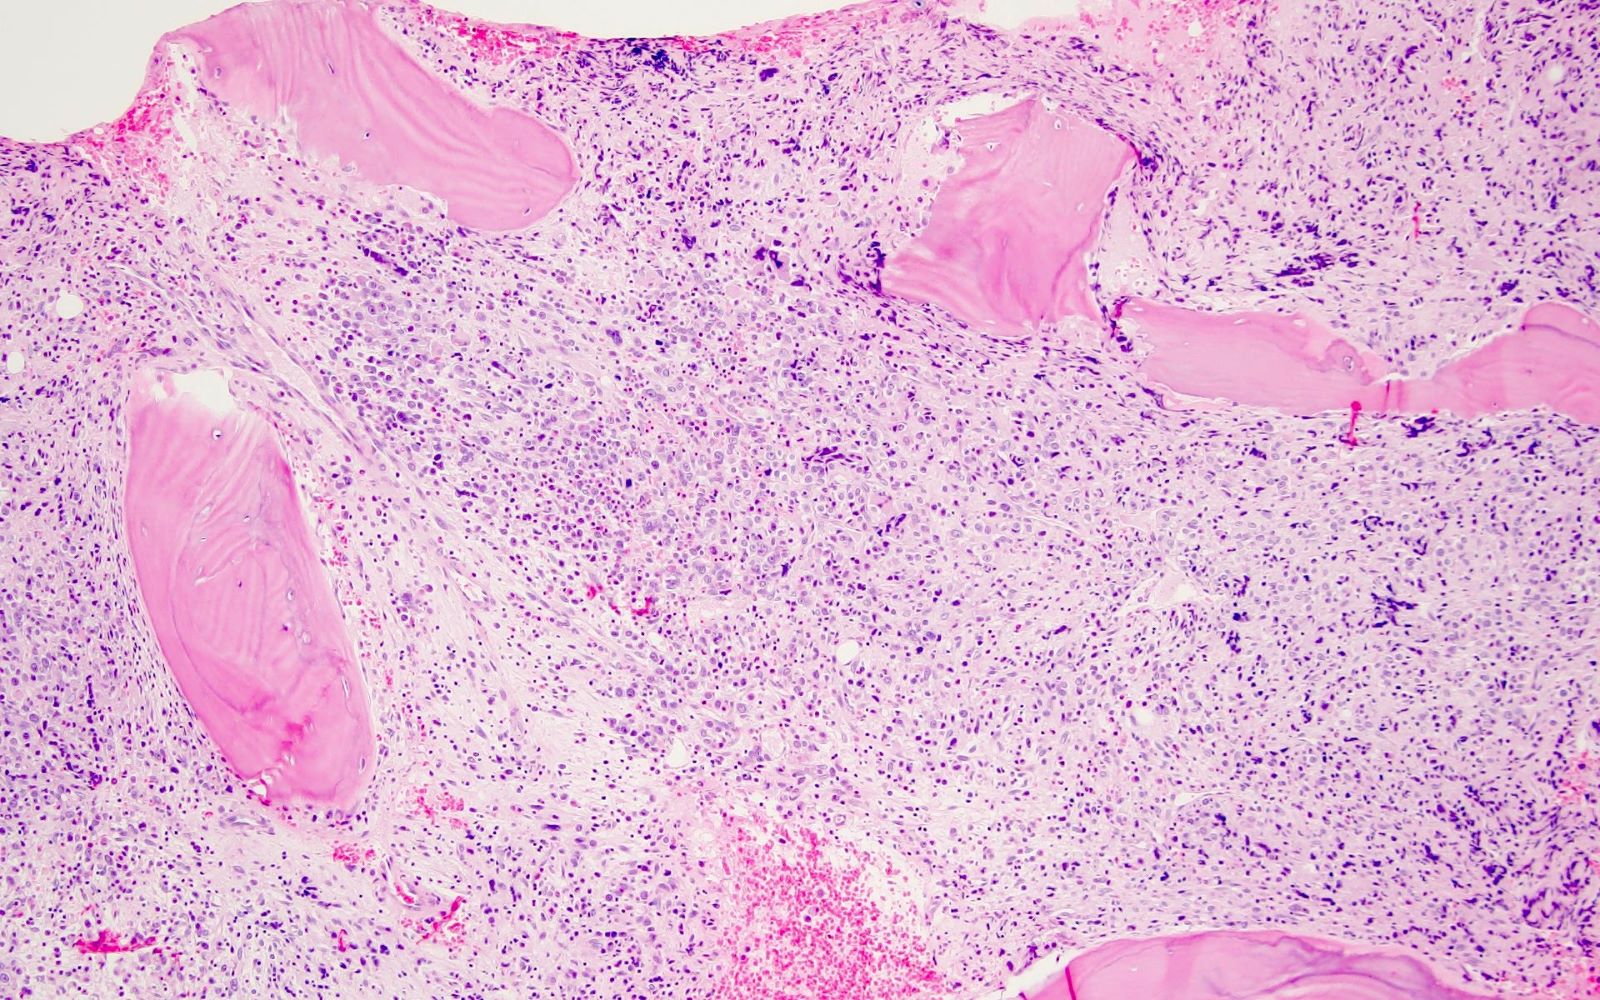
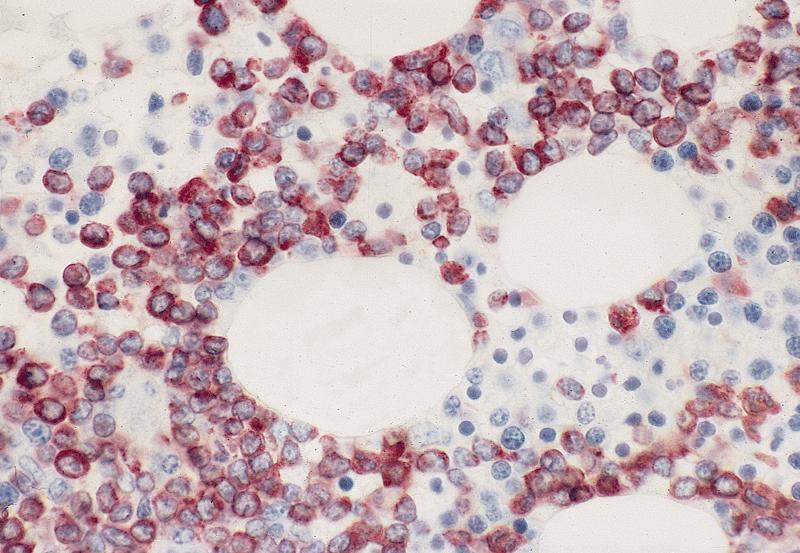
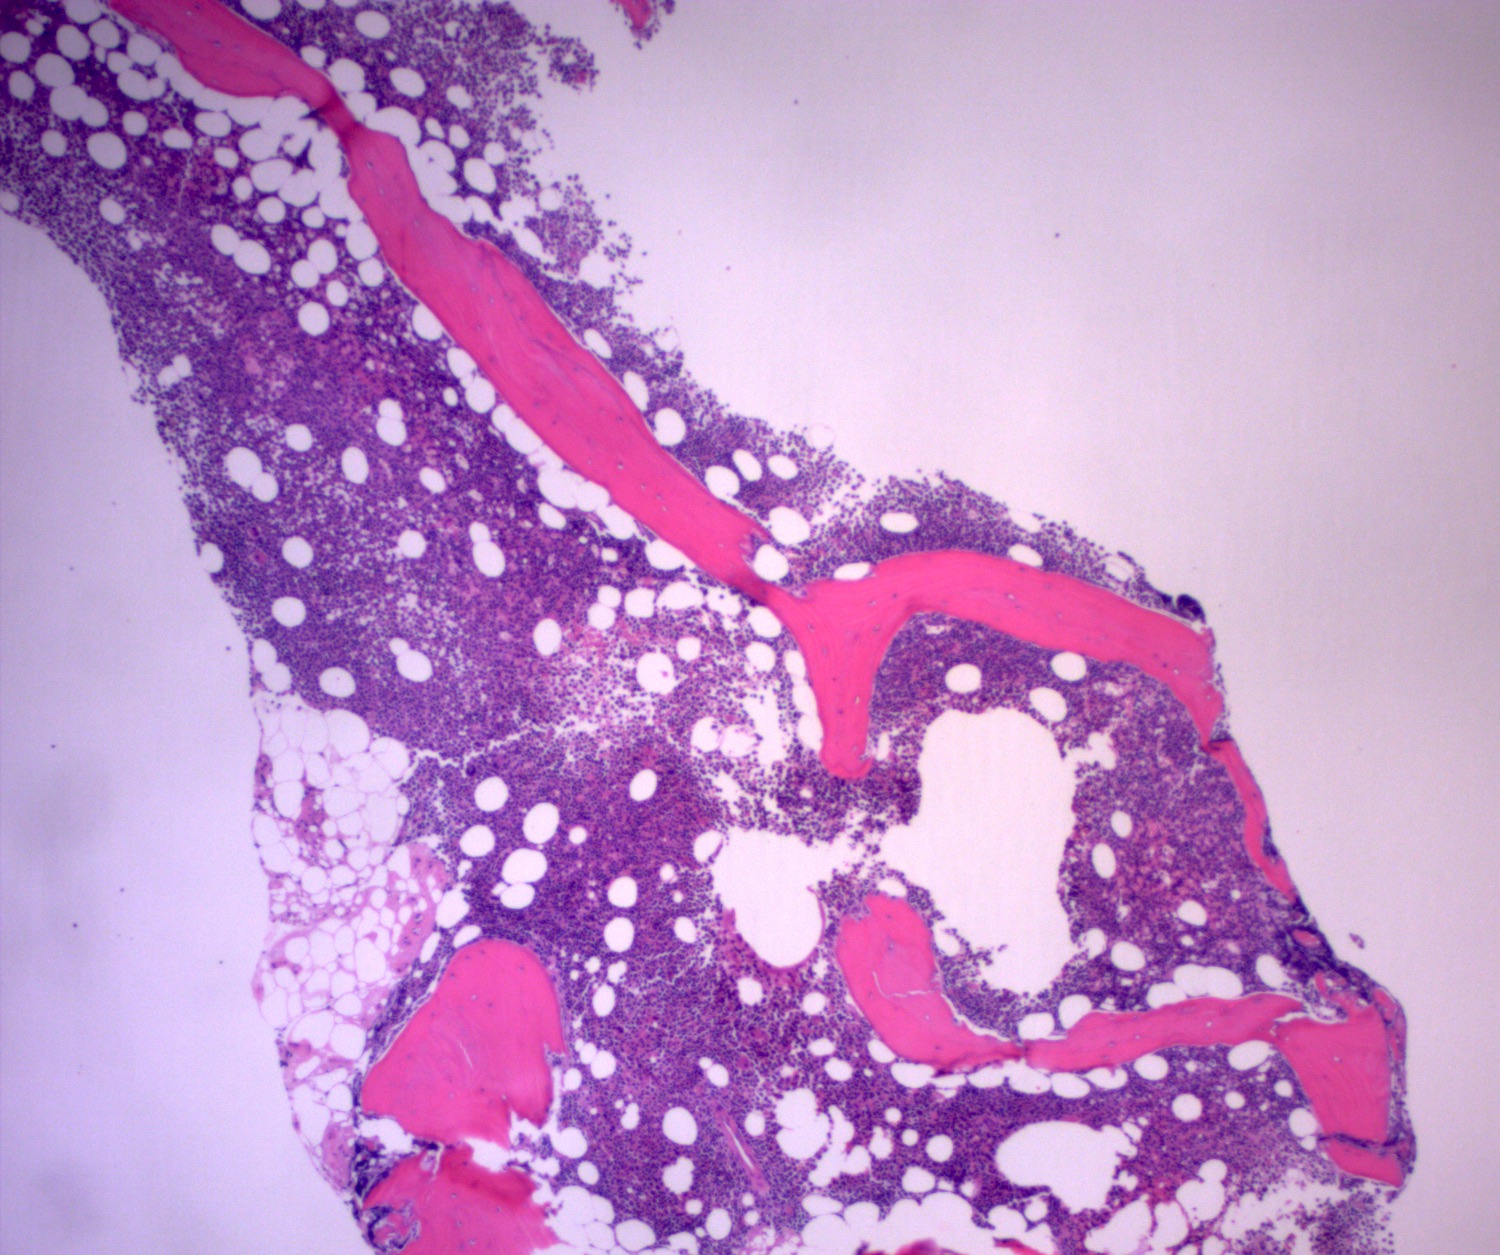
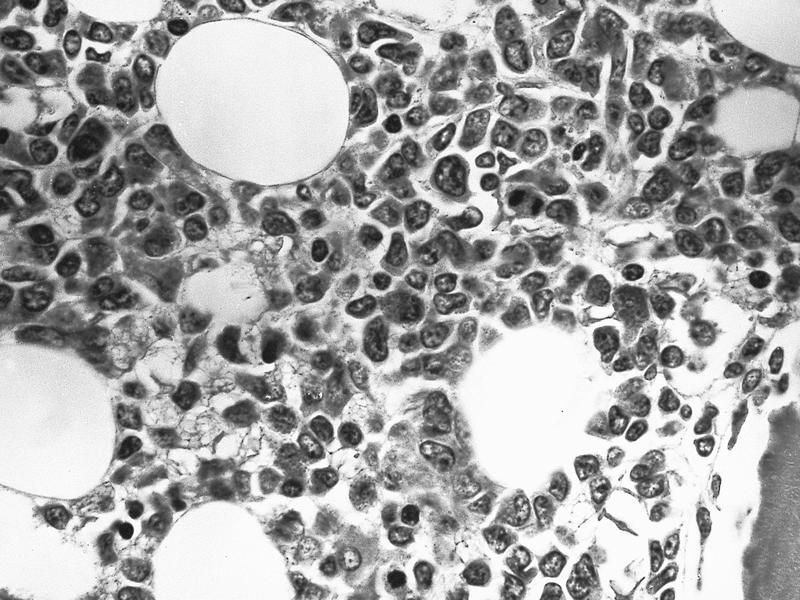
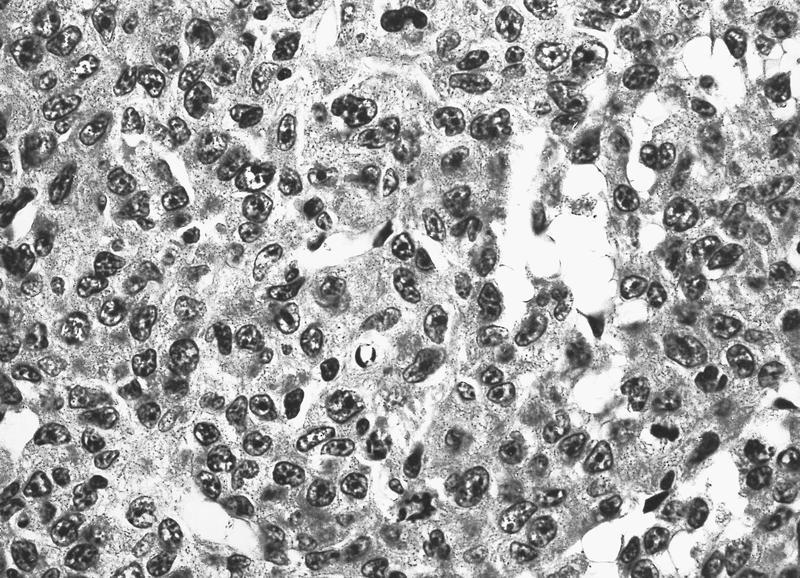
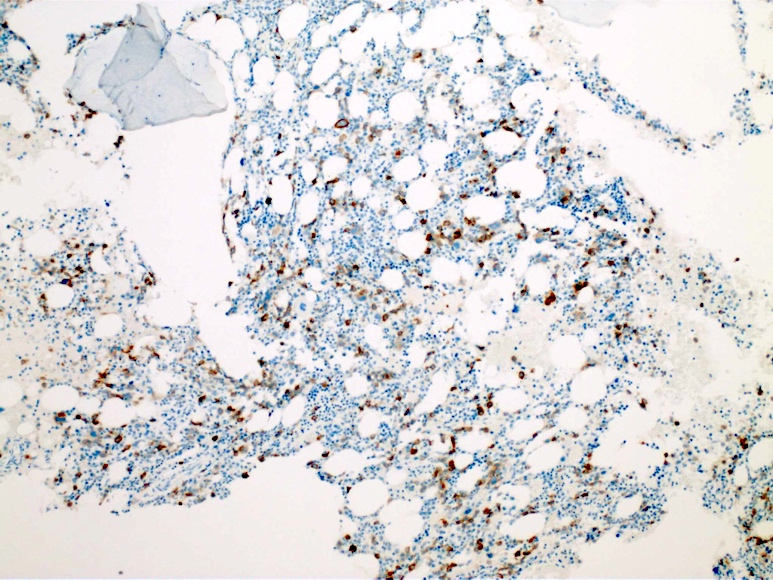
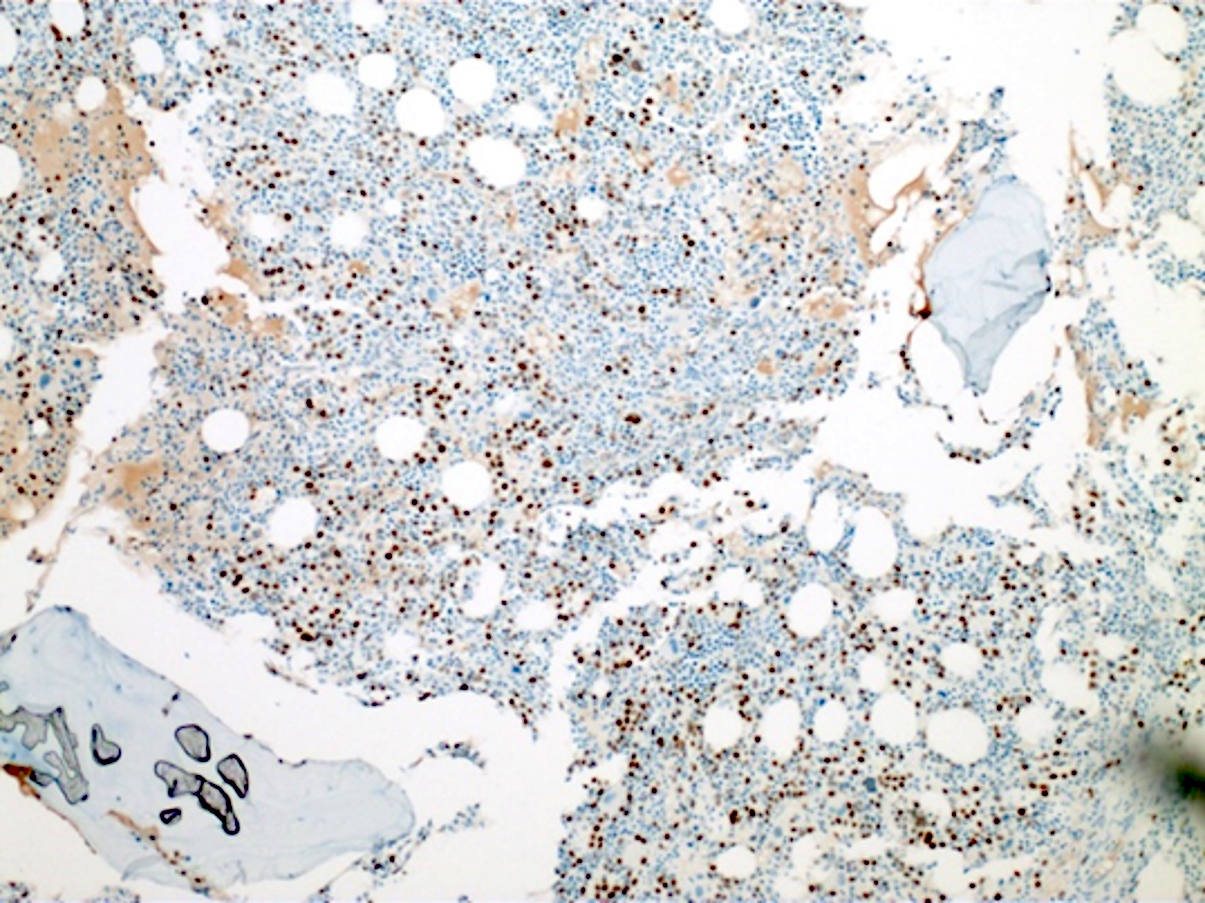
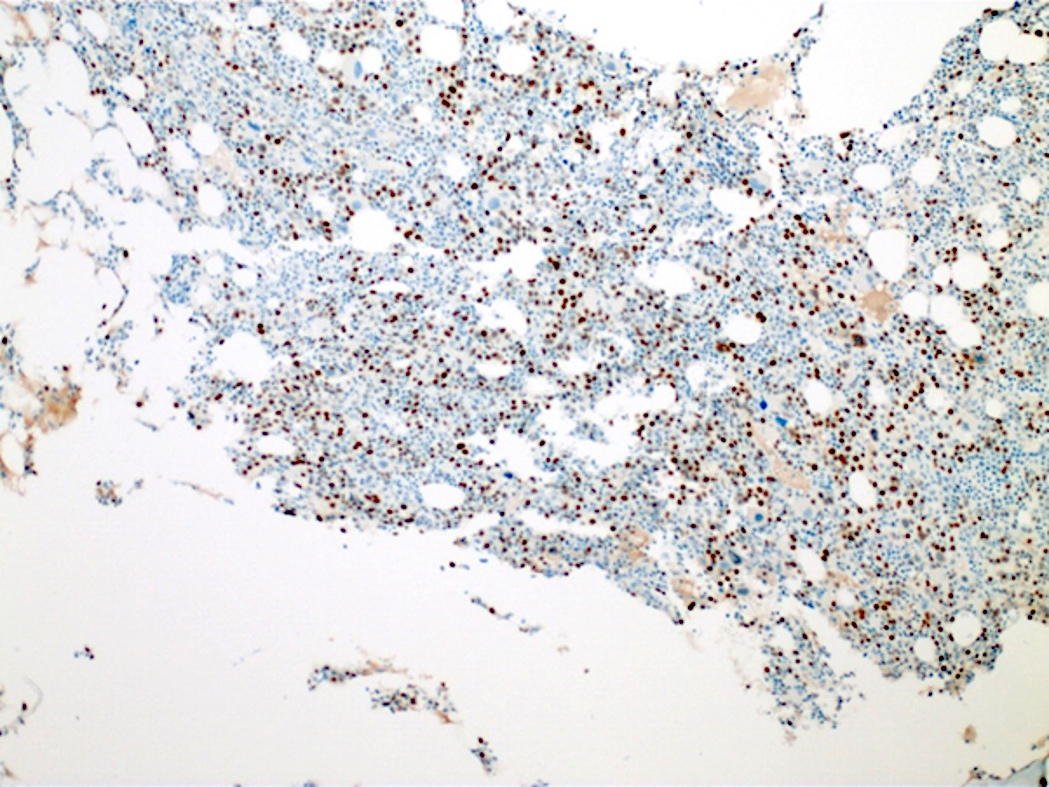
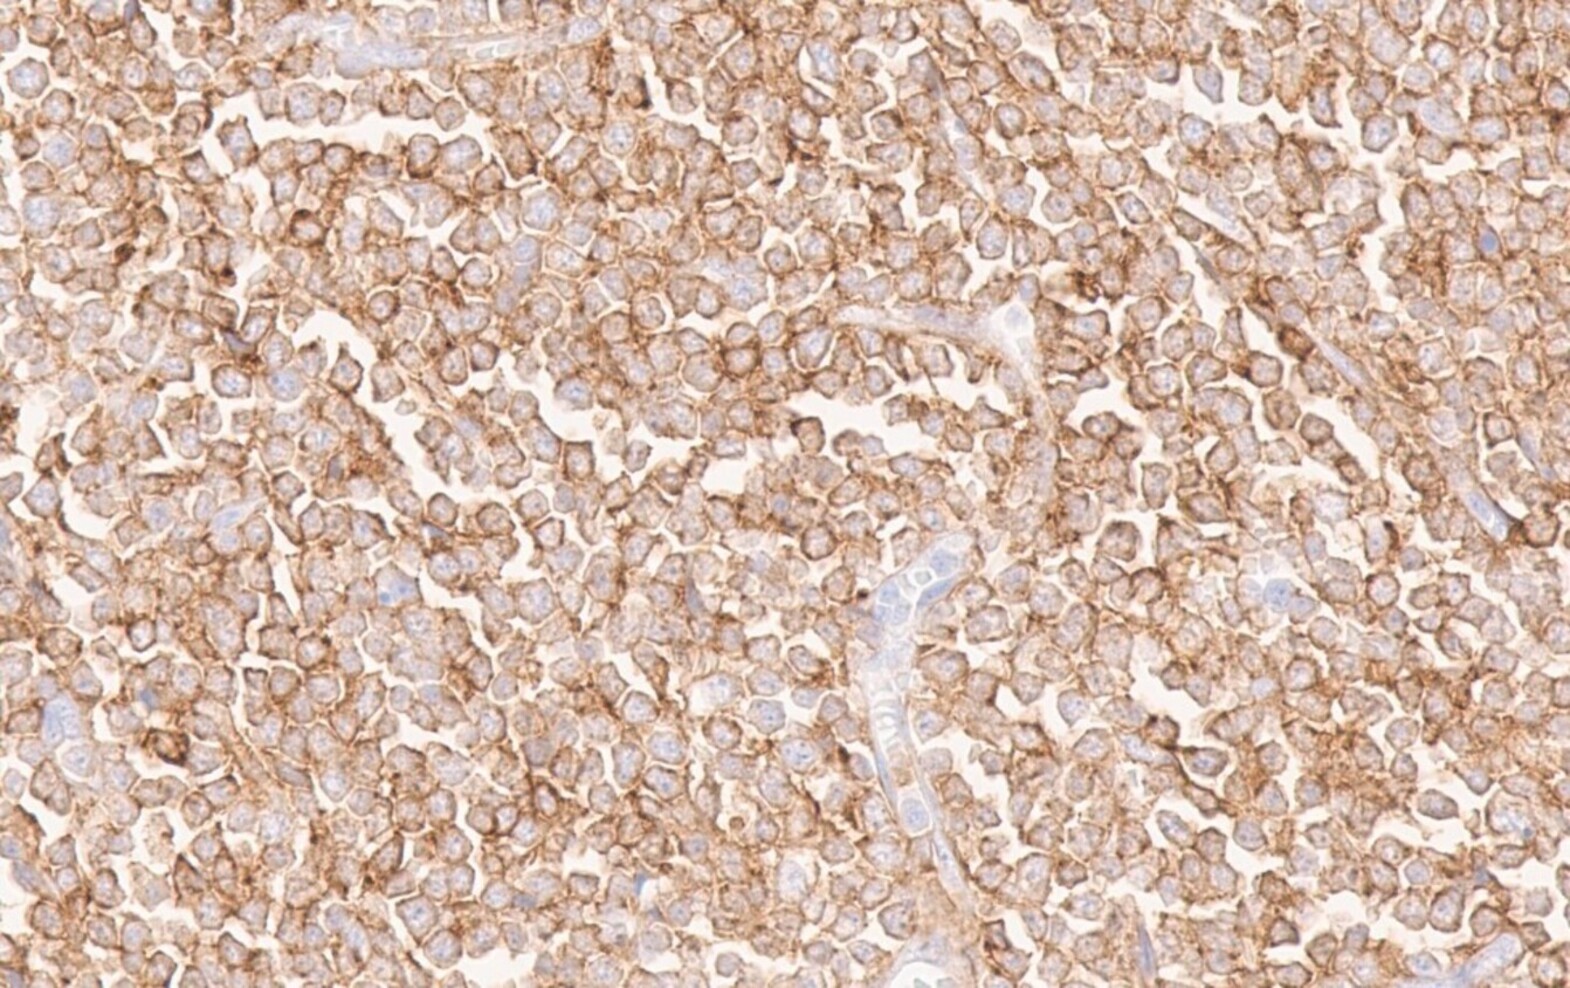
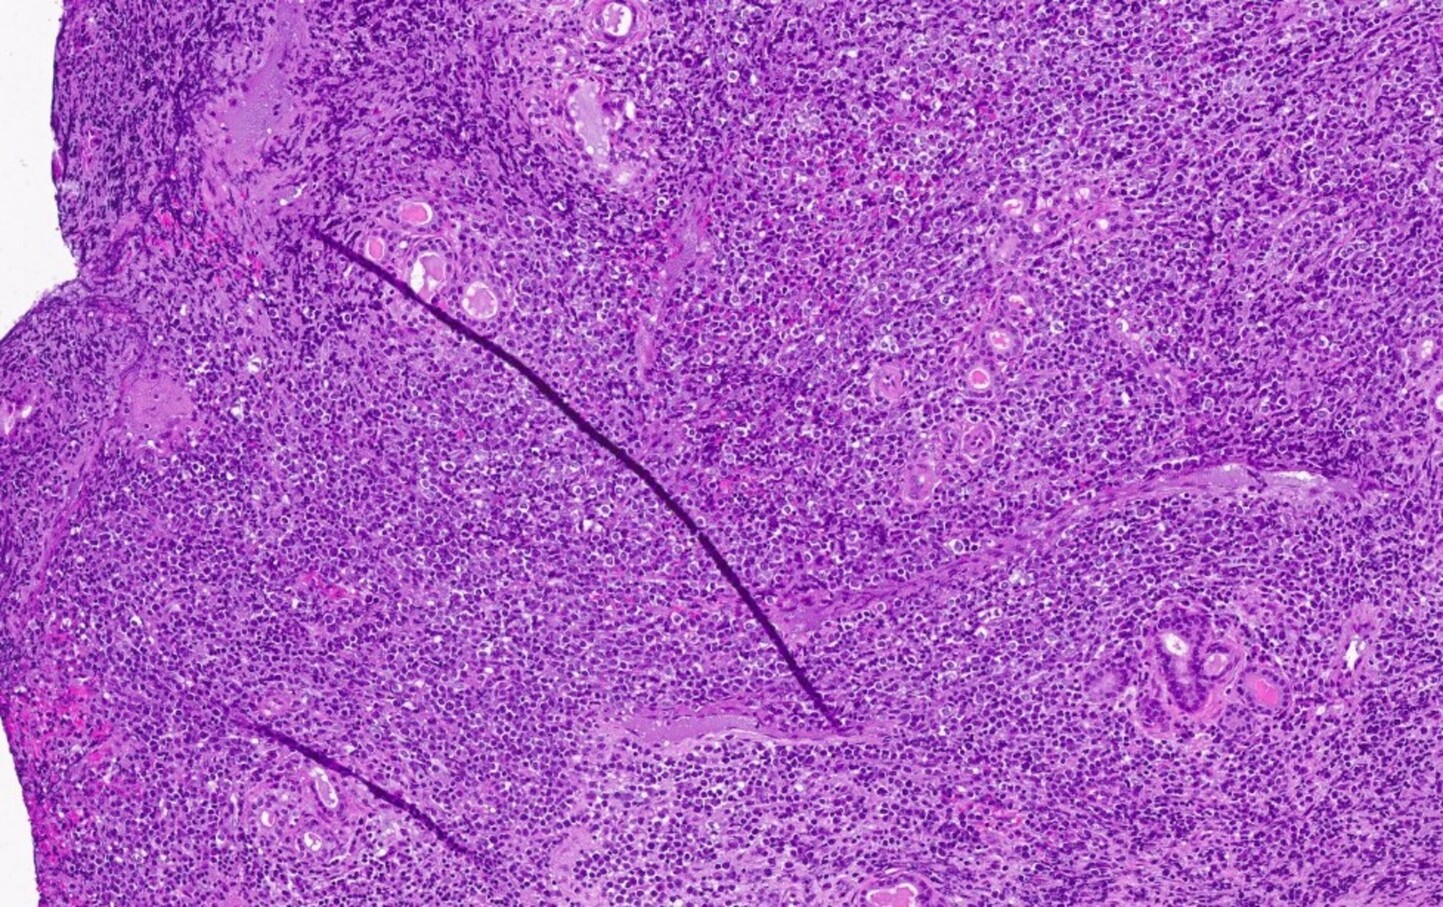
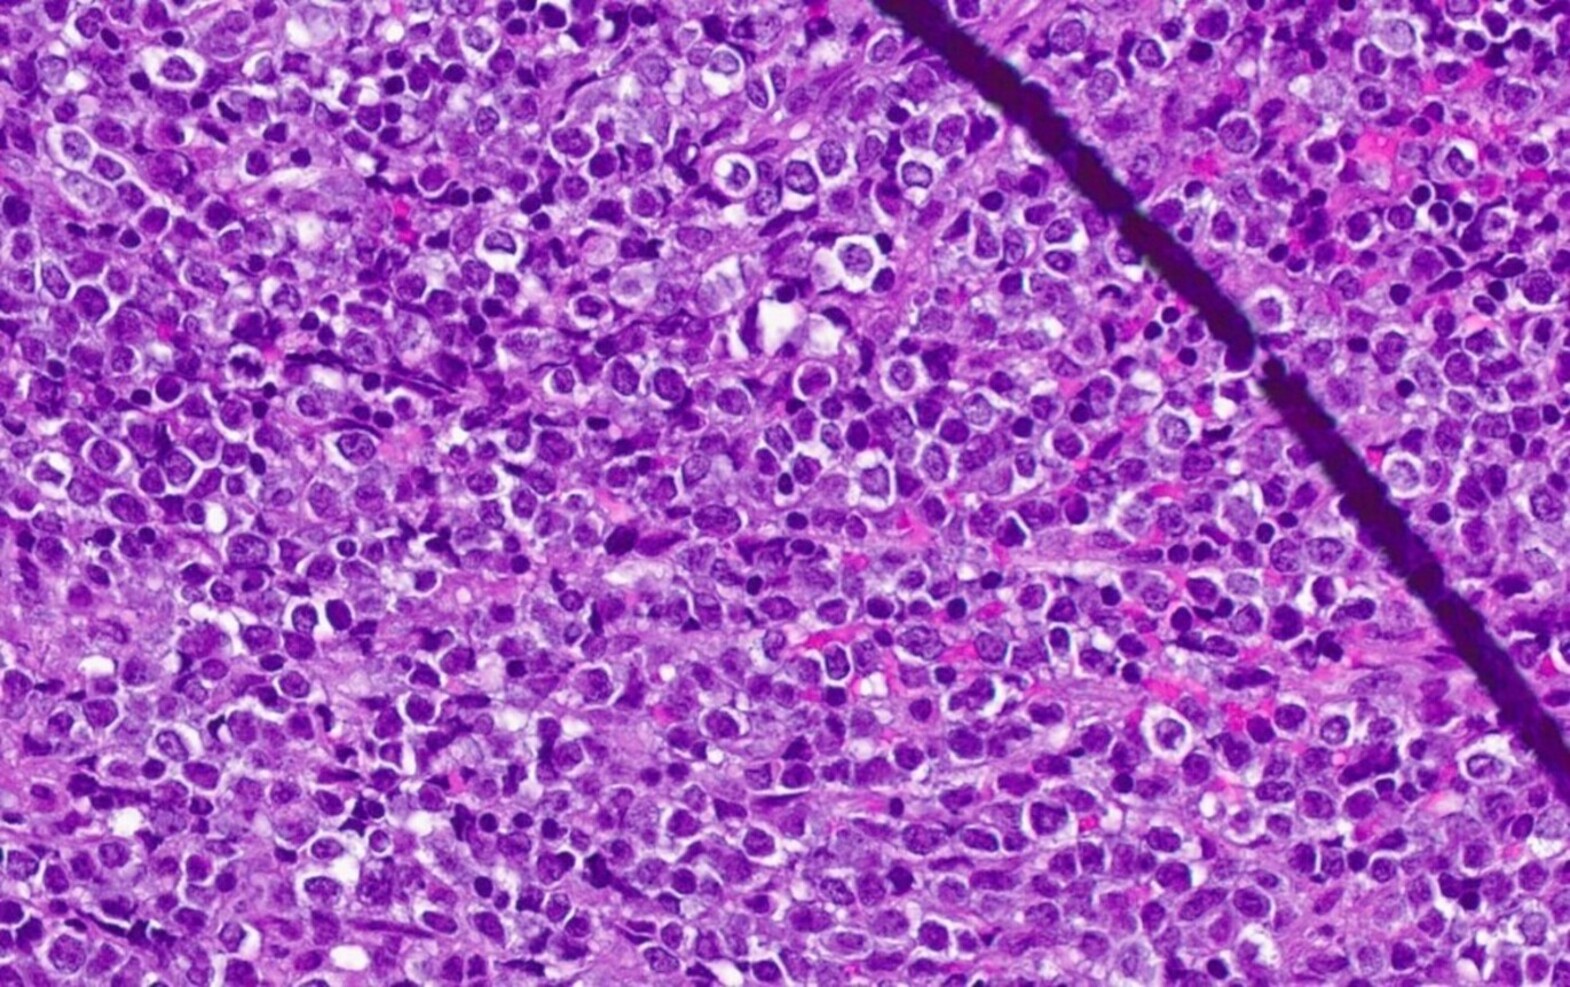
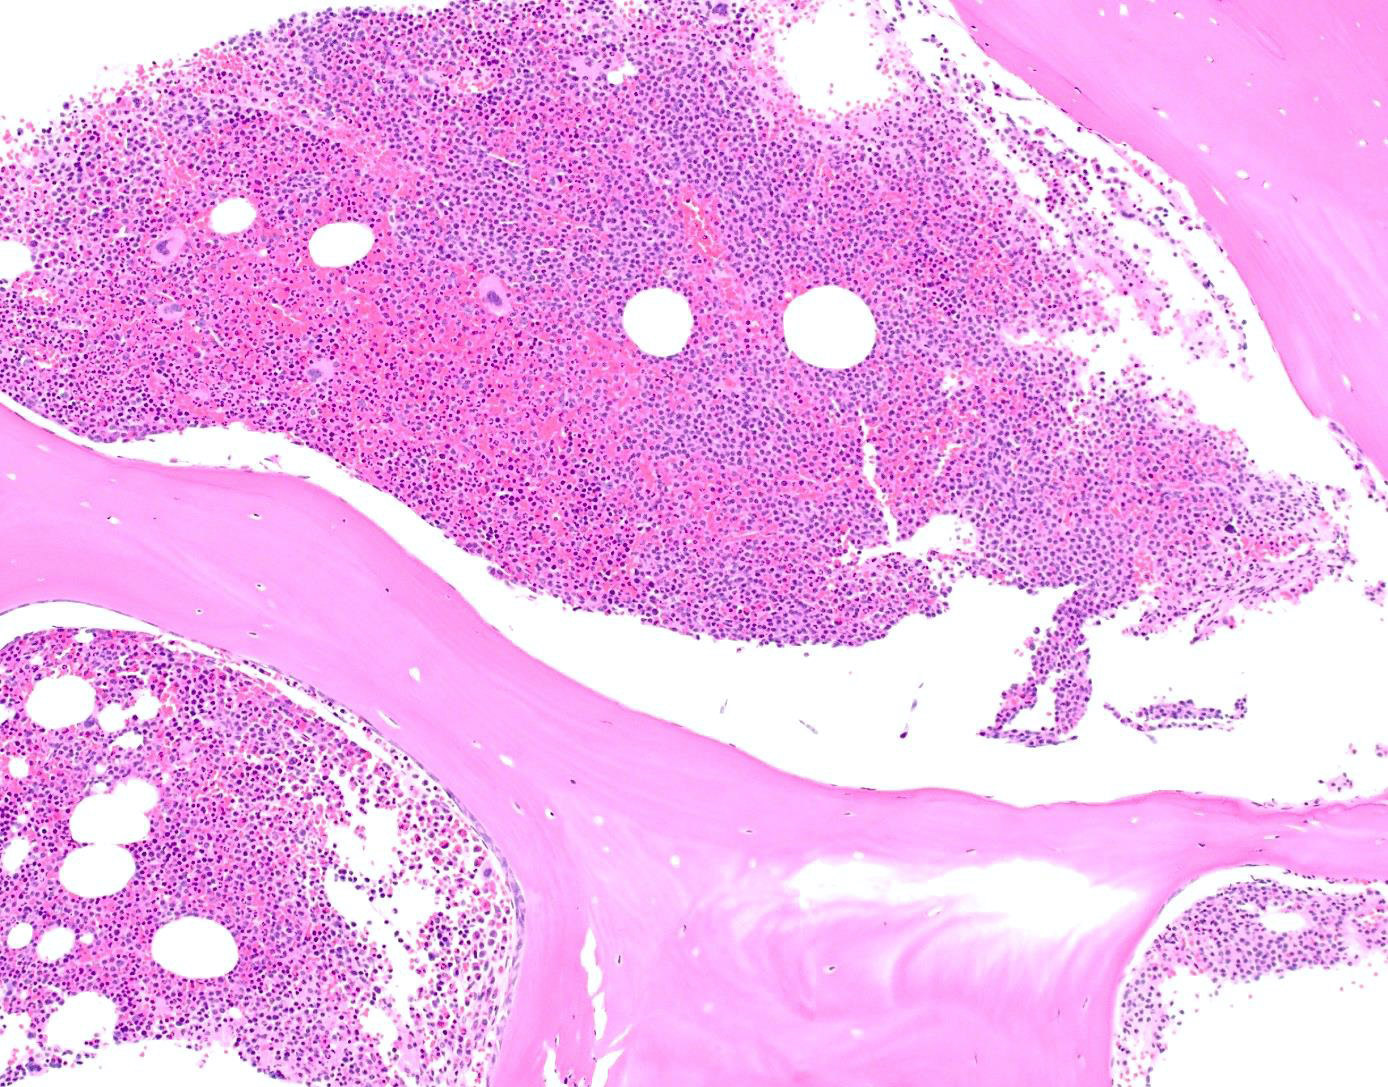
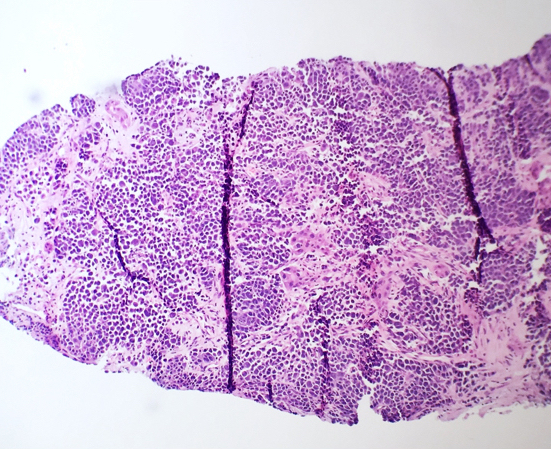
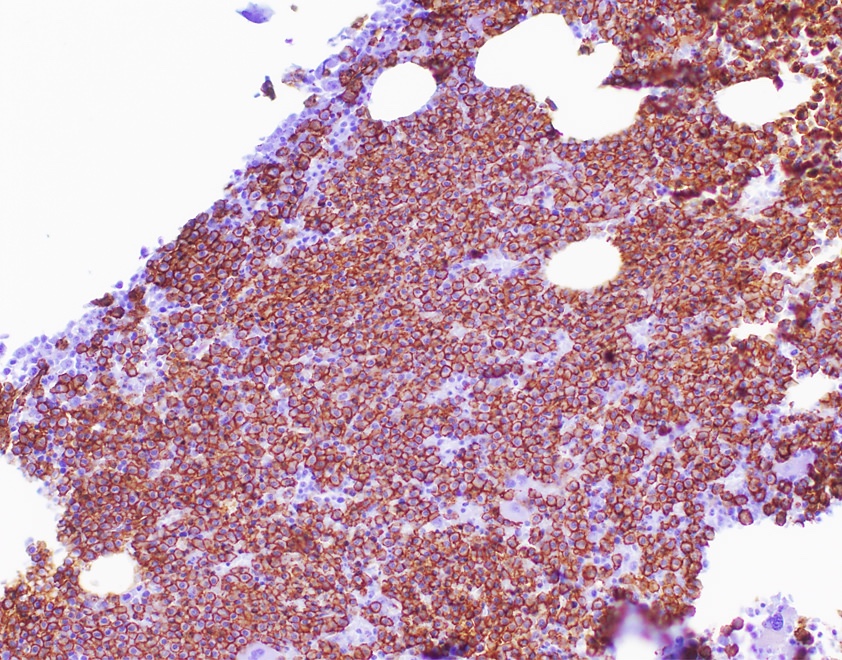
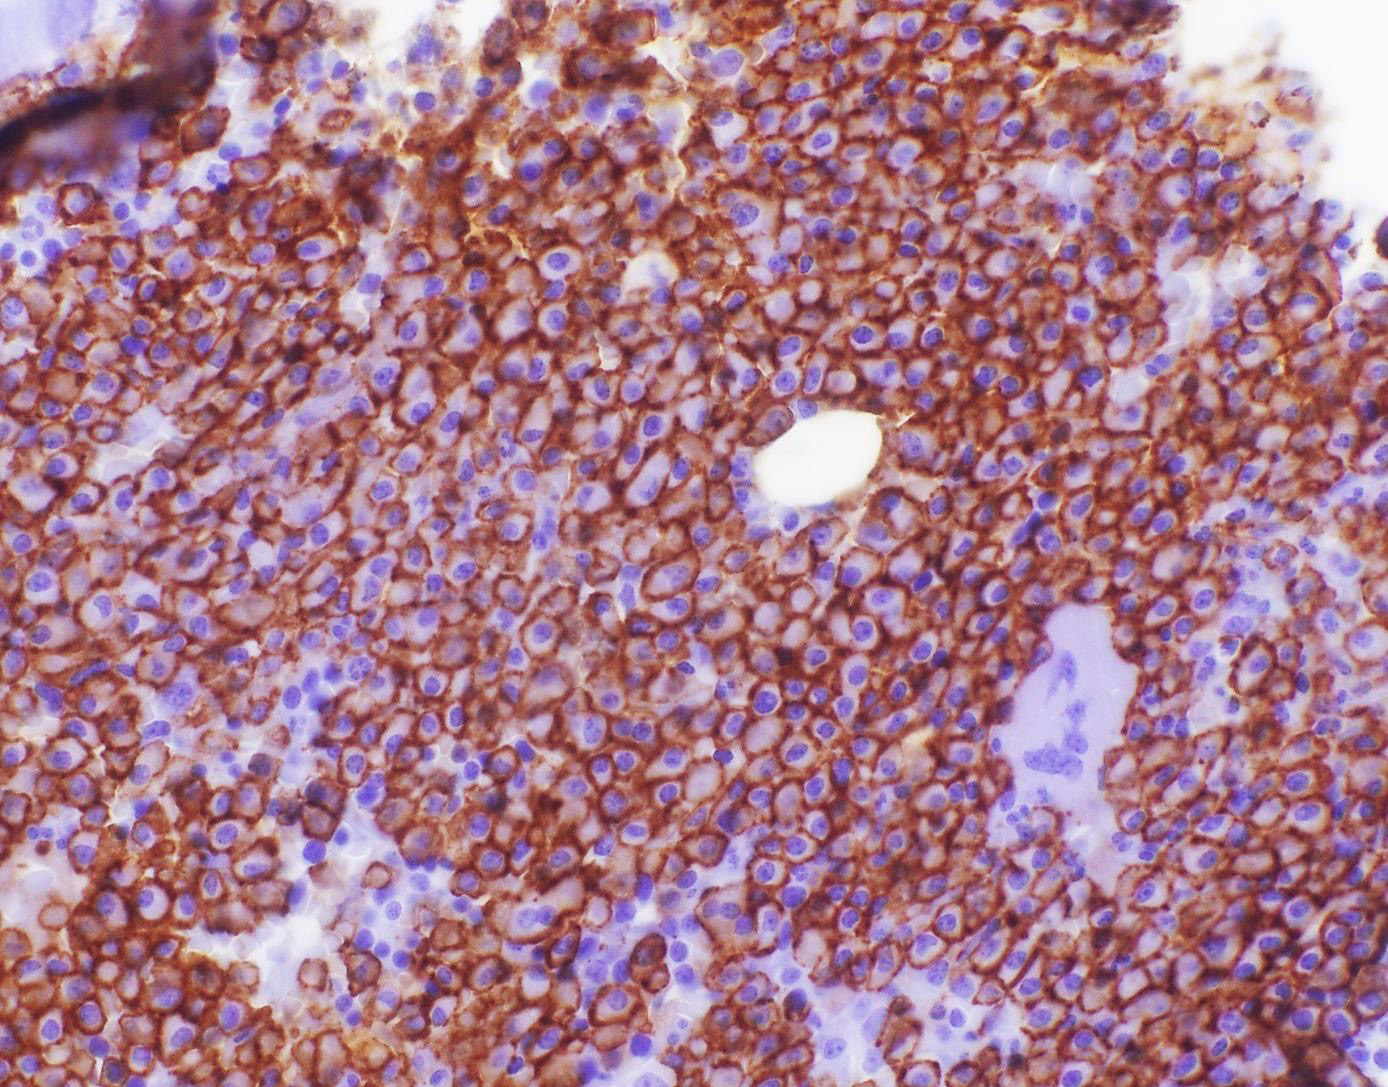
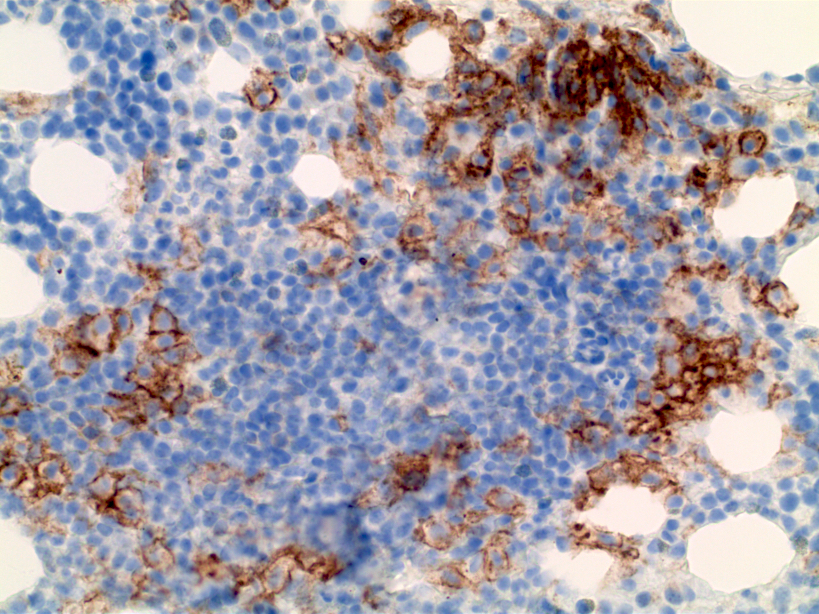
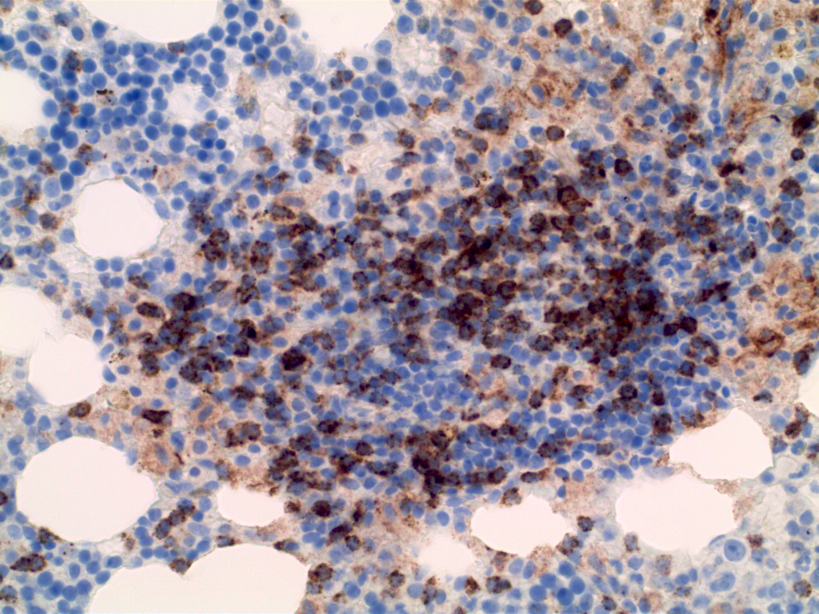
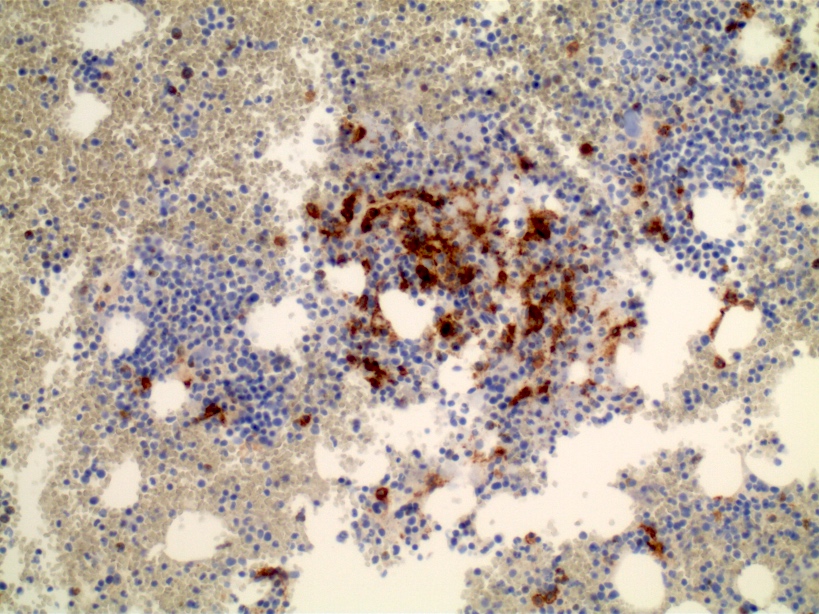
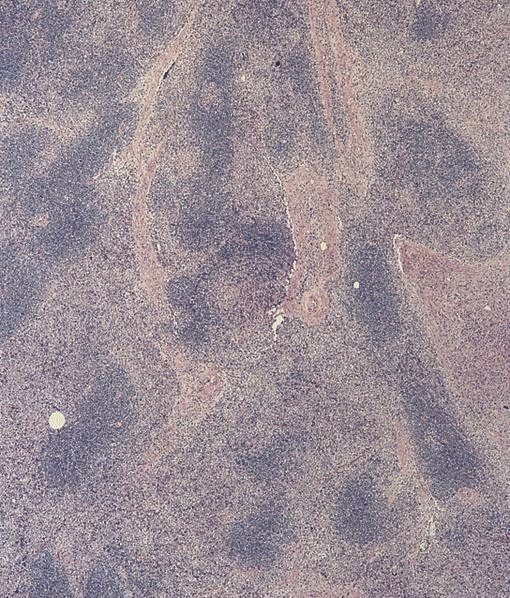
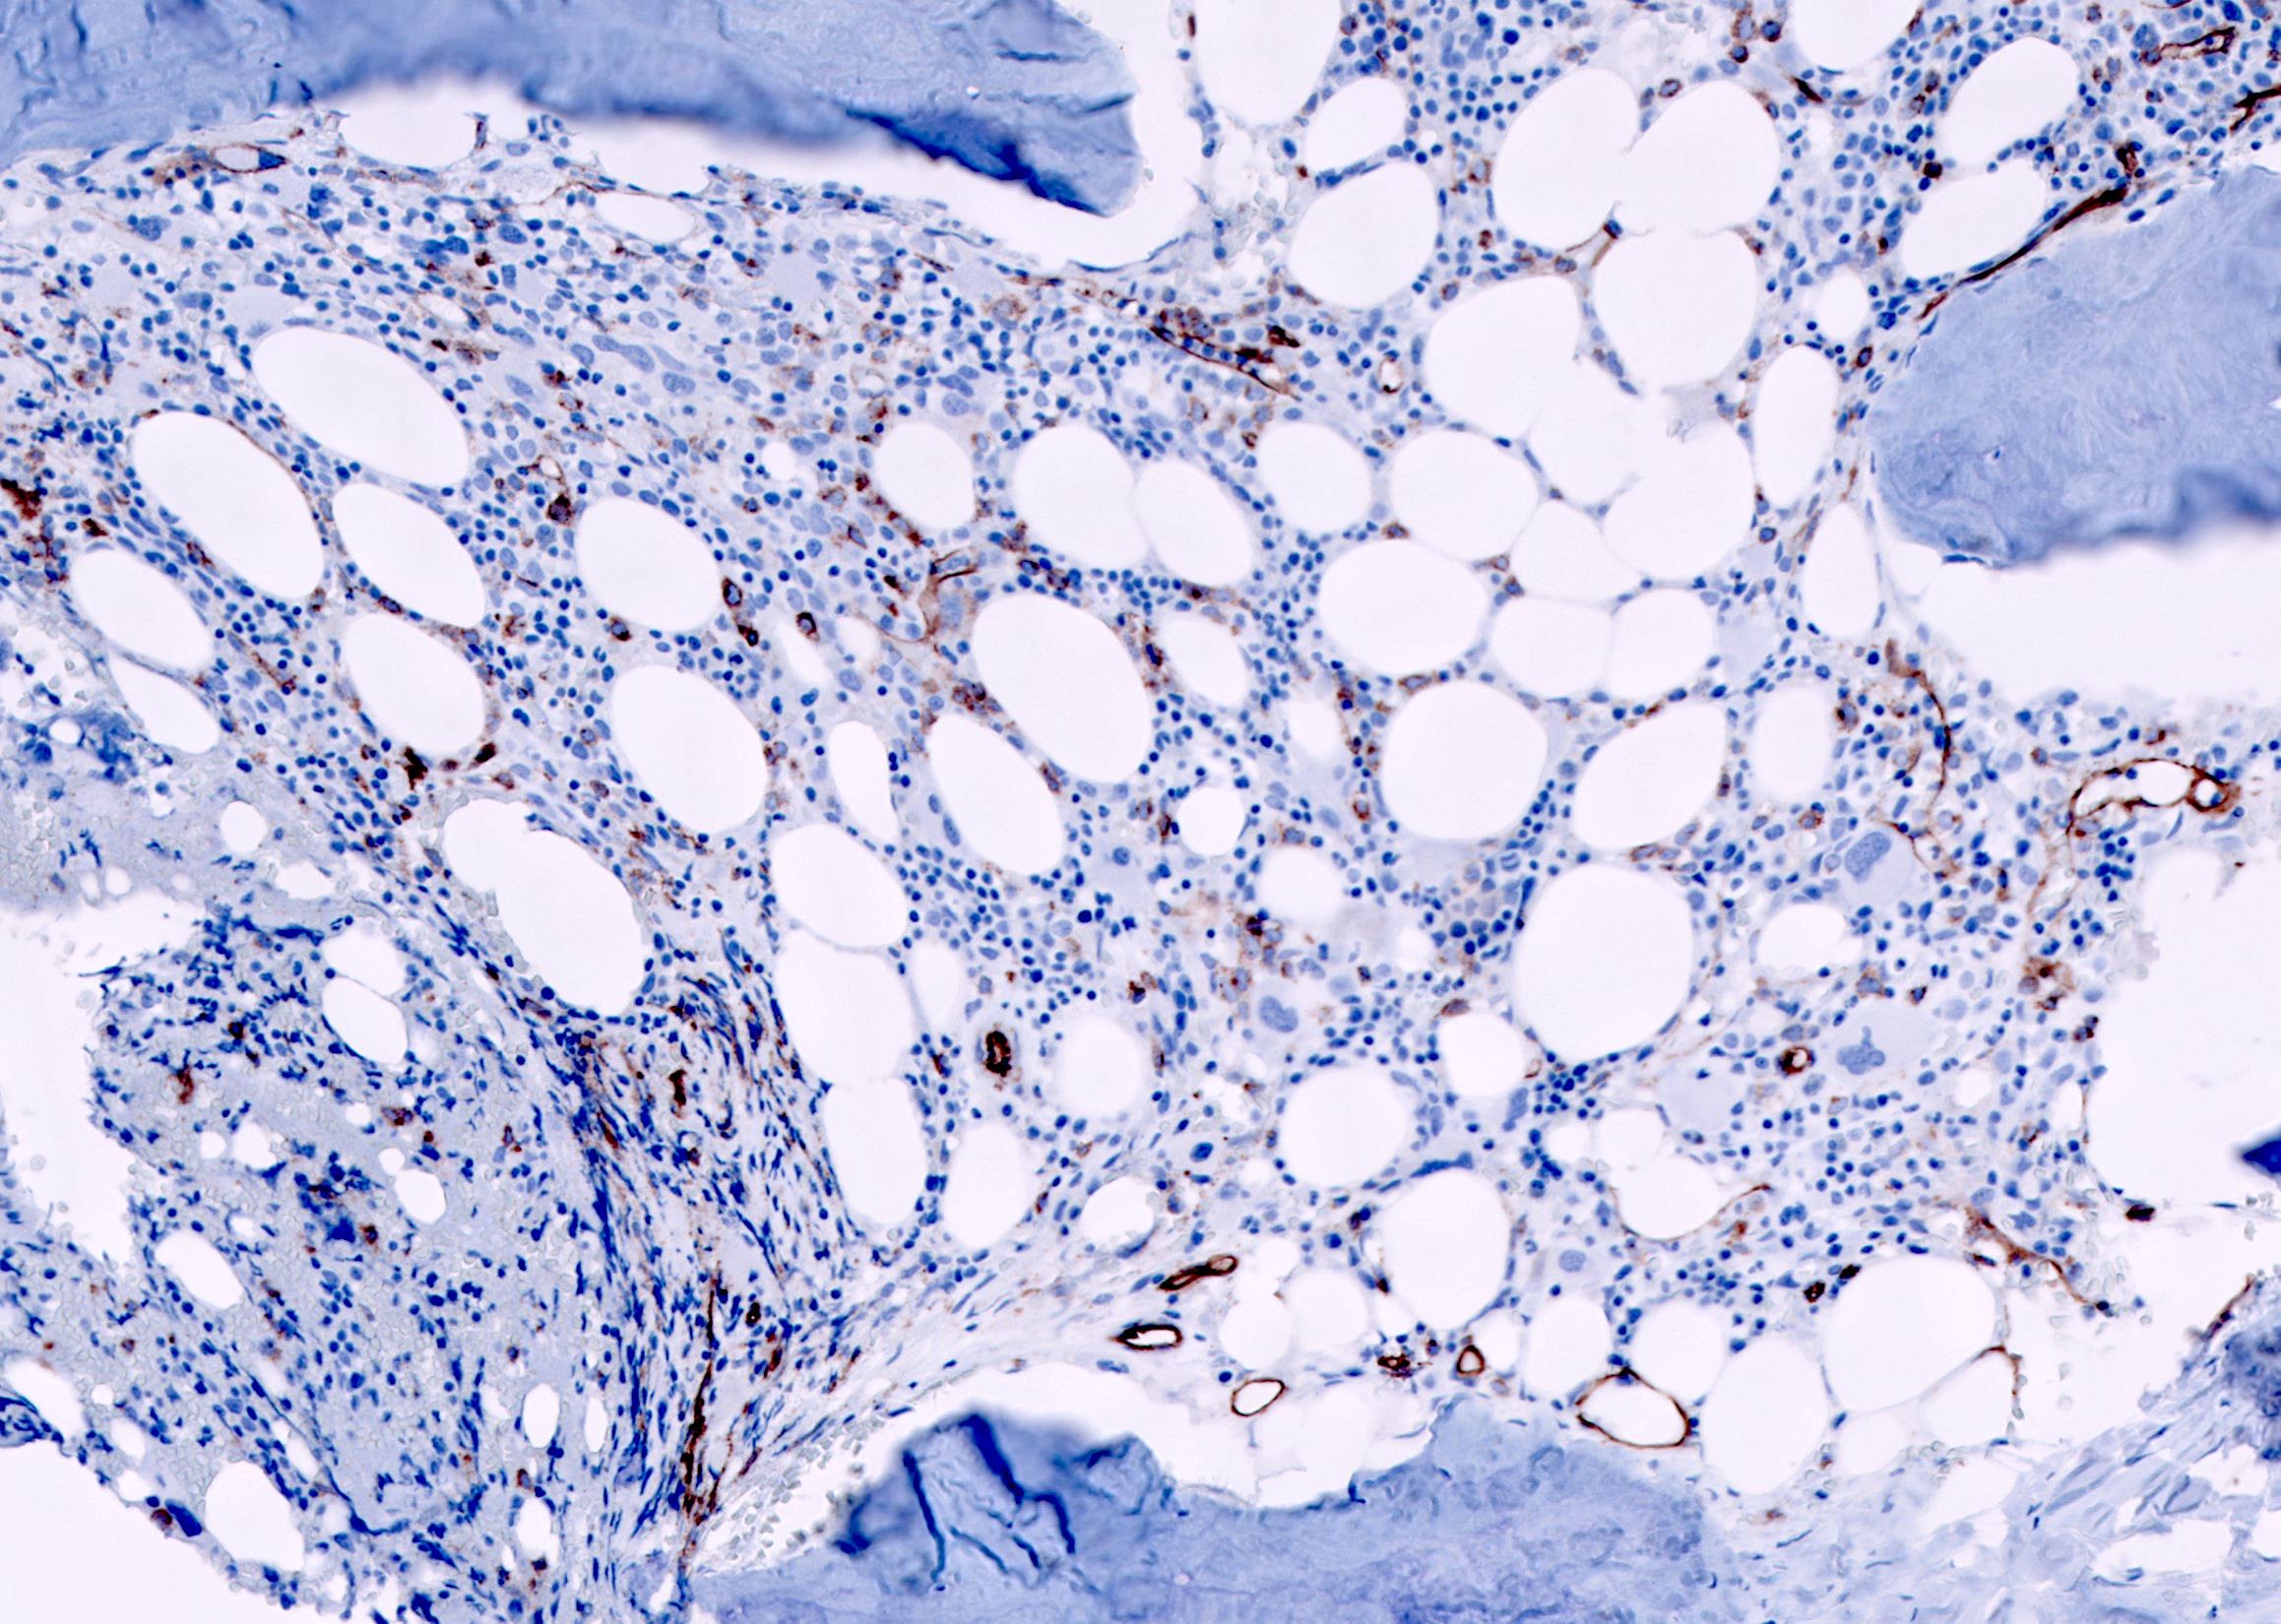
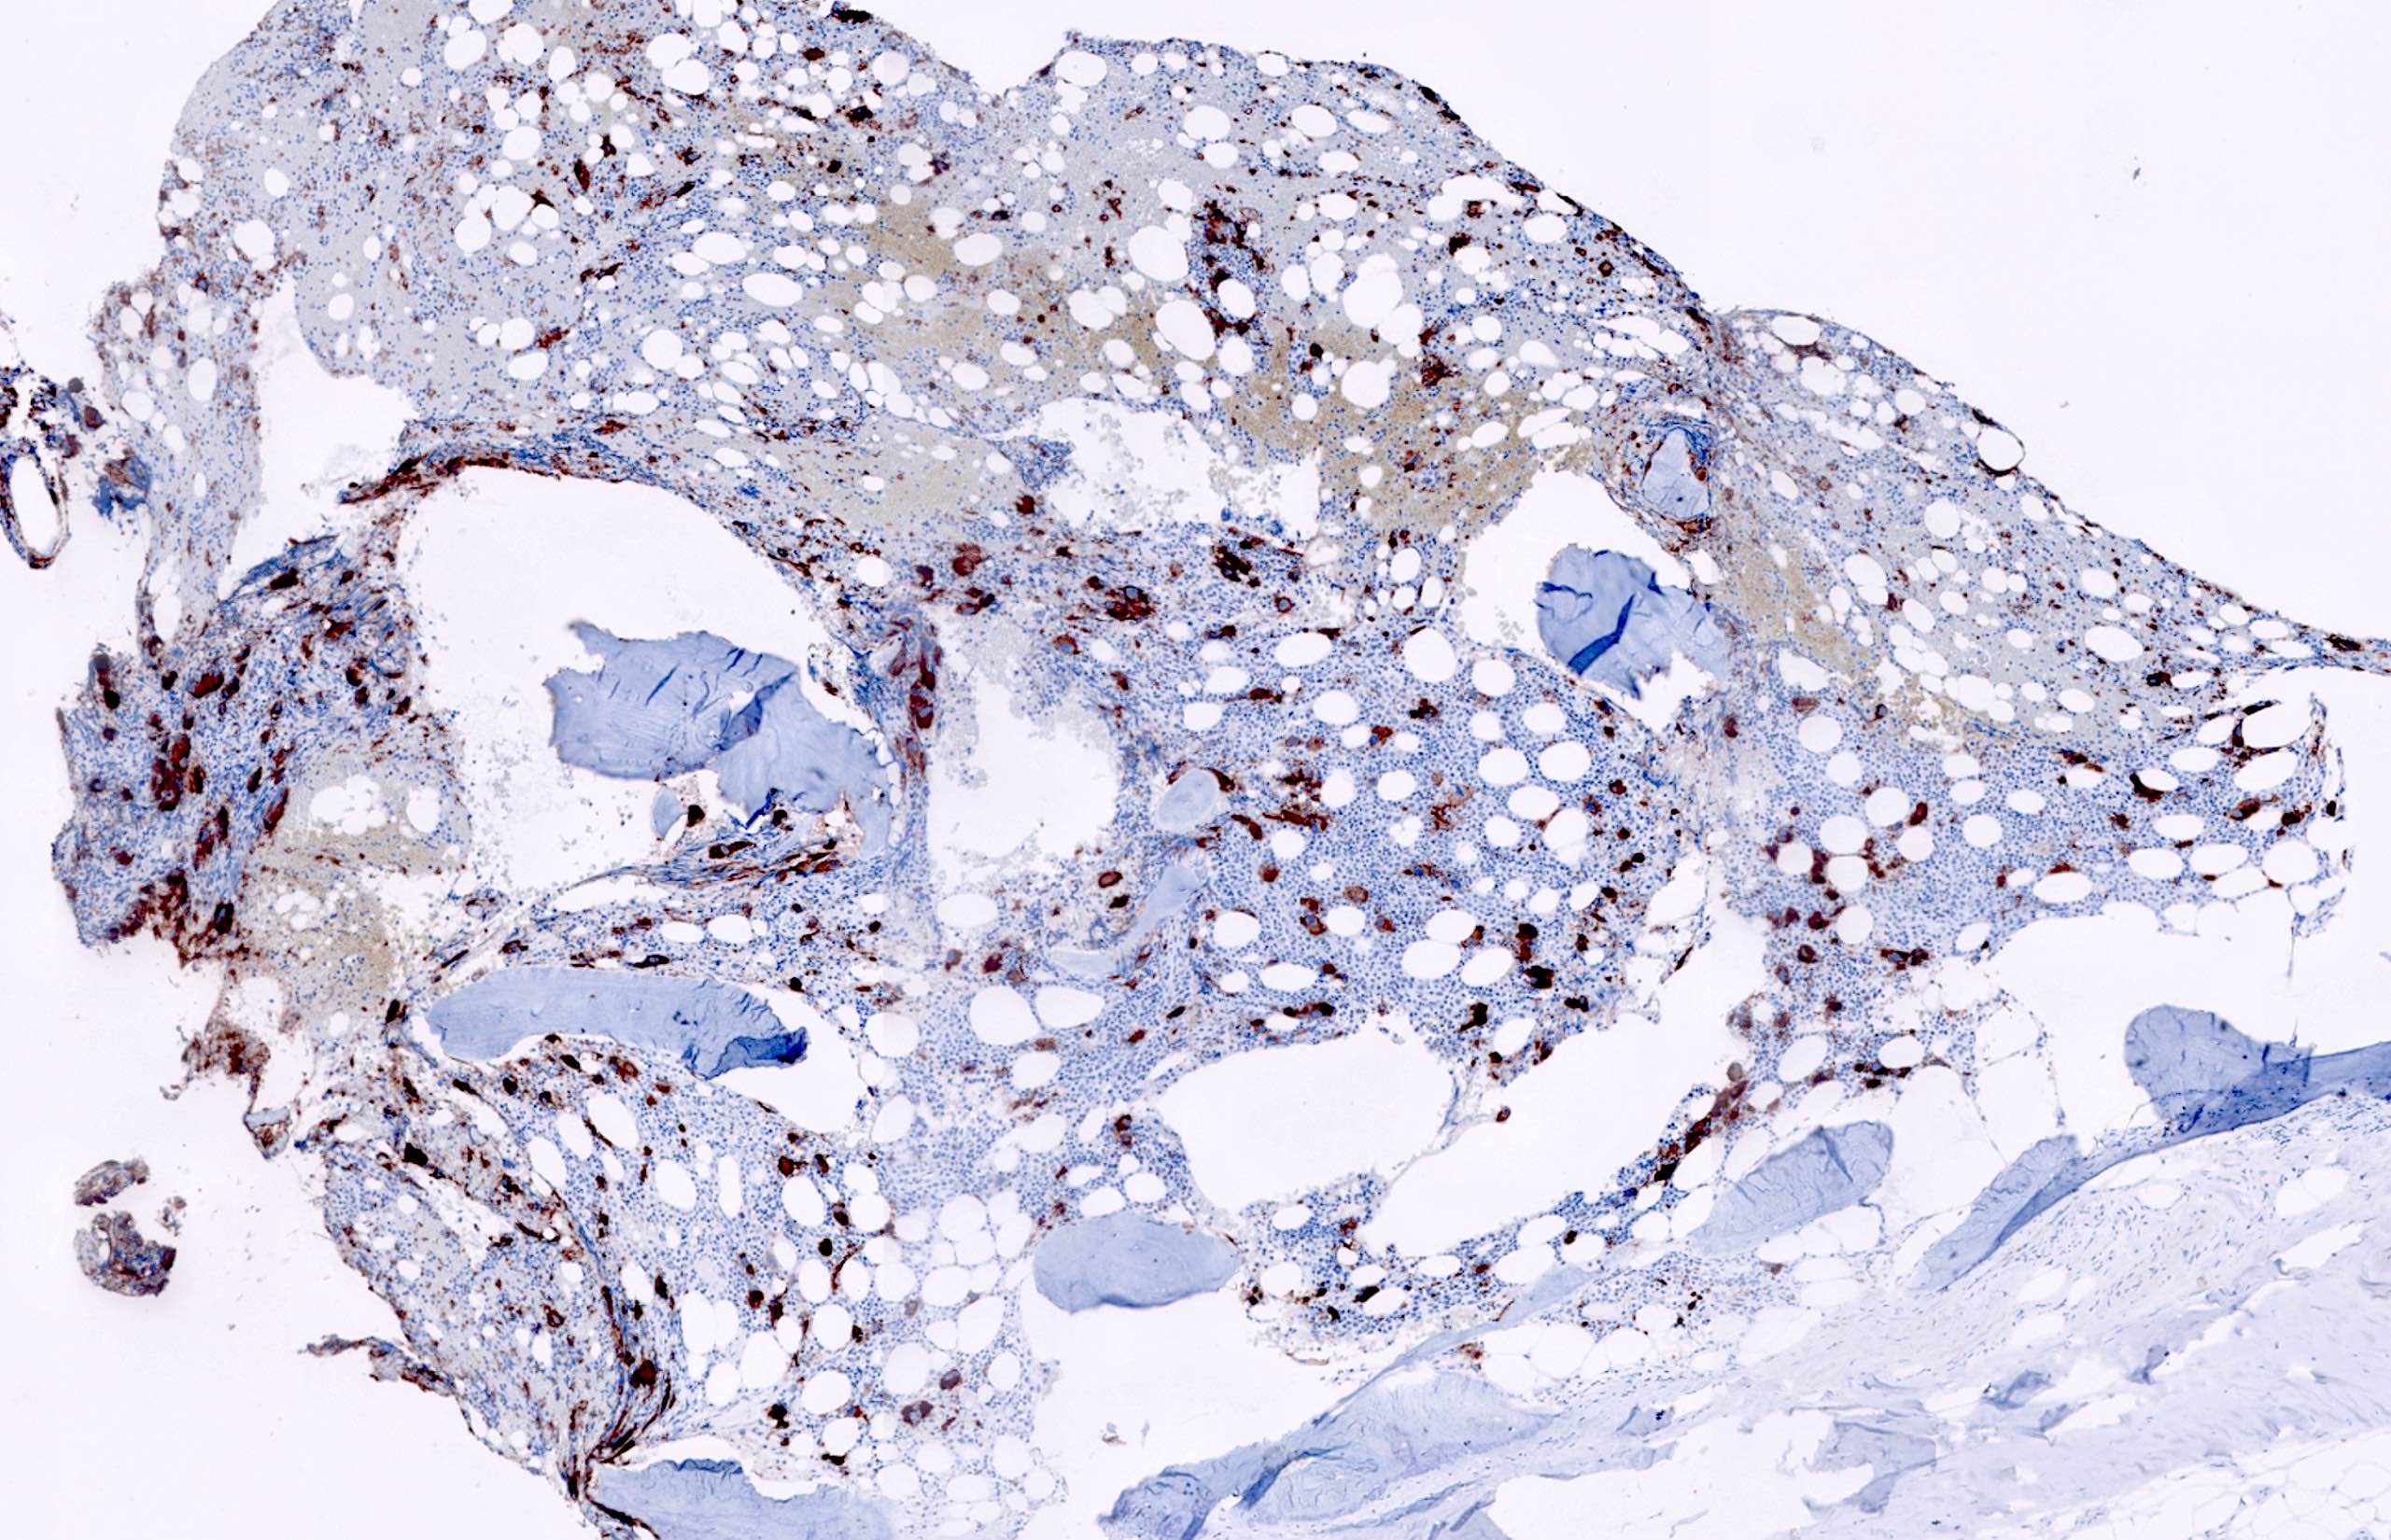
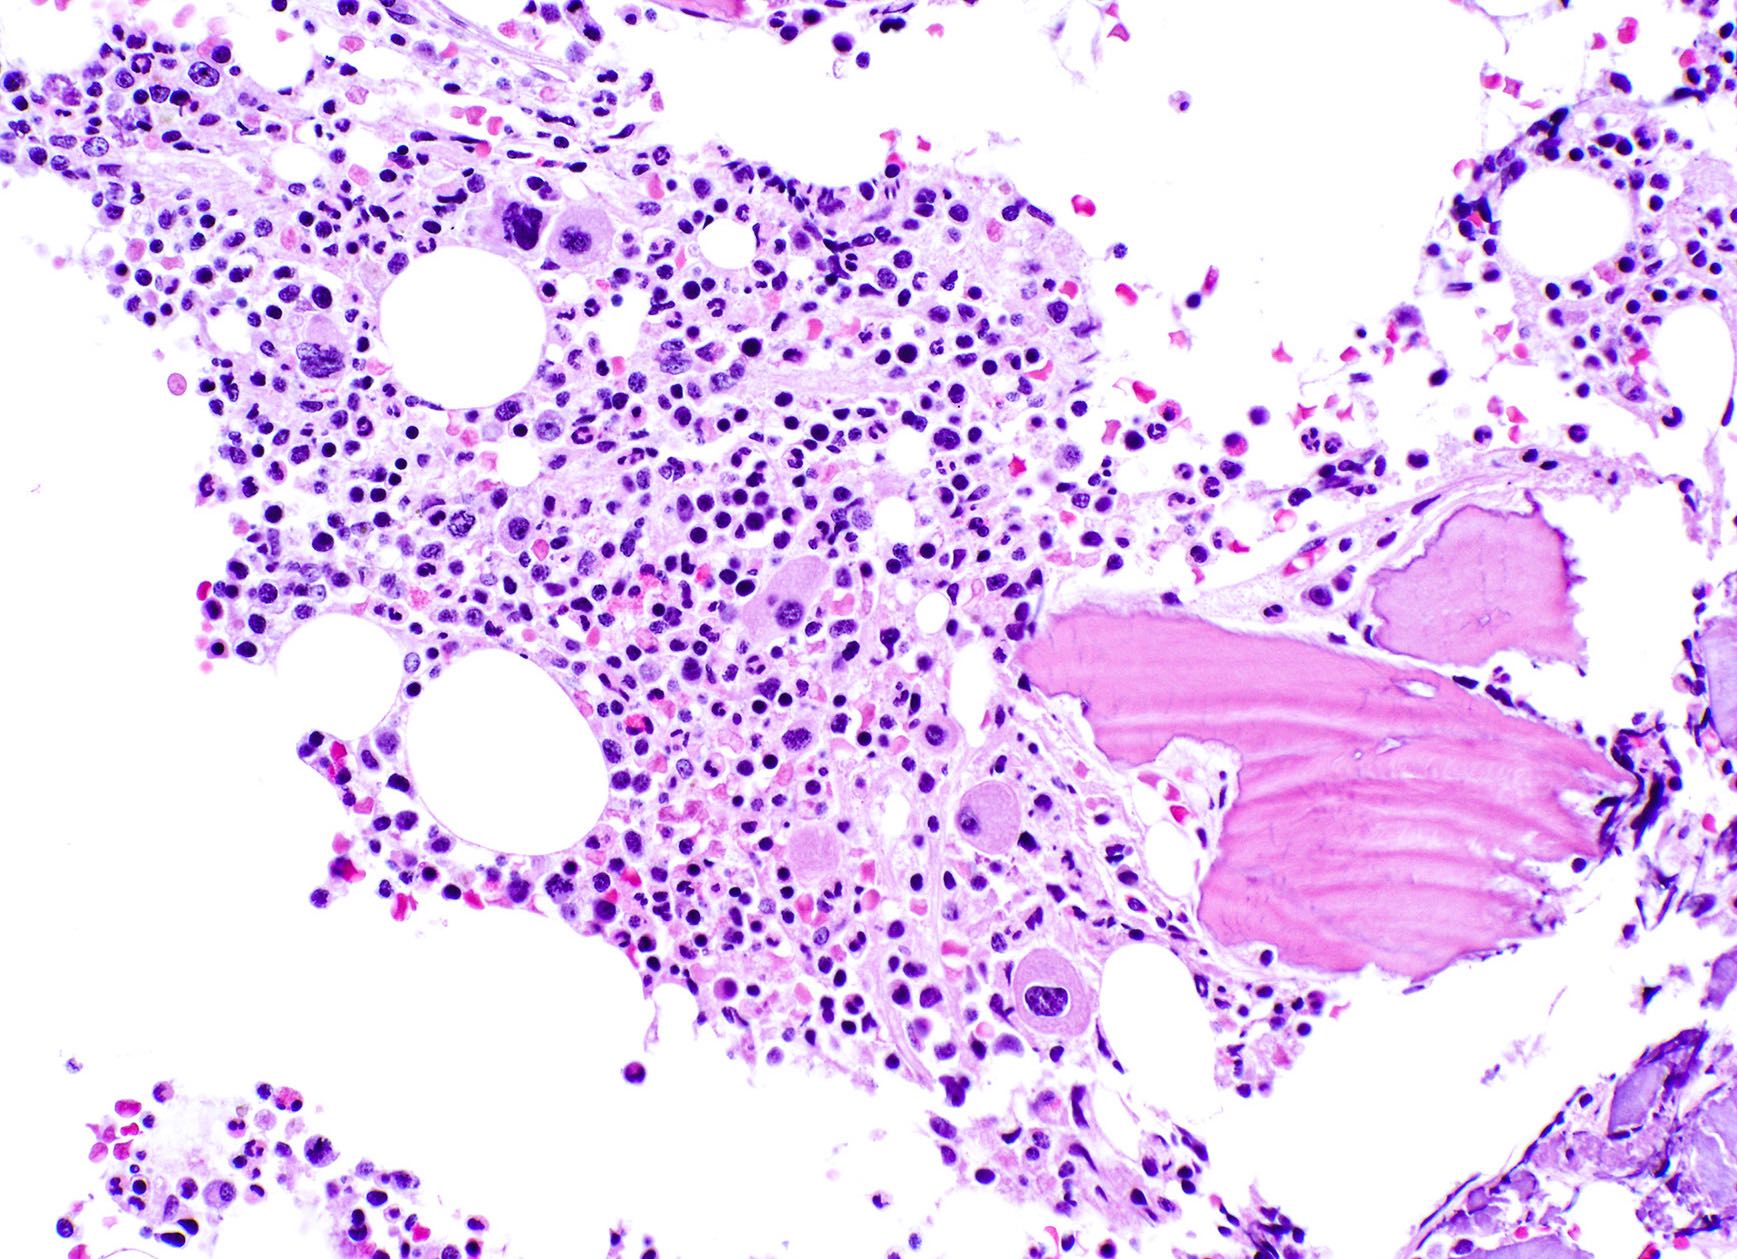
Bone marrow
biopsy: extensive
infiltration
by blasts
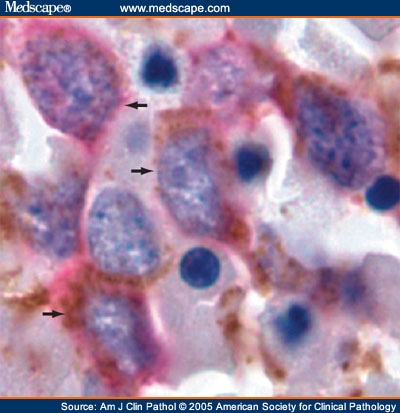
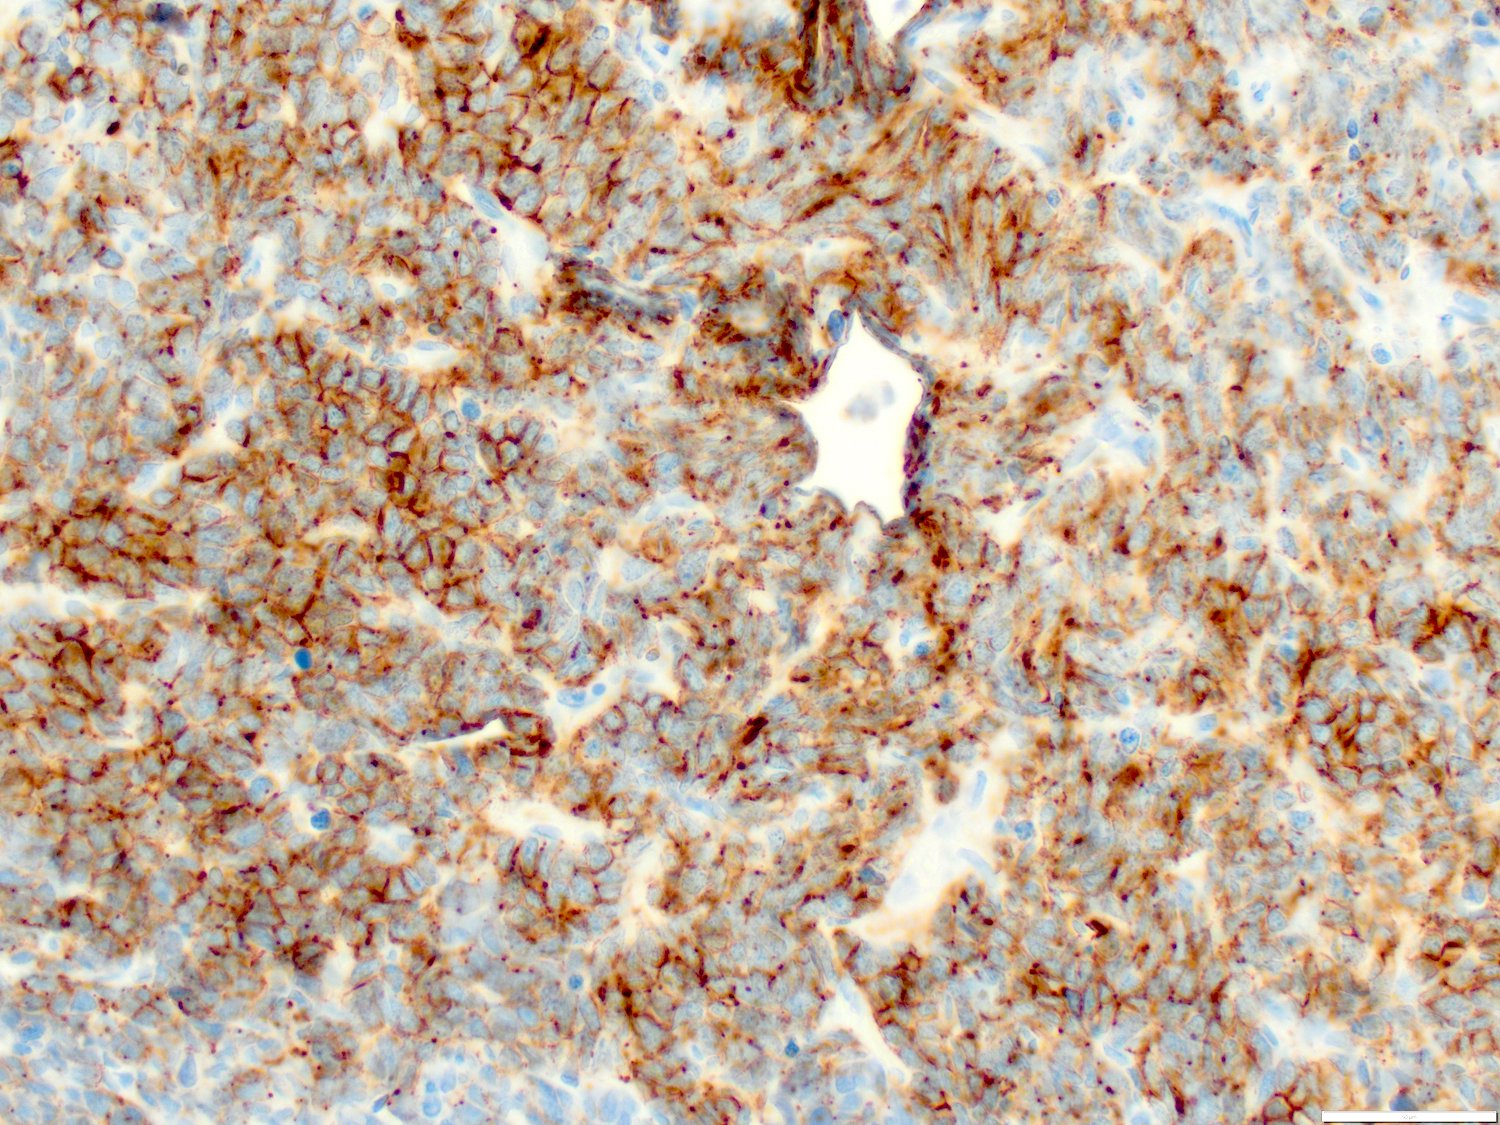
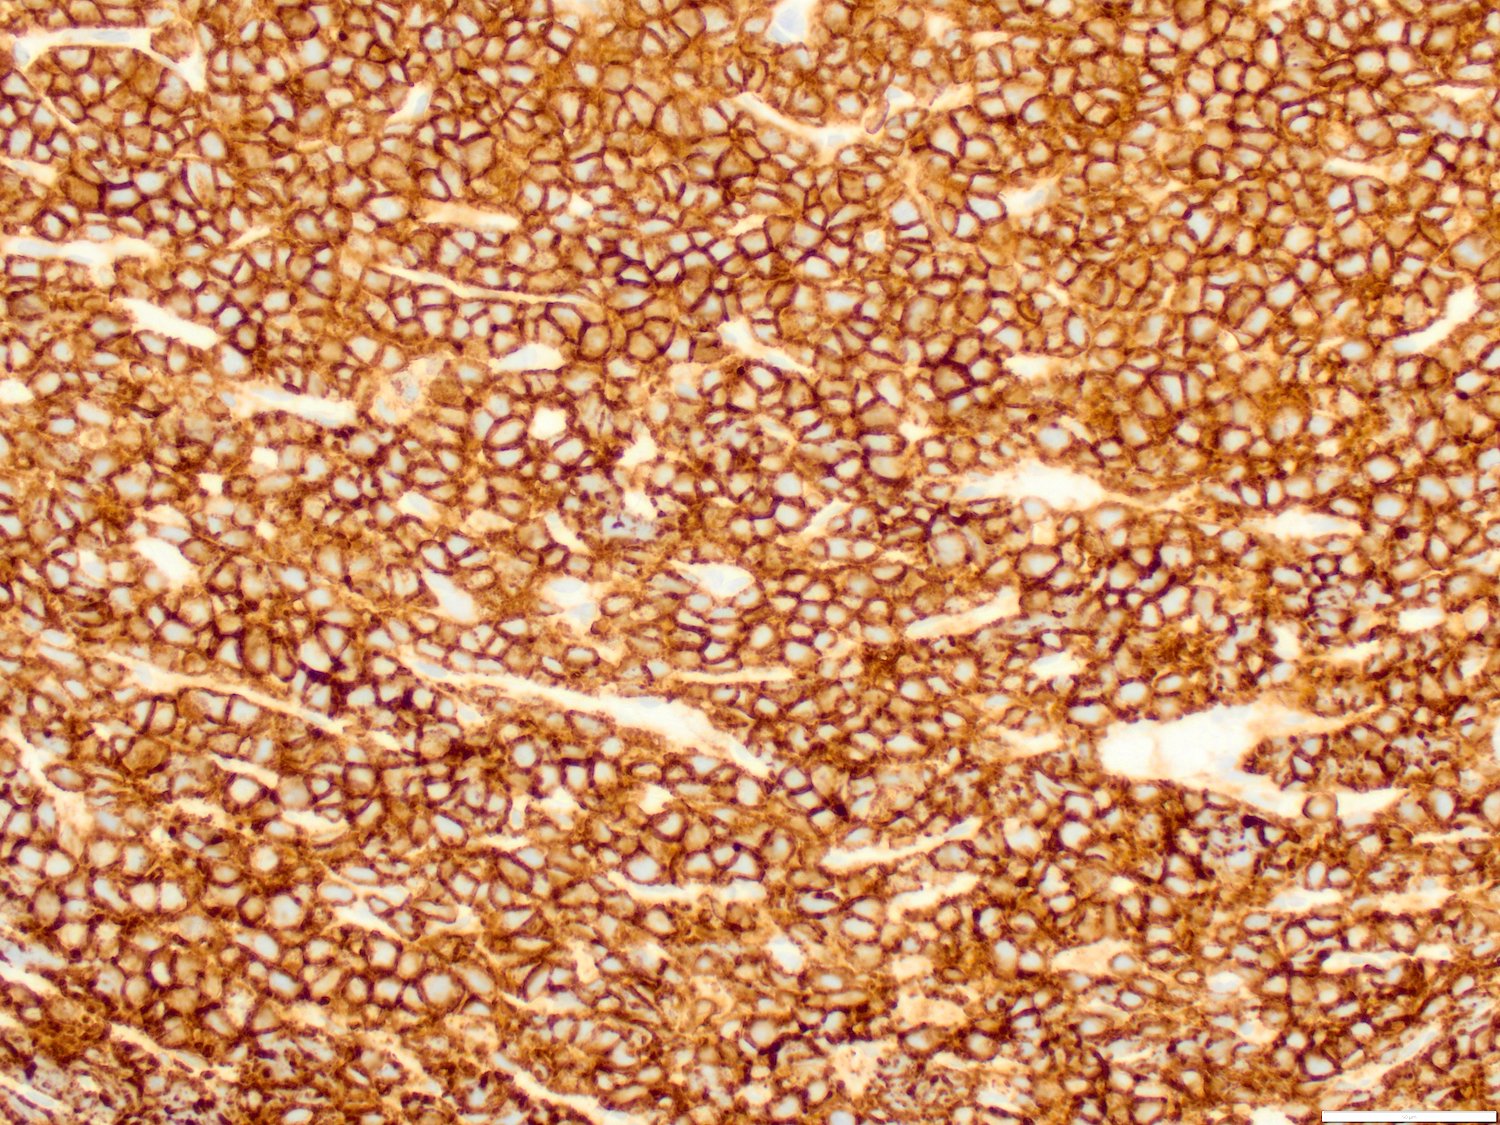
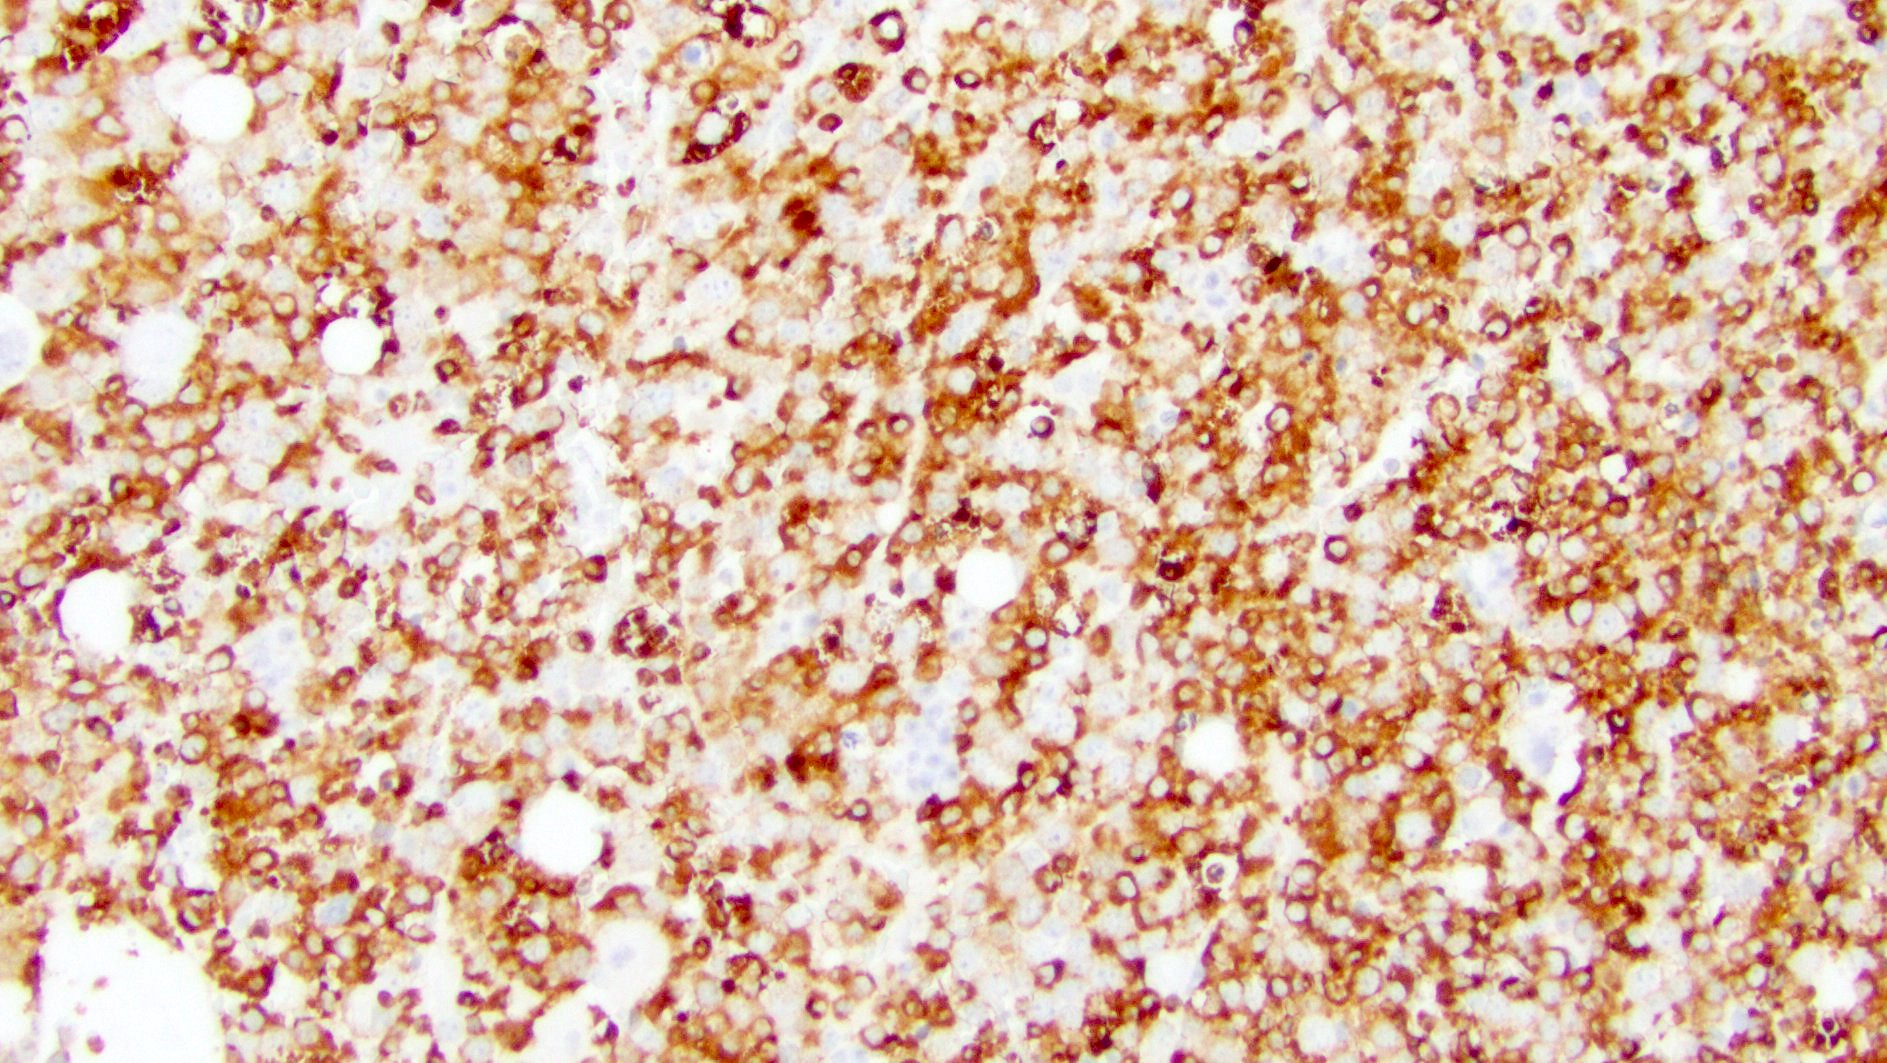
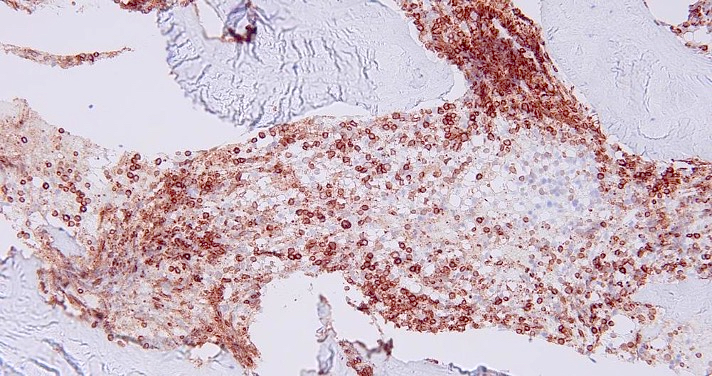
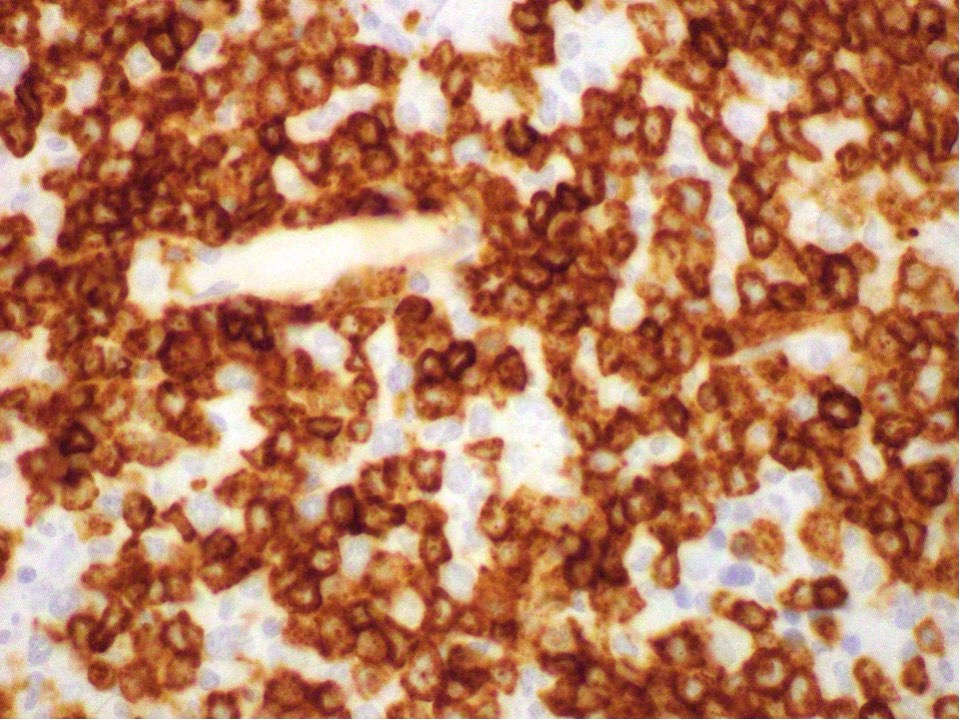
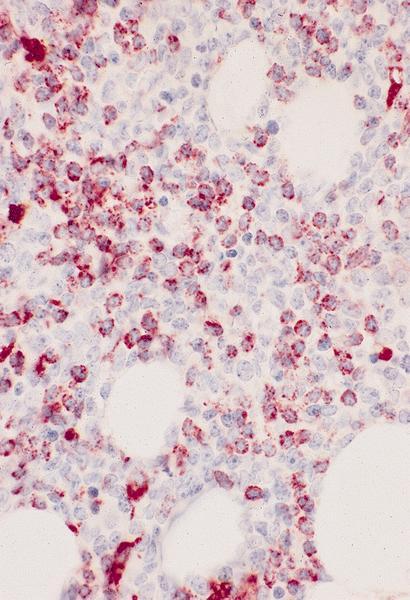
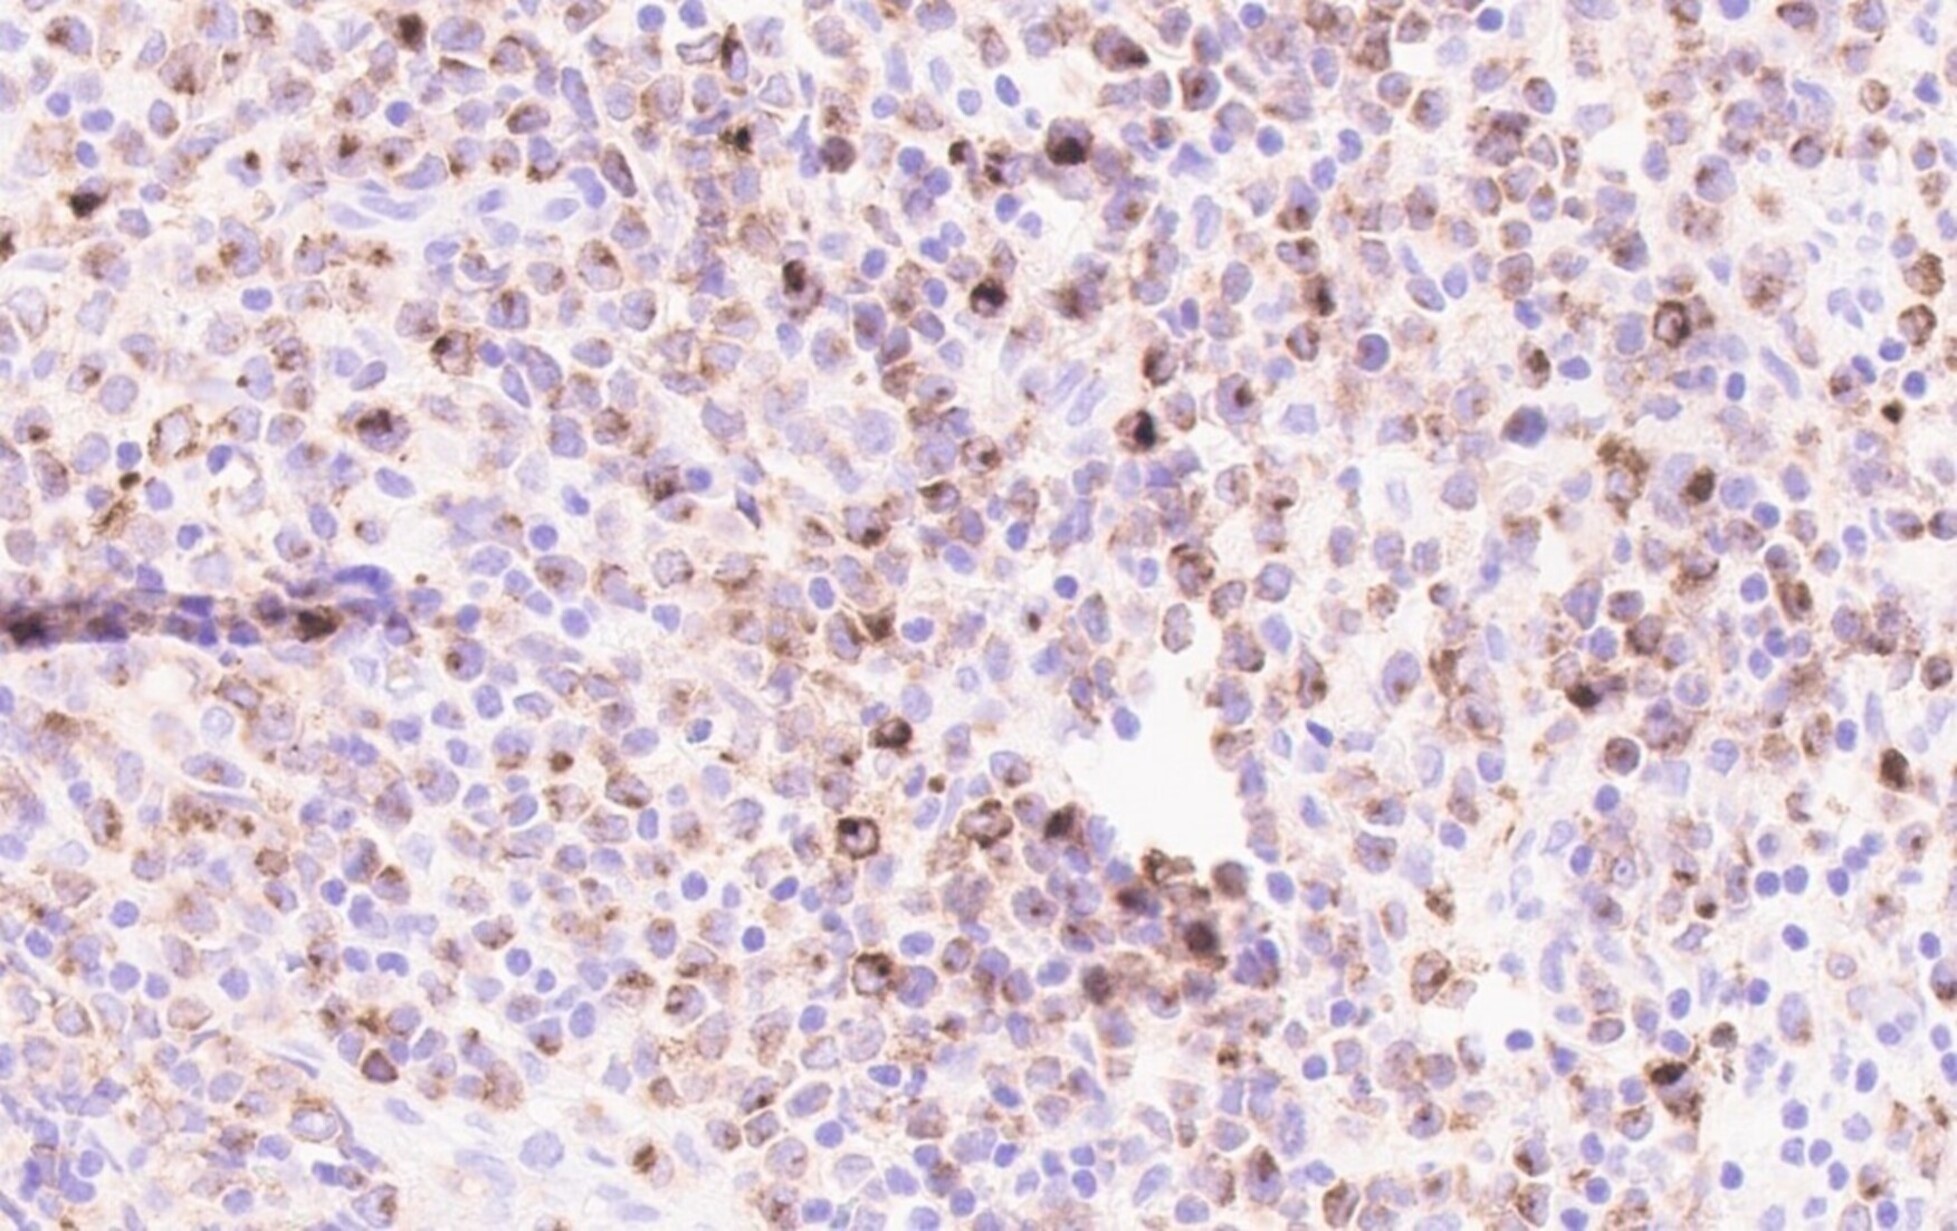
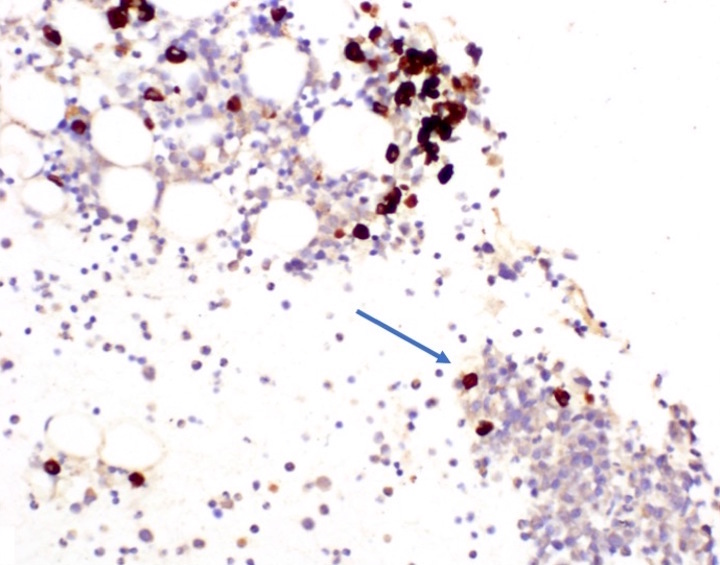
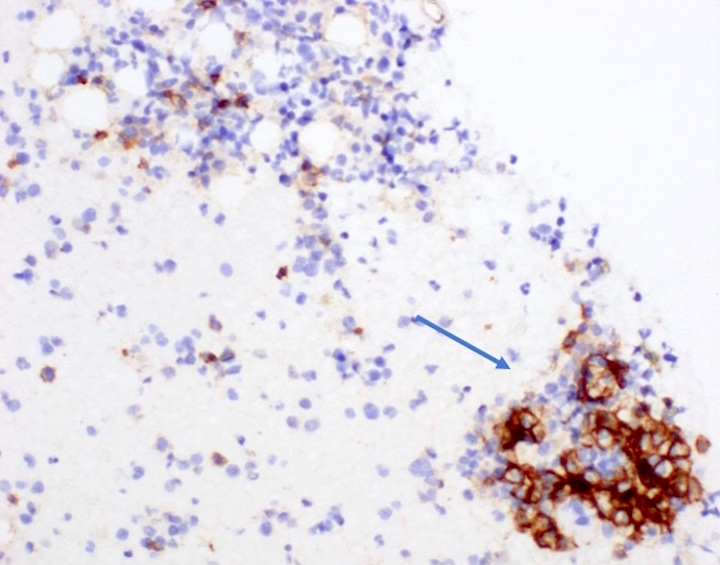
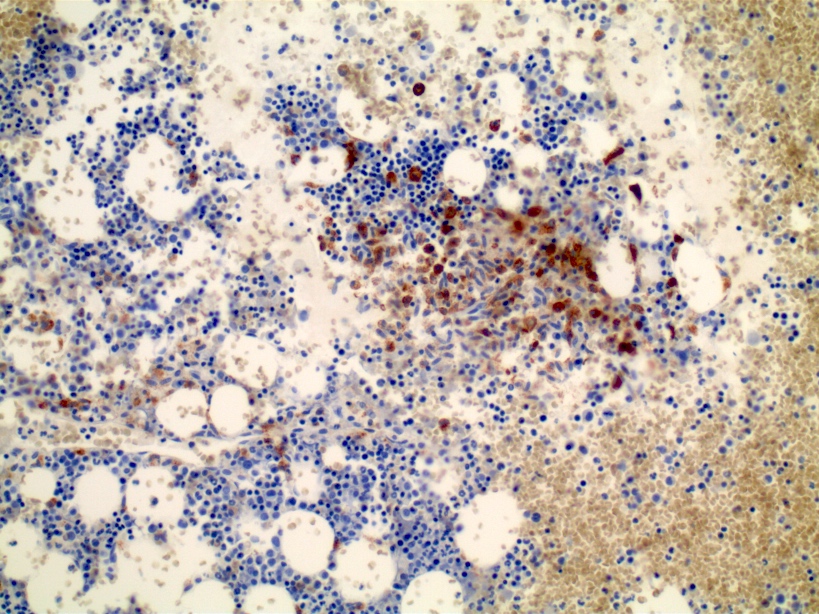
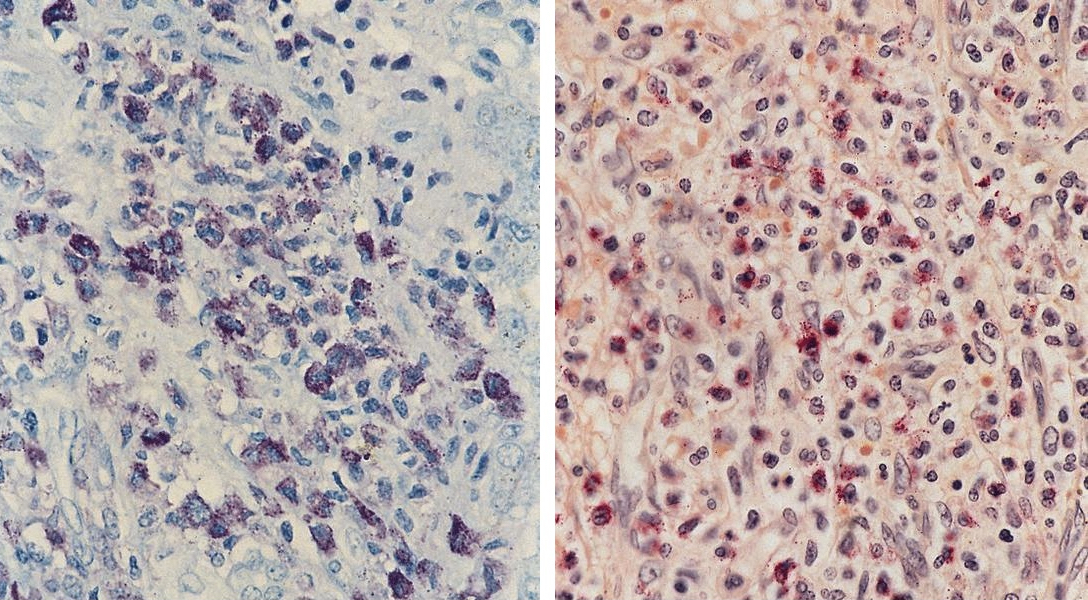
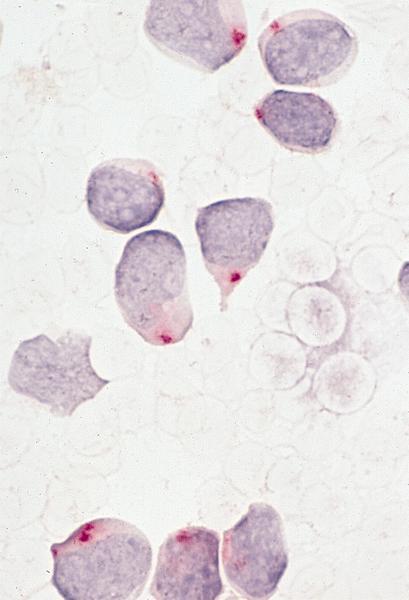
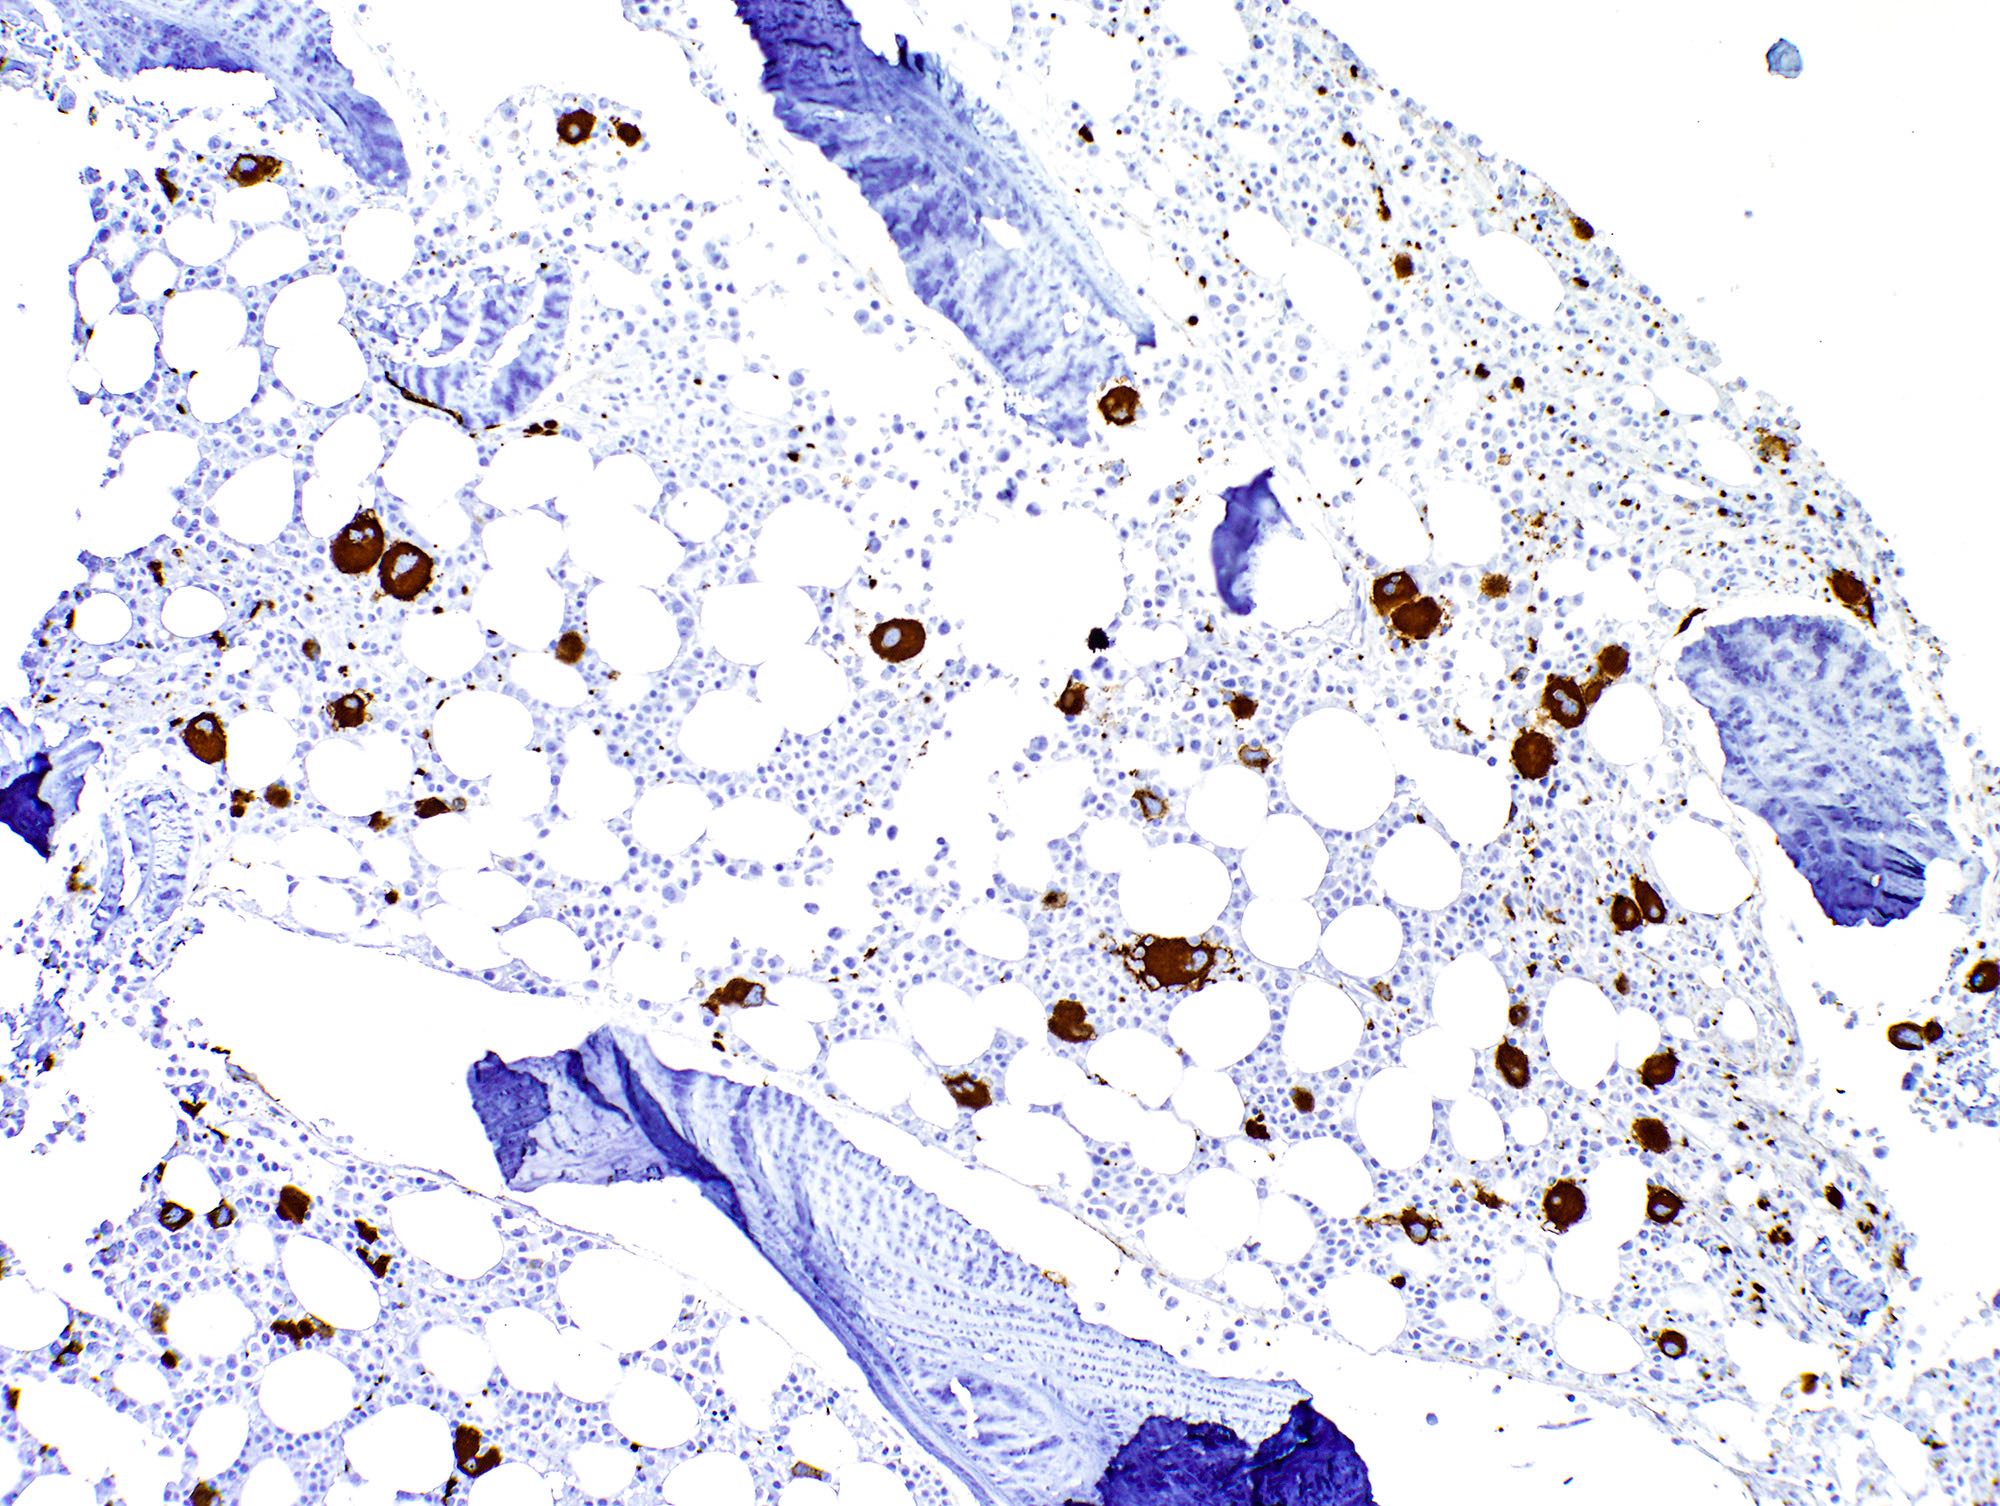
CD34: red, podocalyxin: brown
Images hosted on other servers:


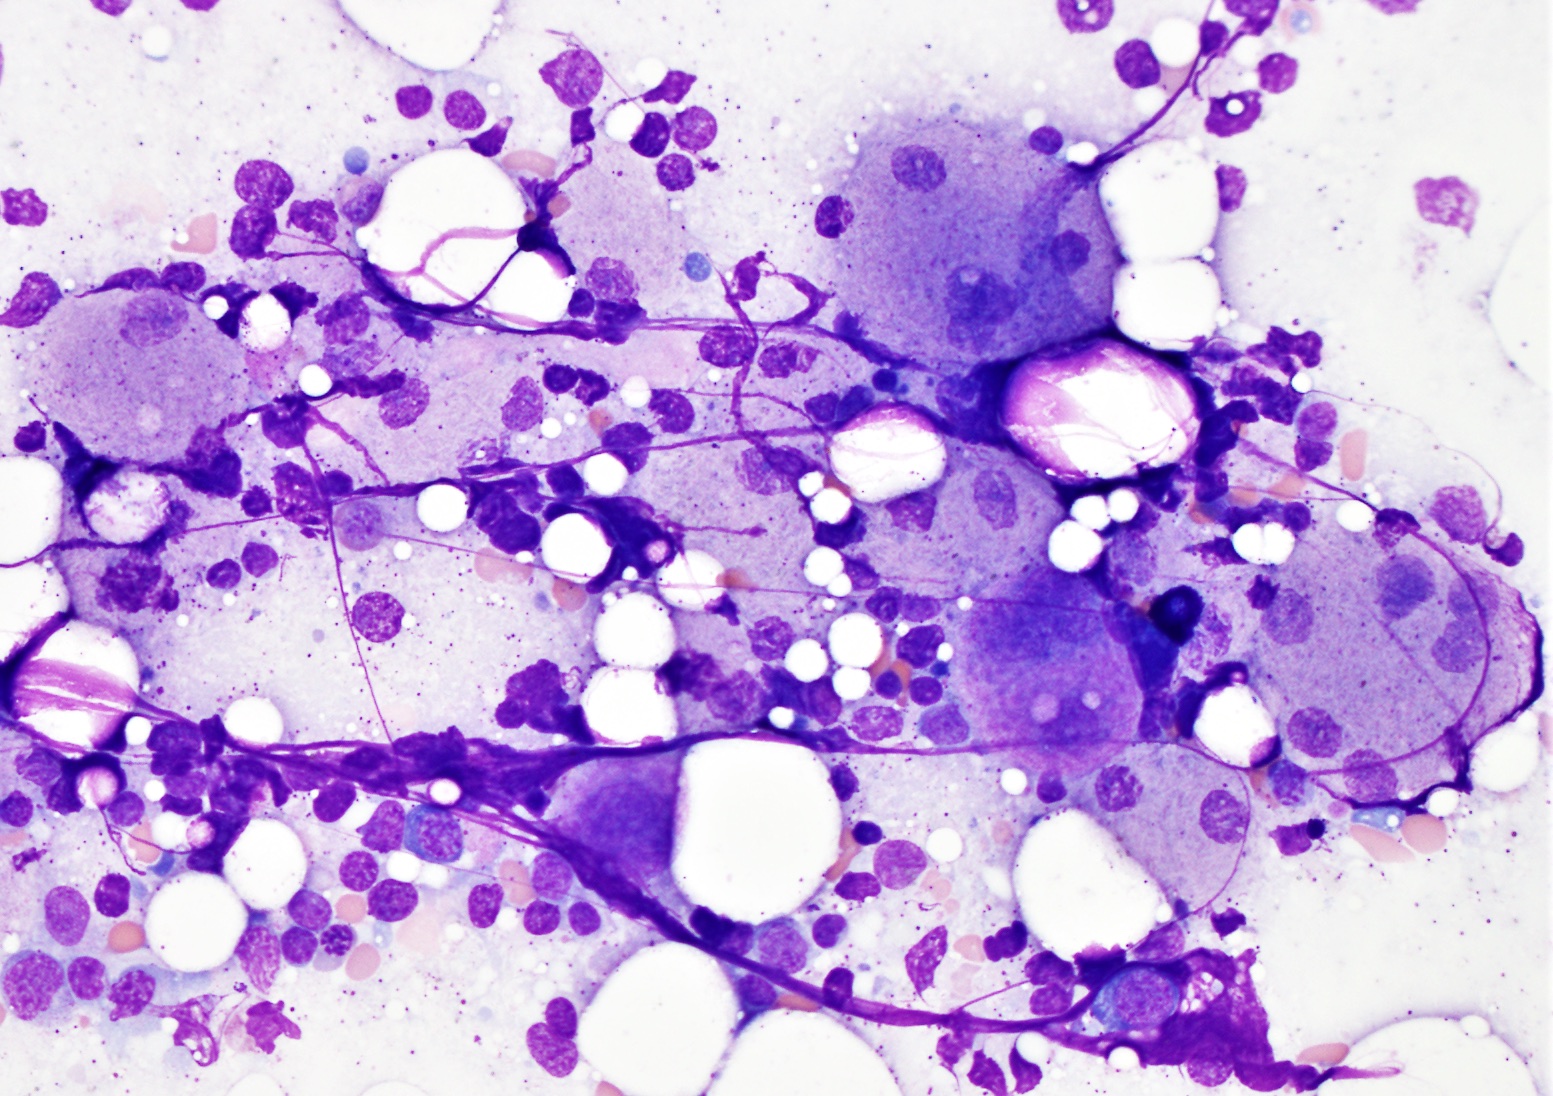
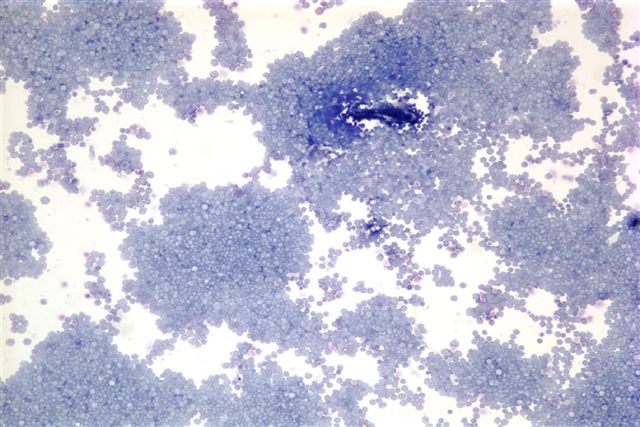
FNA and CSF
Contributed by Huifei Liu, M.D., Ph.D.
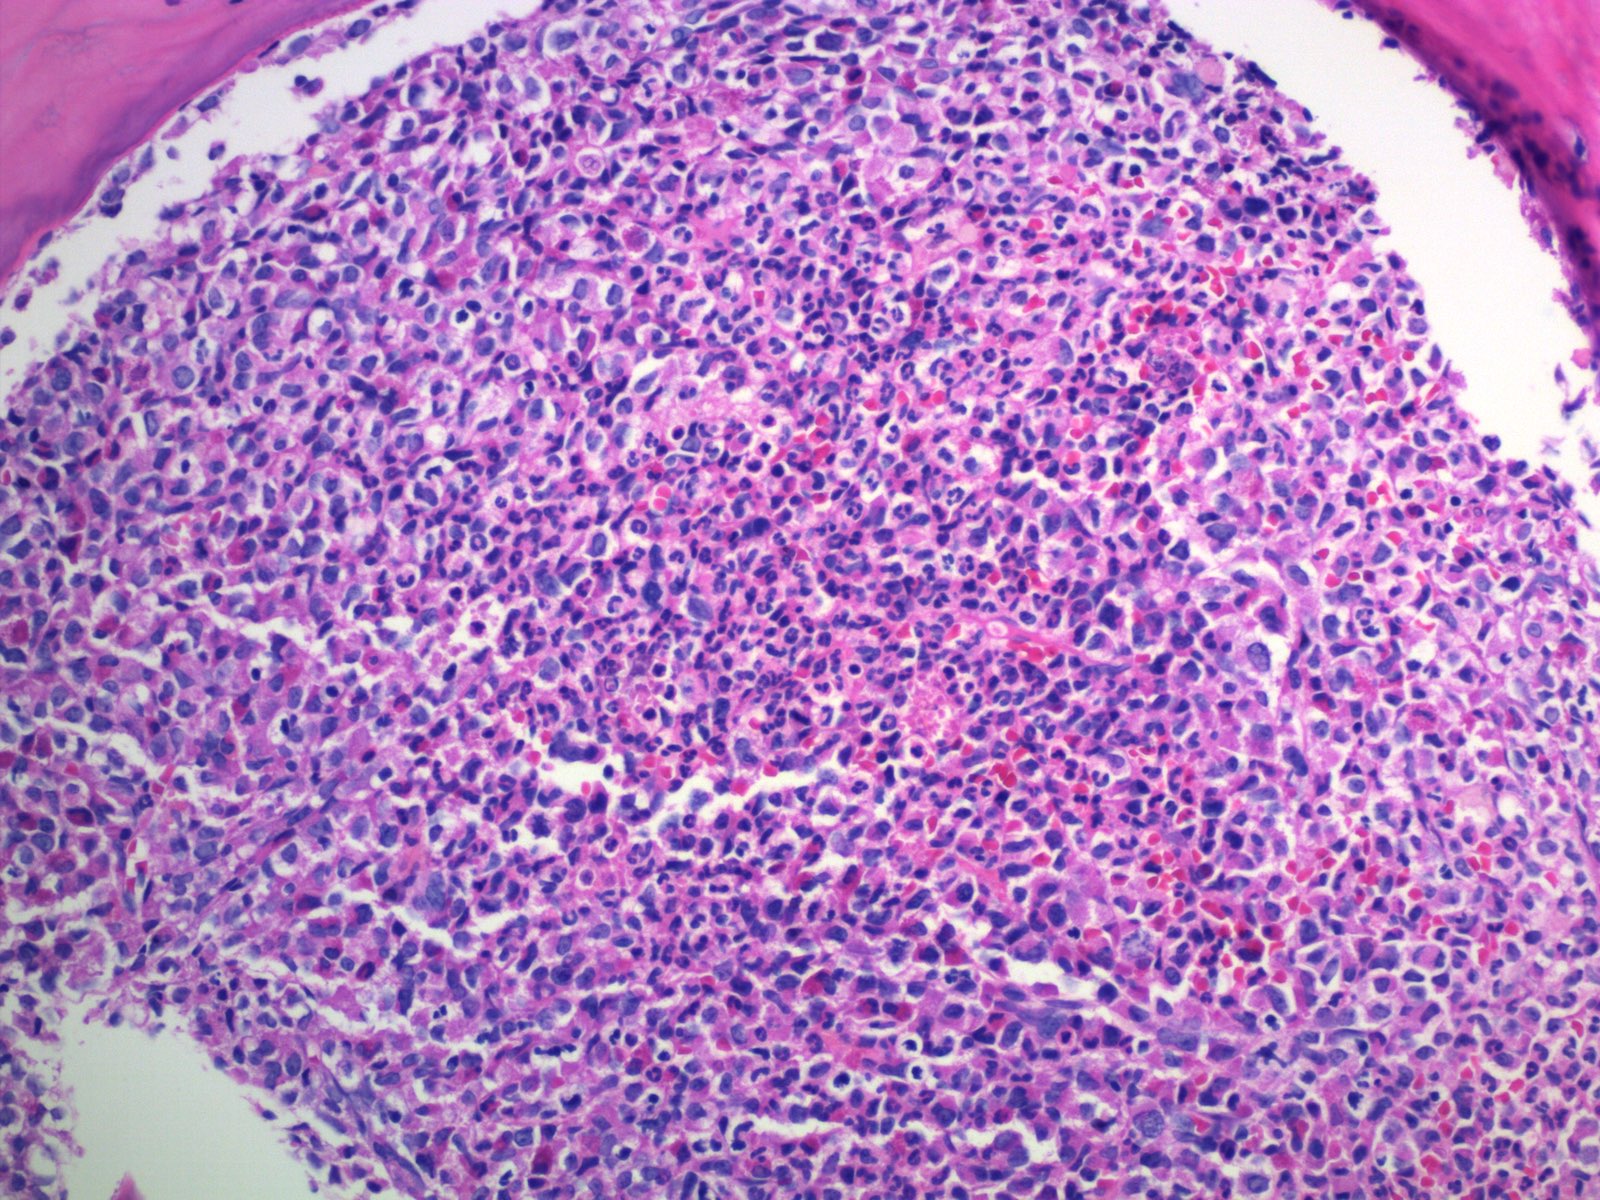
Erythroblastic sarcoma
E-cadherin
CD43
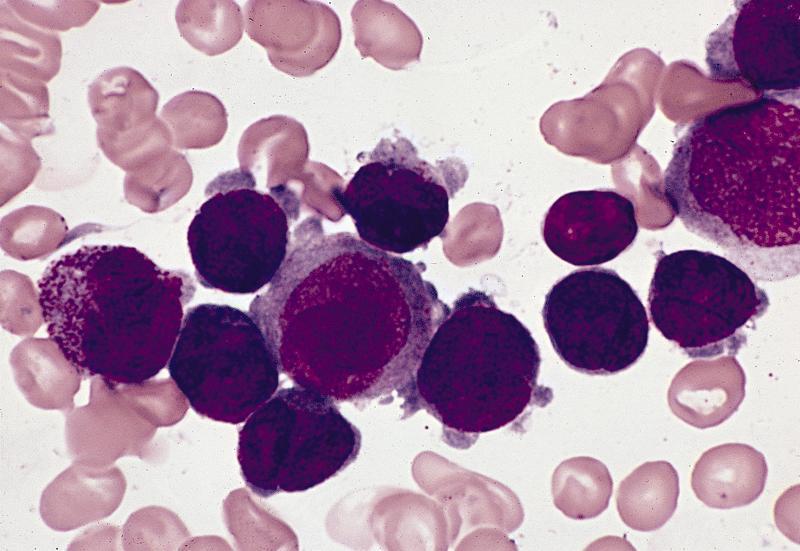
AFIP images

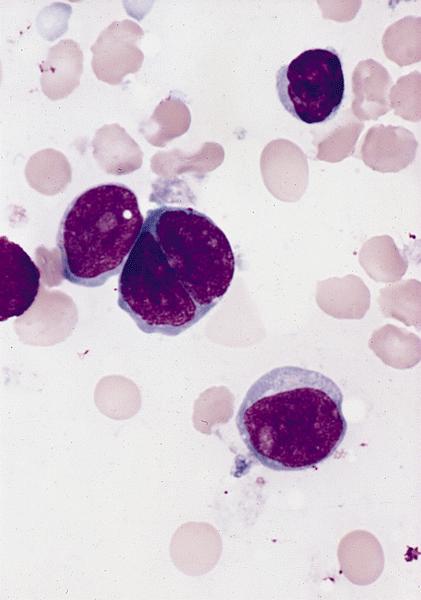
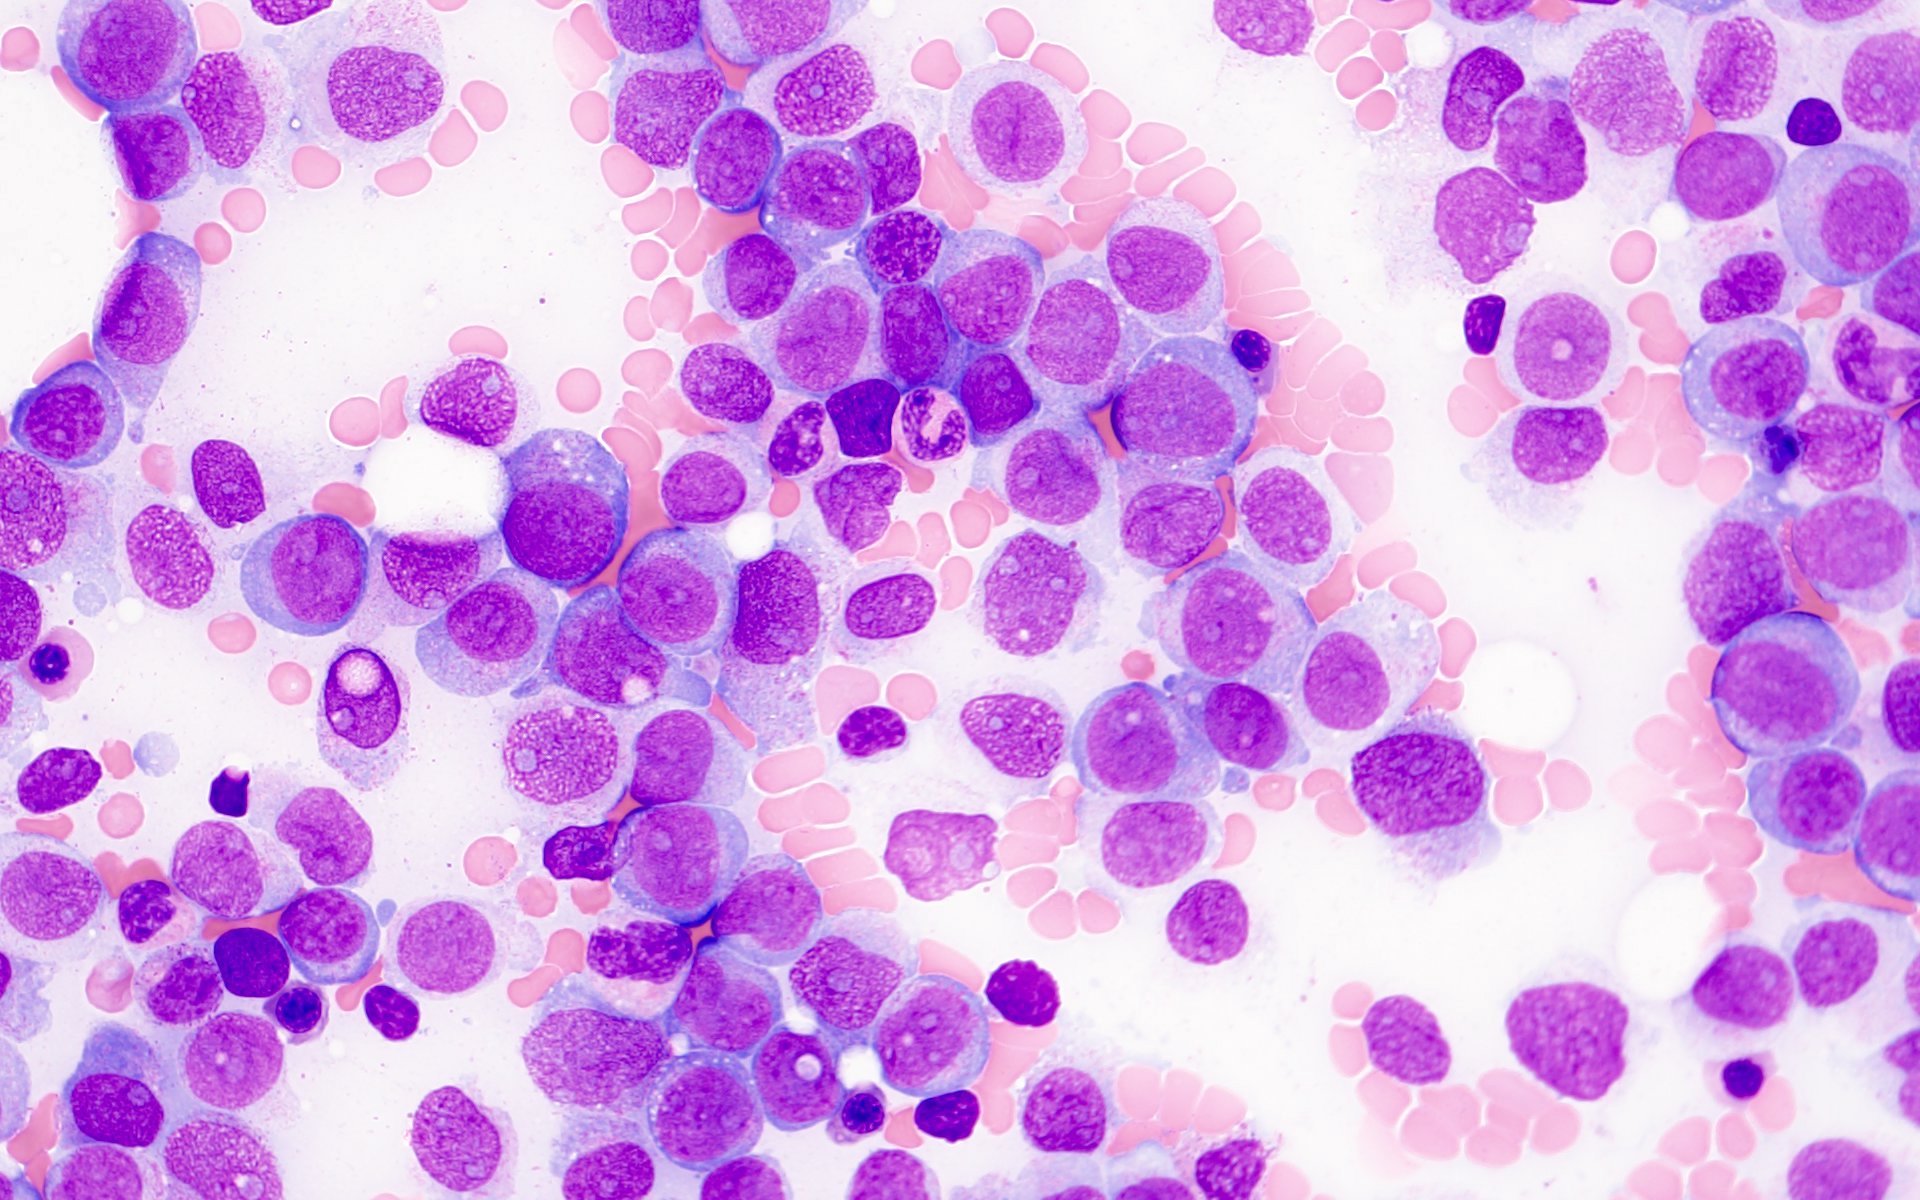
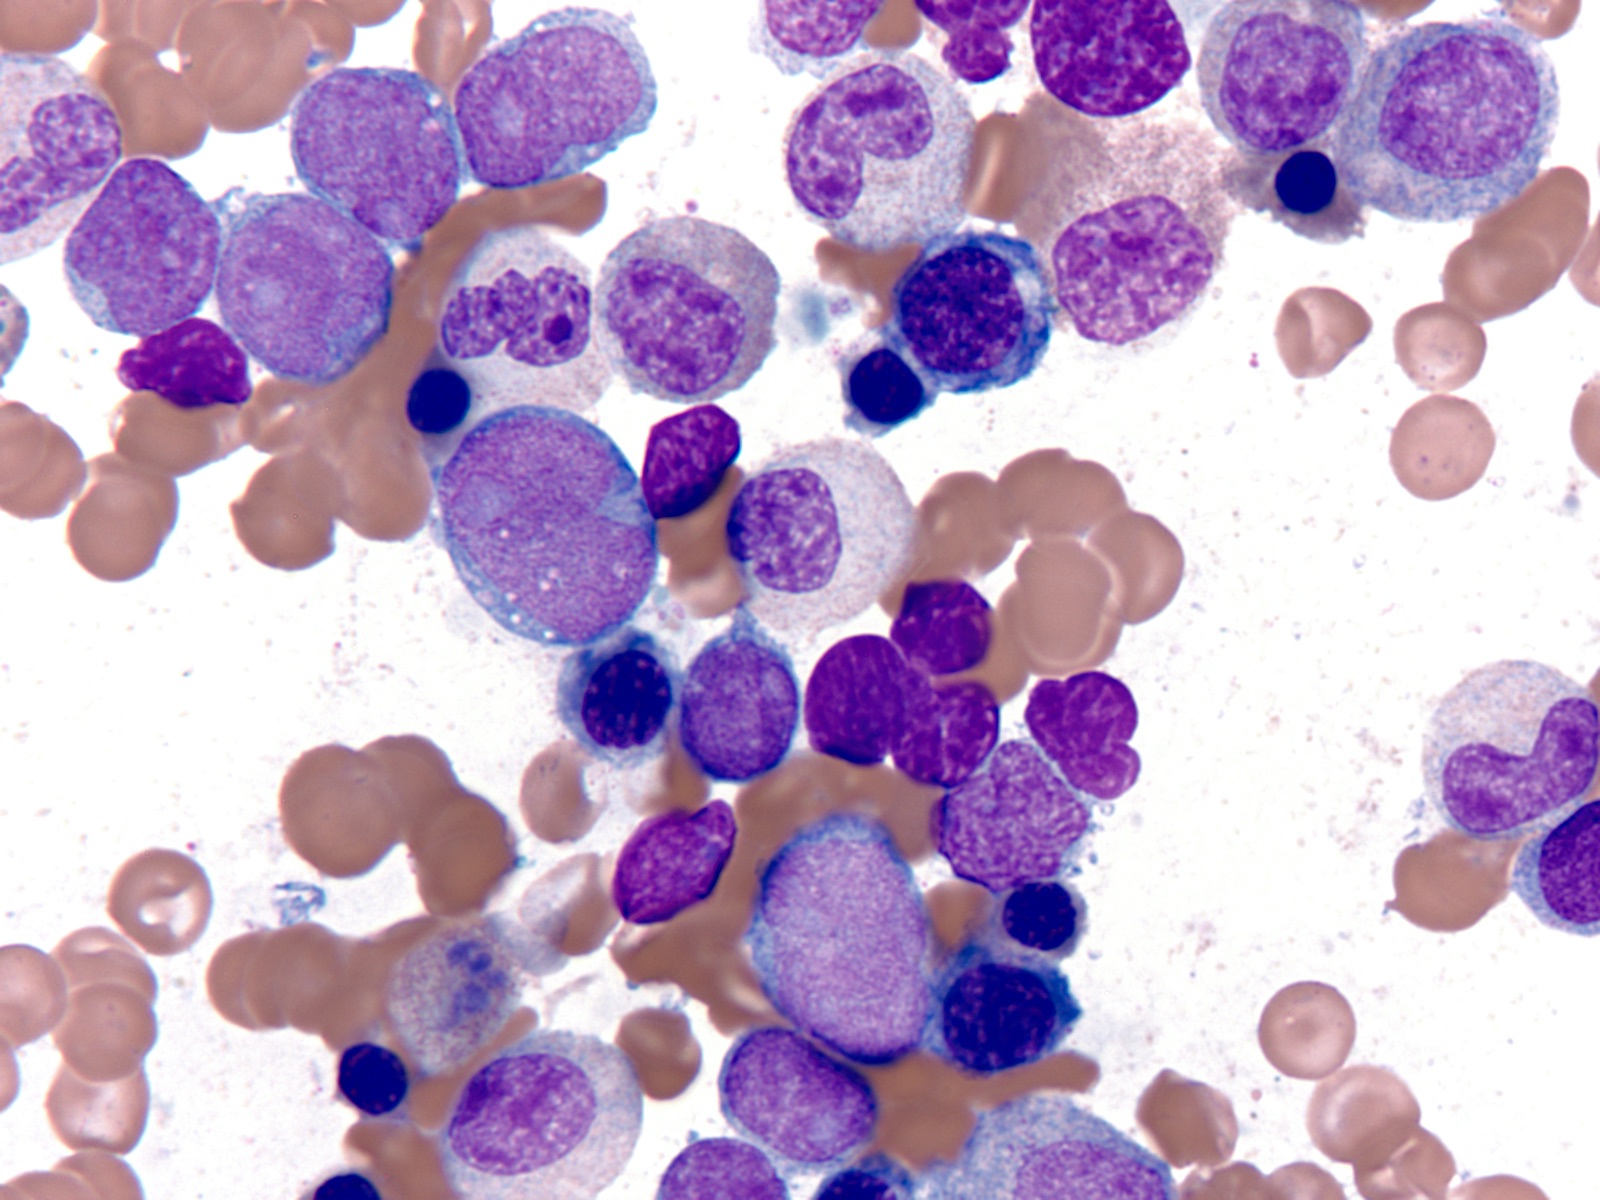
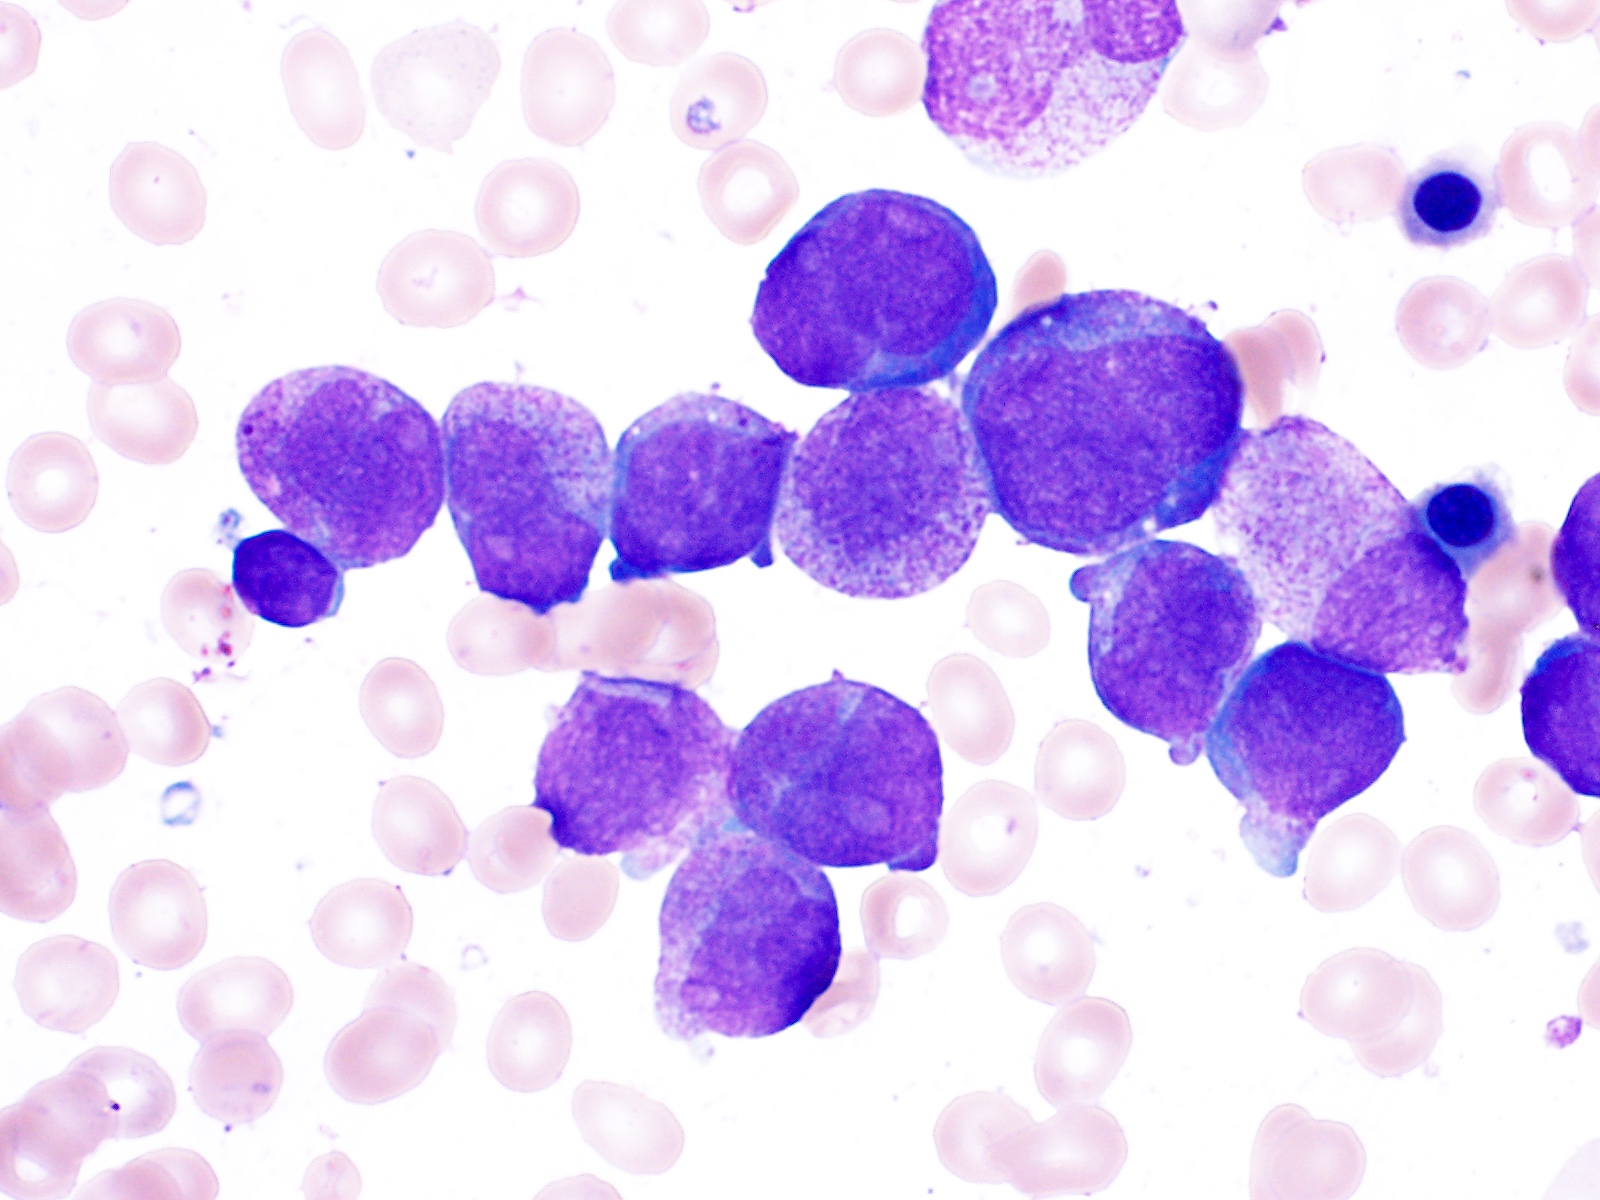
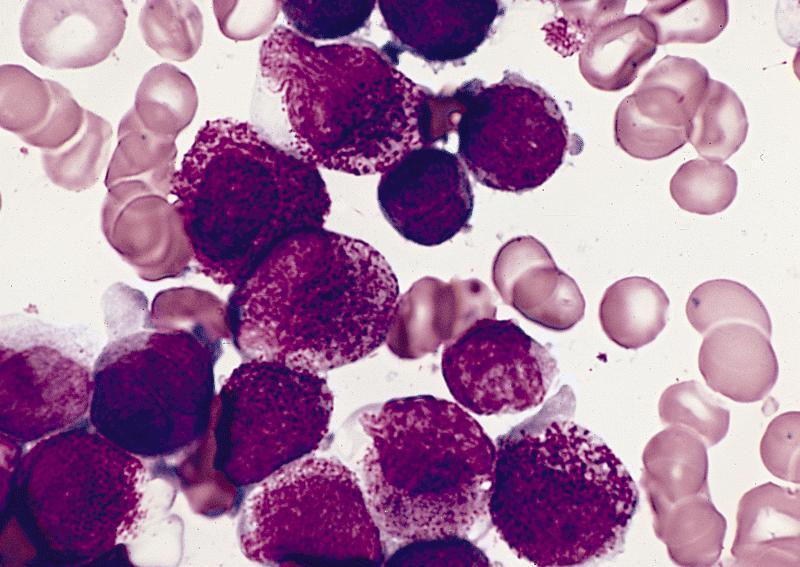
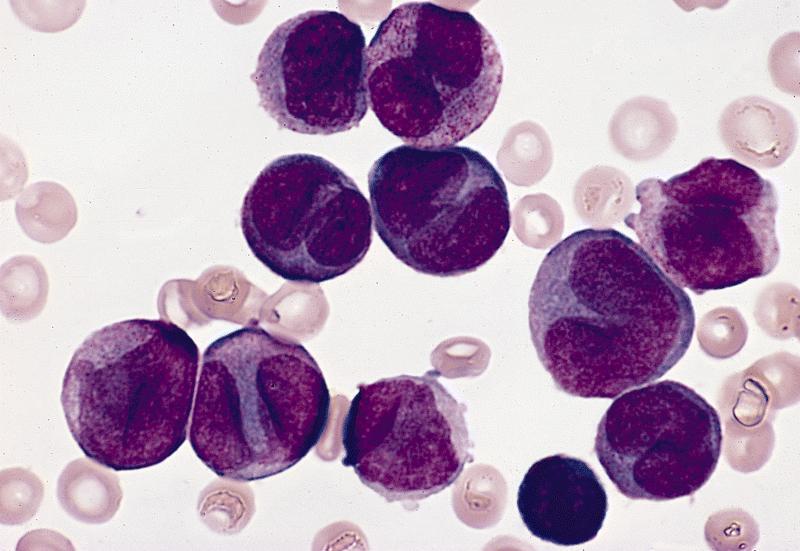
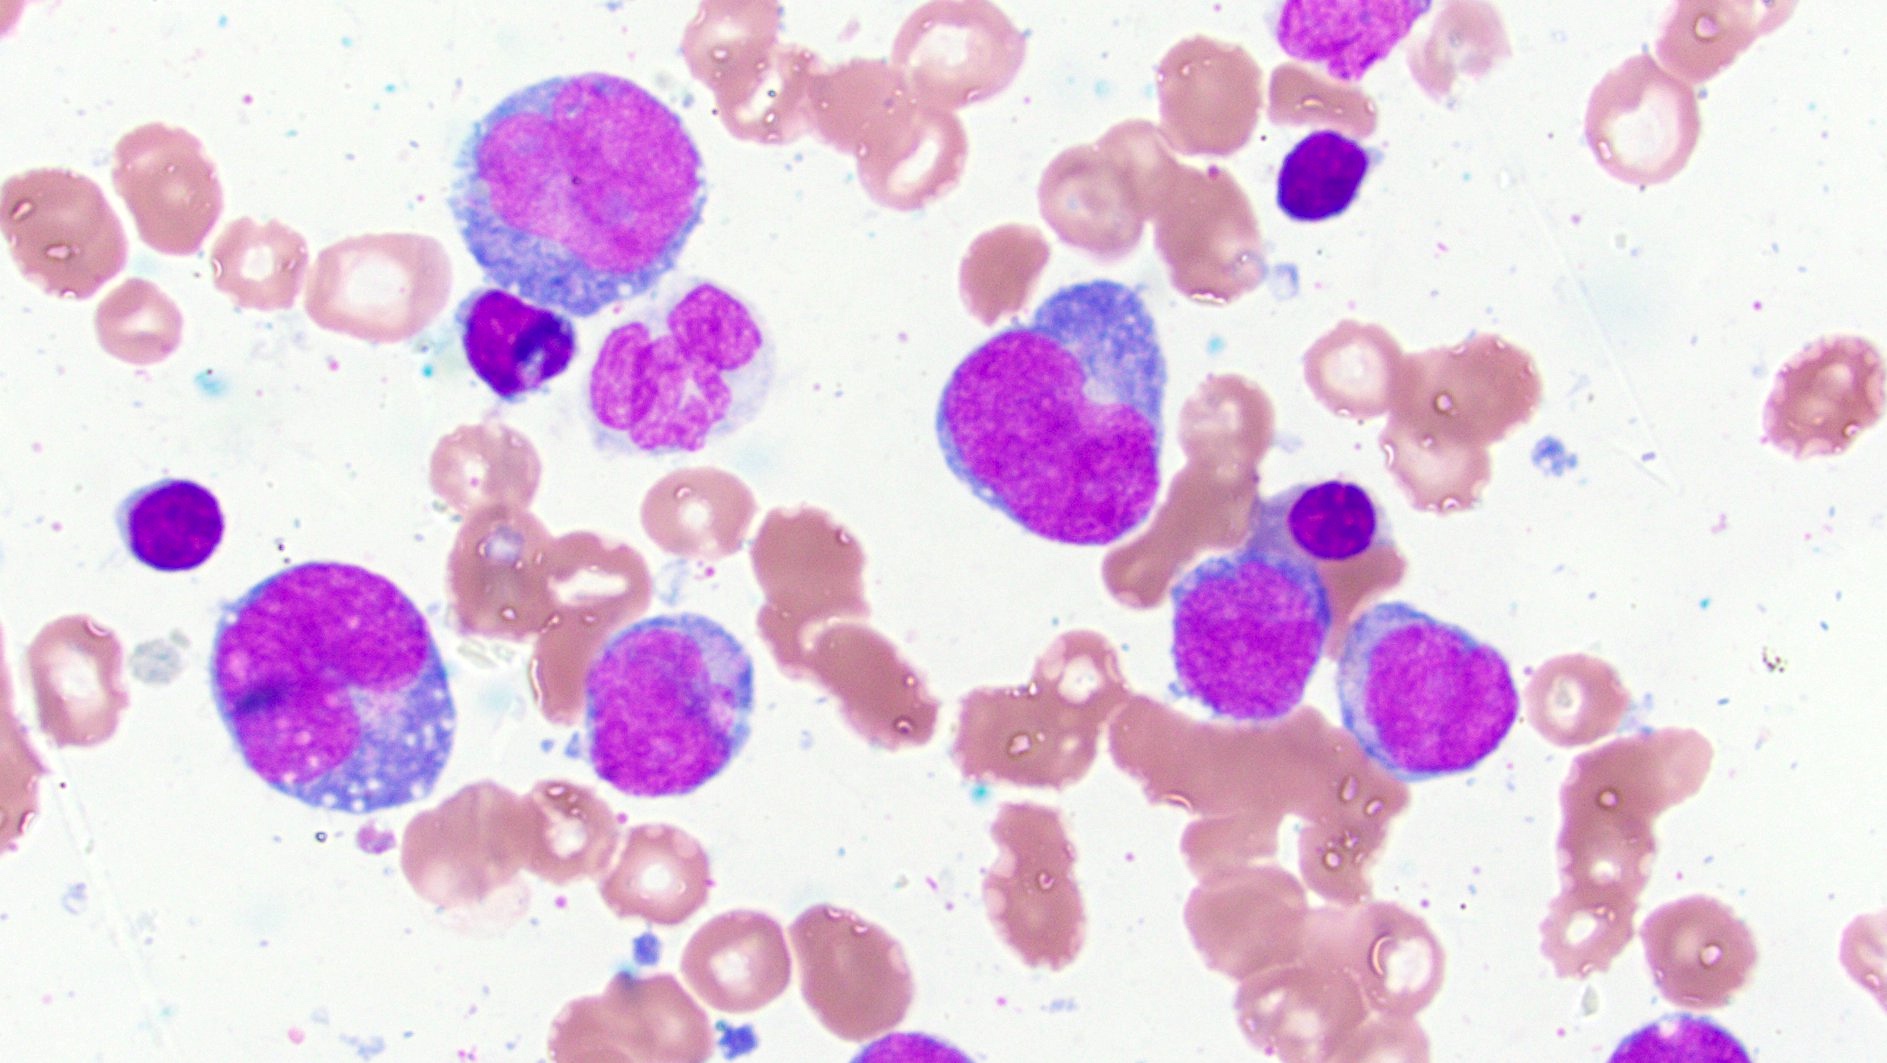
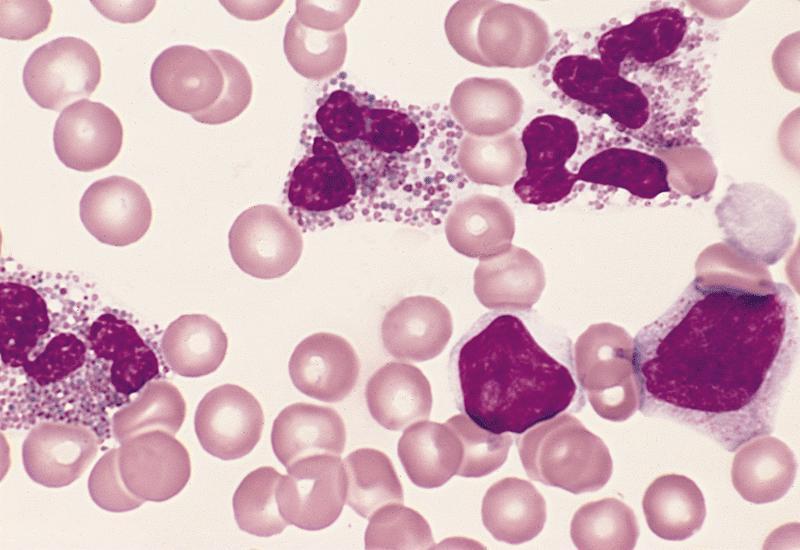
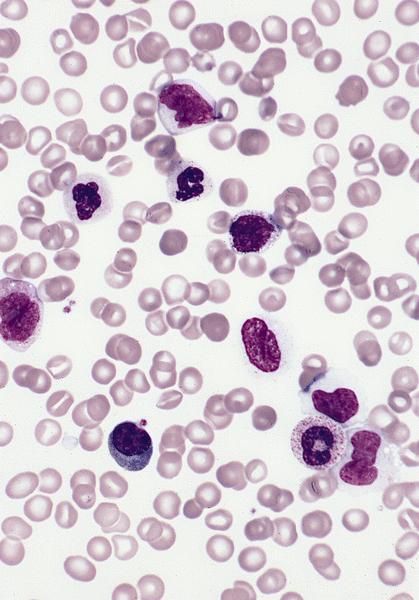
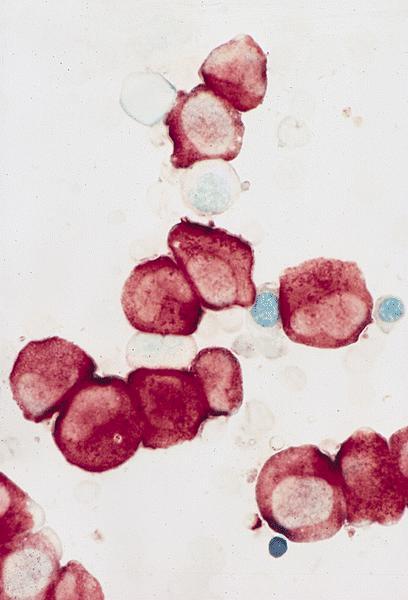
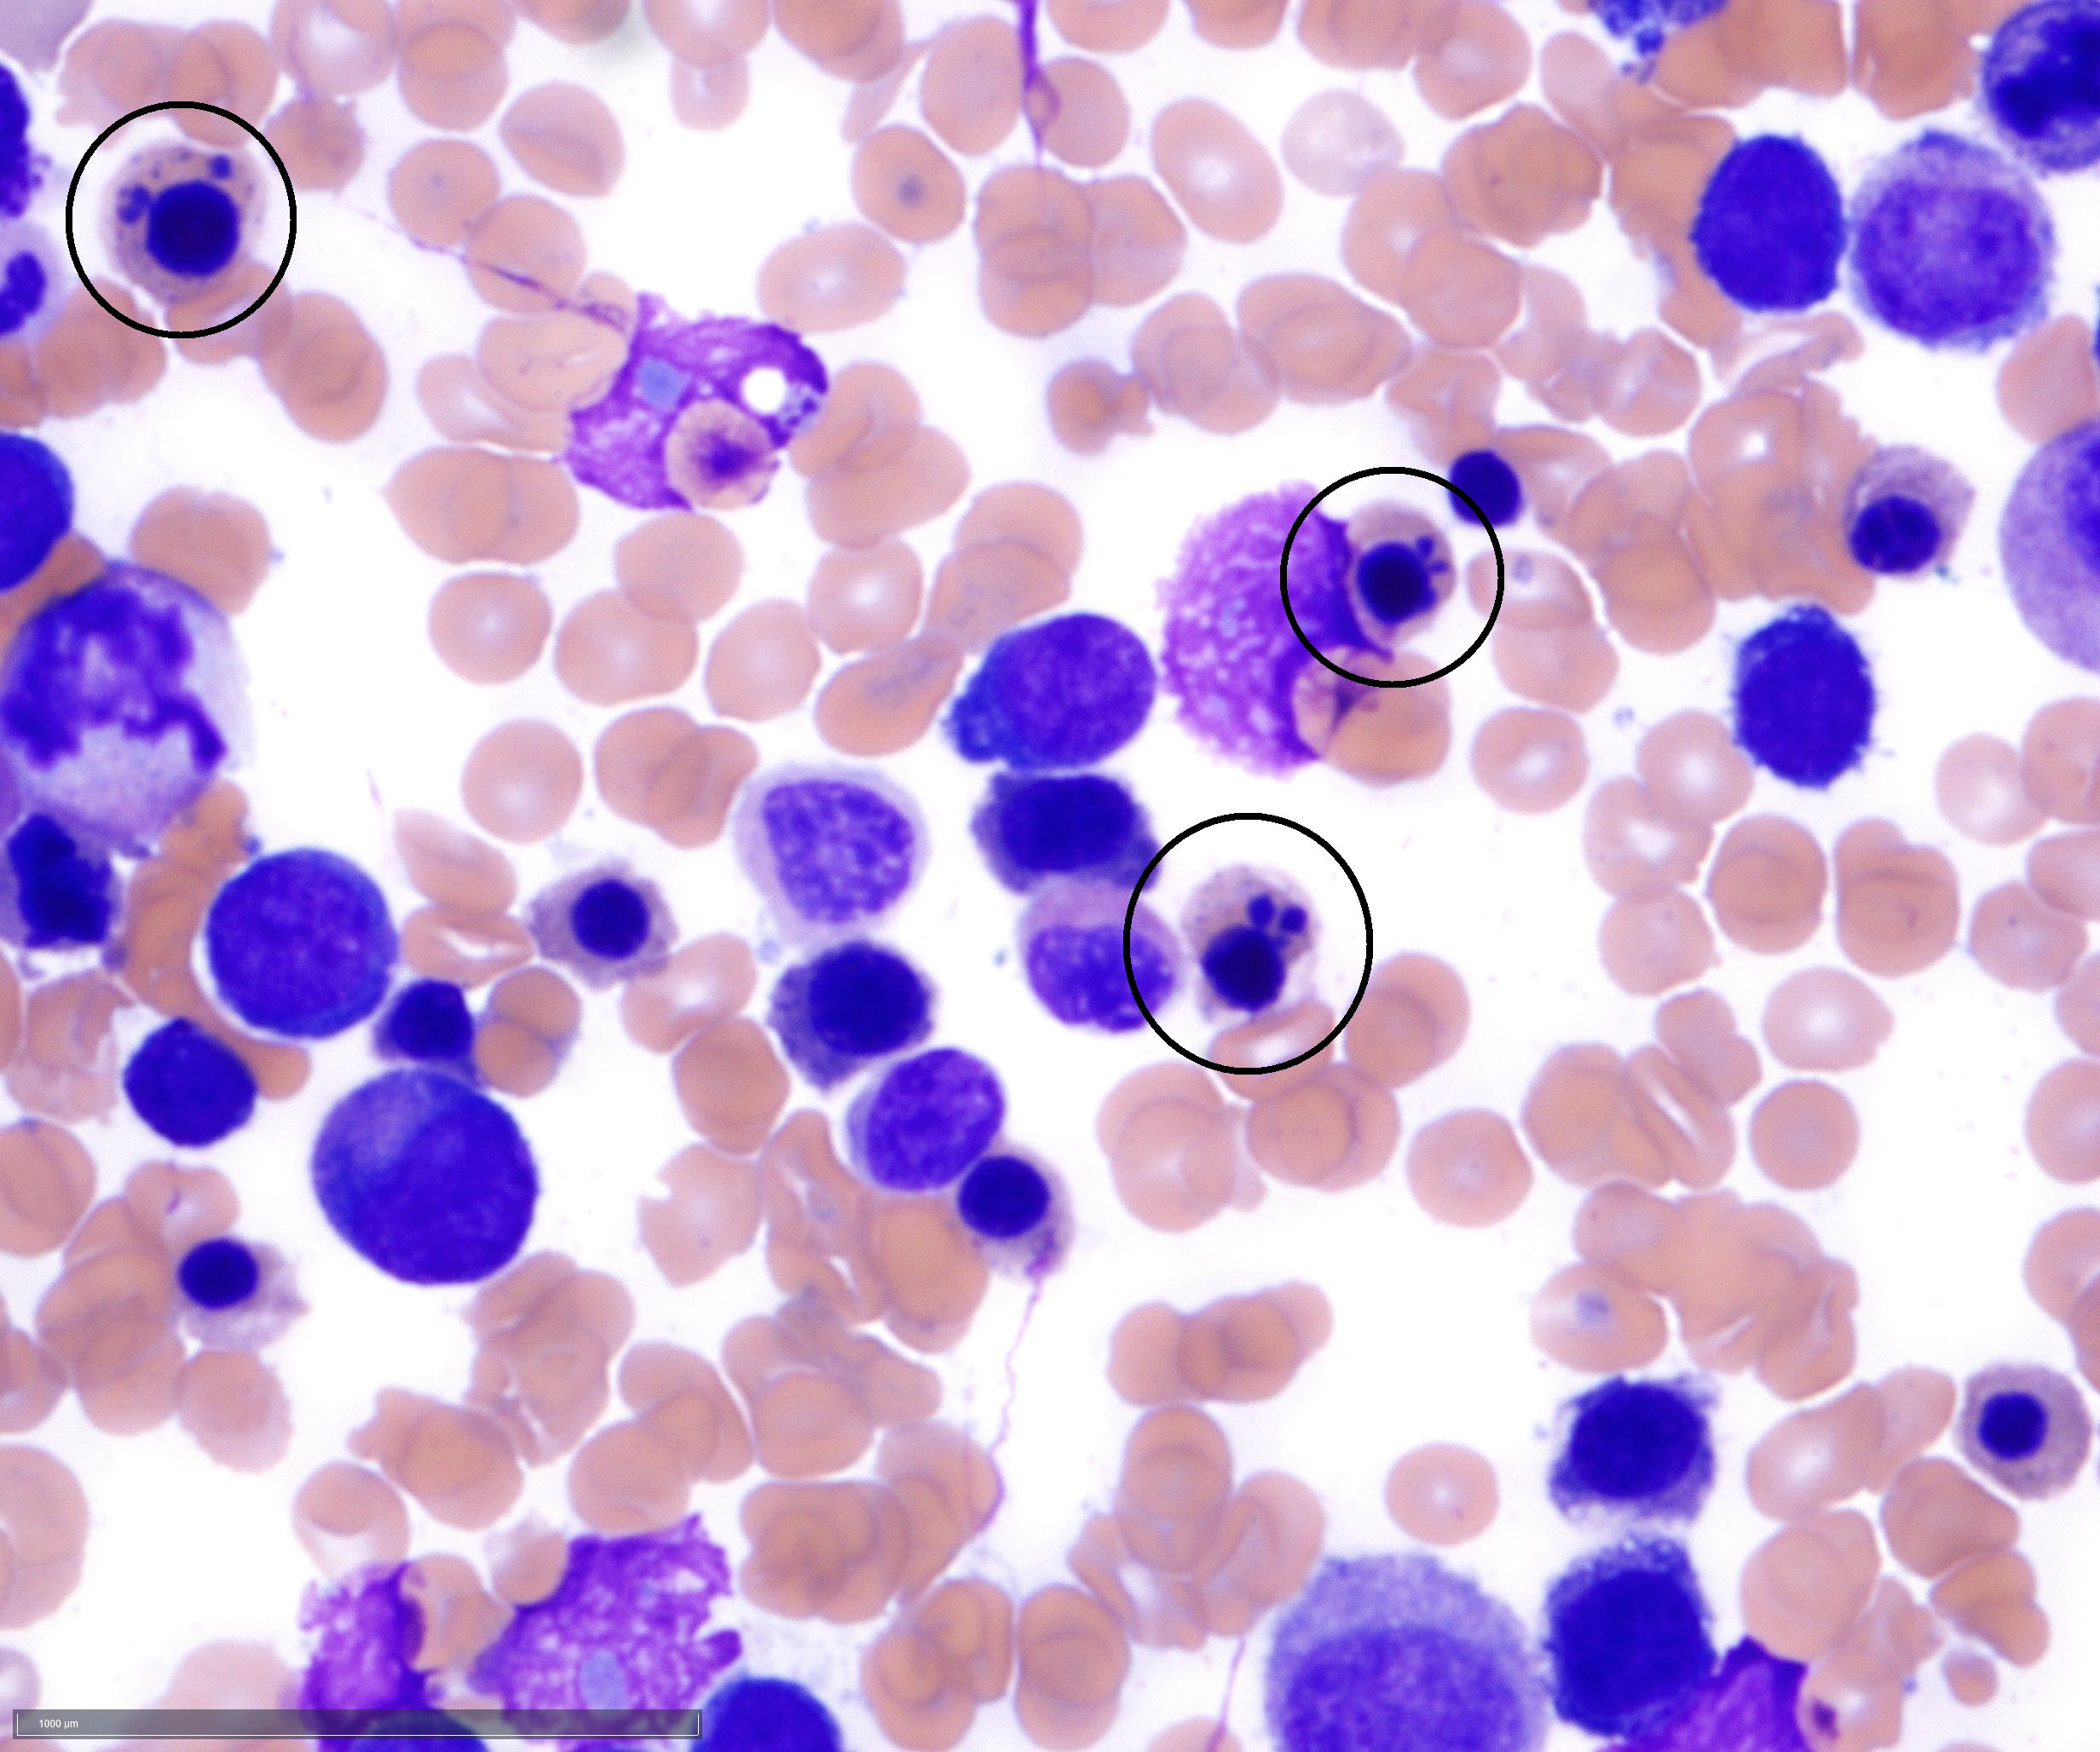
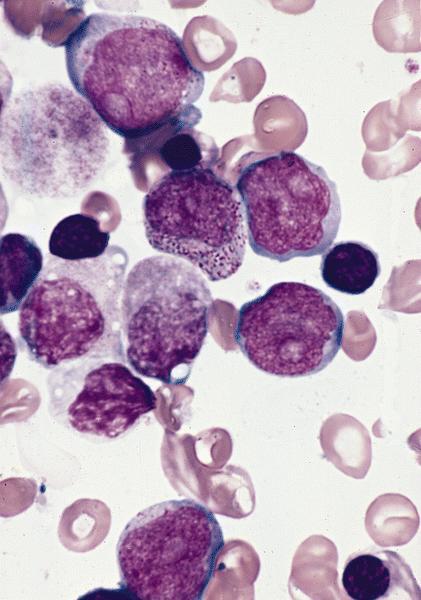
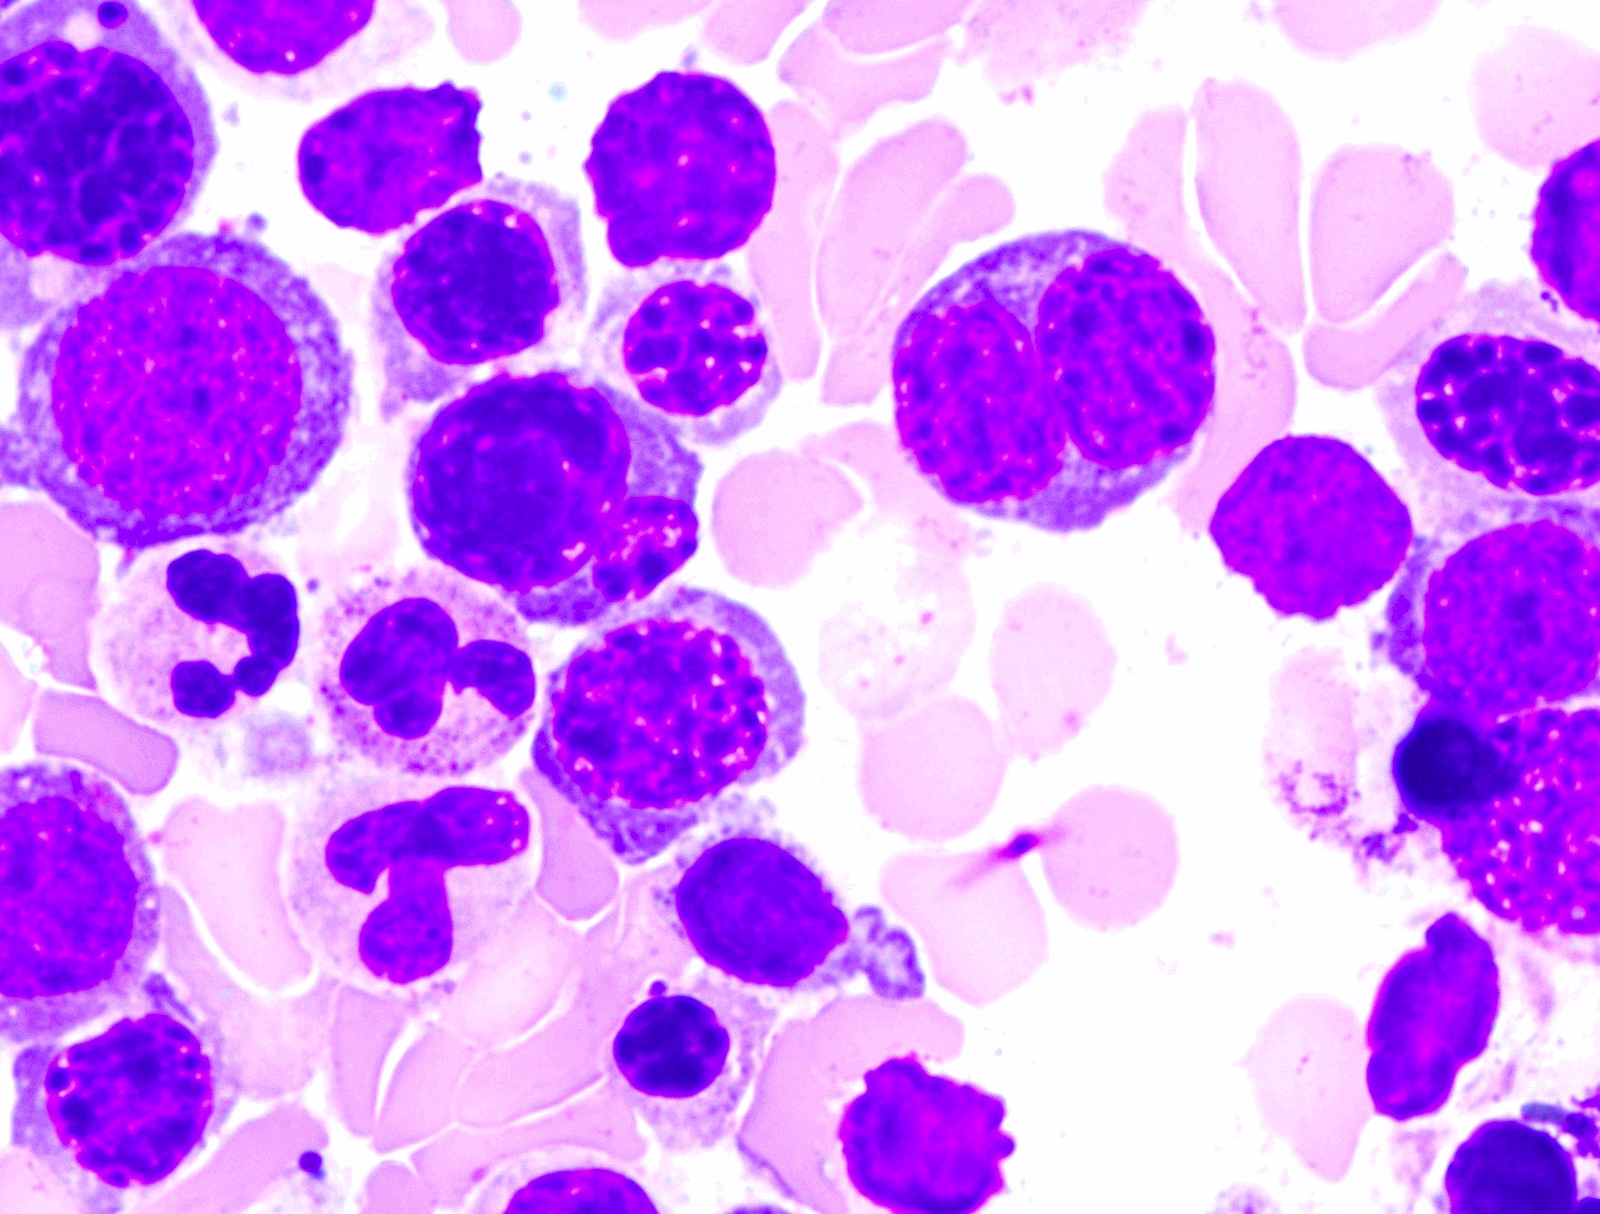
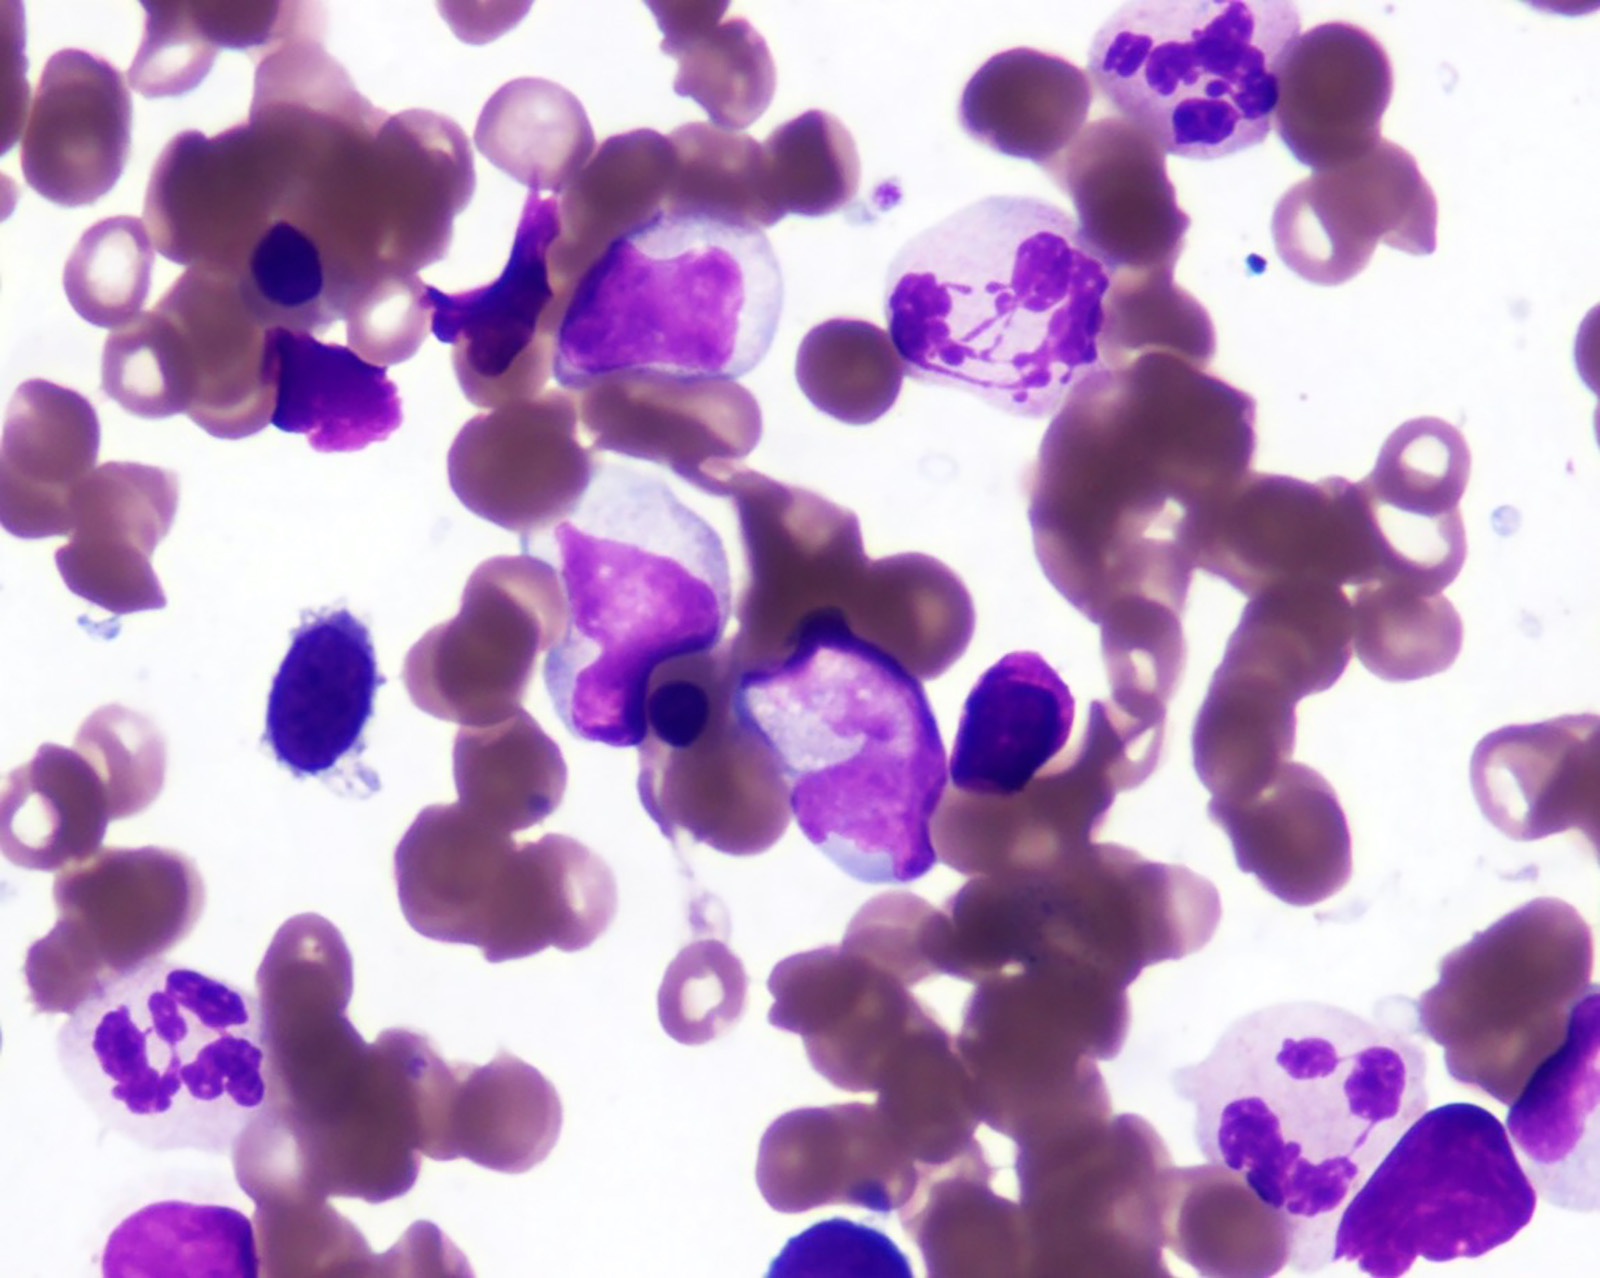
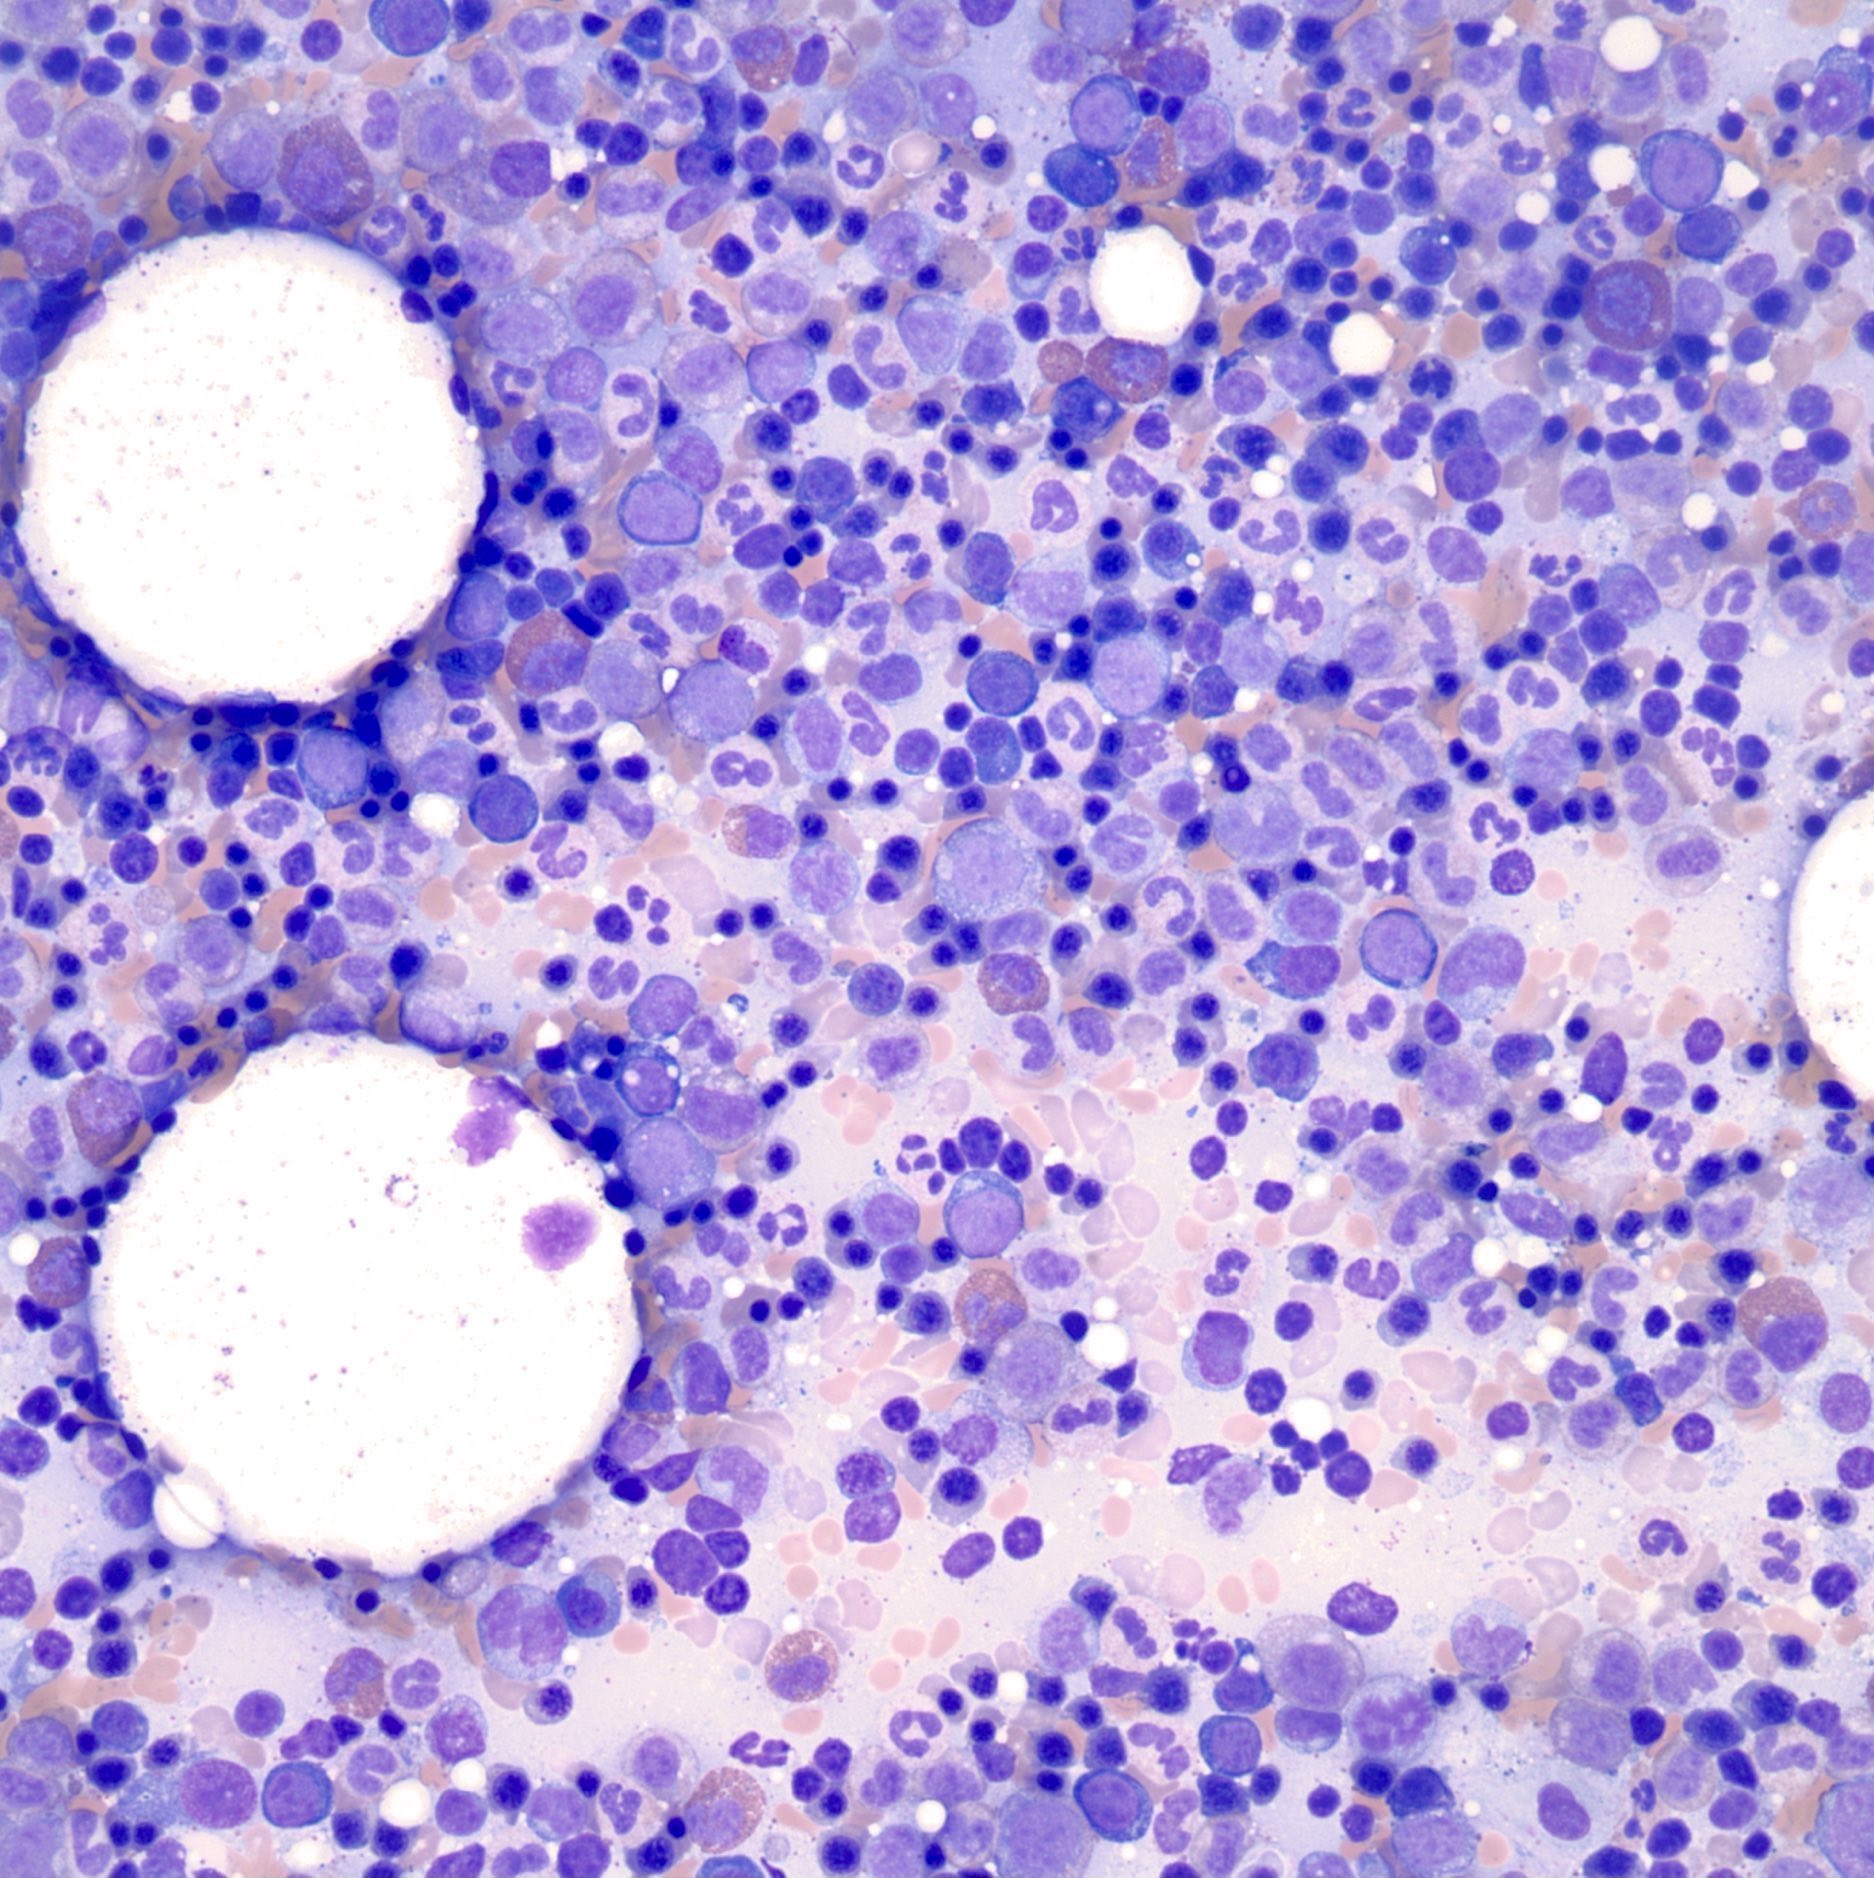
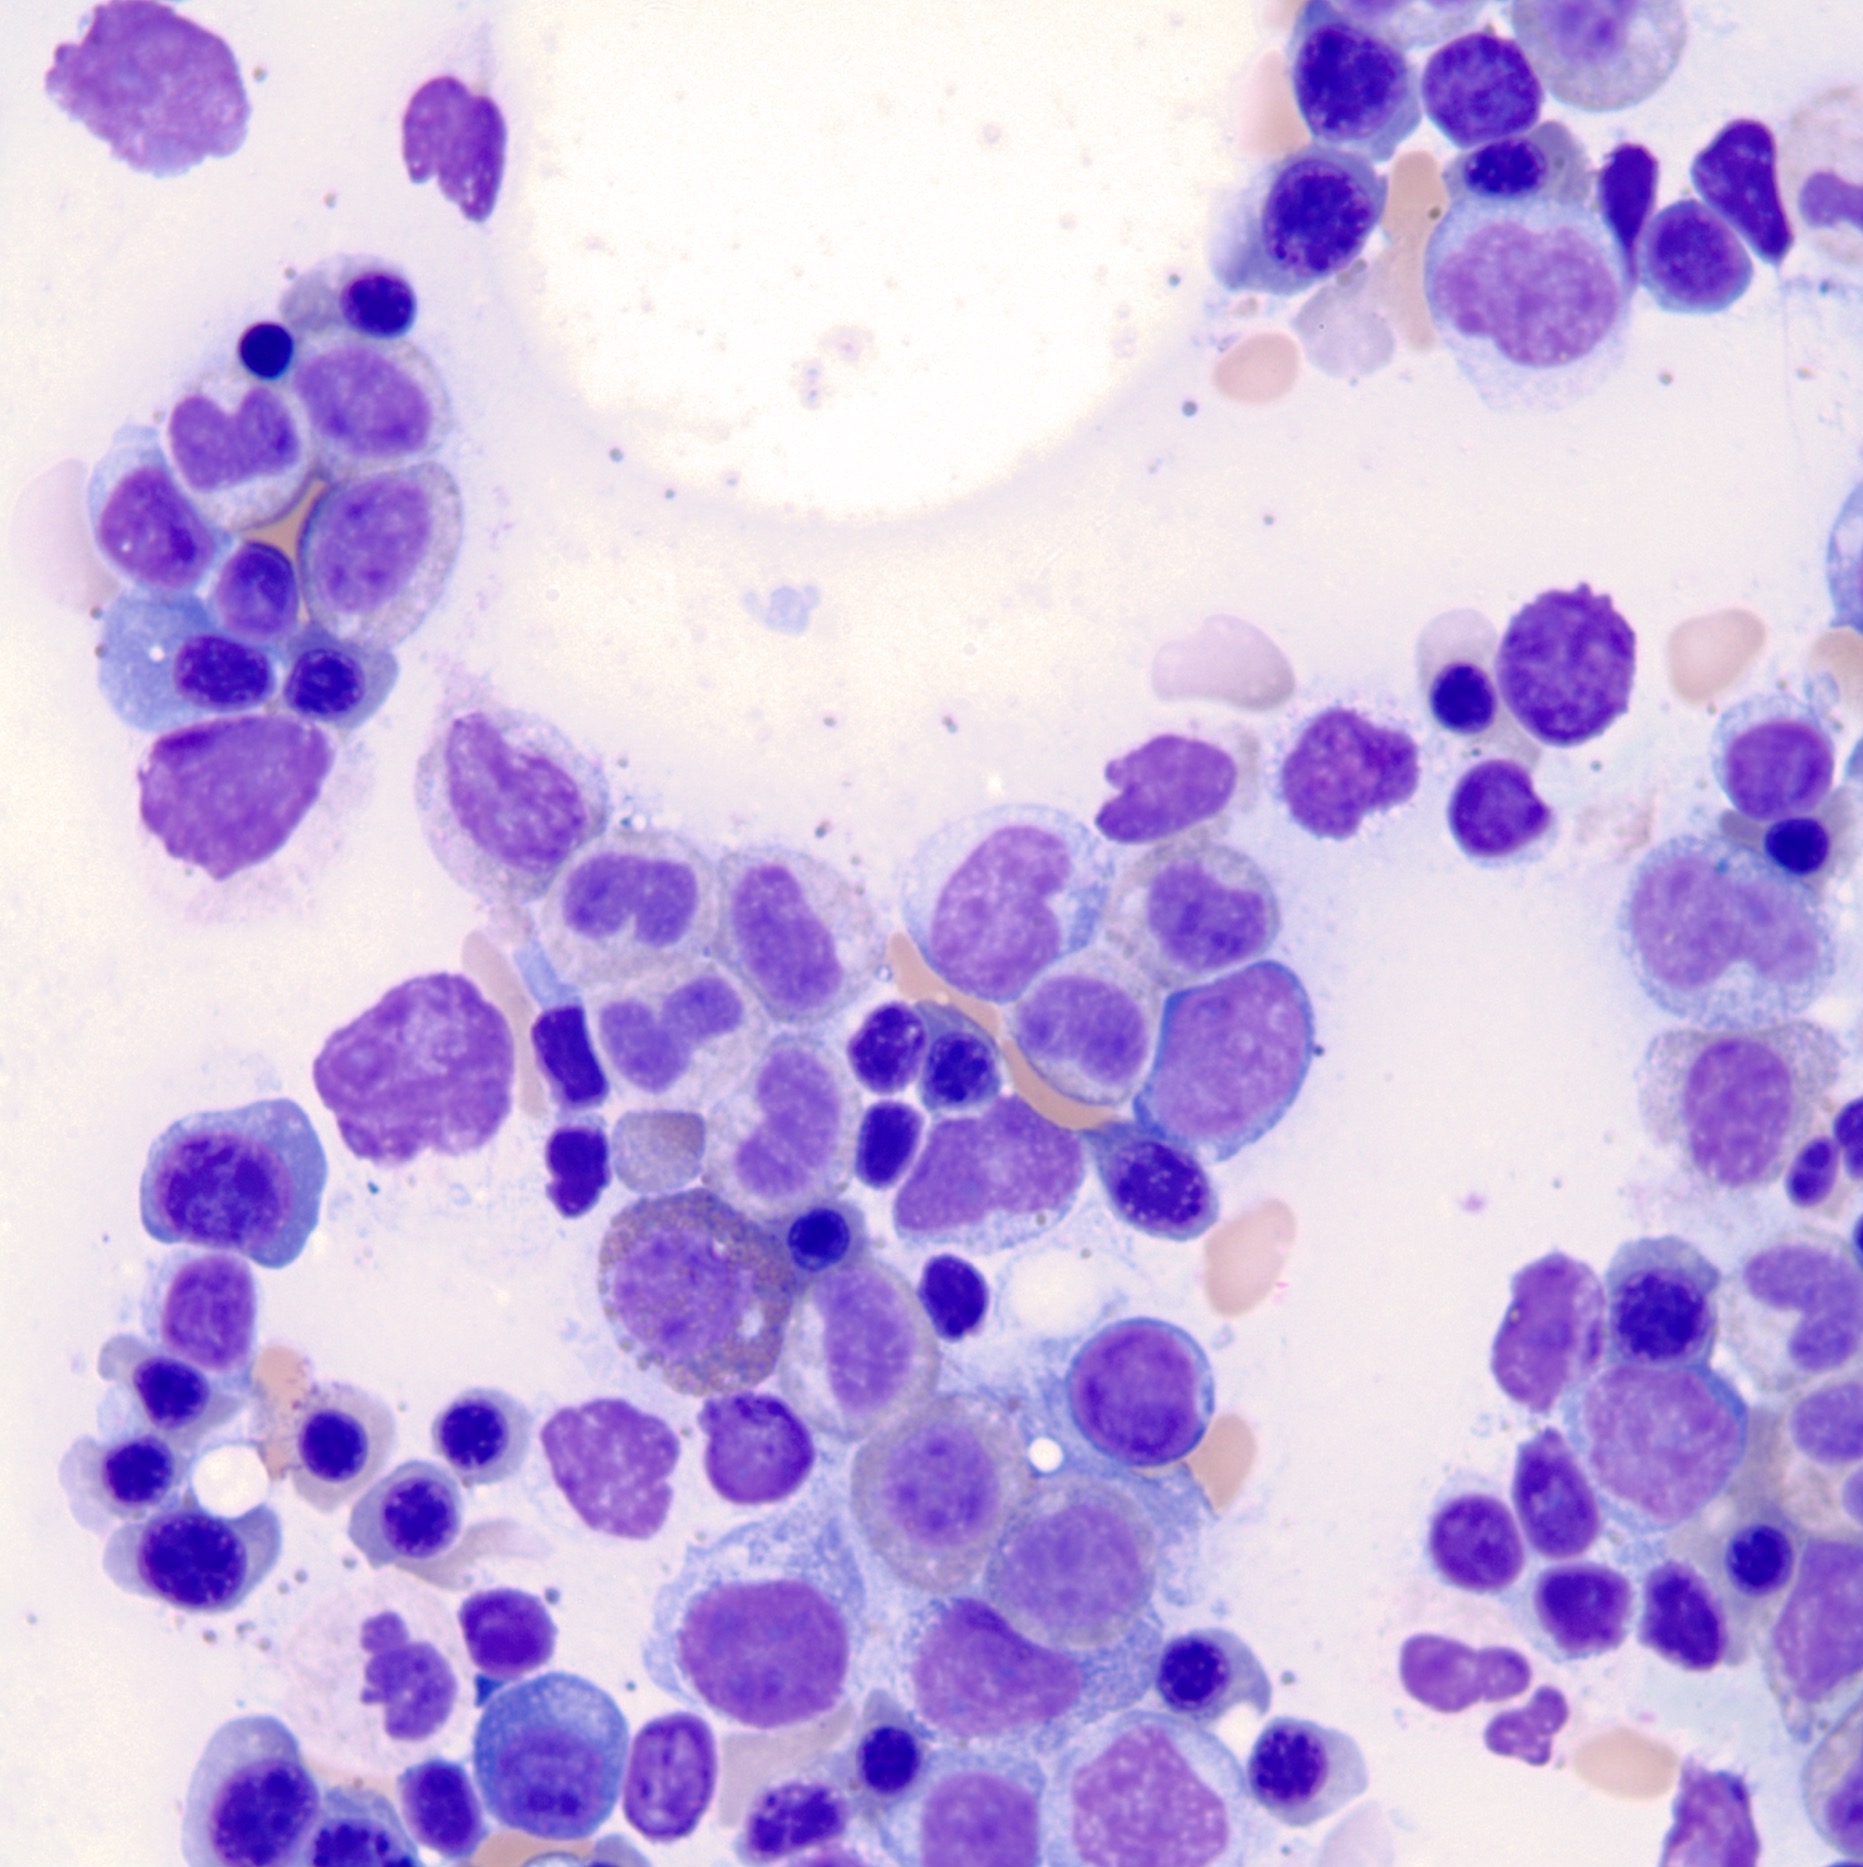
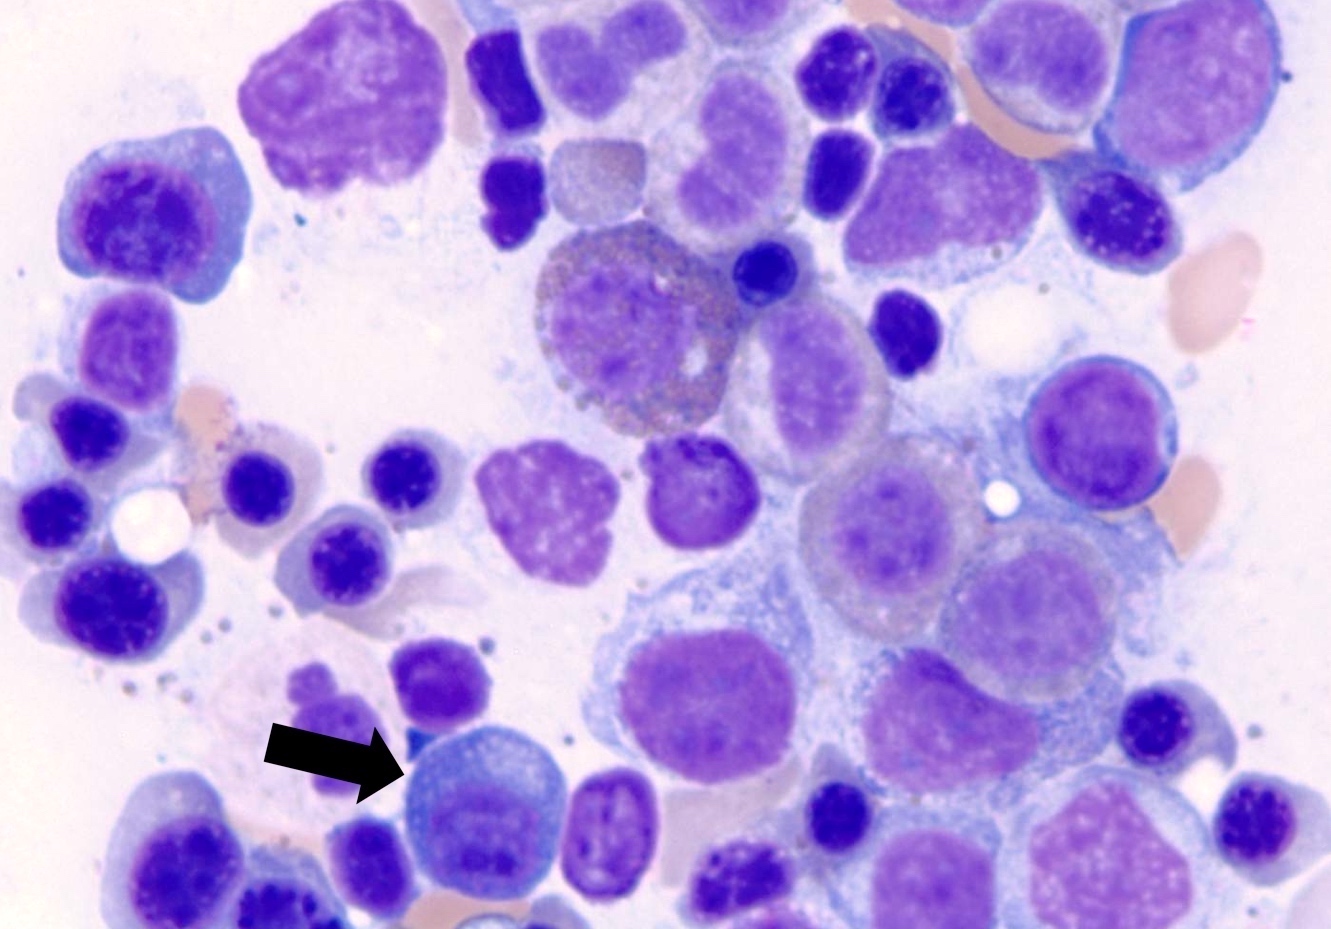
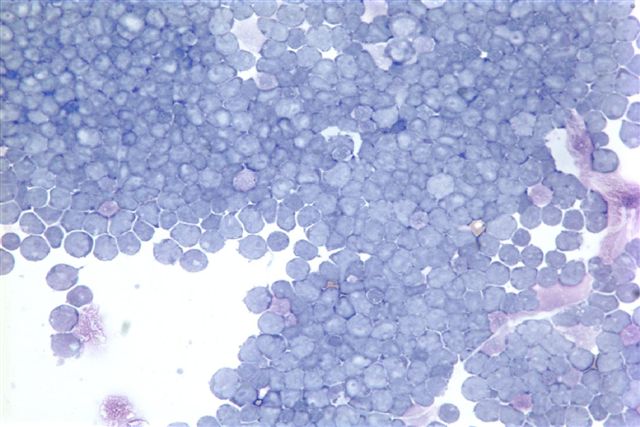
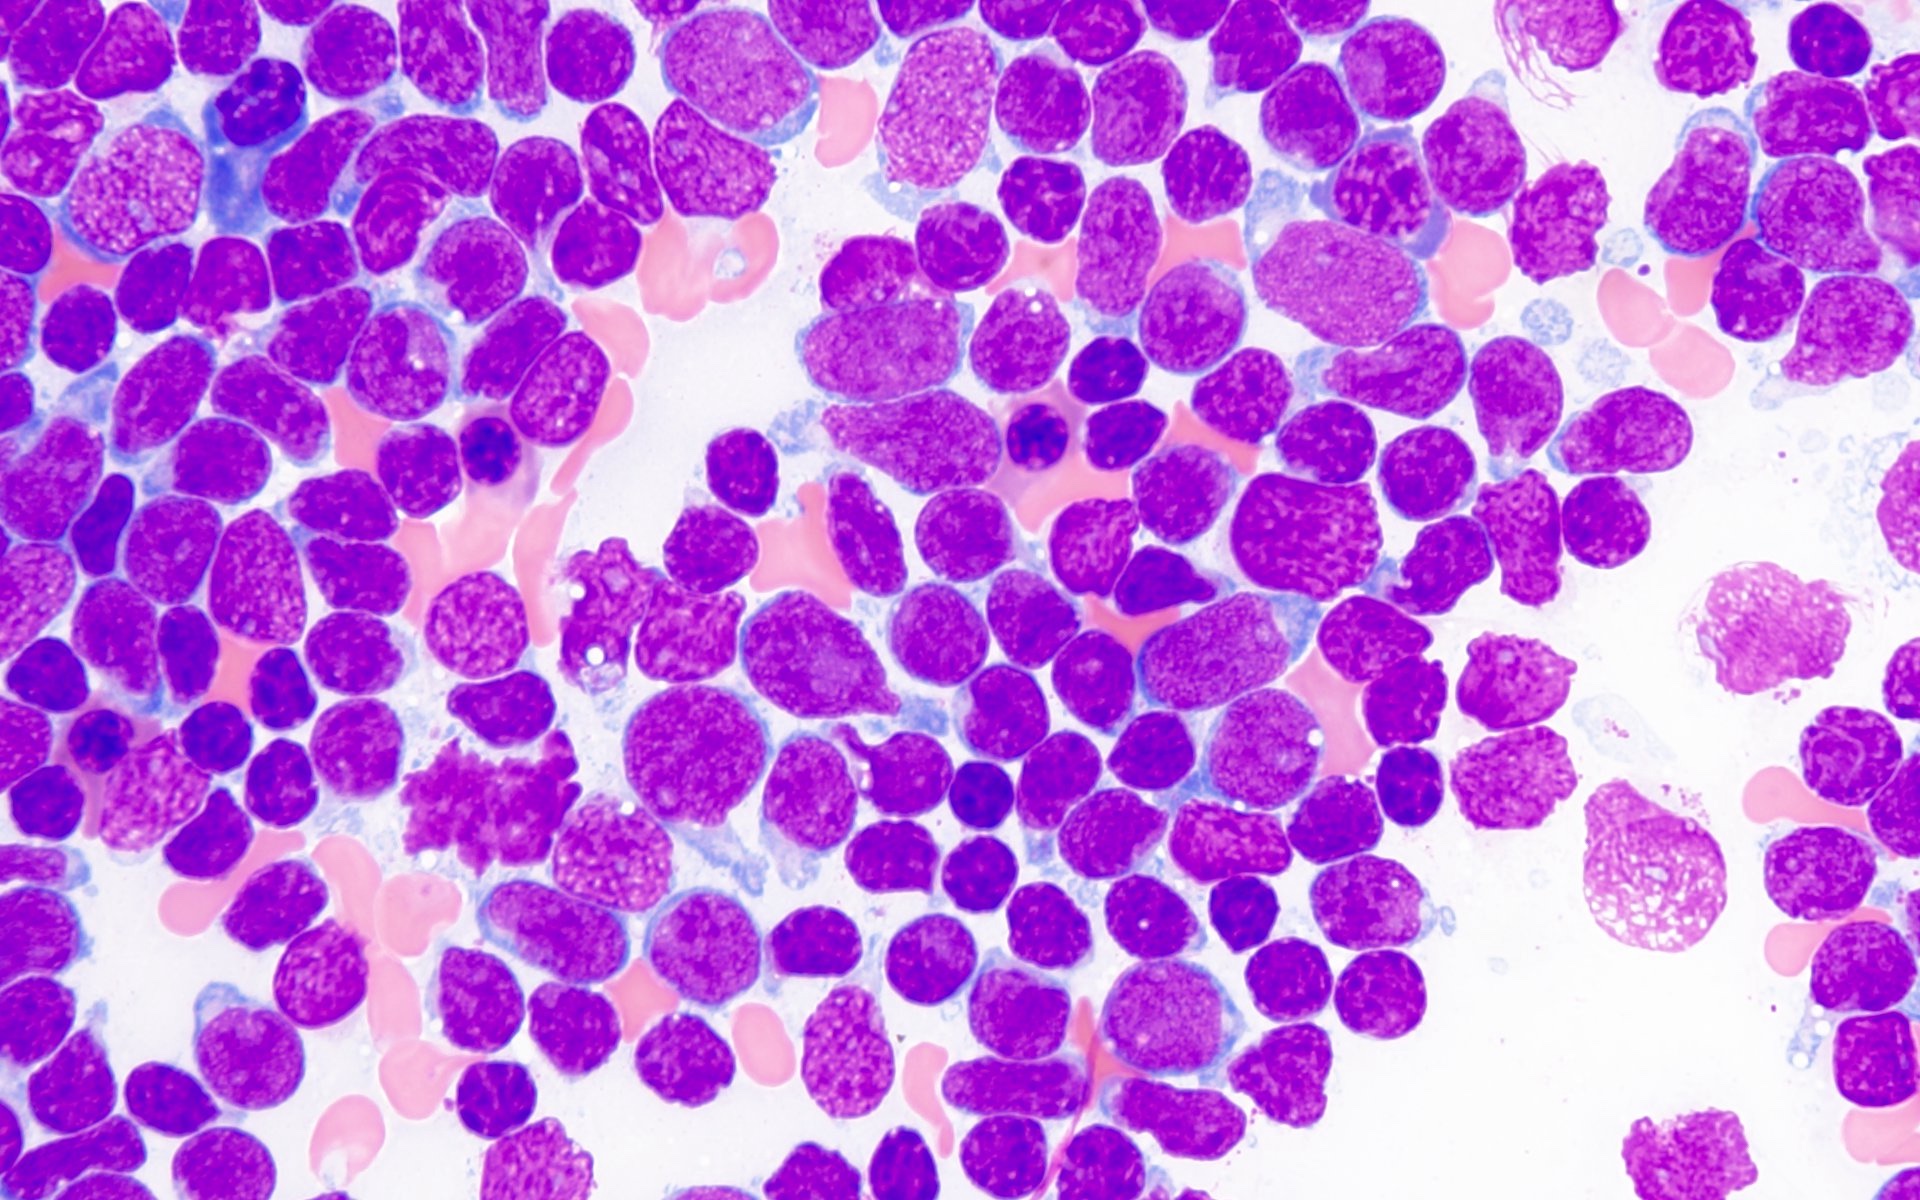
Bone marrow smear (Wright-Giemsa)
Contributed by Huifei Liu, M.D., Ph.D.
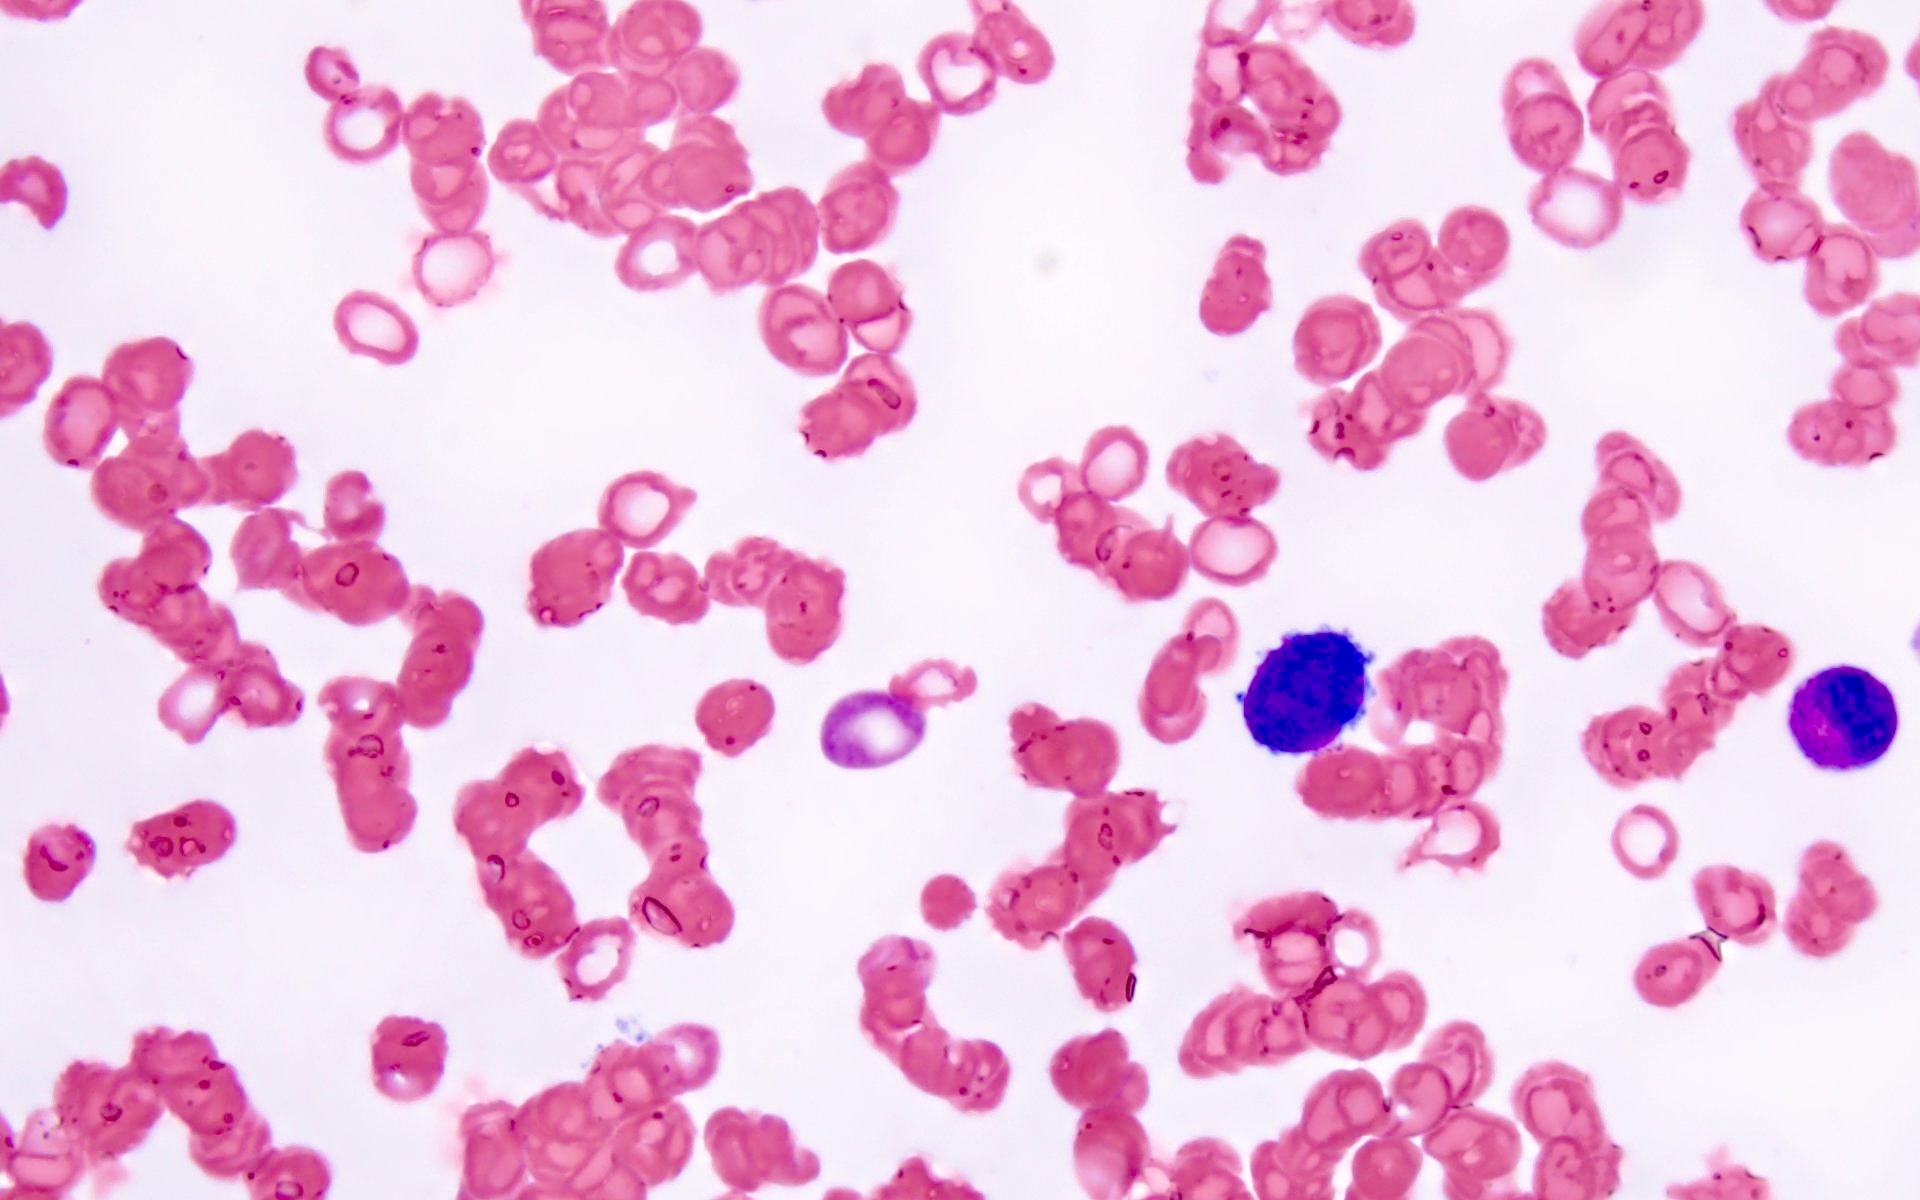
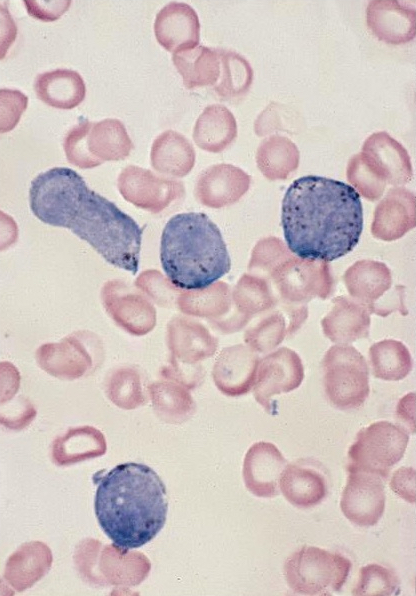
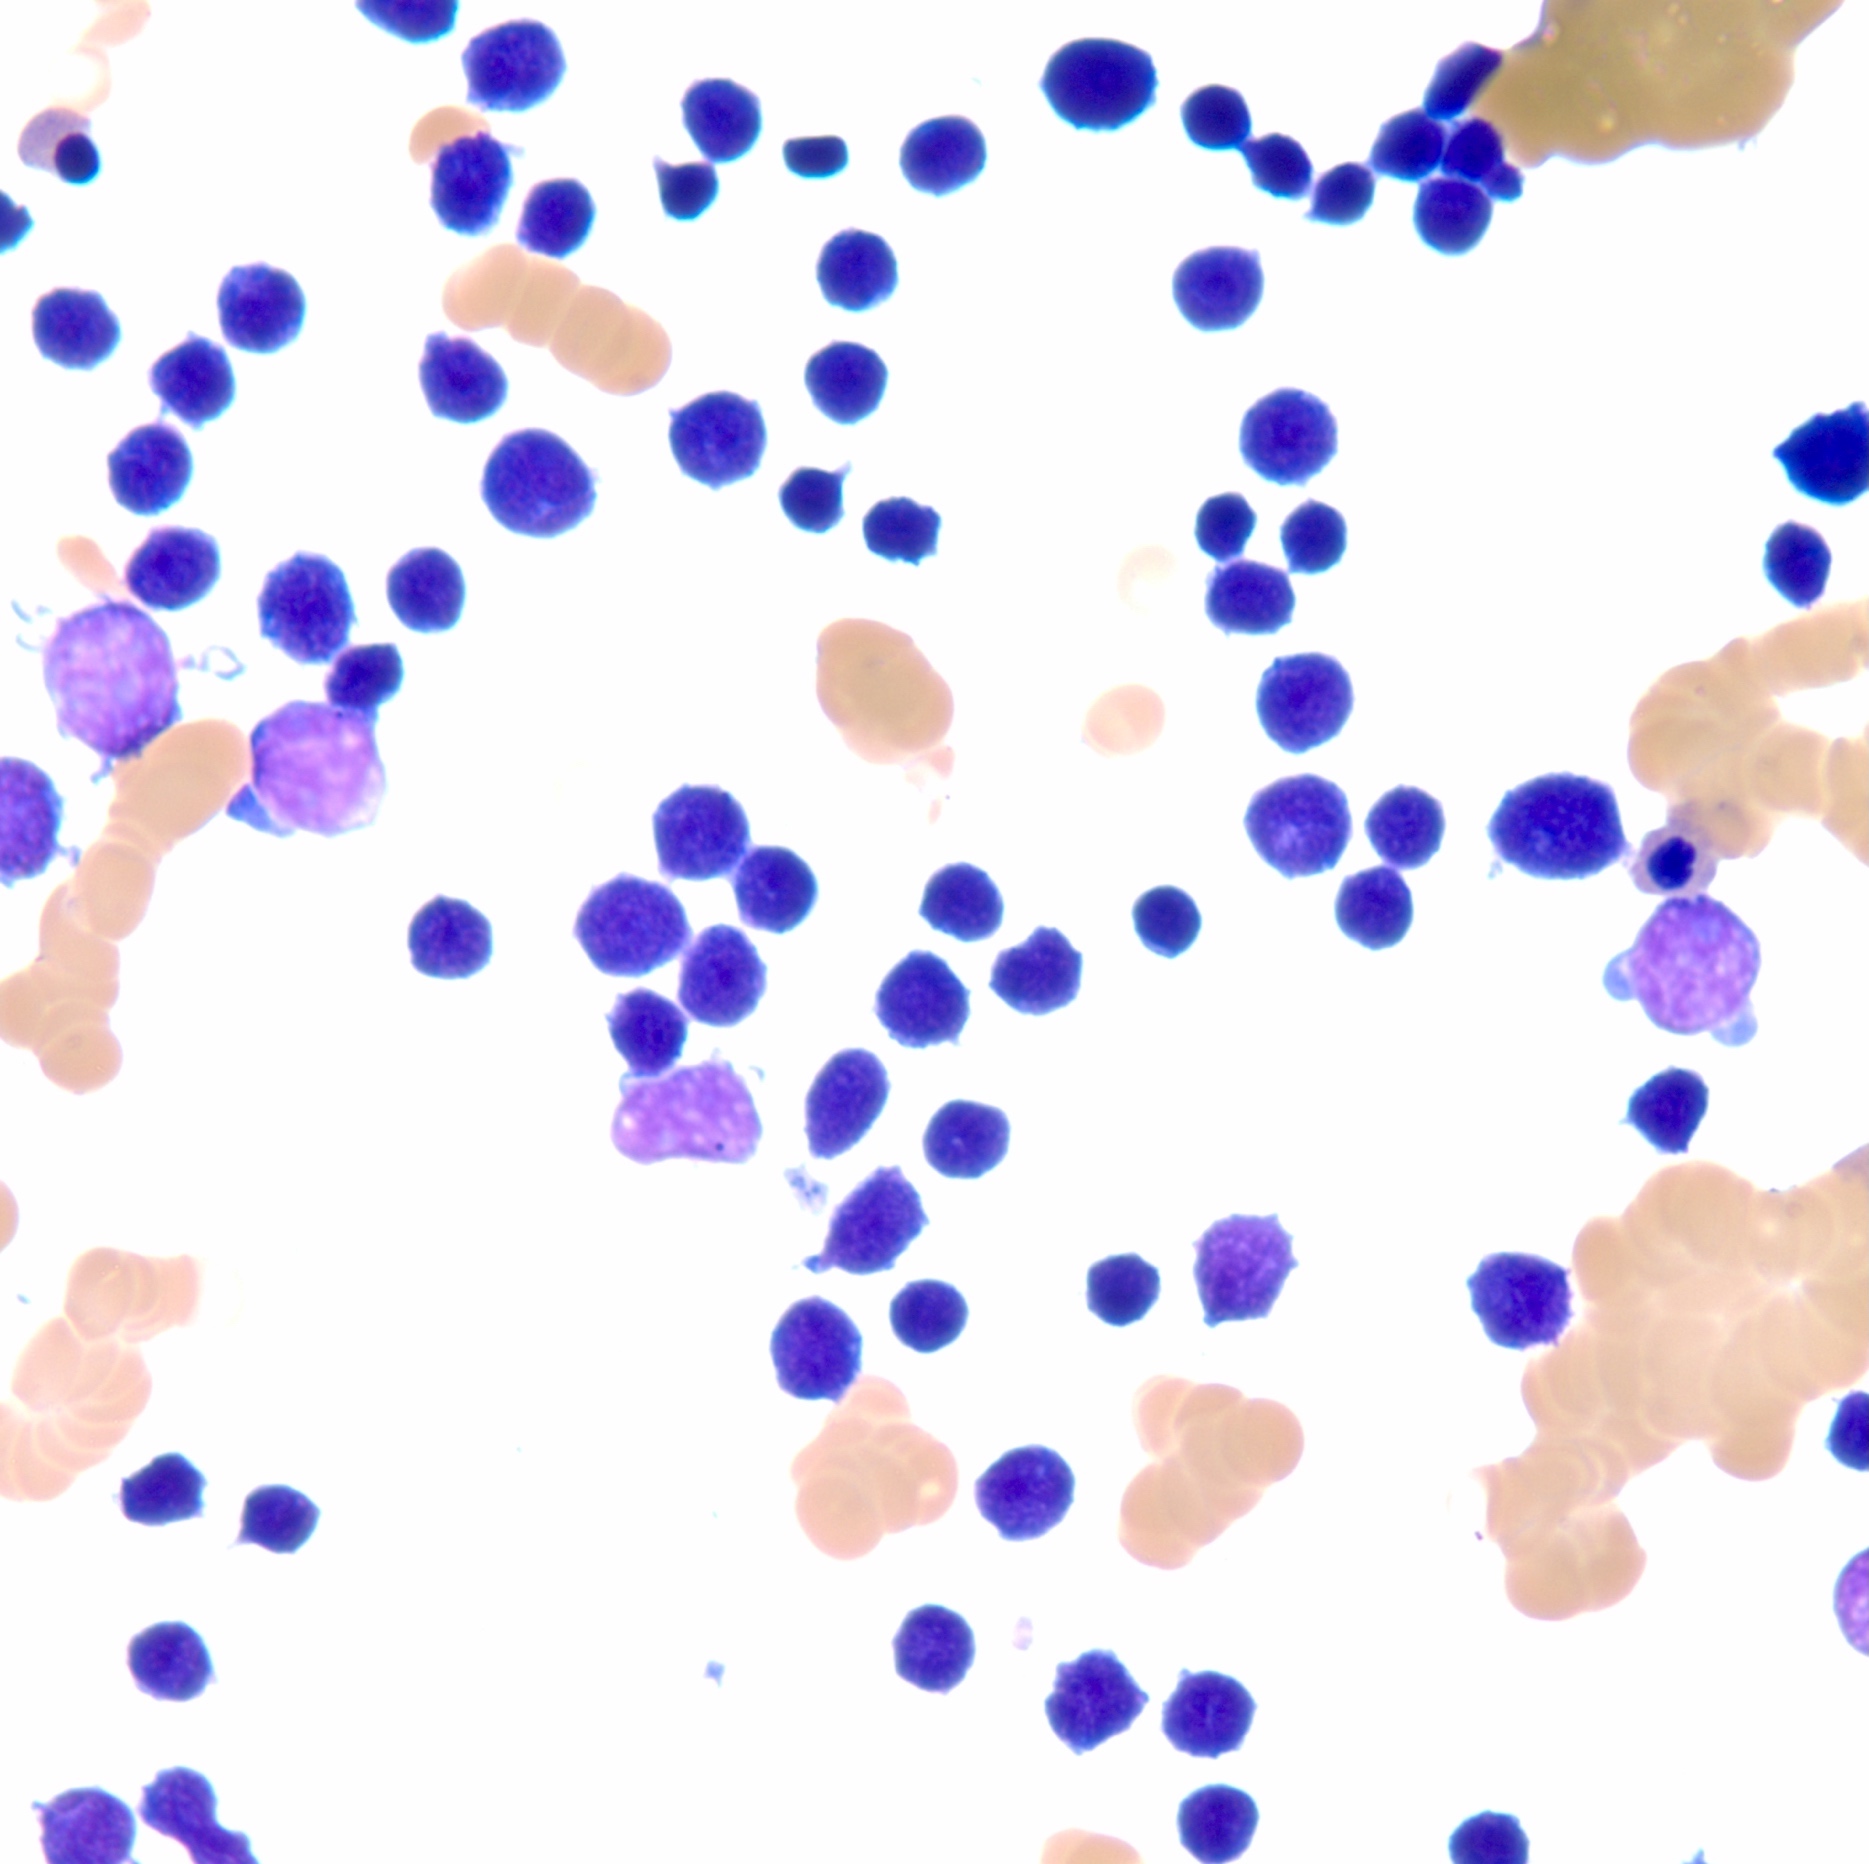
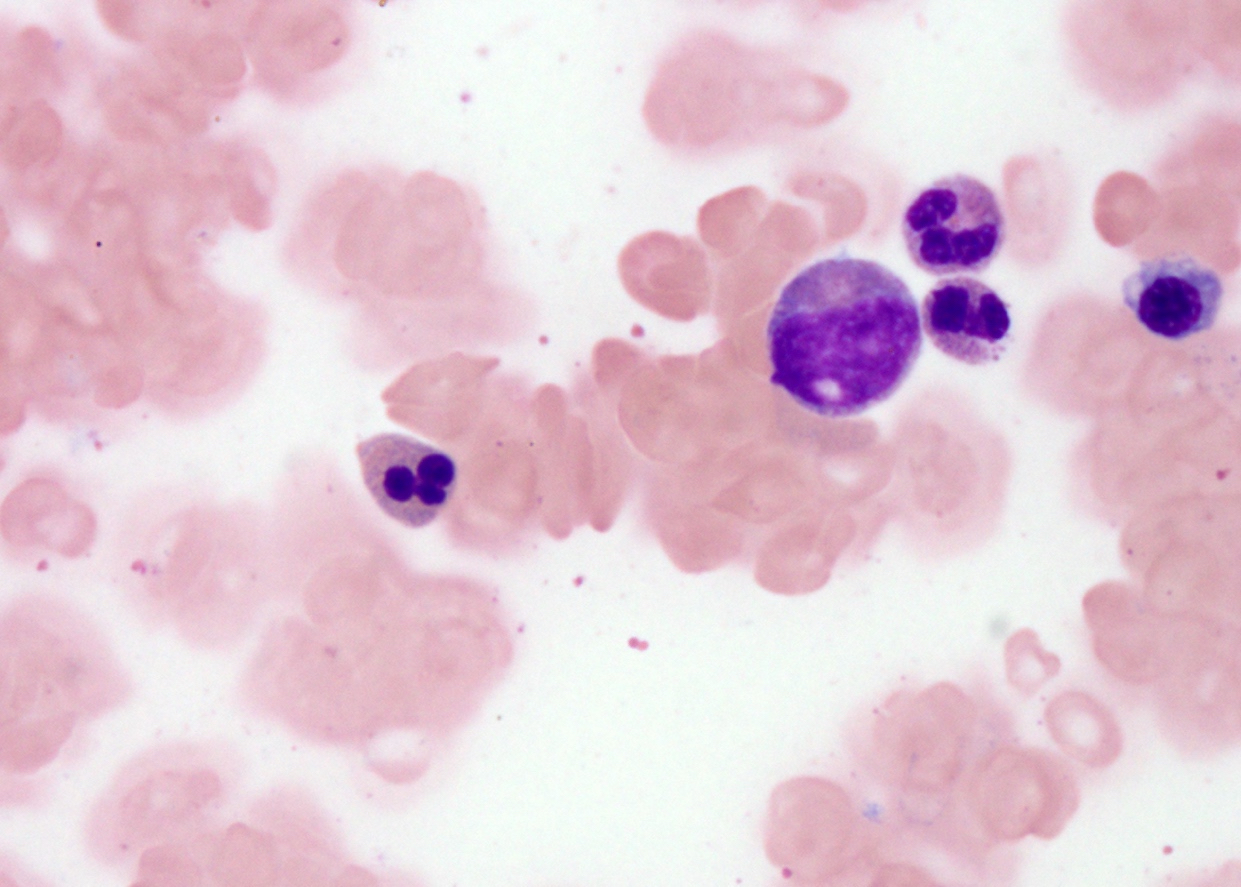
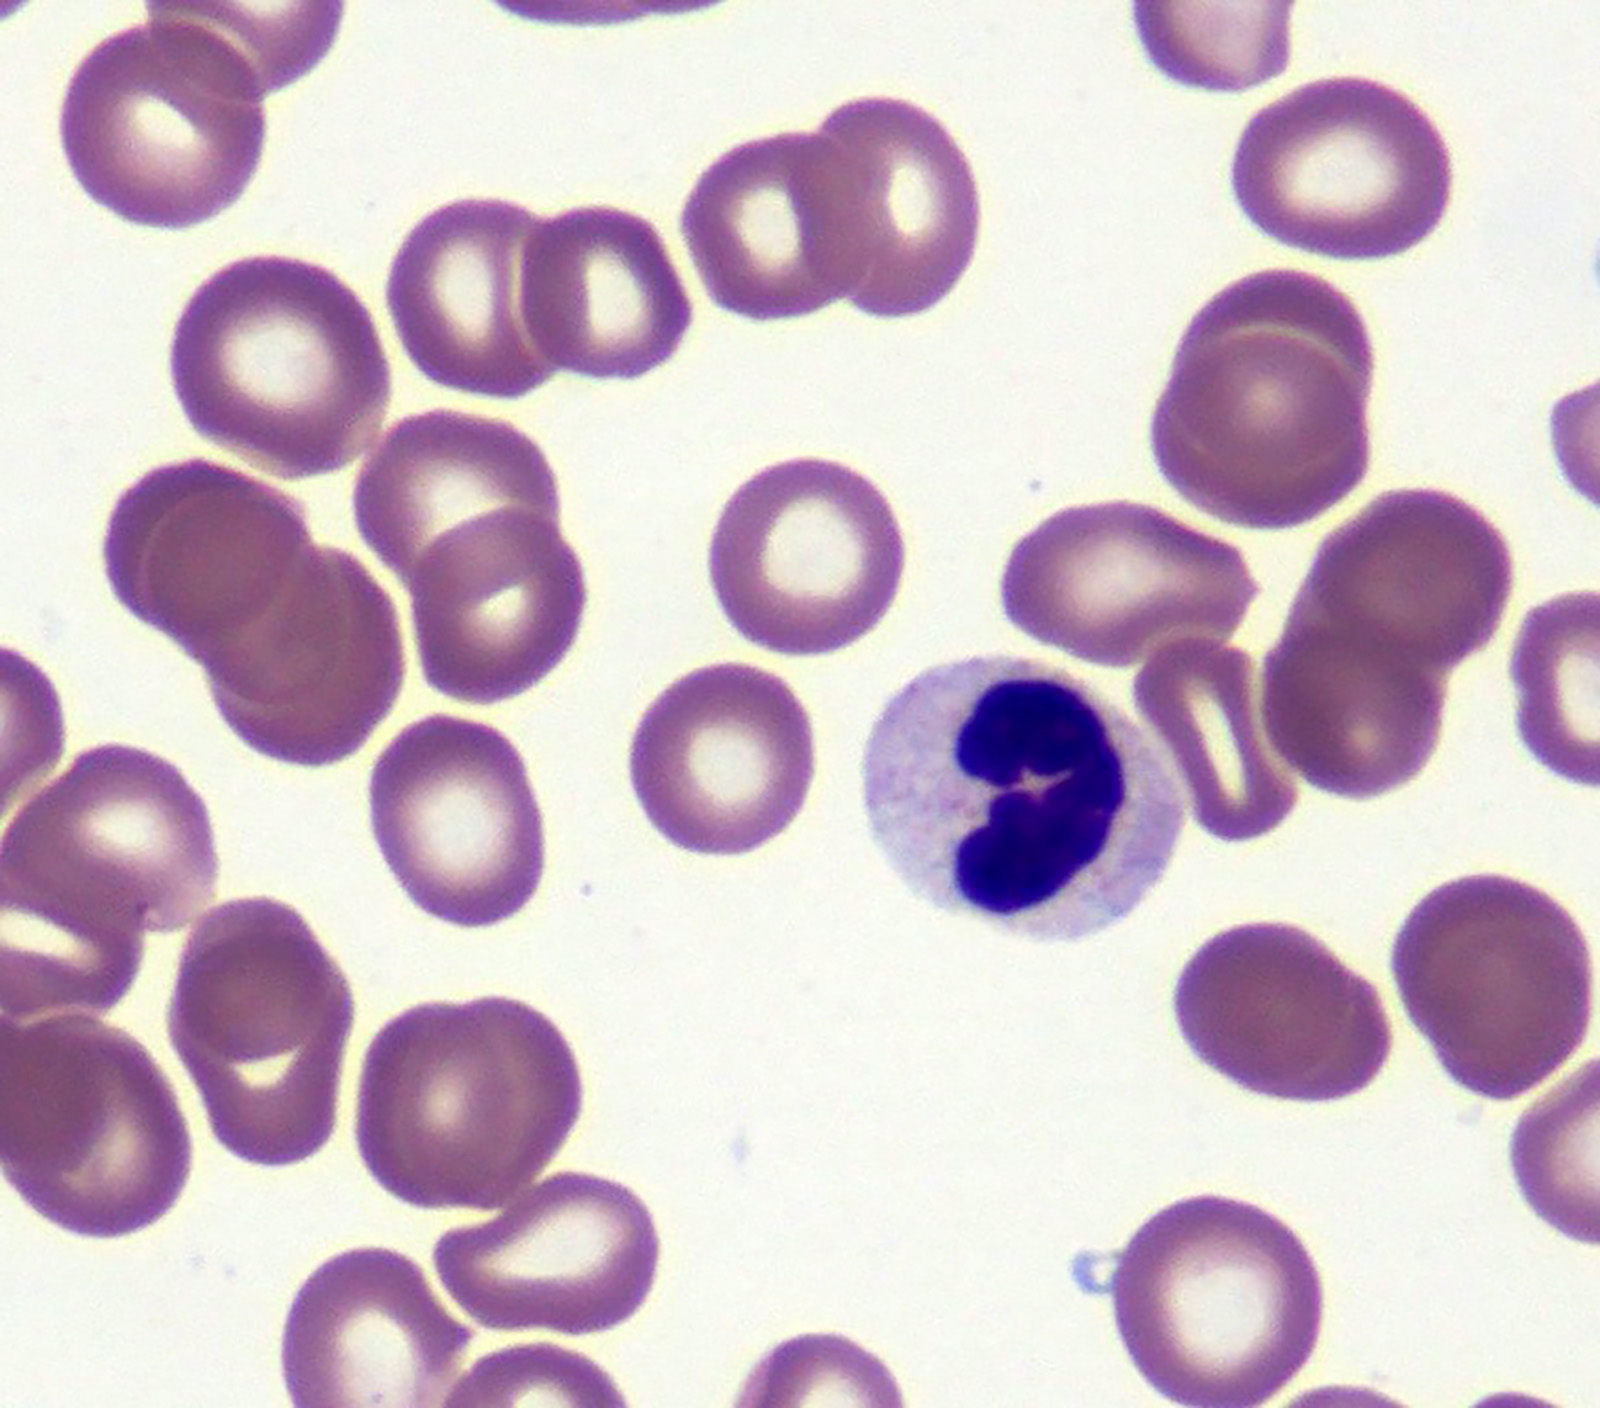
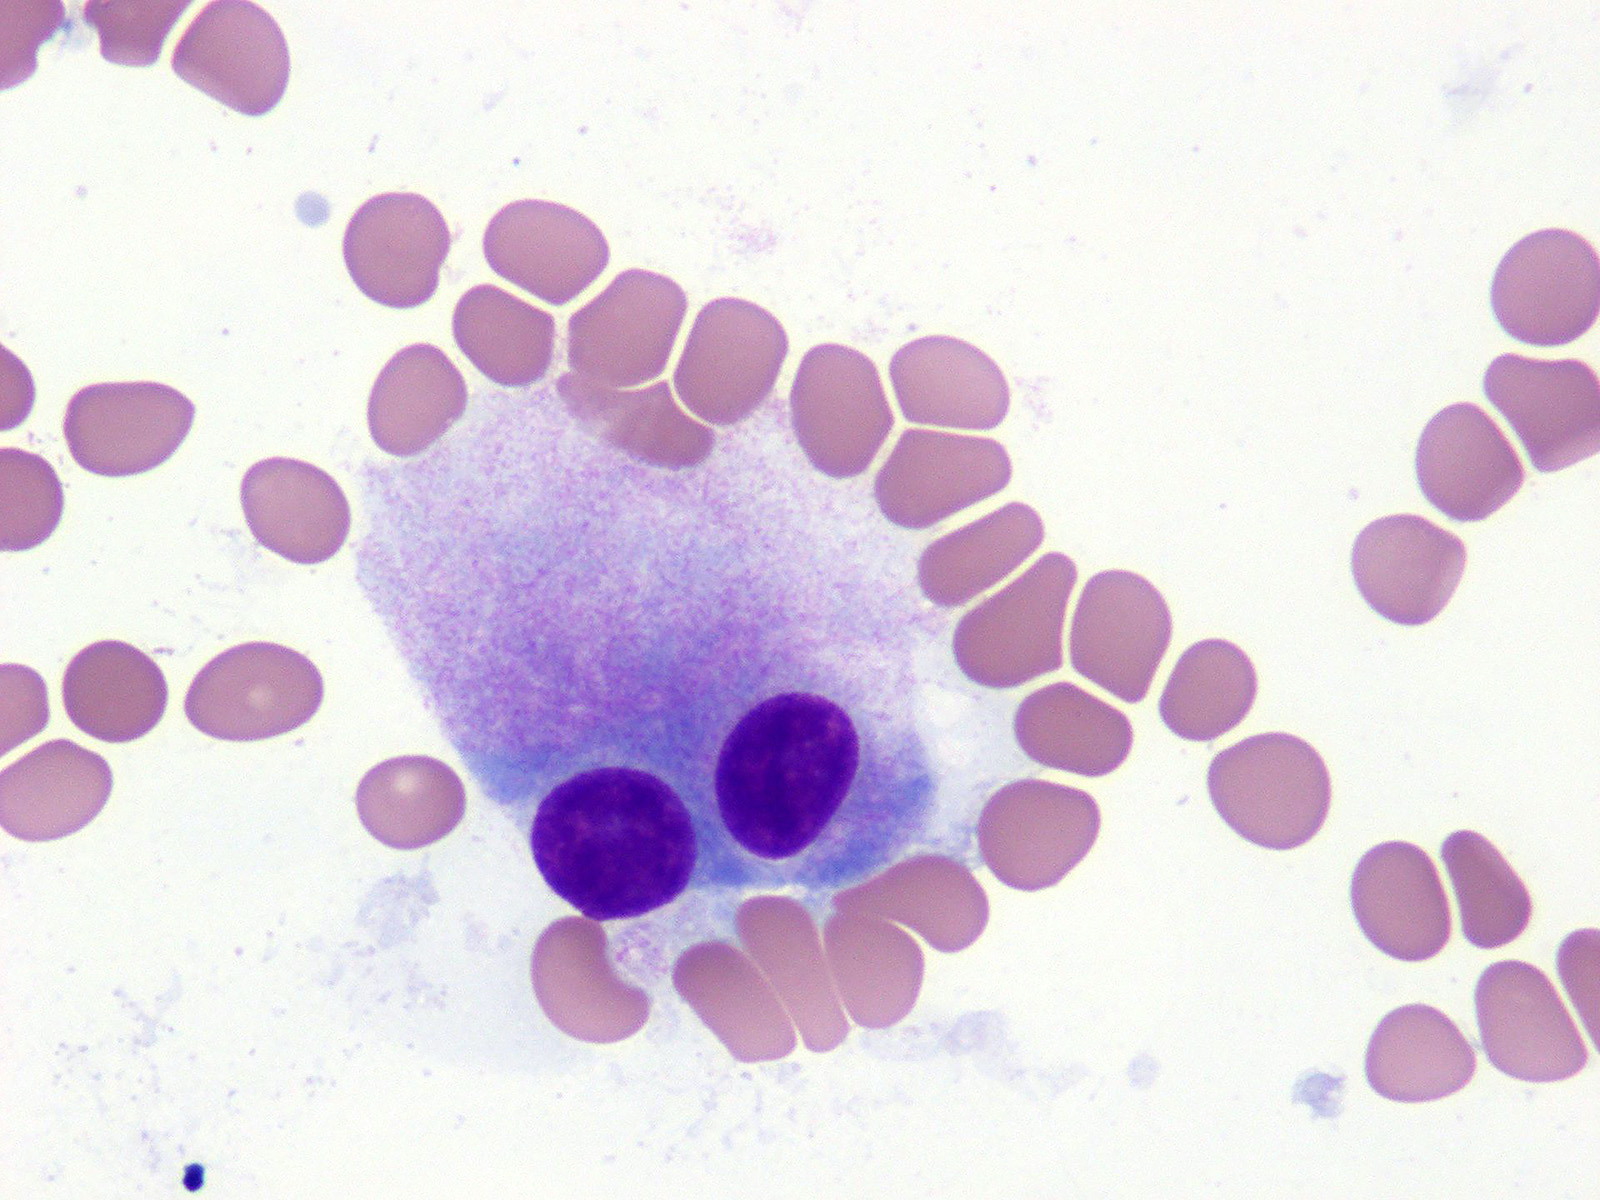
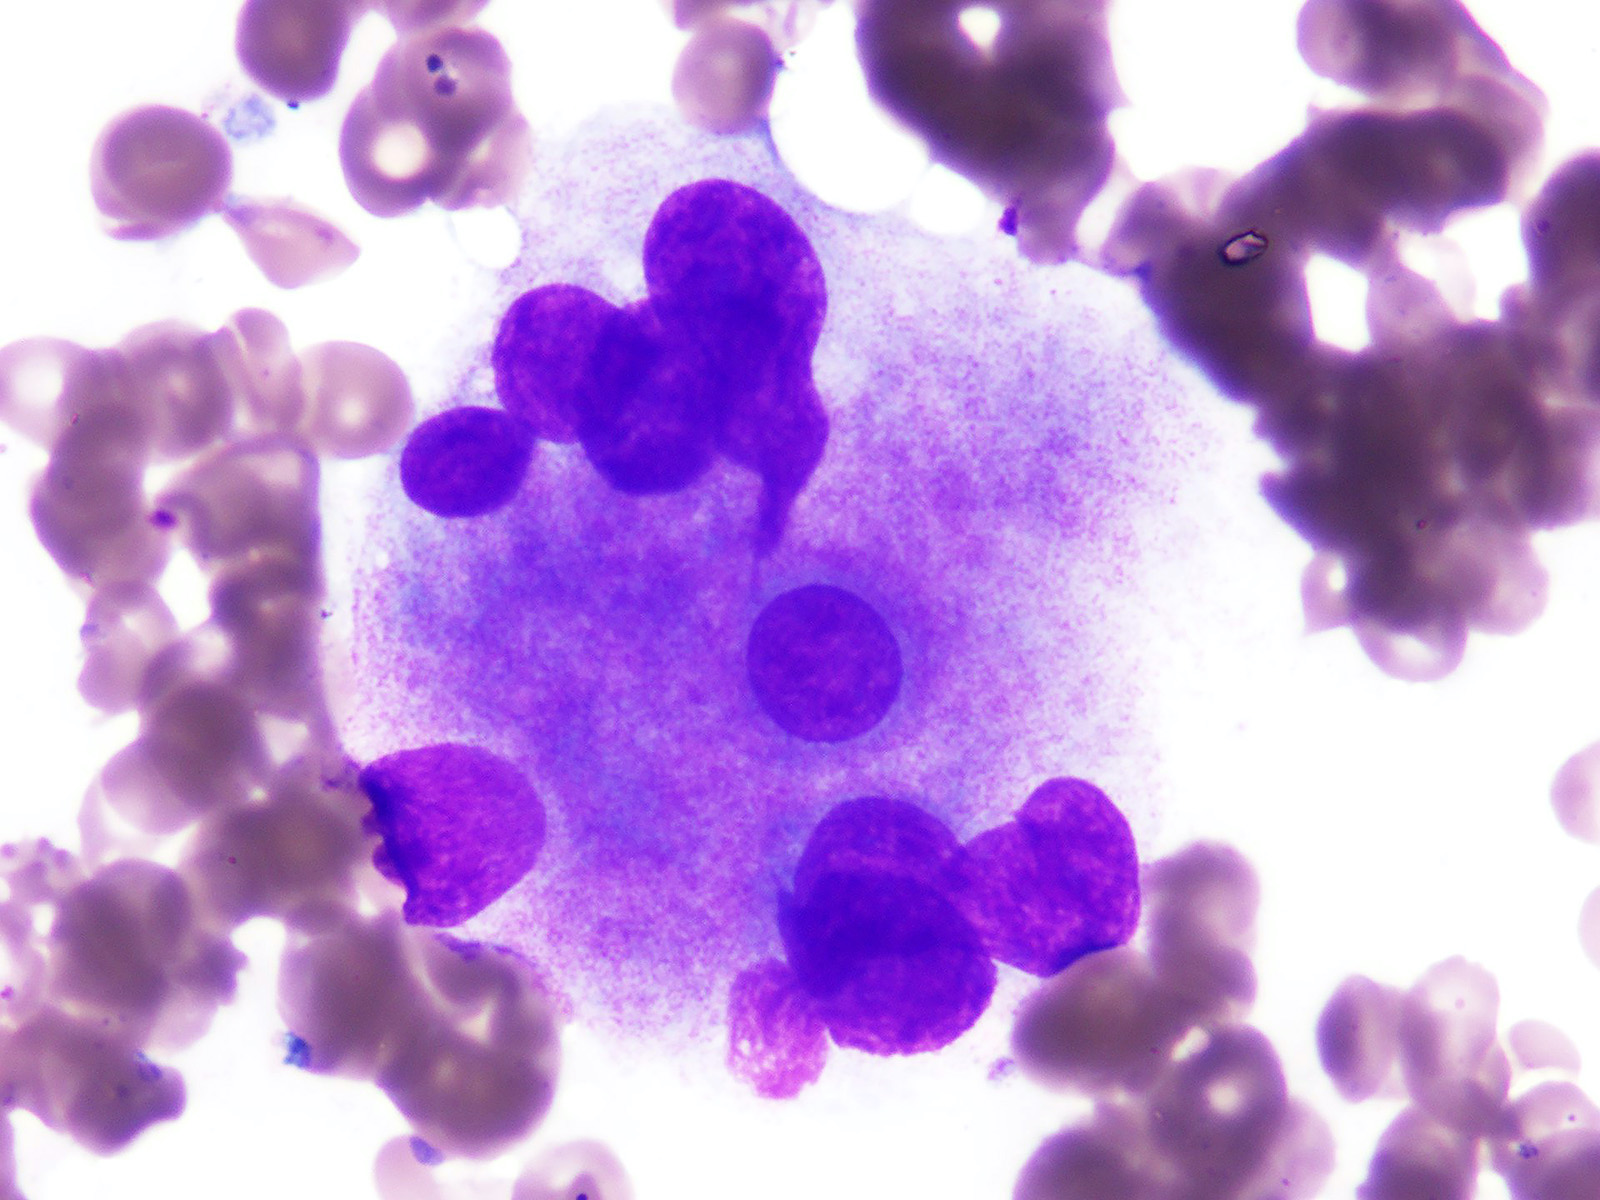
CSF erythroblasts
Contributed by Huifei Liu, M.D., Ph.D.
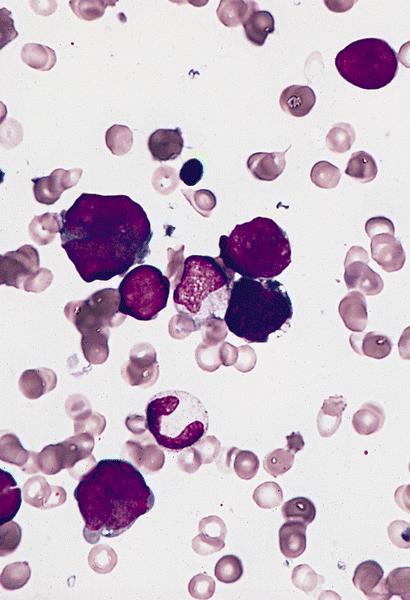
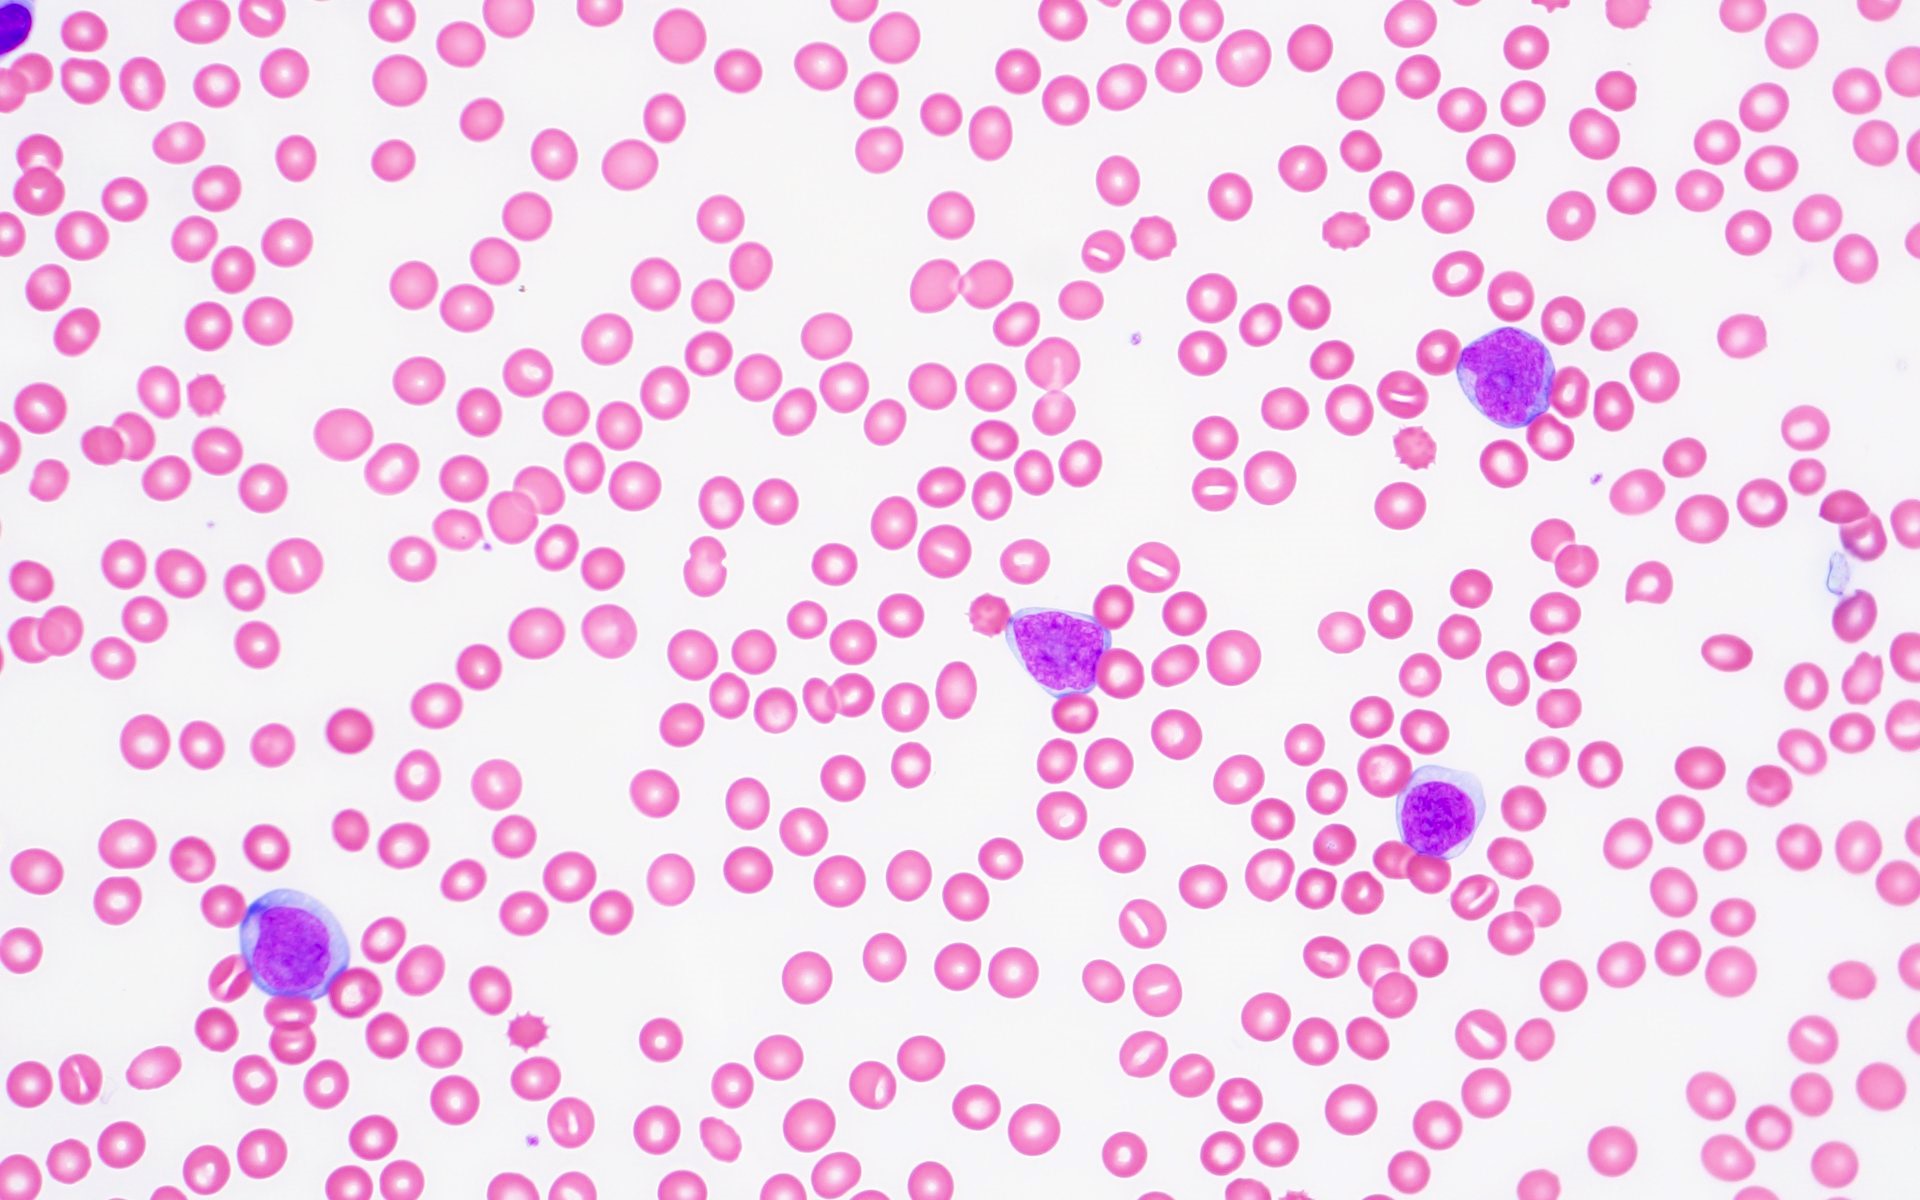
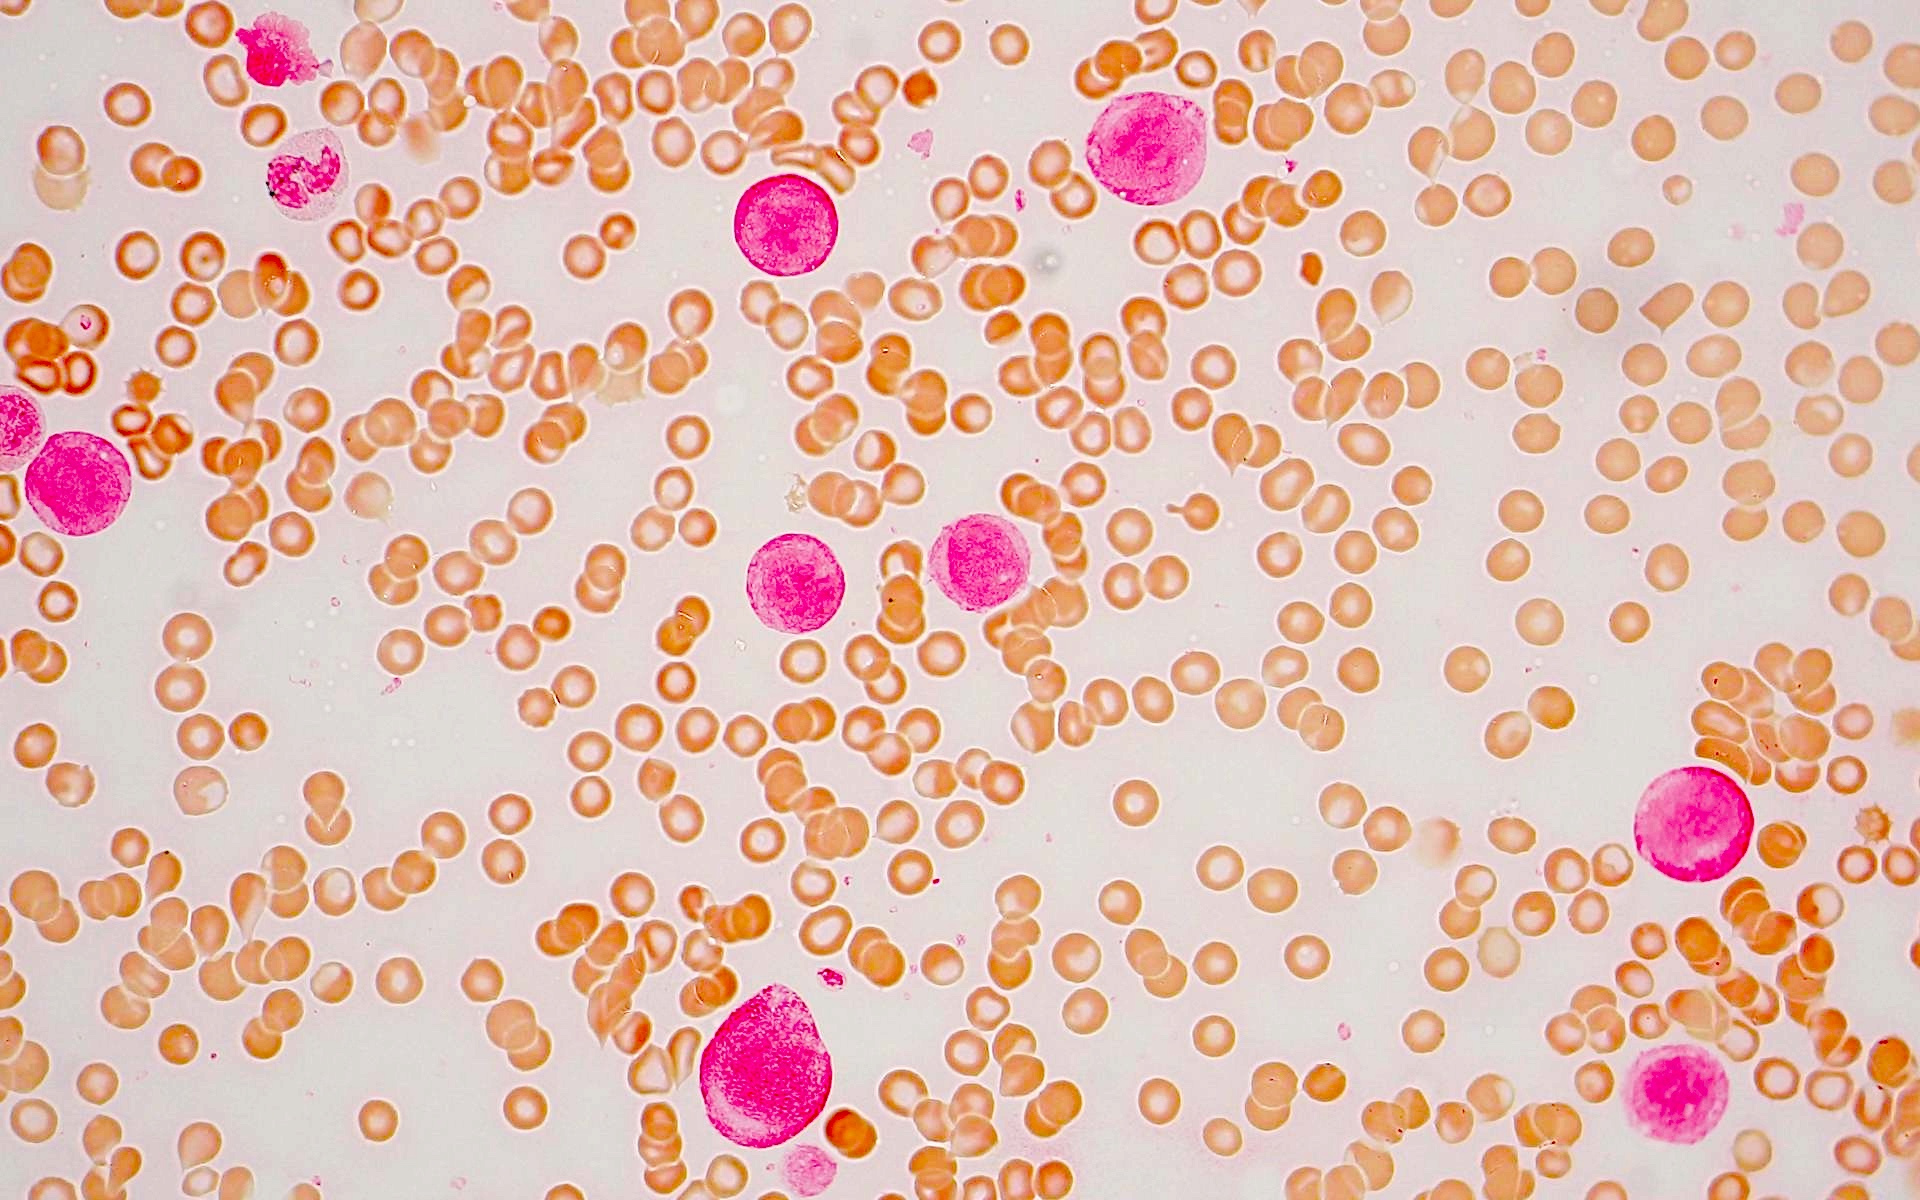
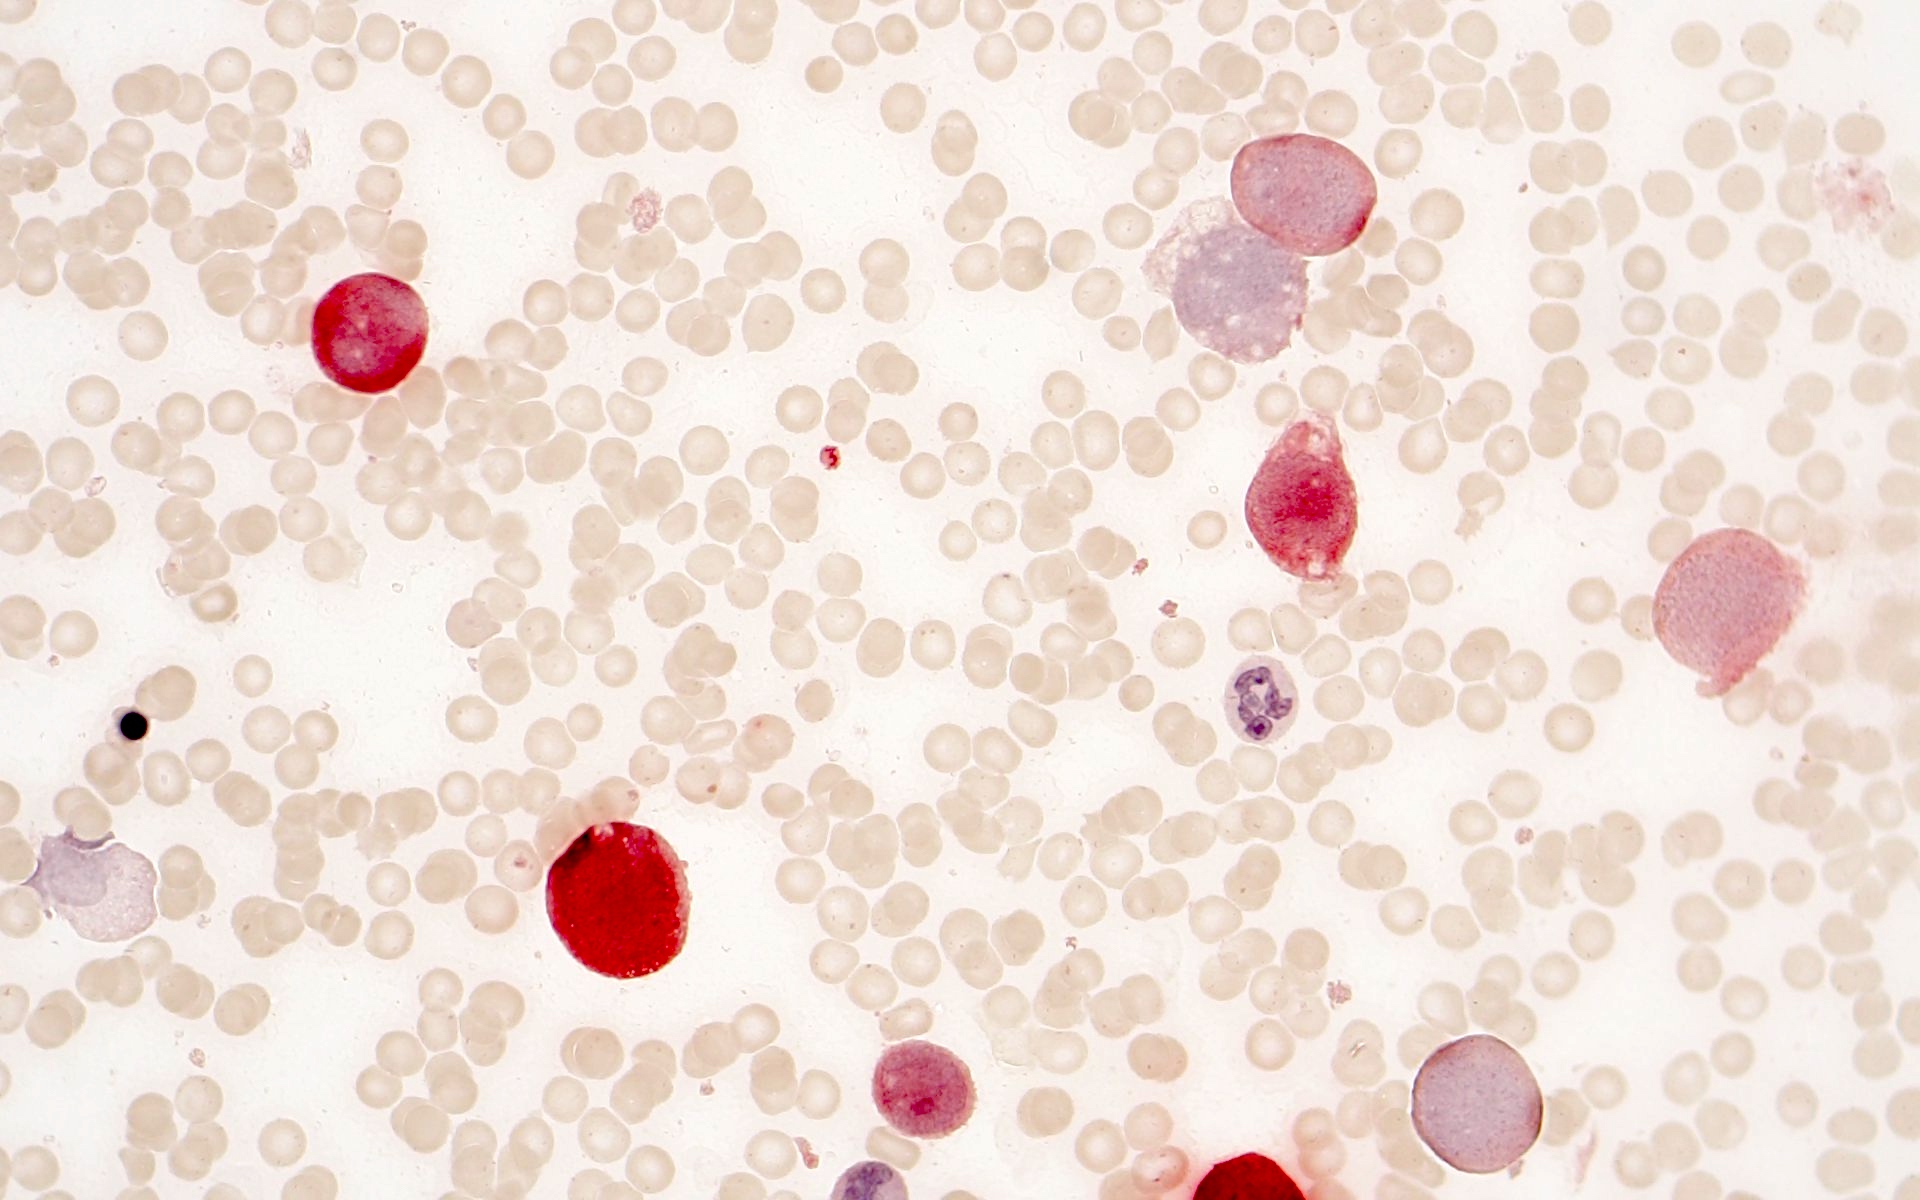
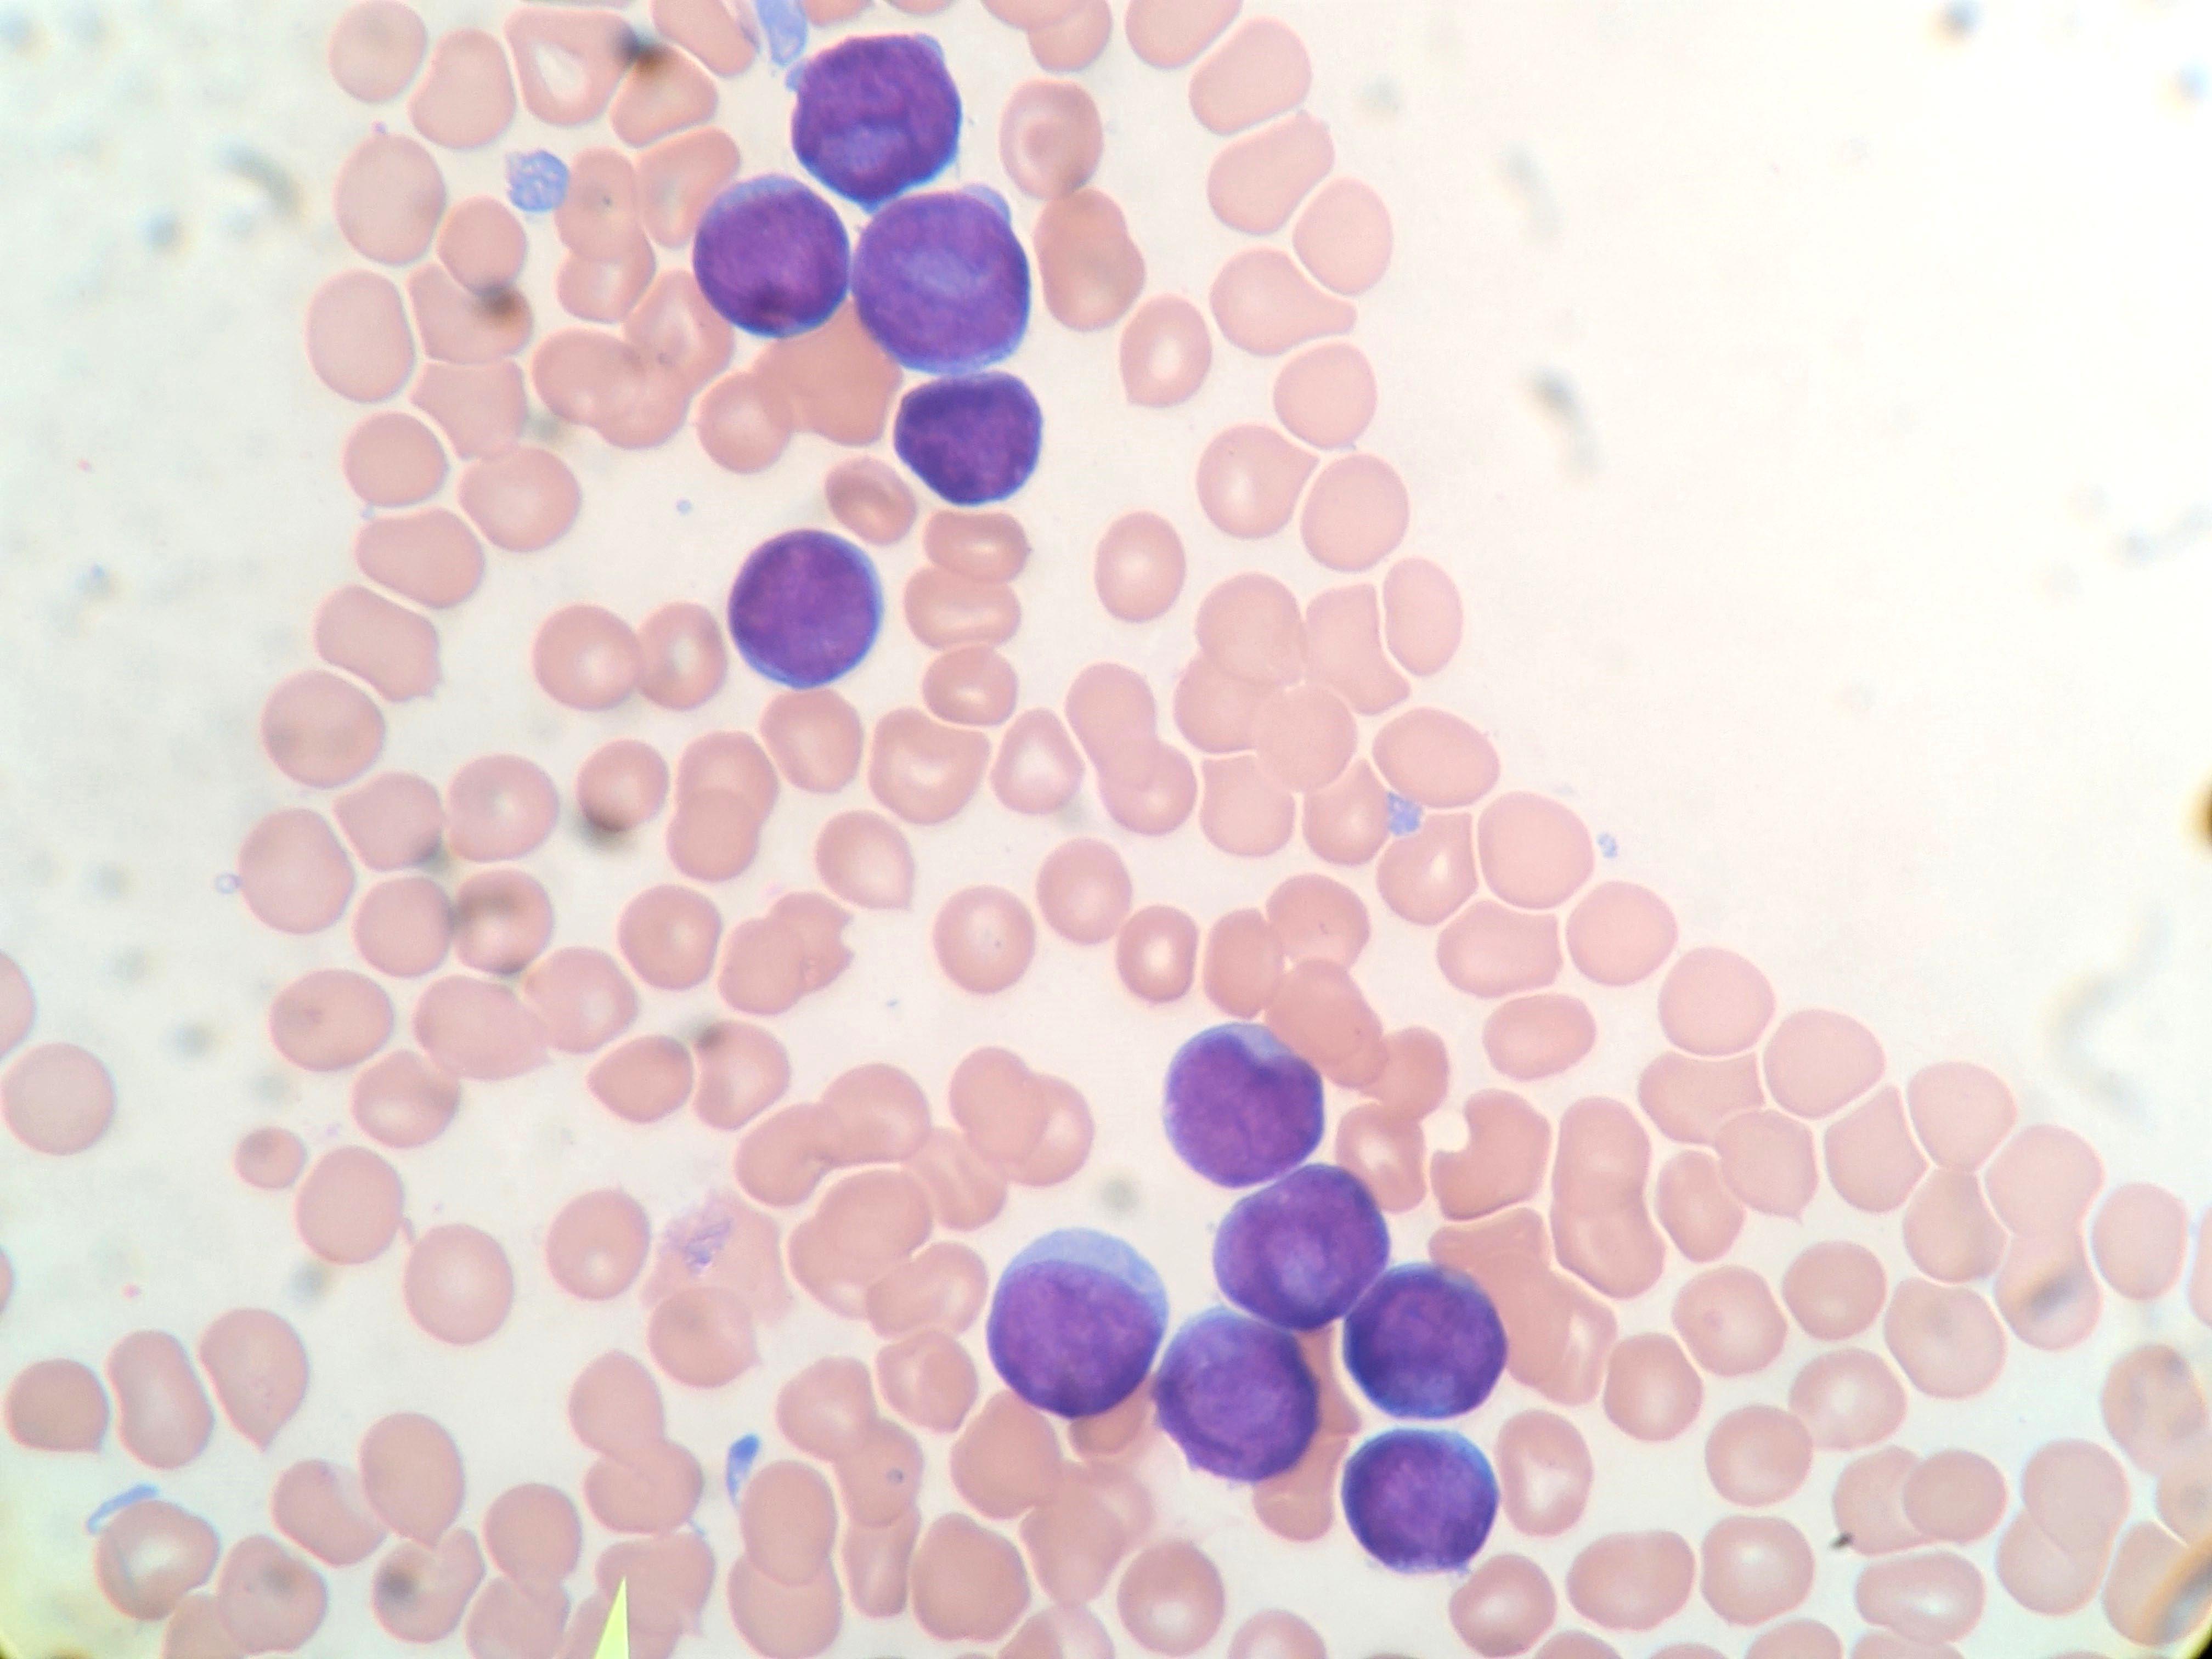
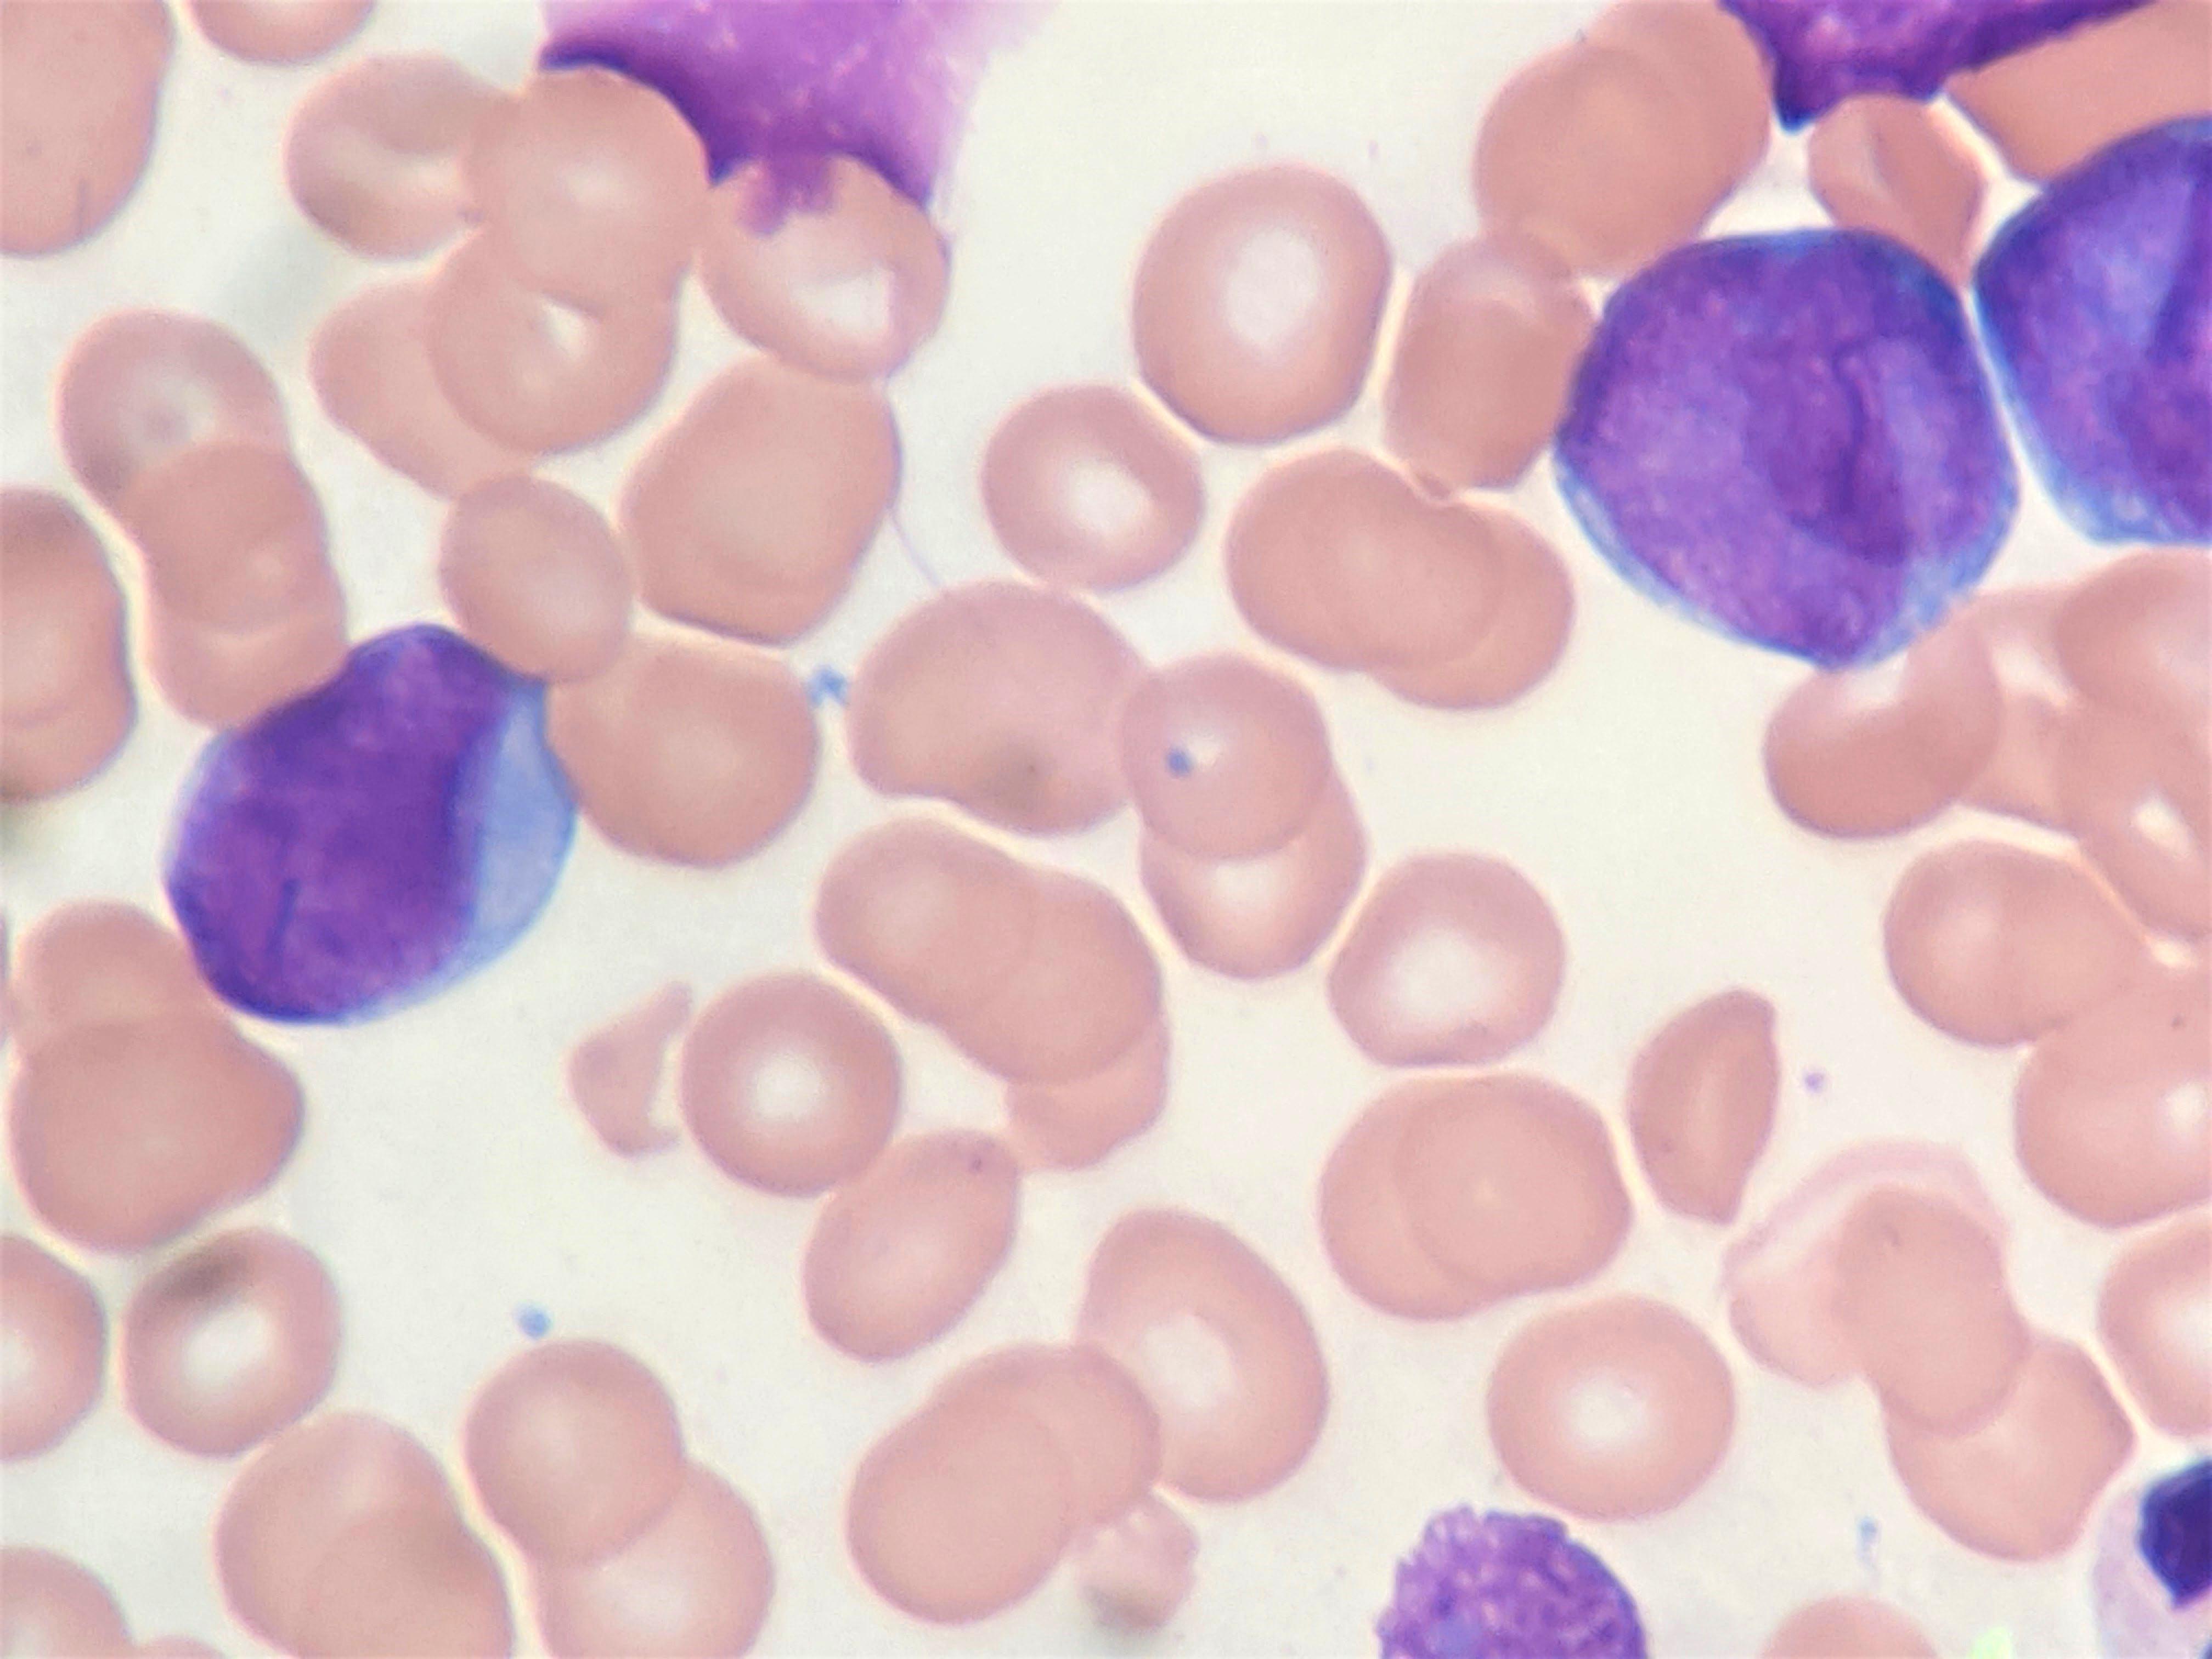
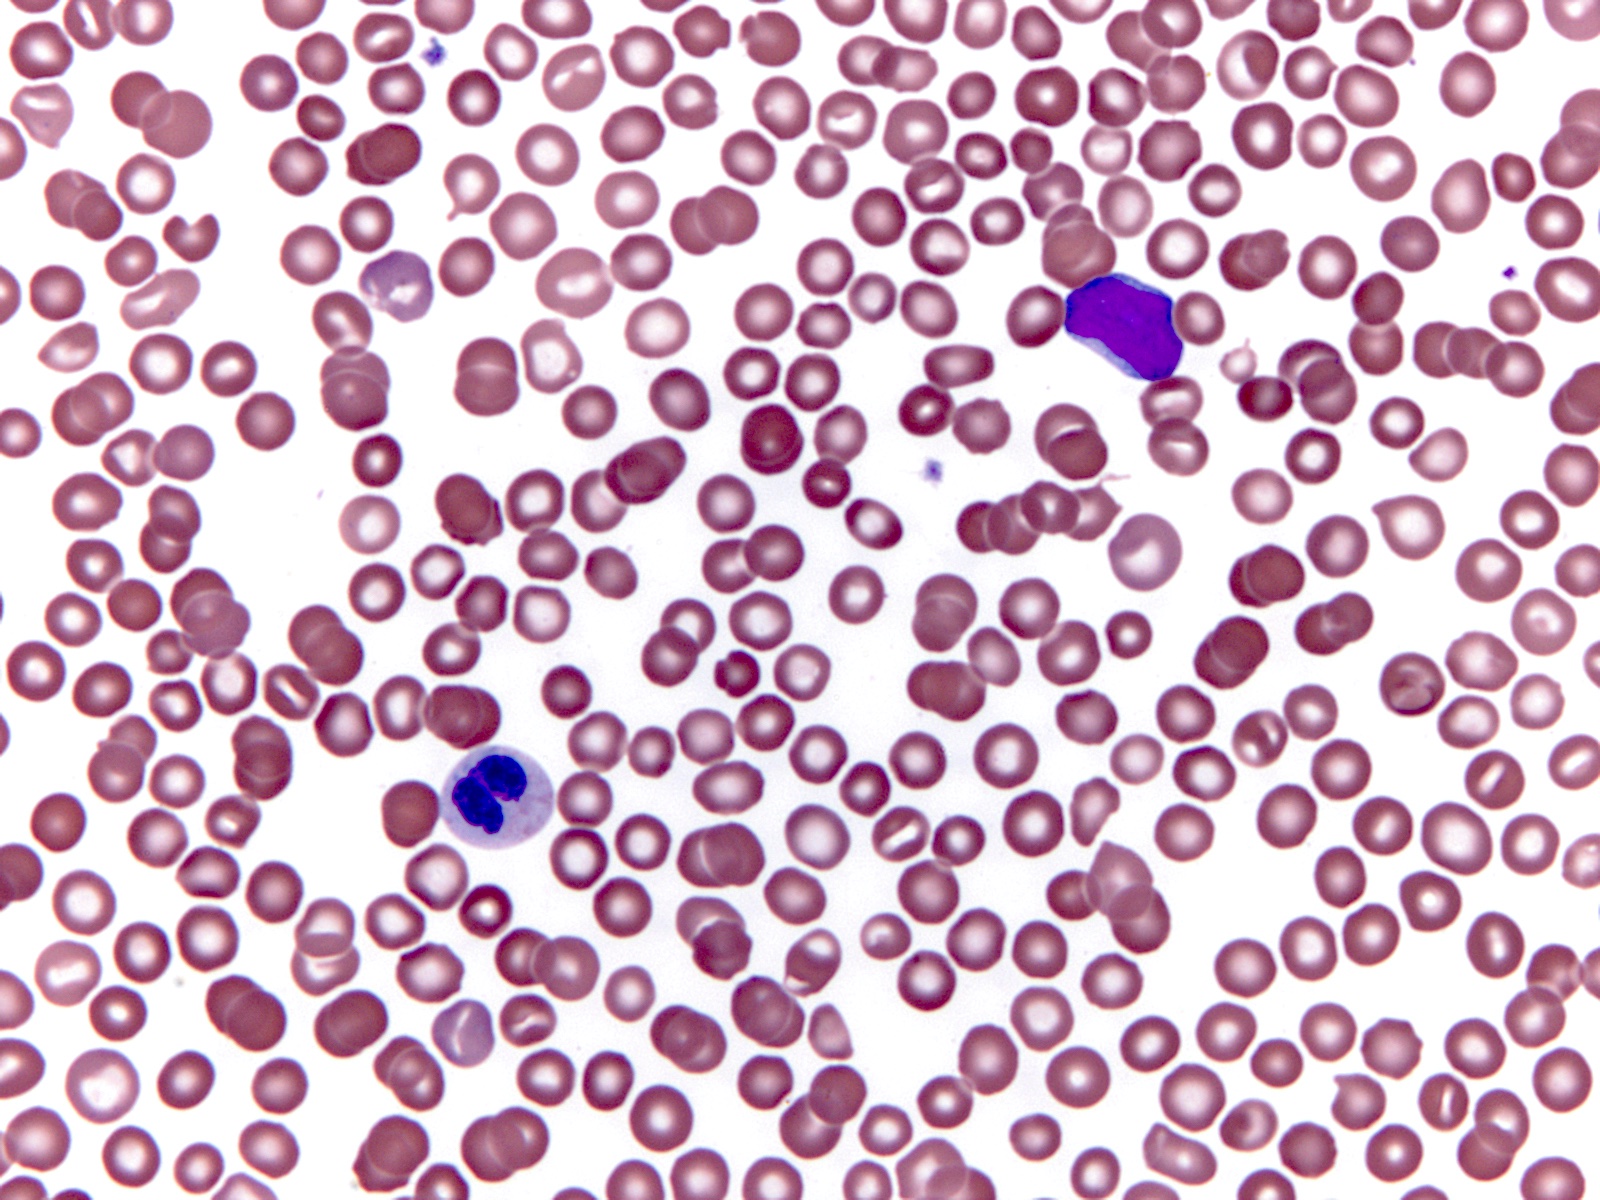
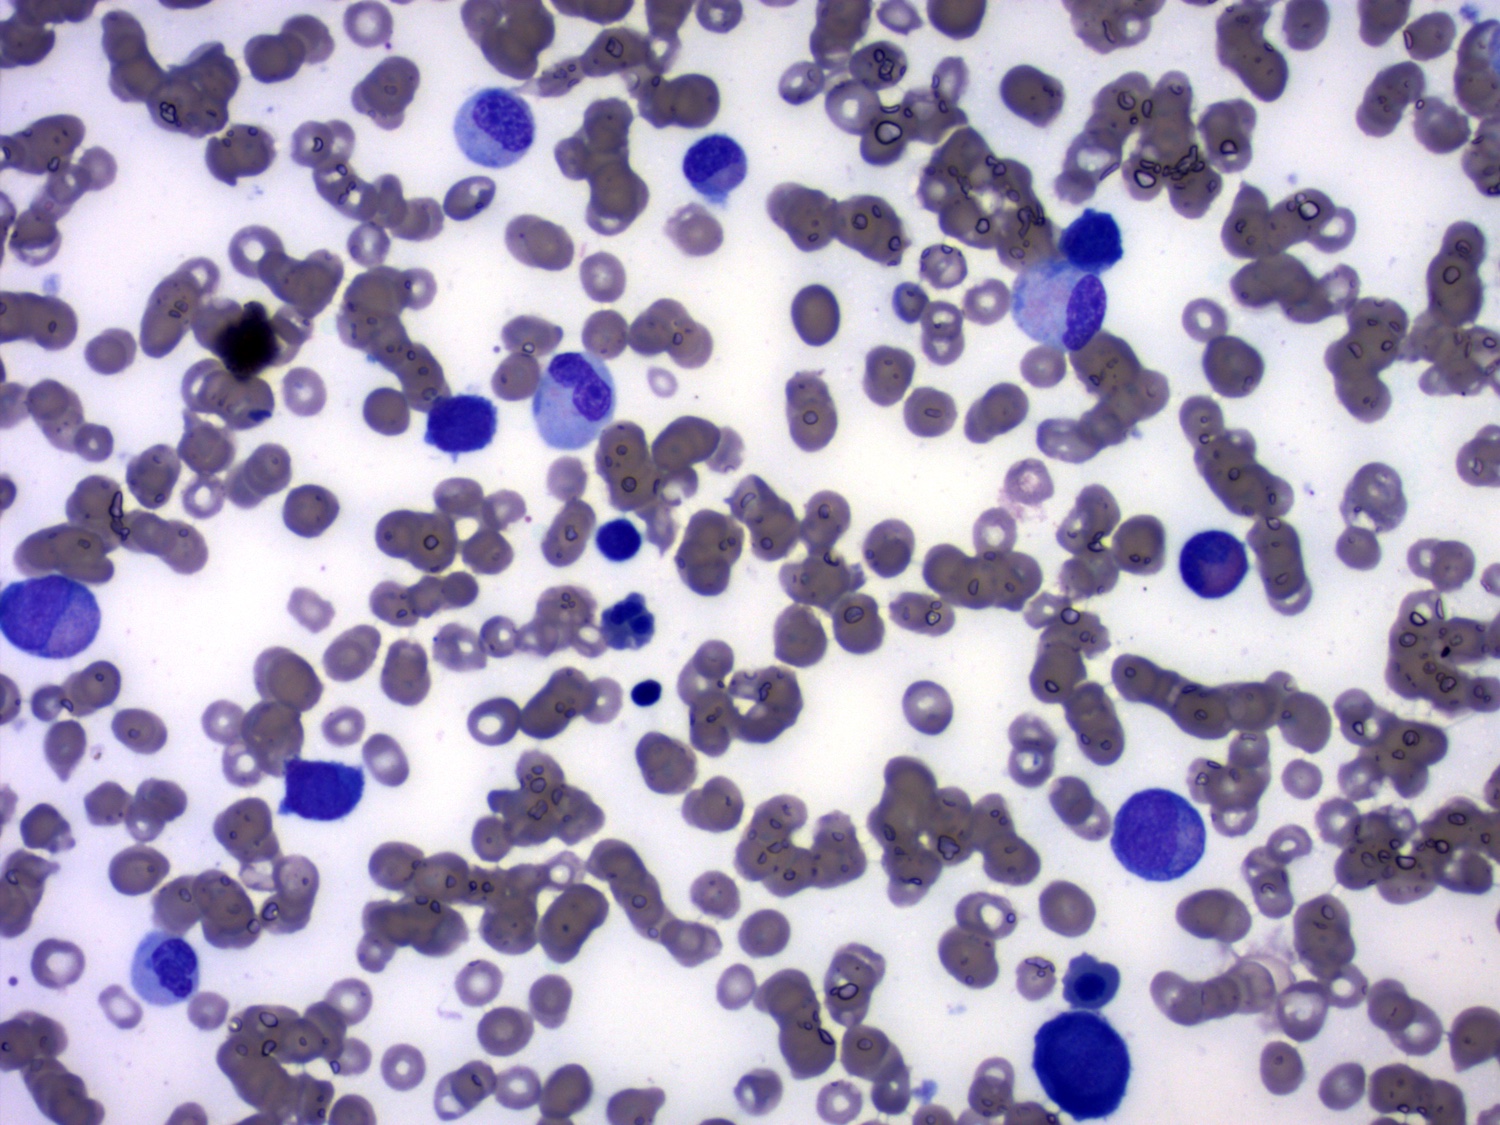
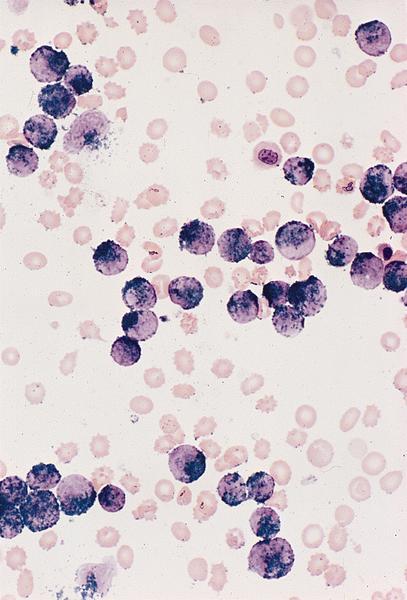
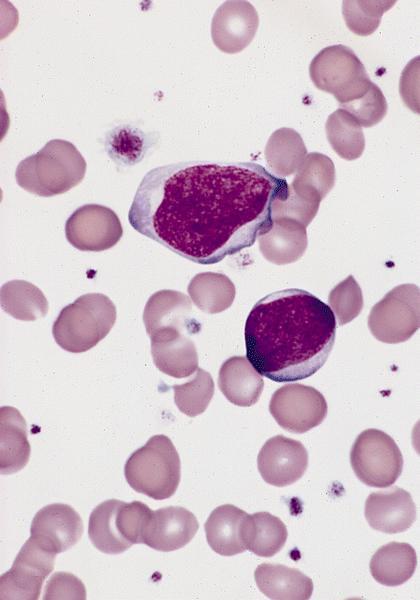
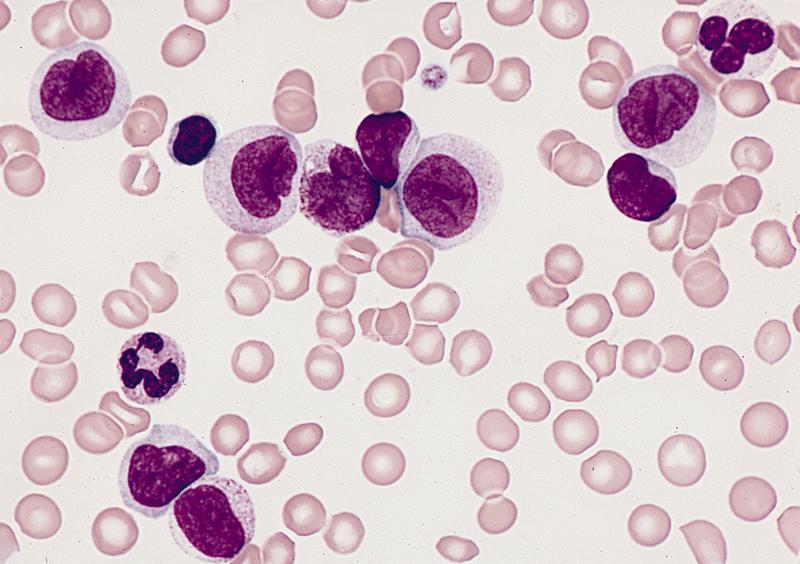
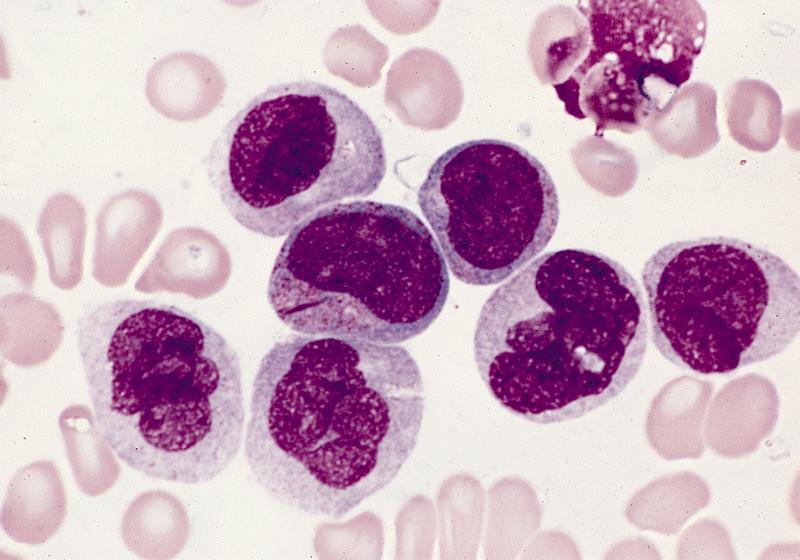
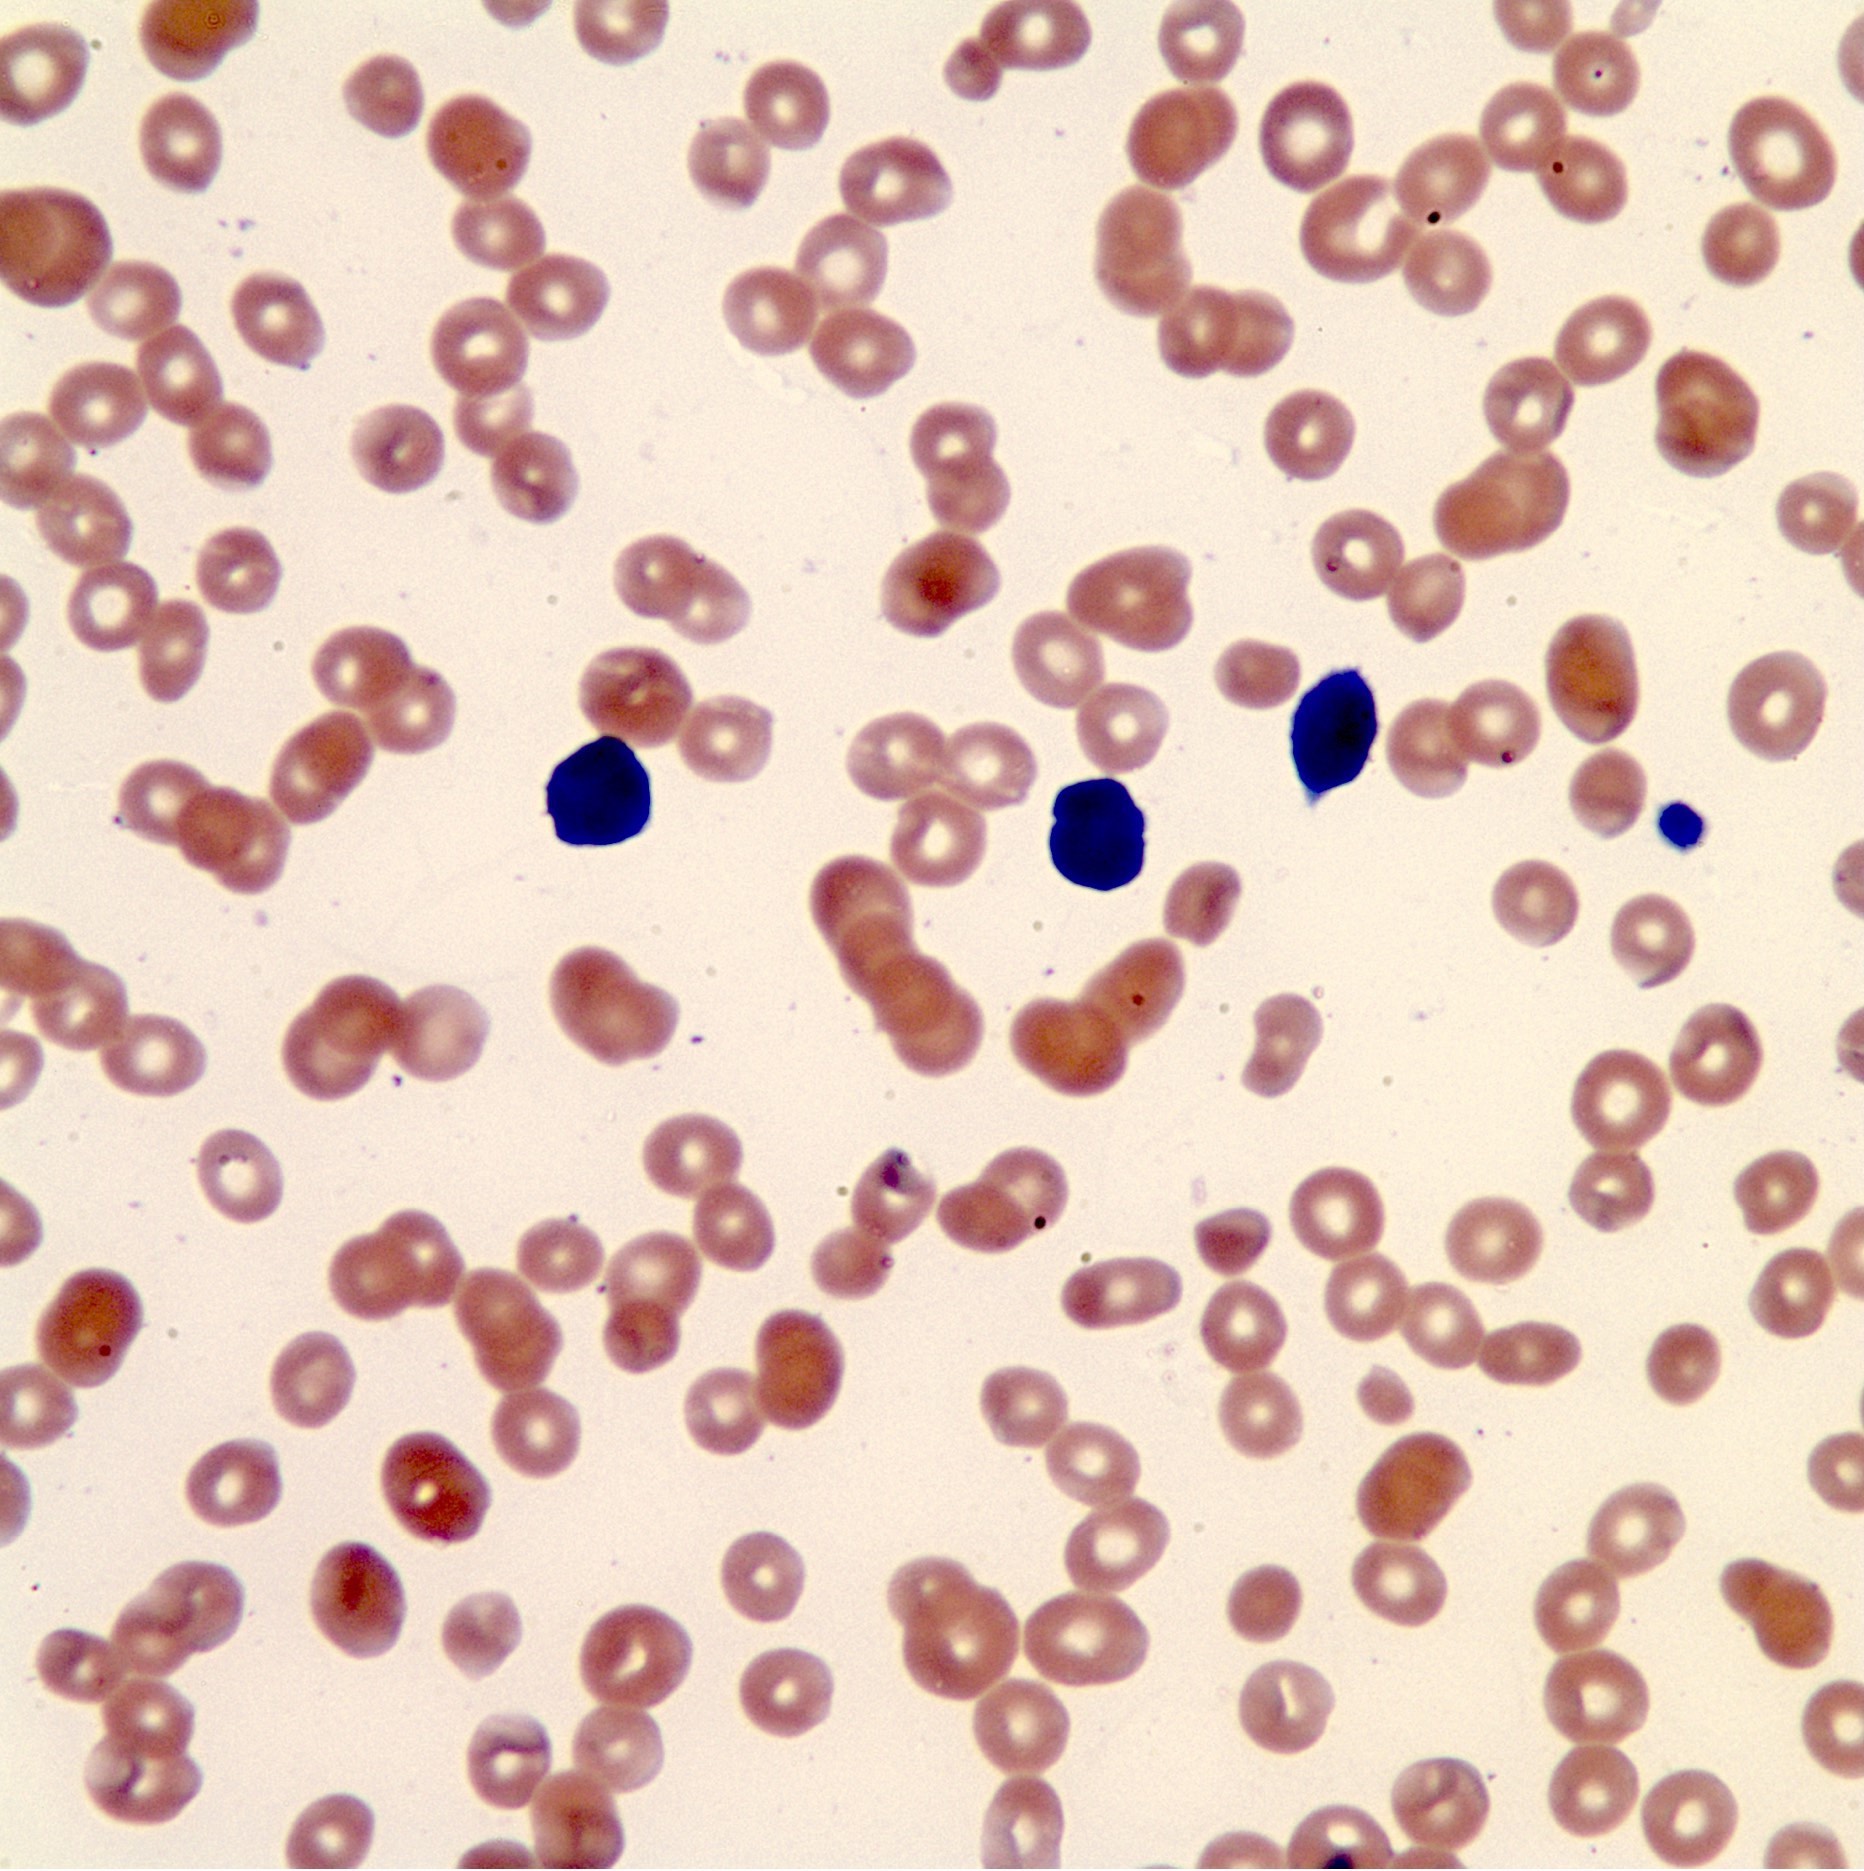
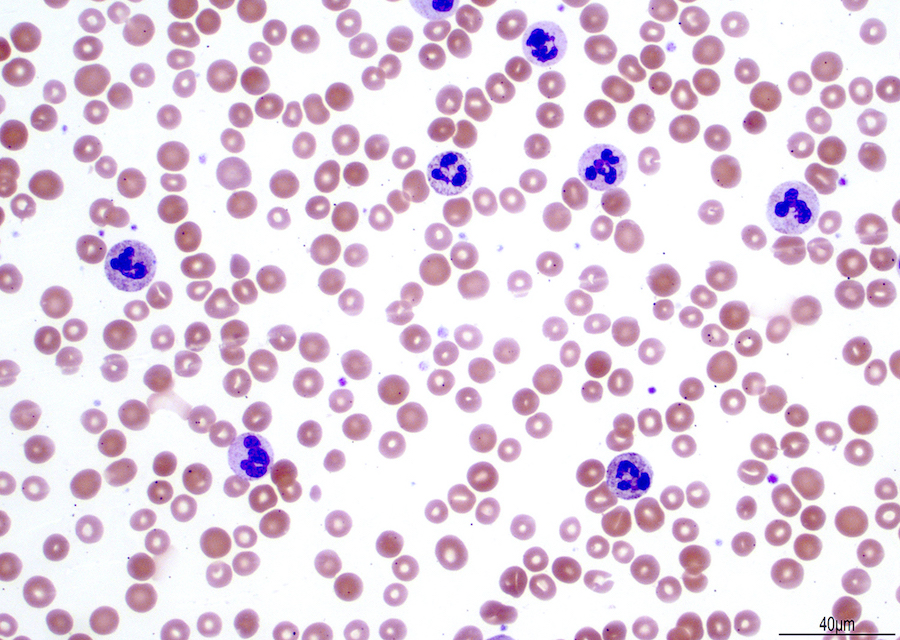
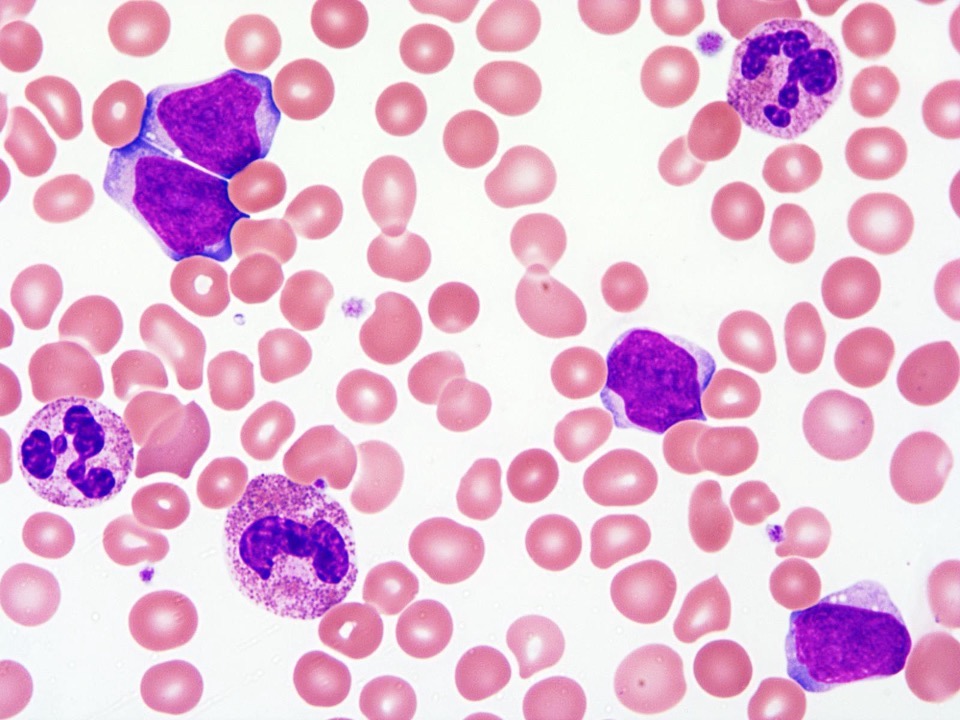
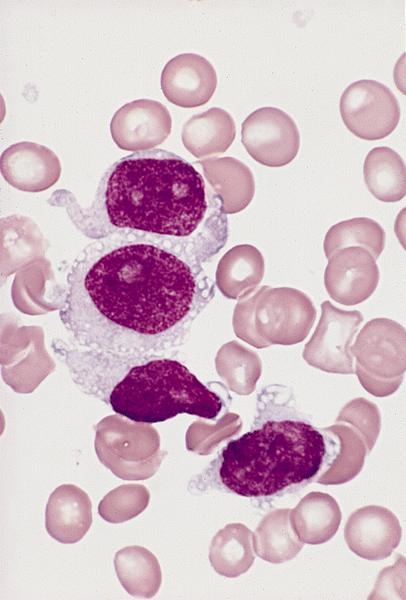
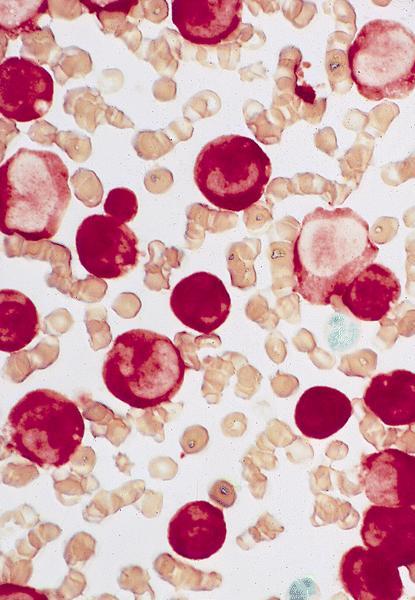
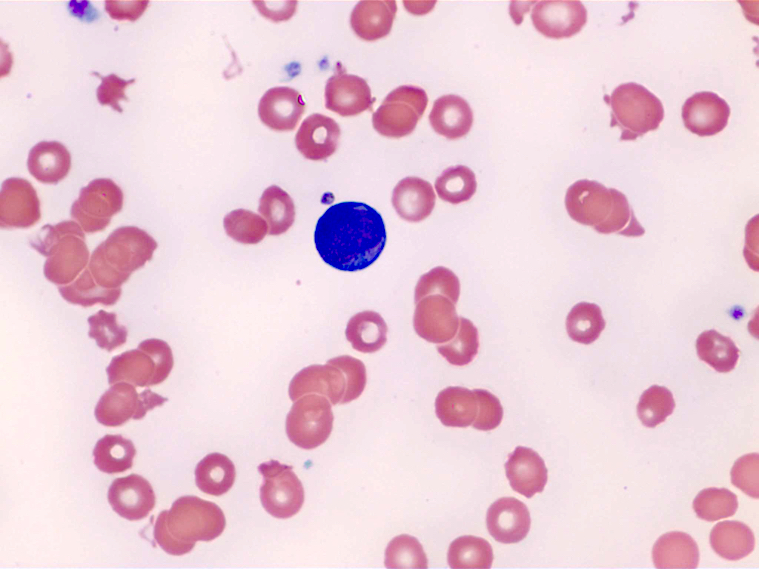
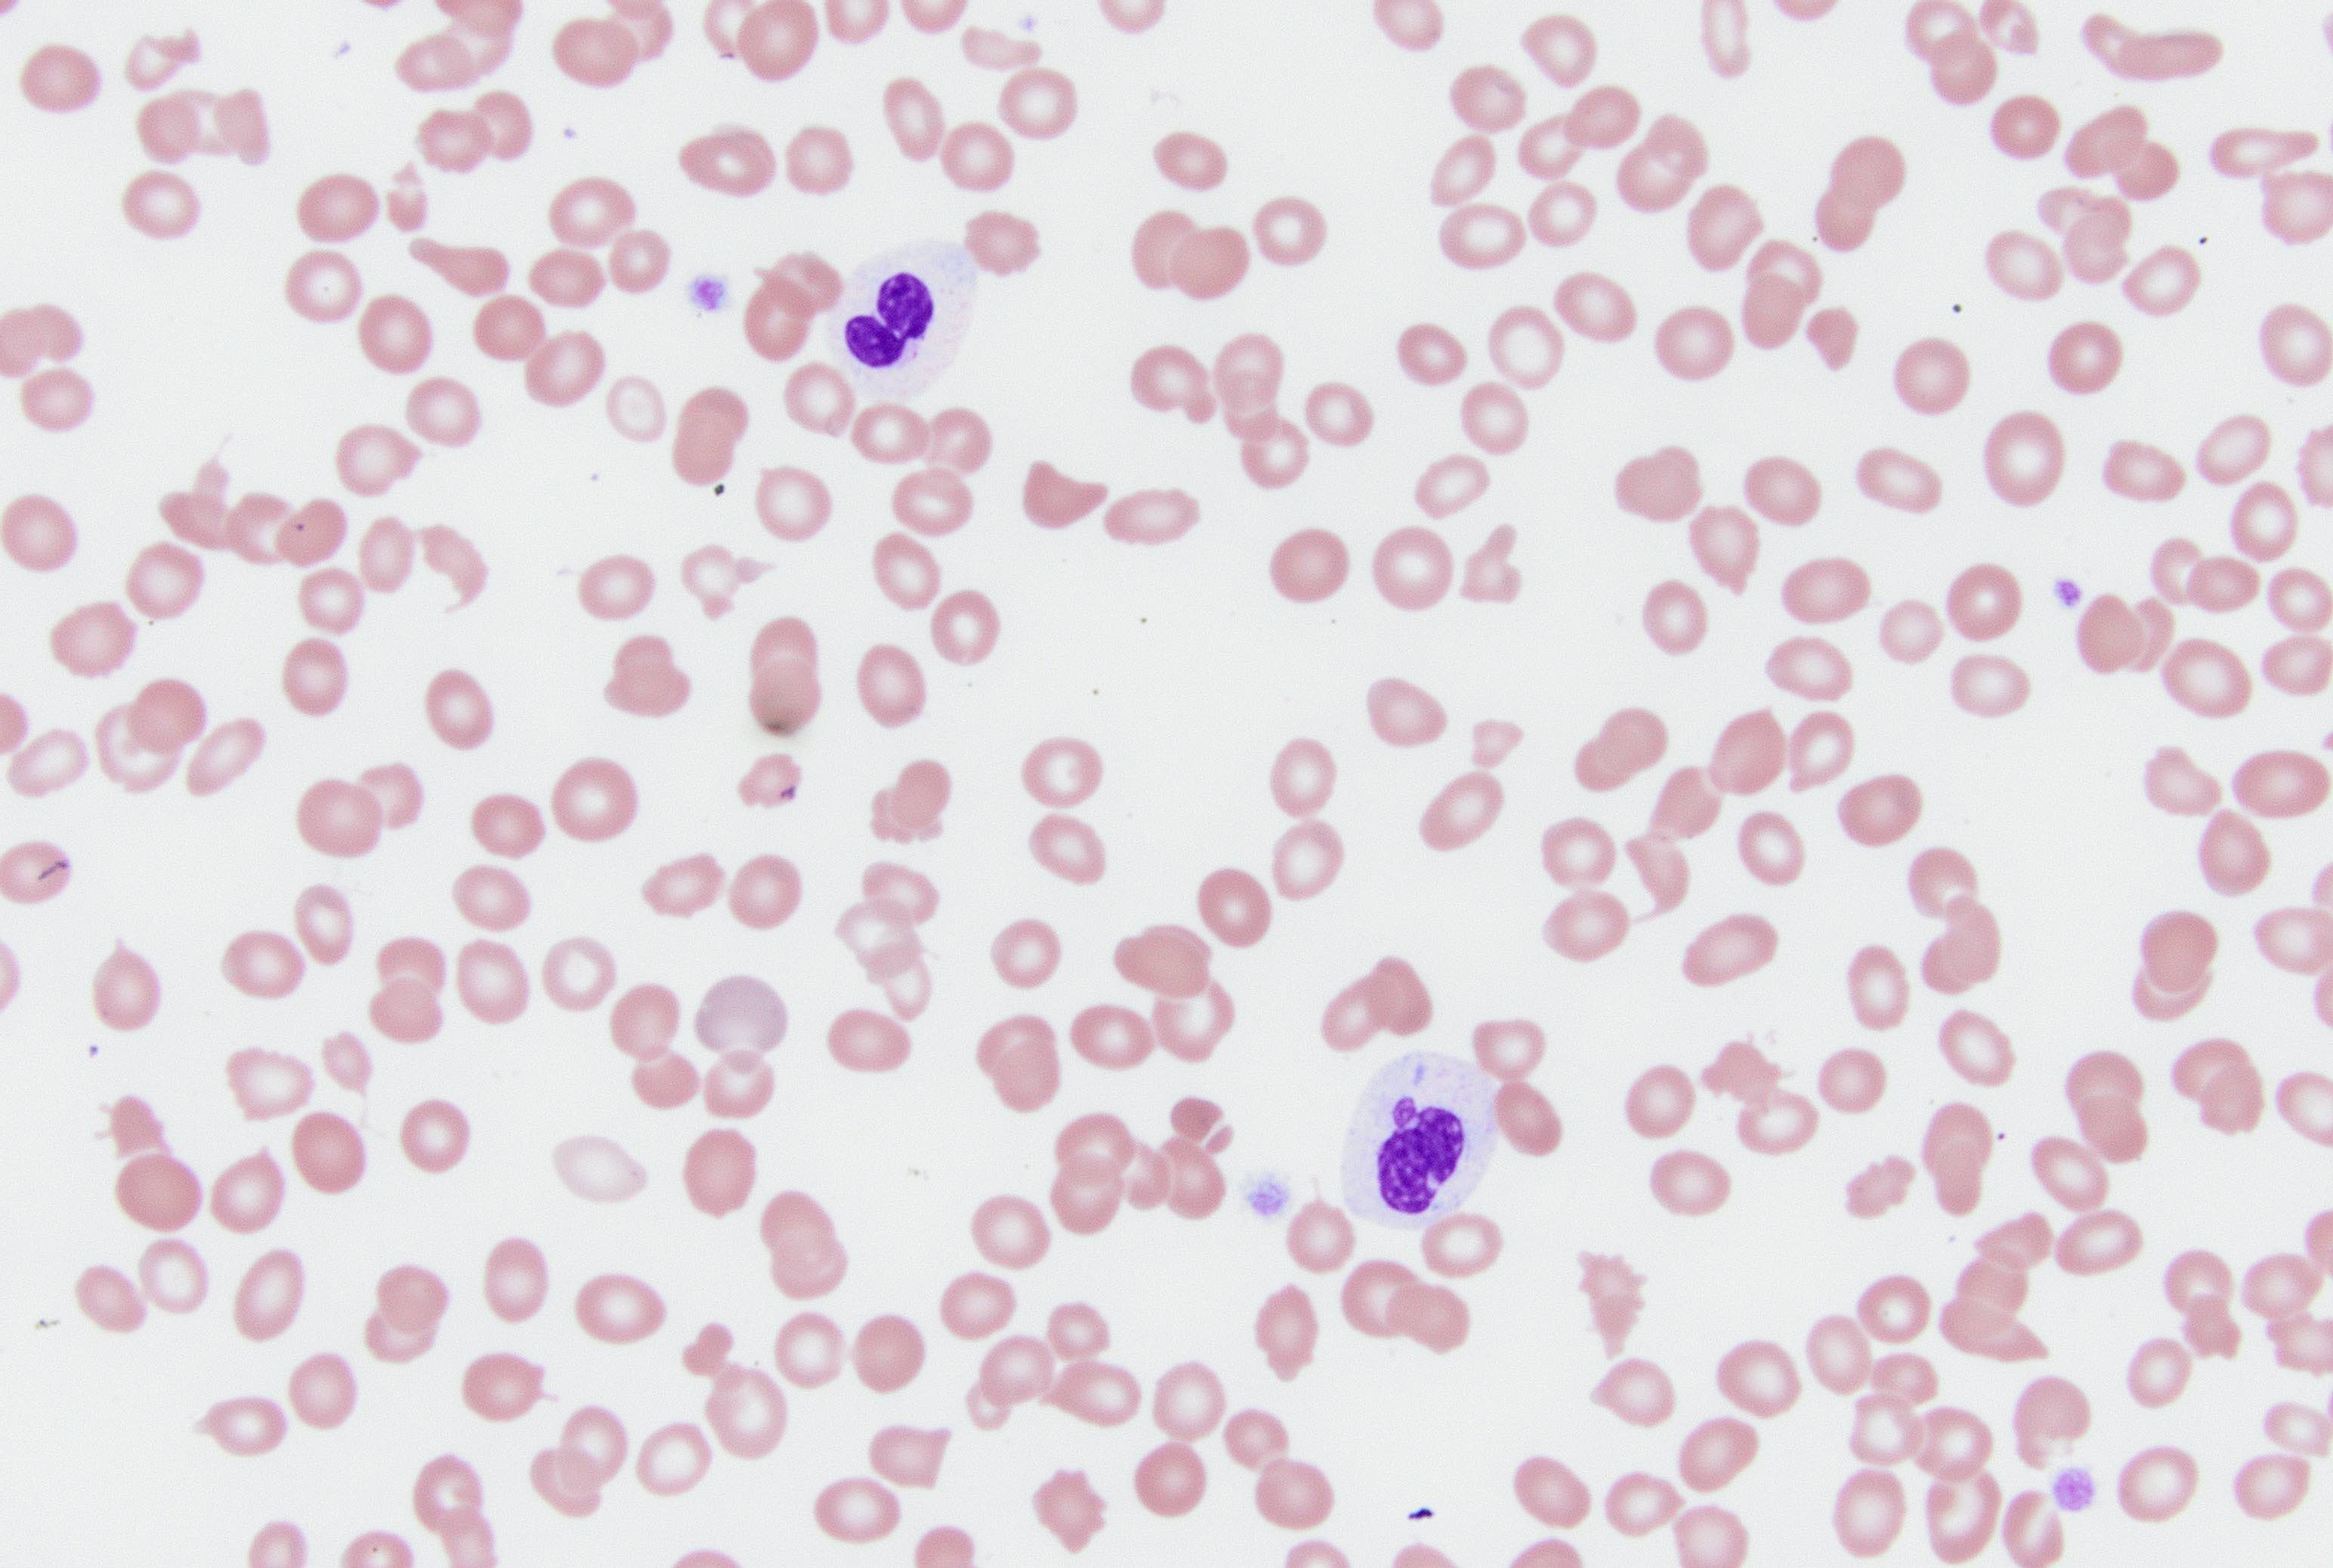
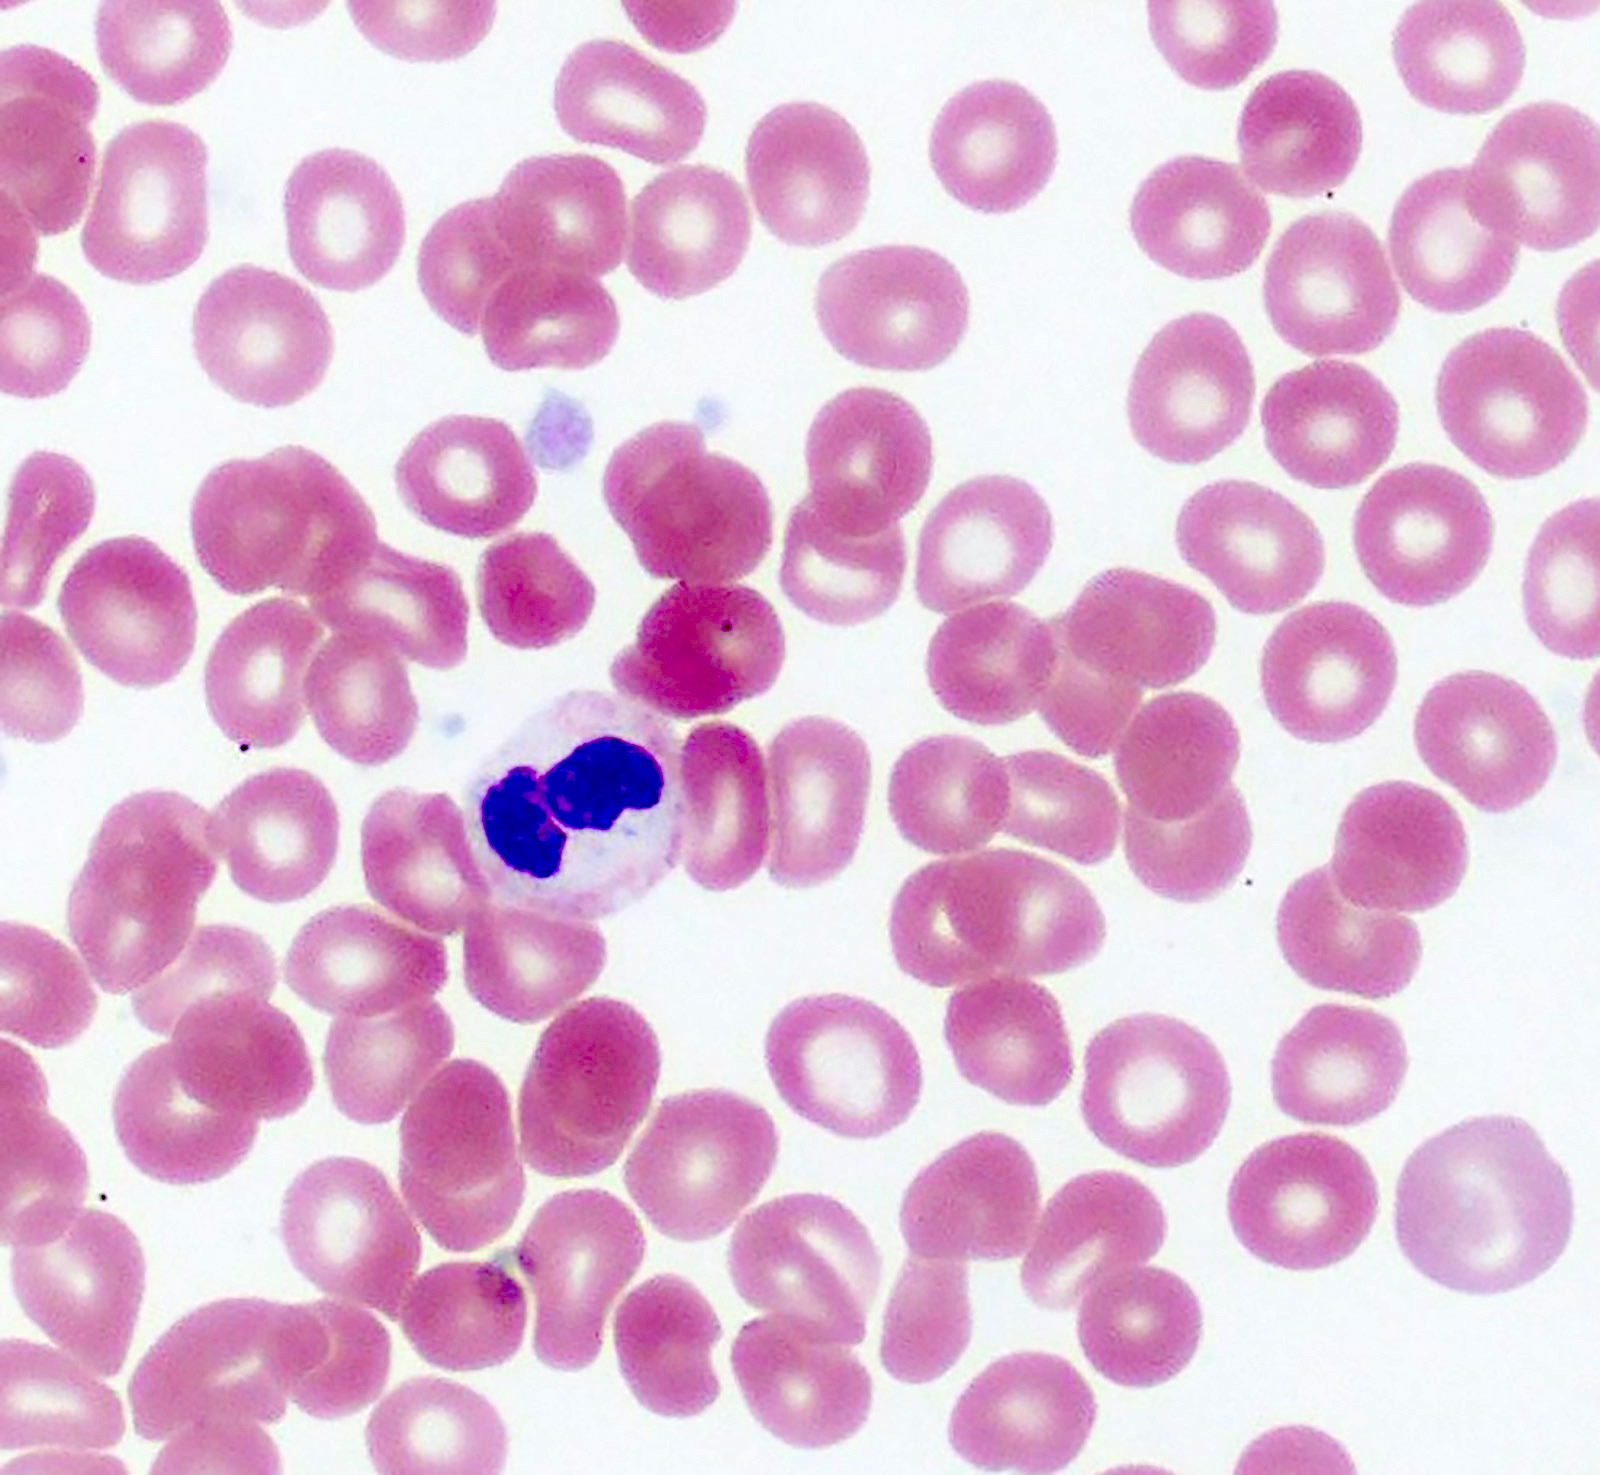
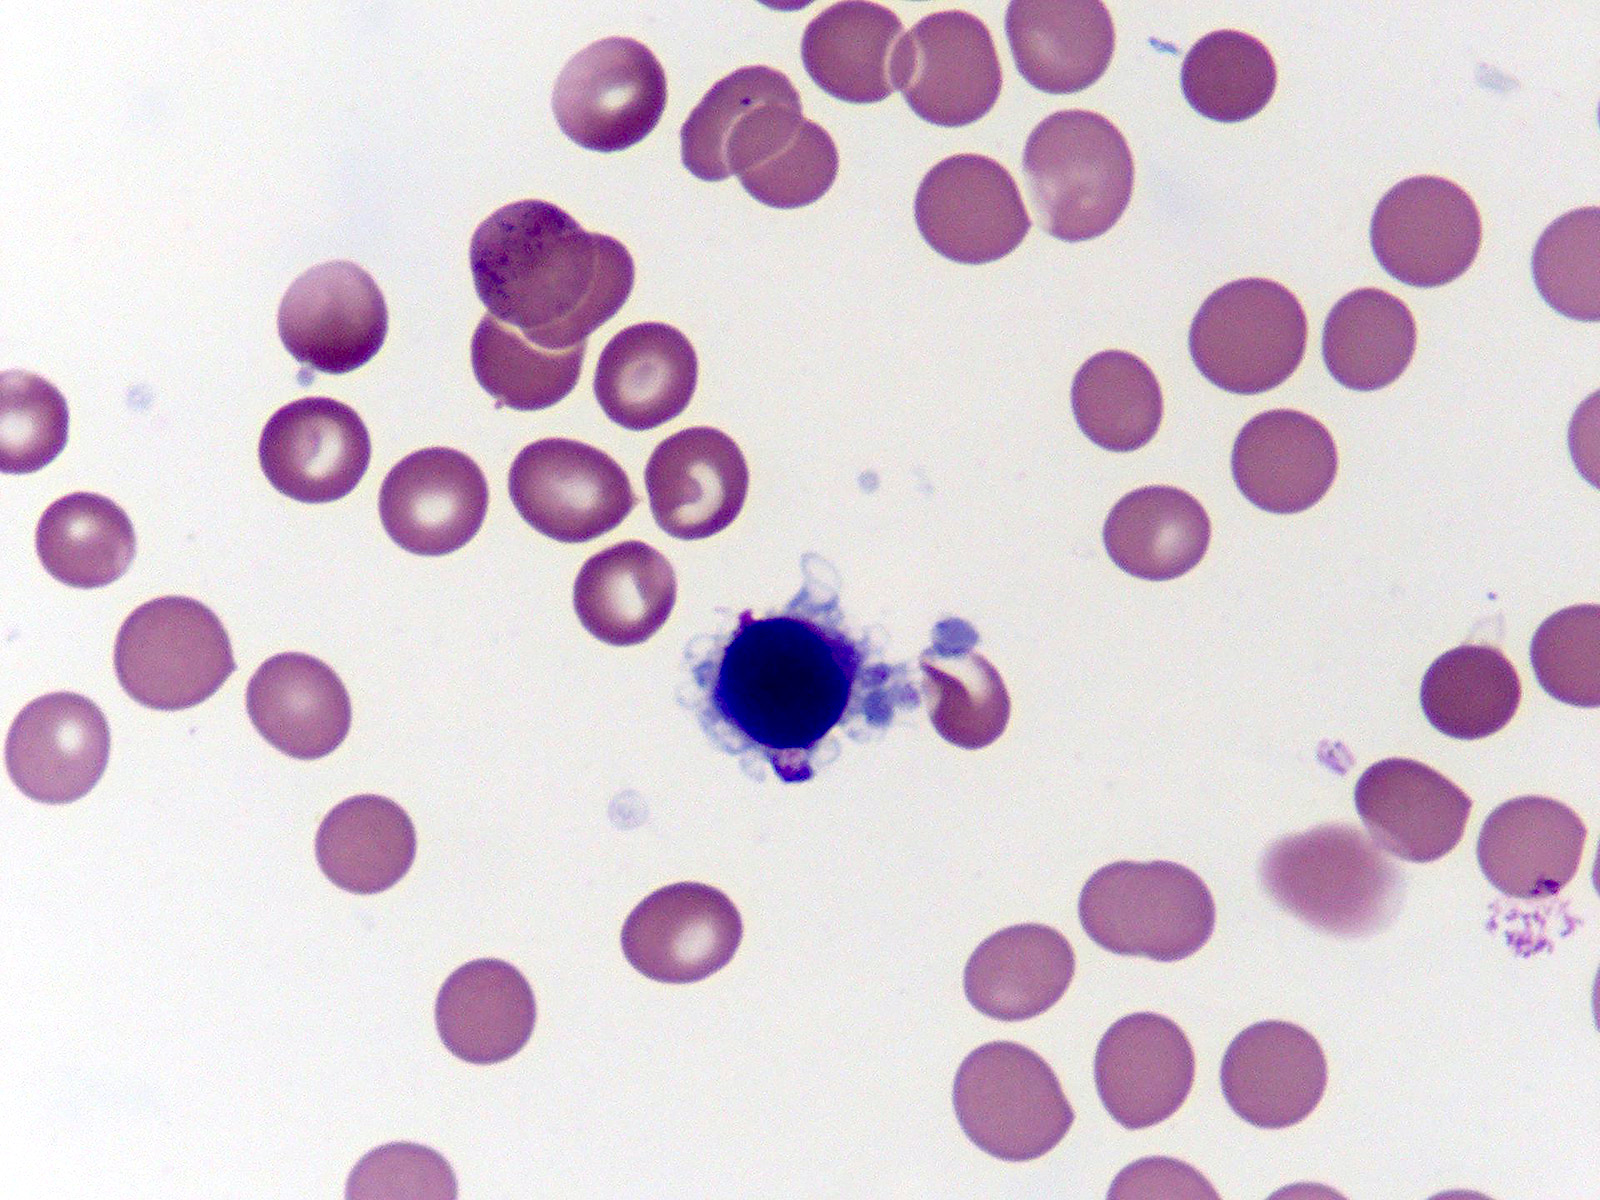
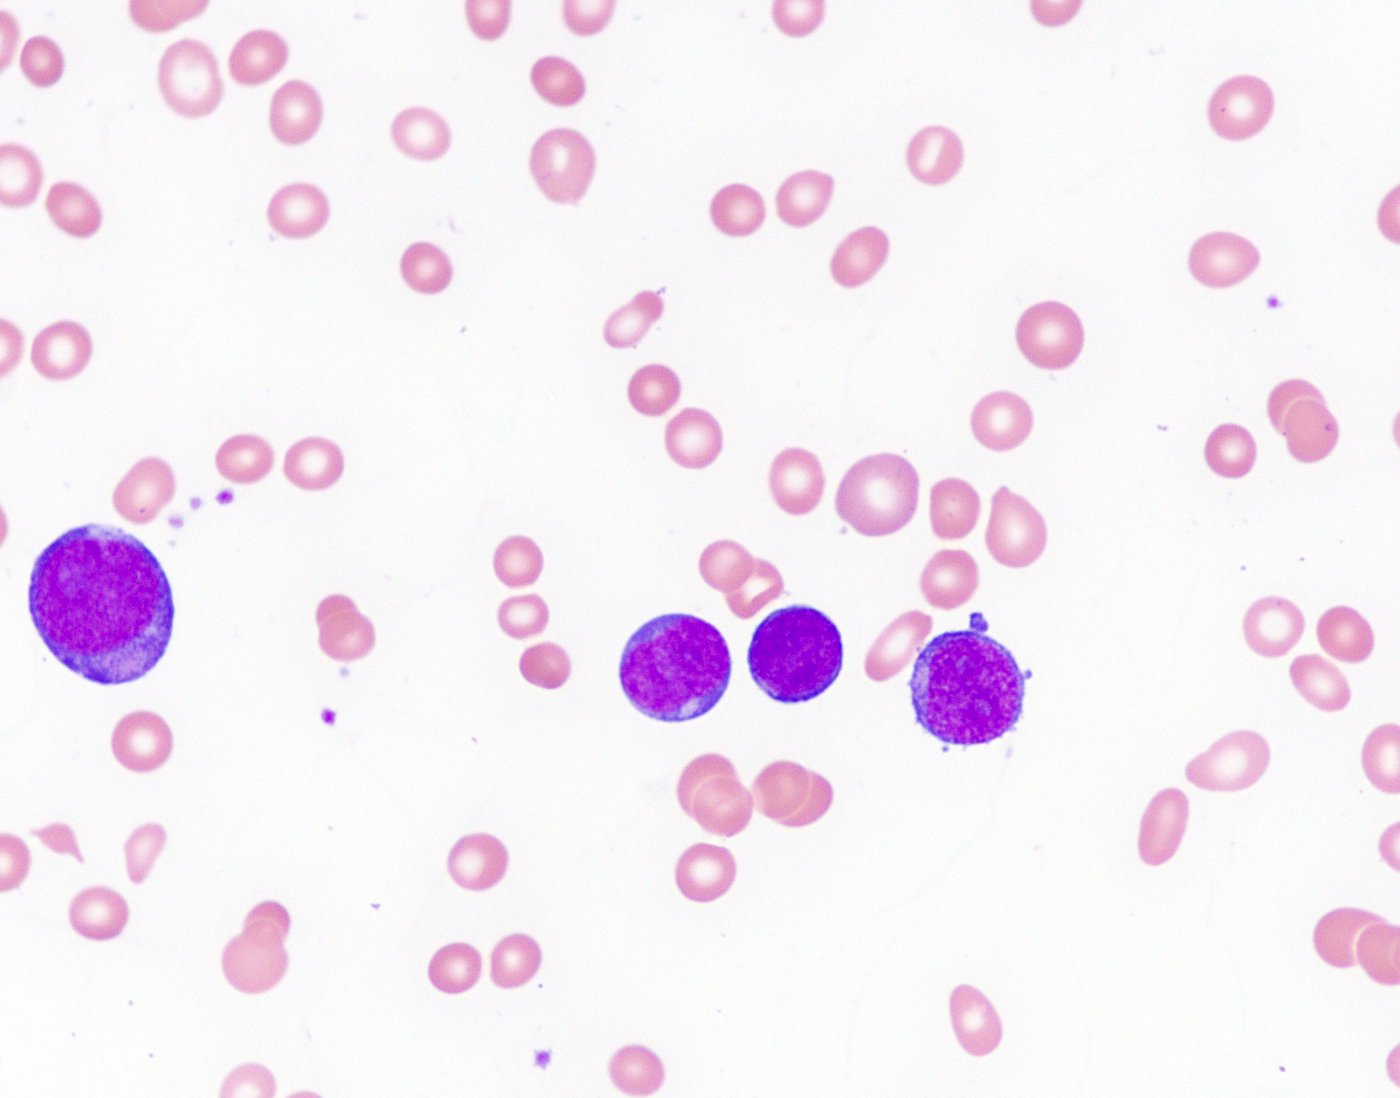
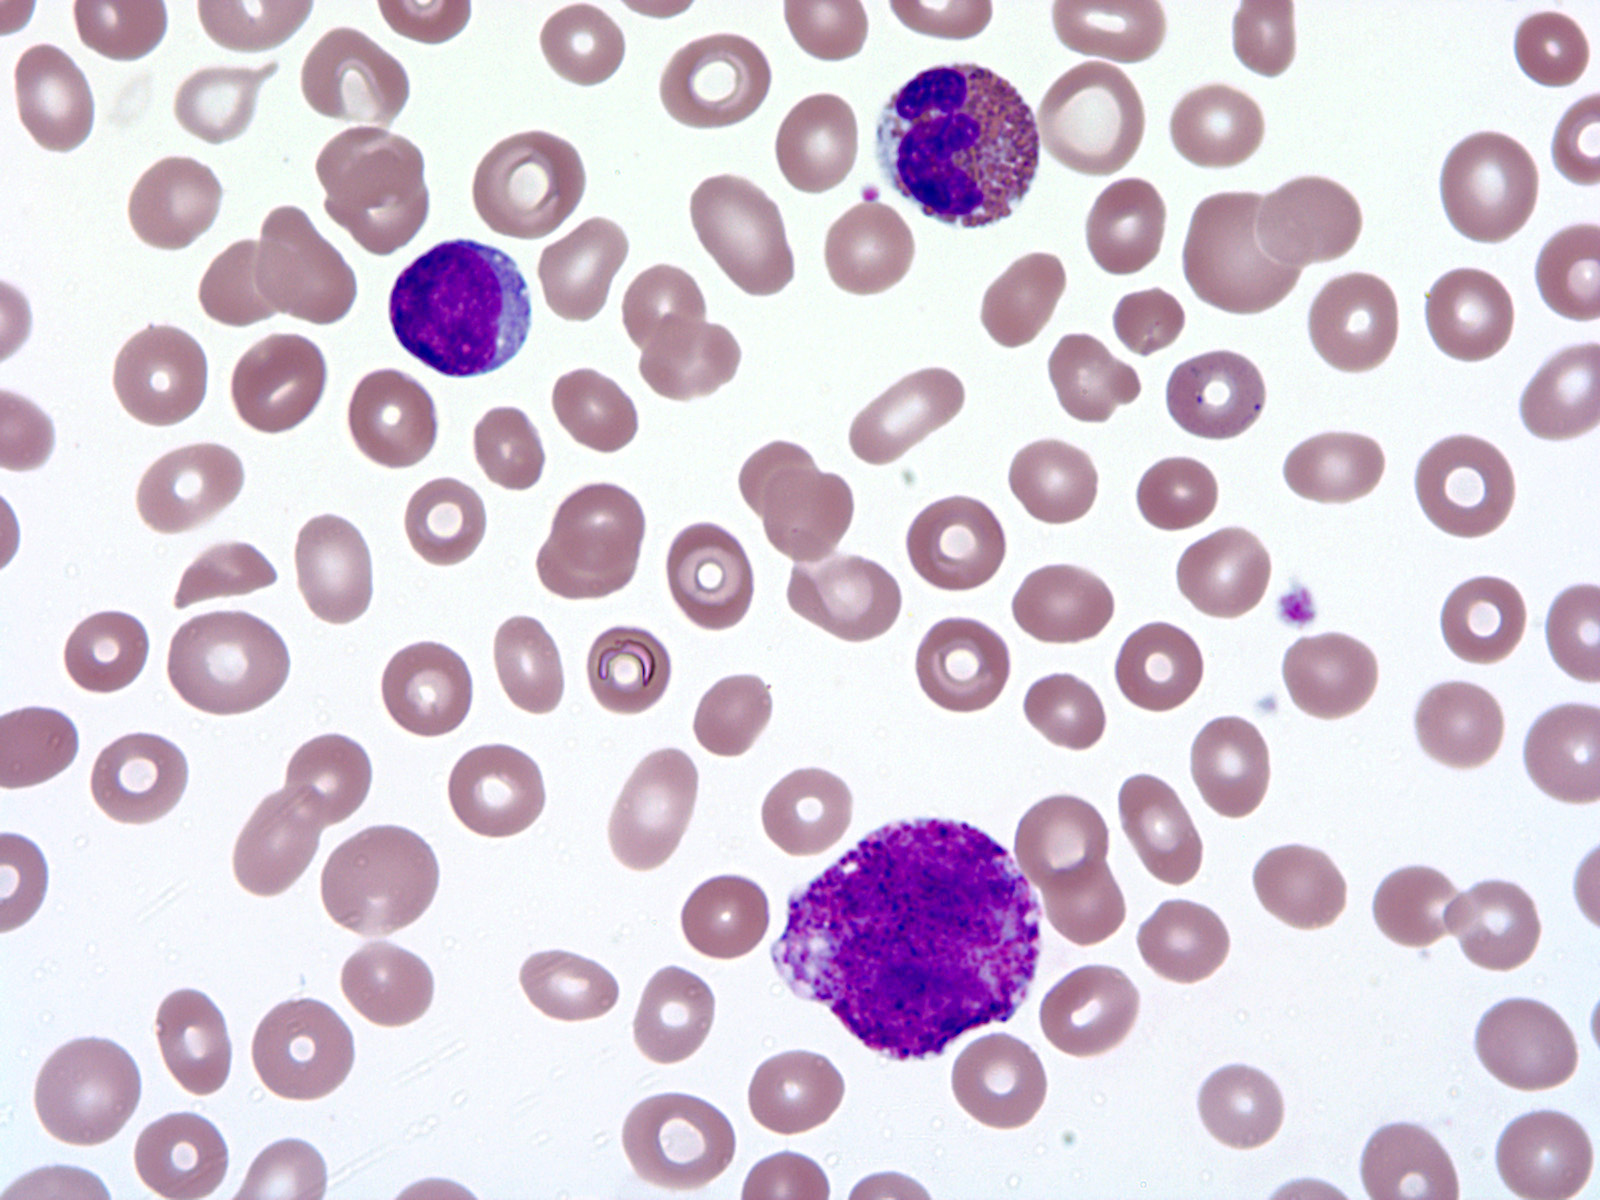
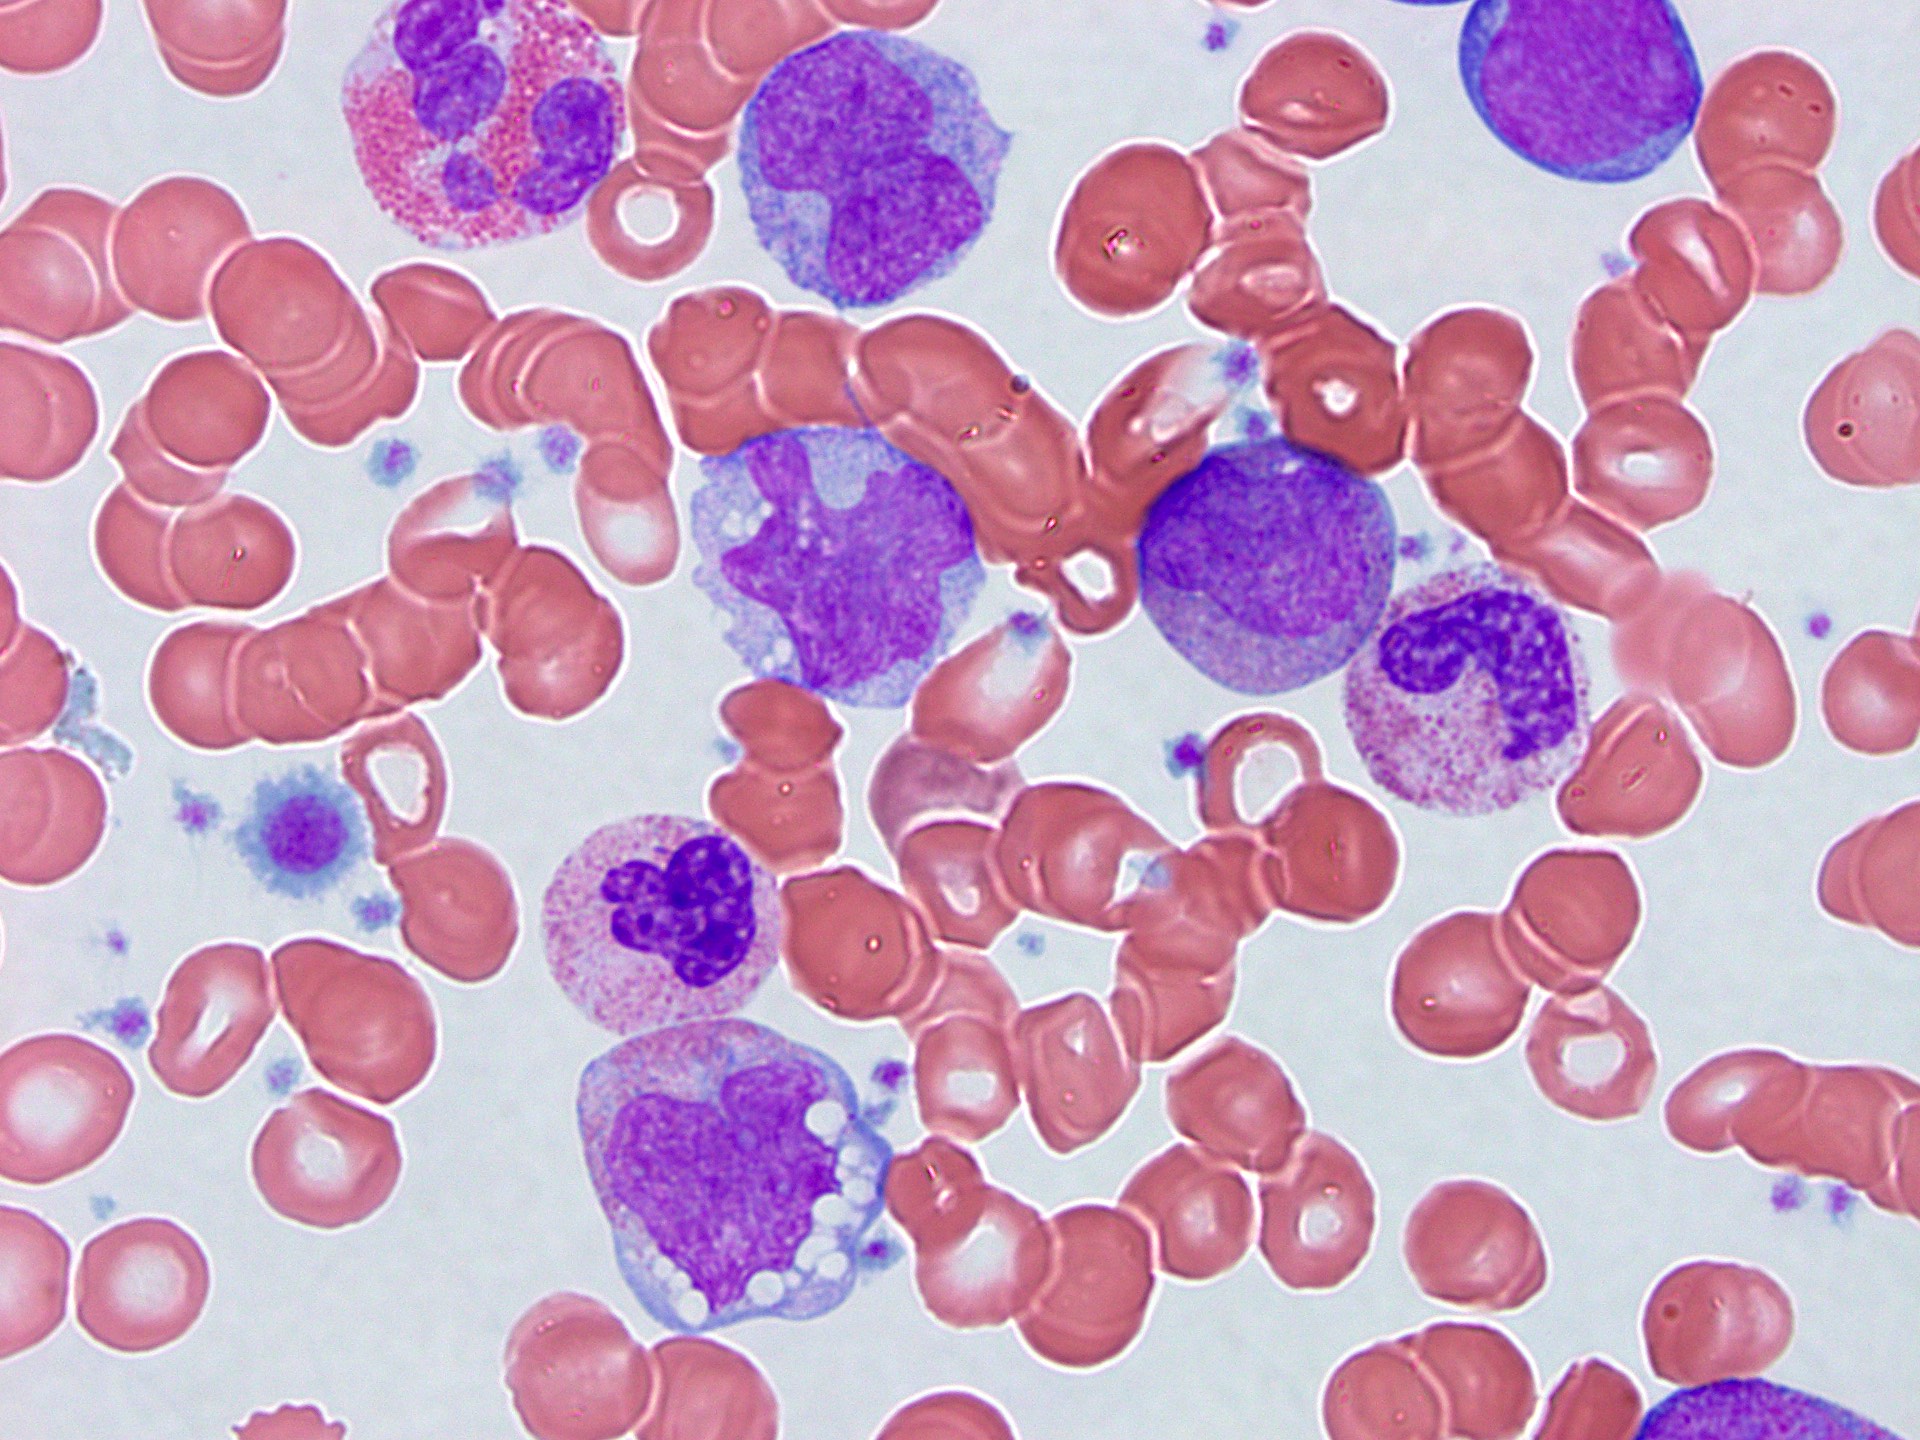
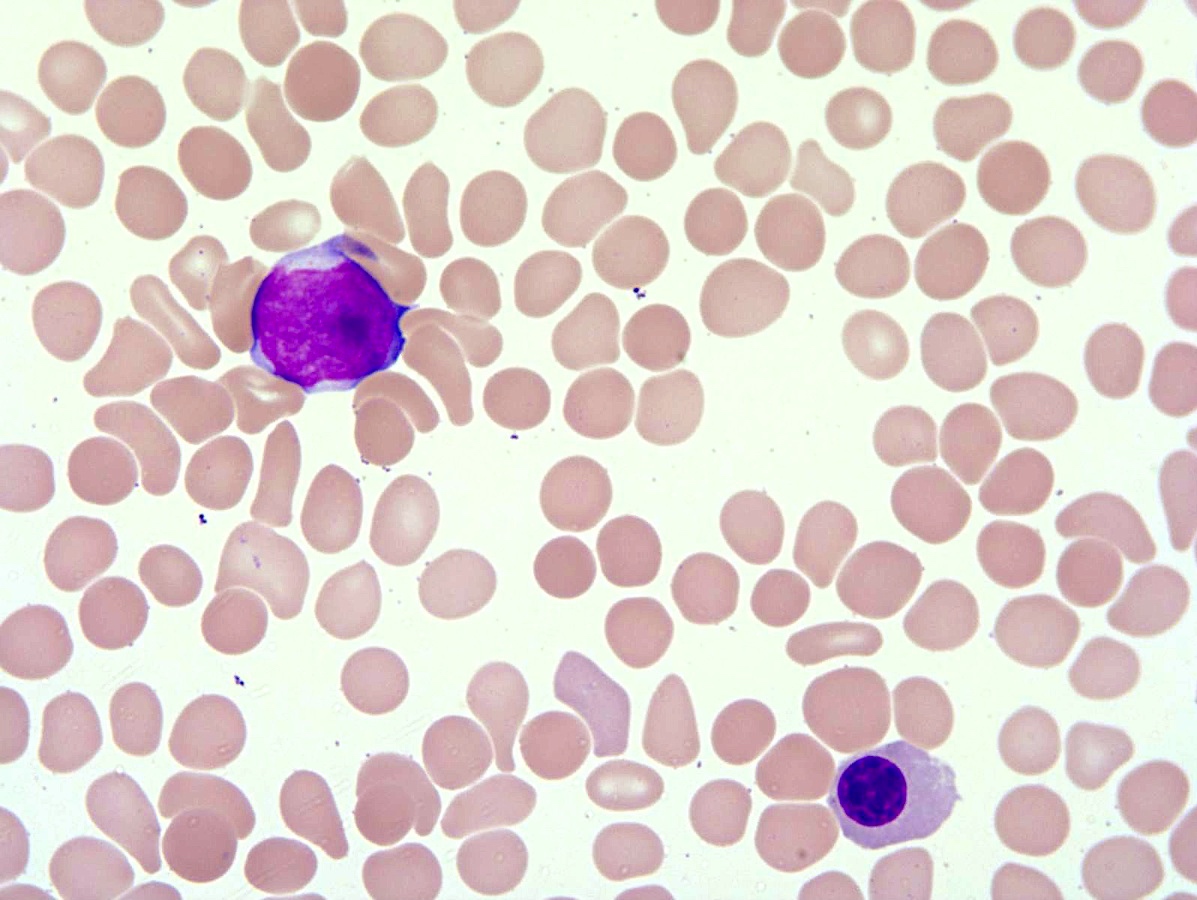
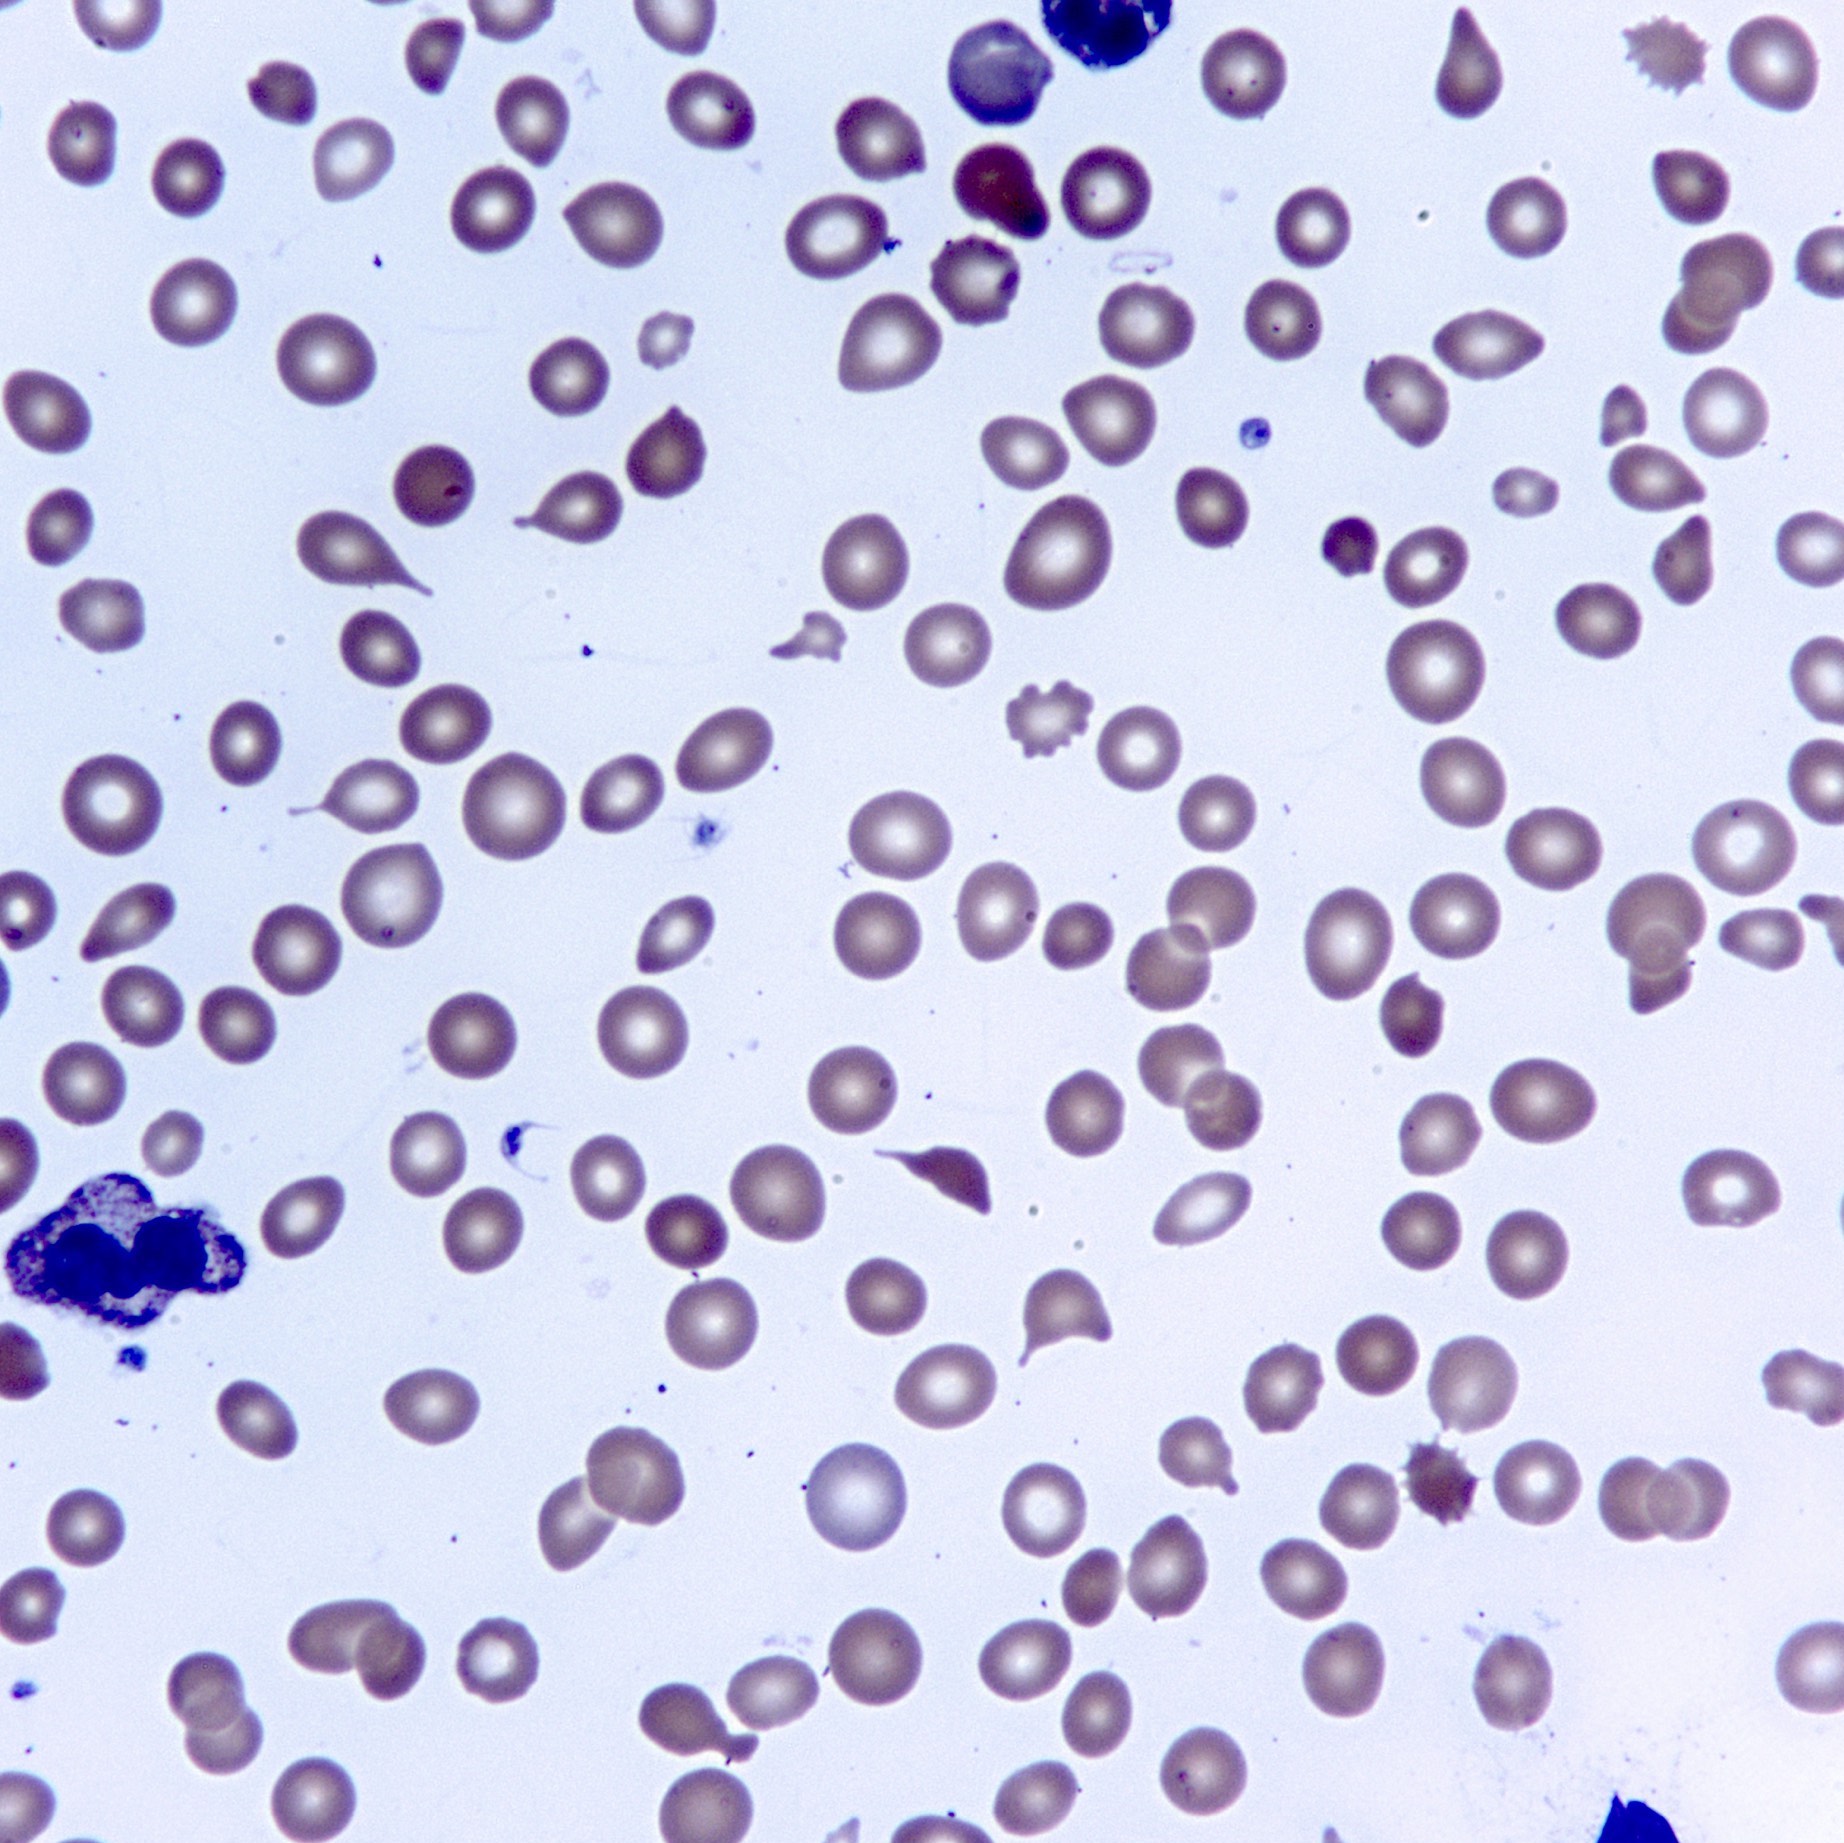
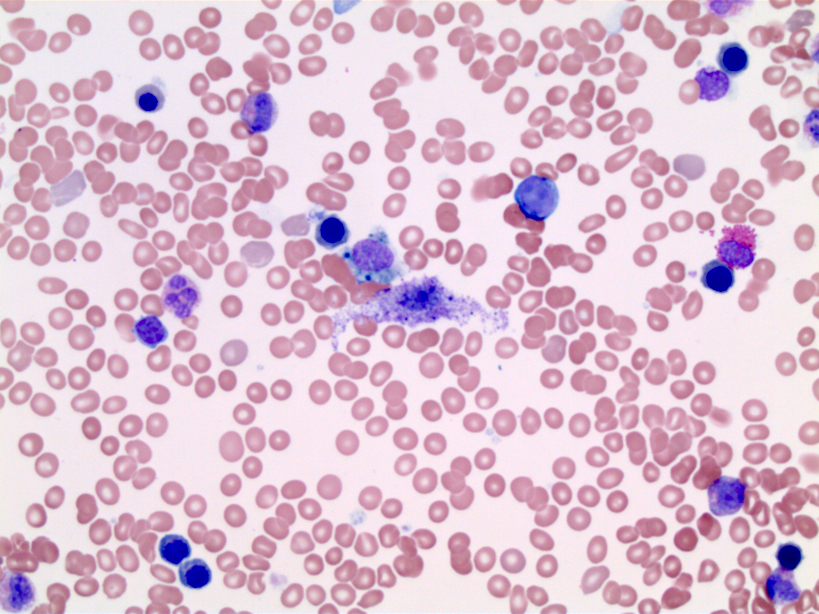
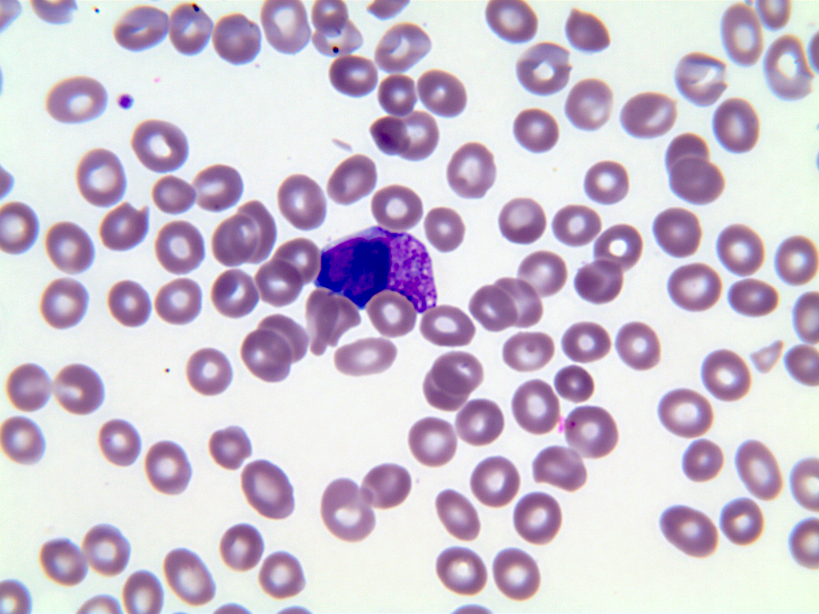
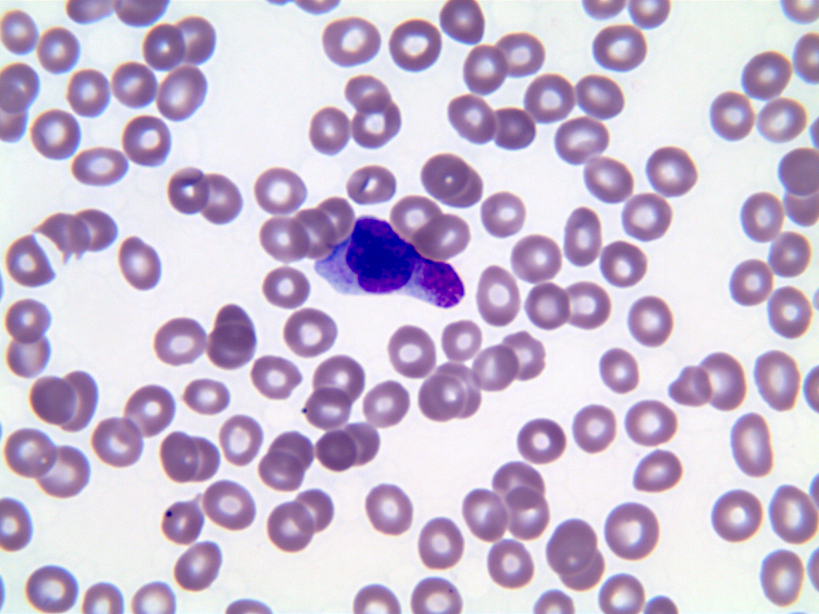
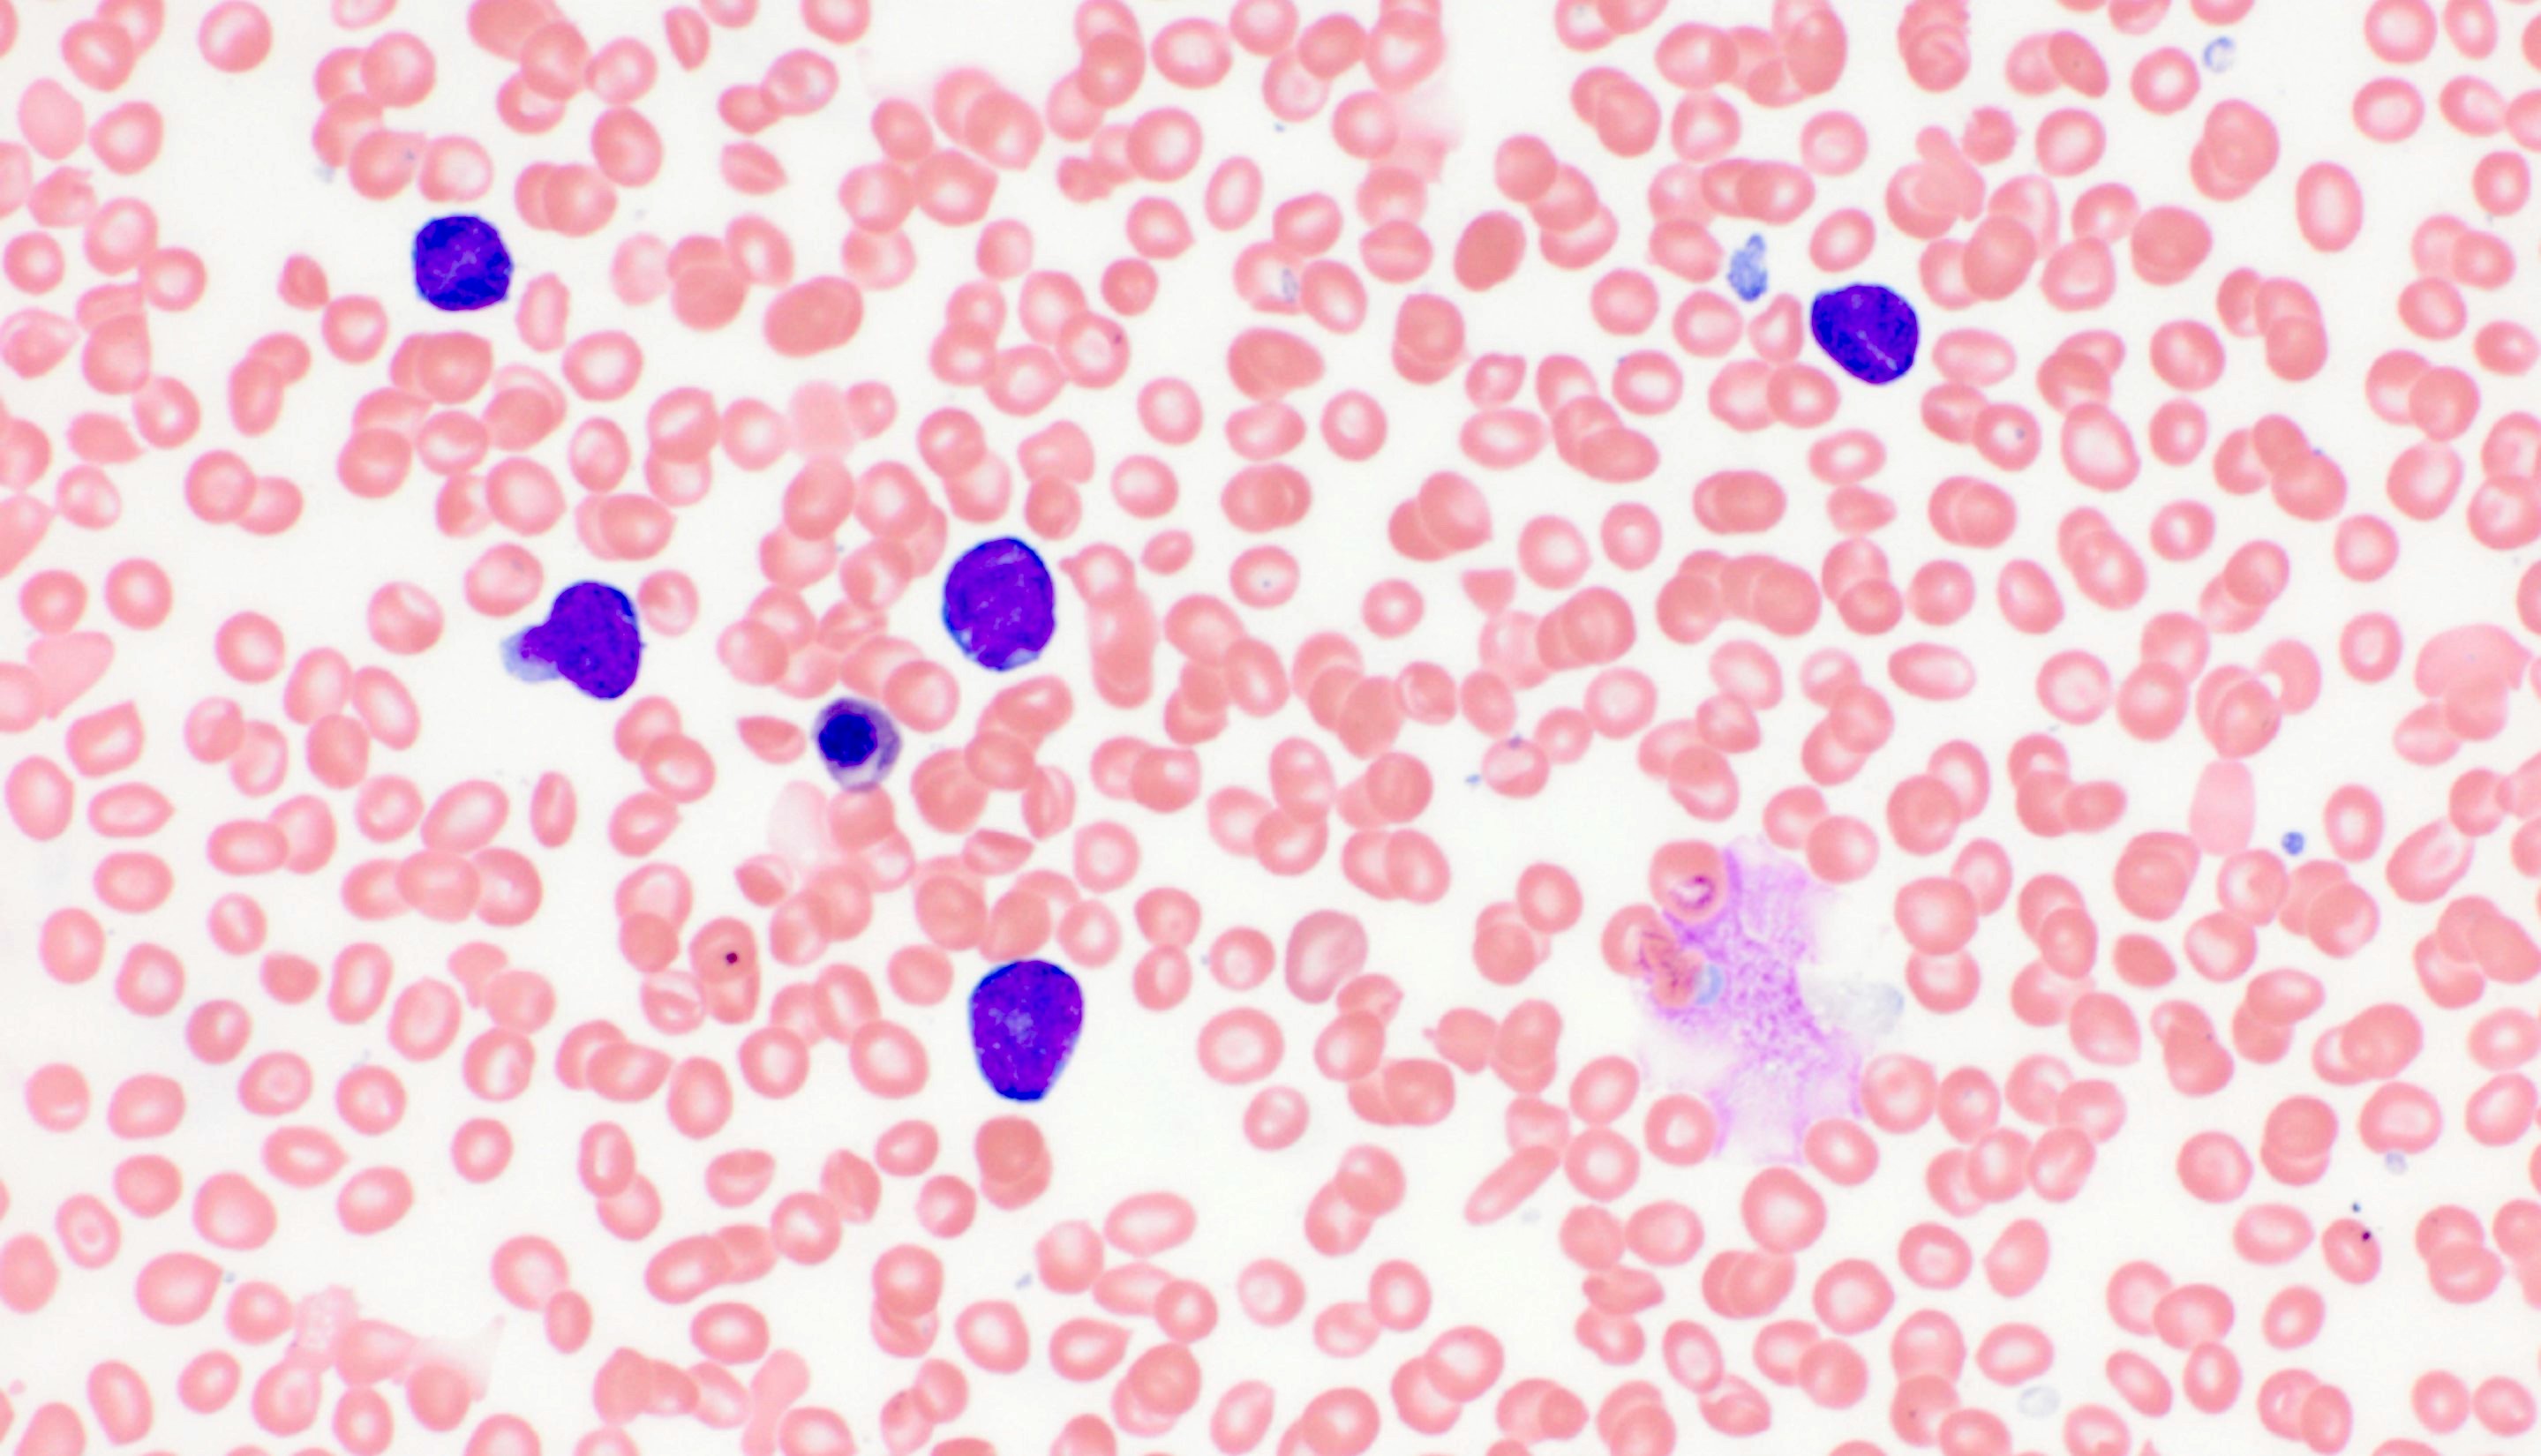
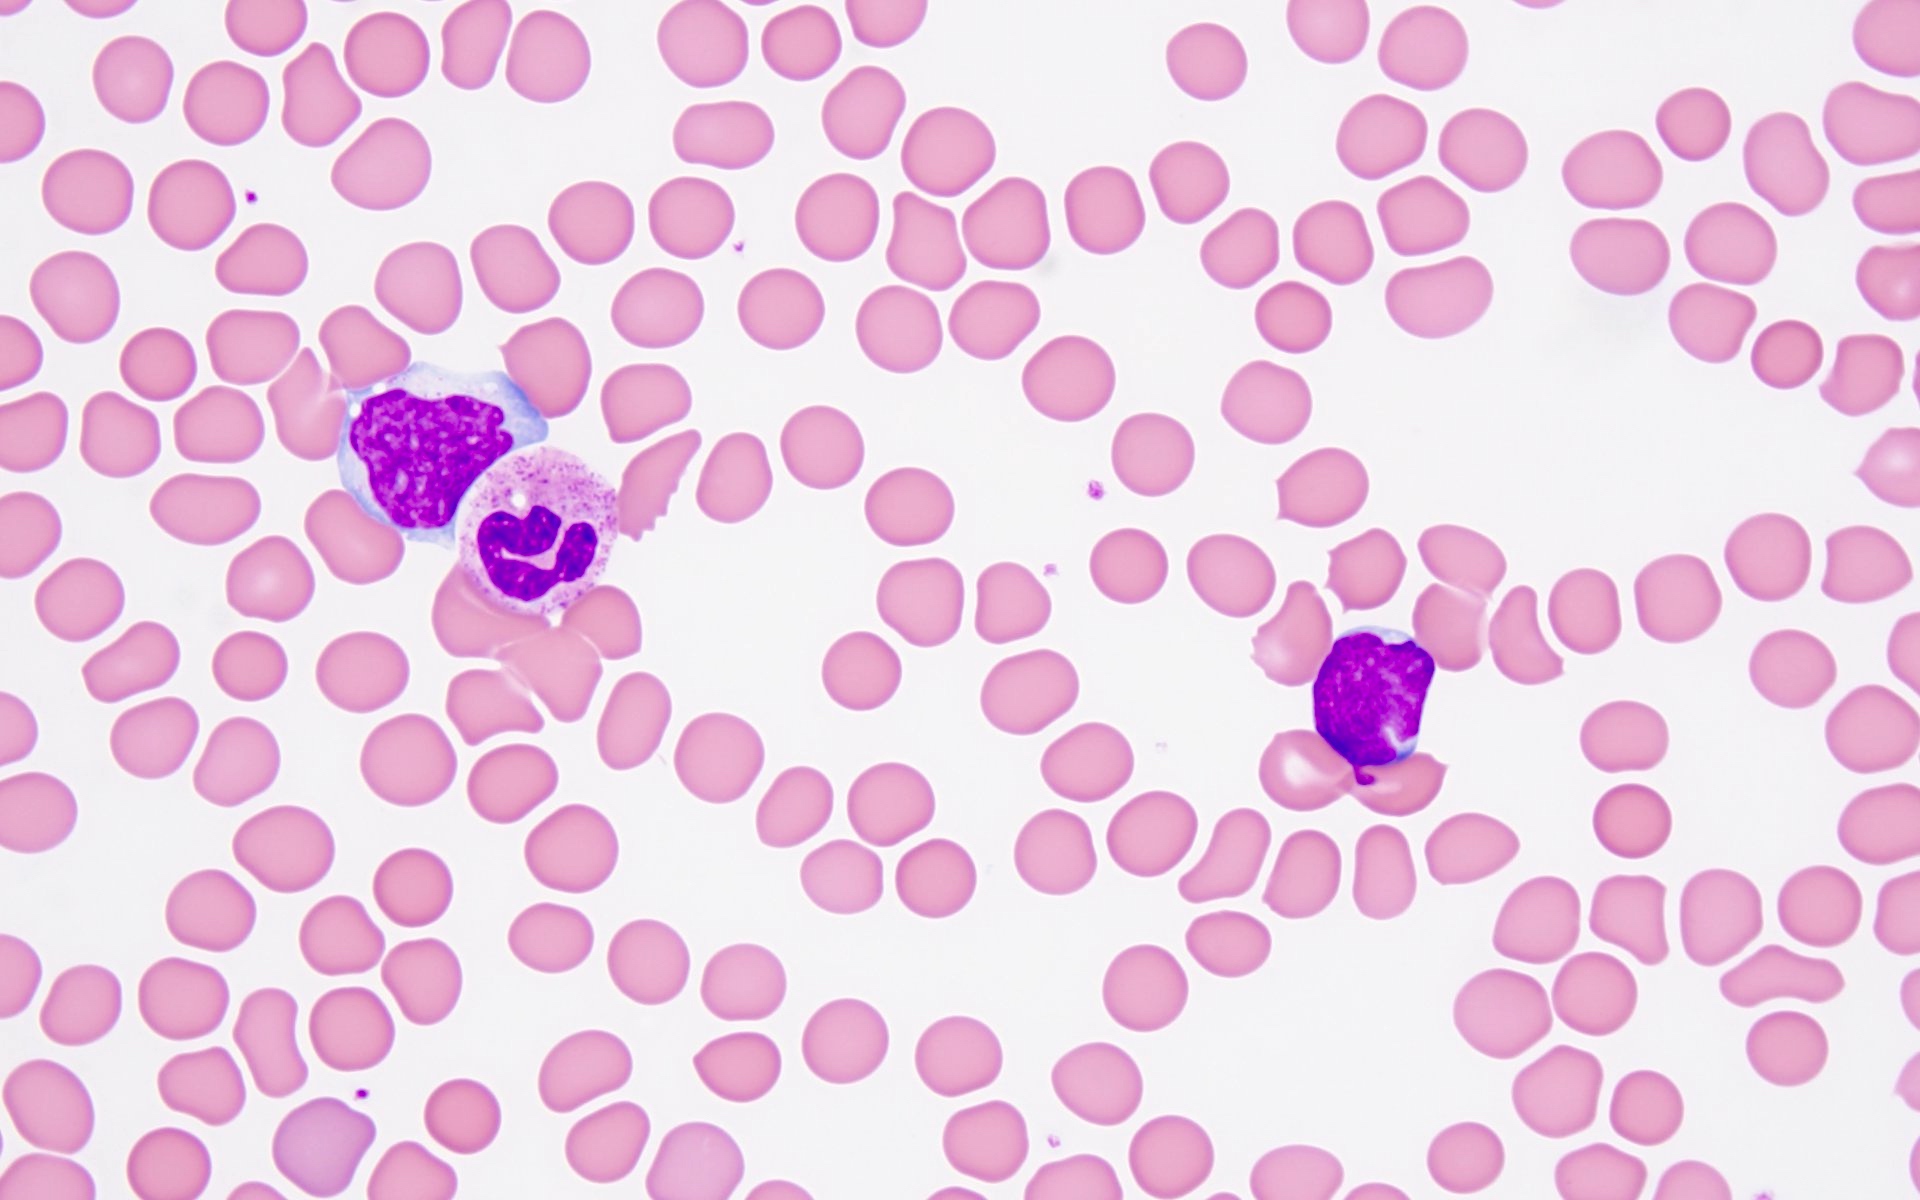
Circulating erythroblasts
AFIP images
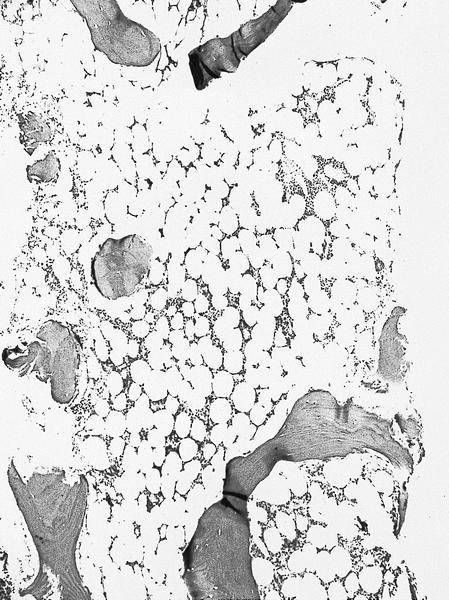
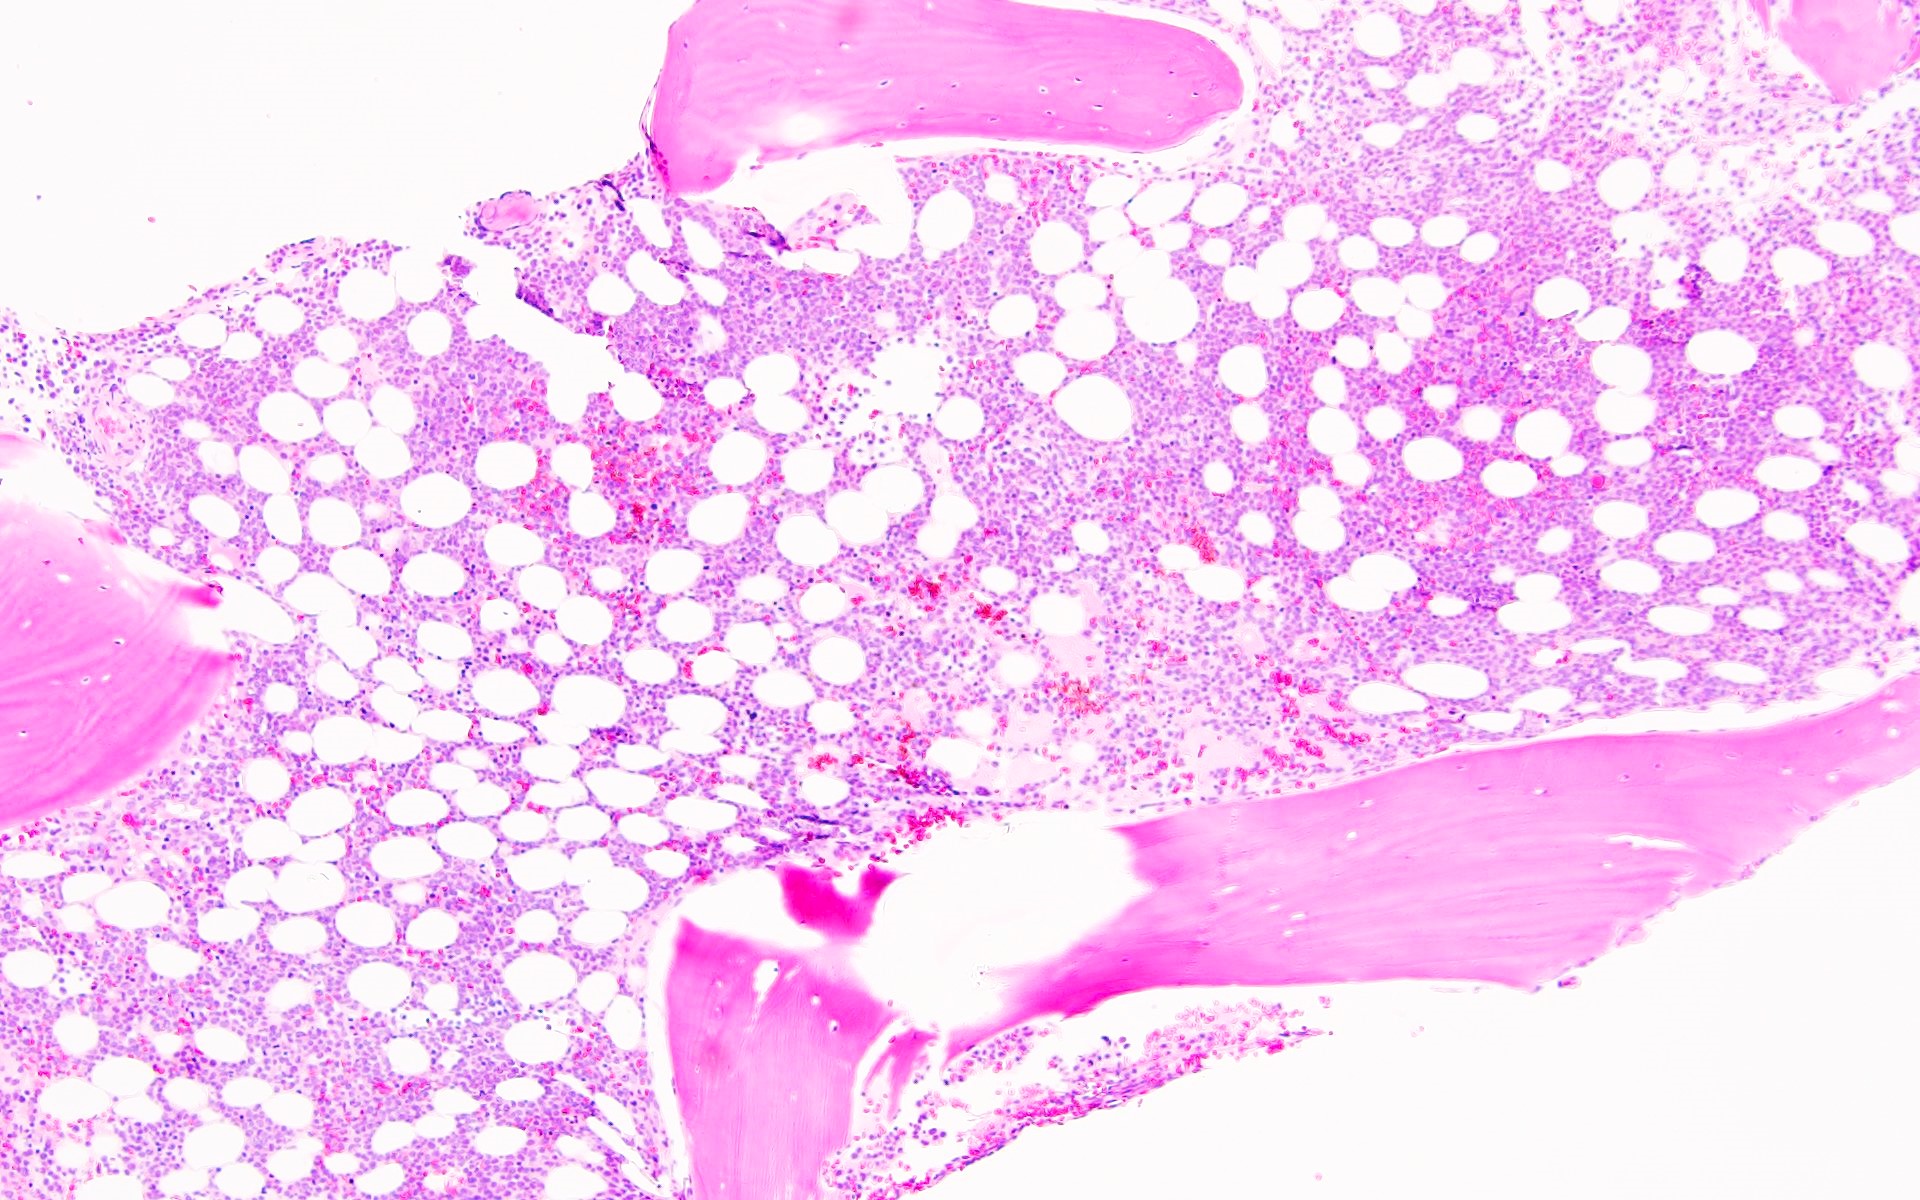
Markedly hypocellular marrow
Cells in interstitium are predominantly blasts
Contributed by Kristin Karner, M.D.
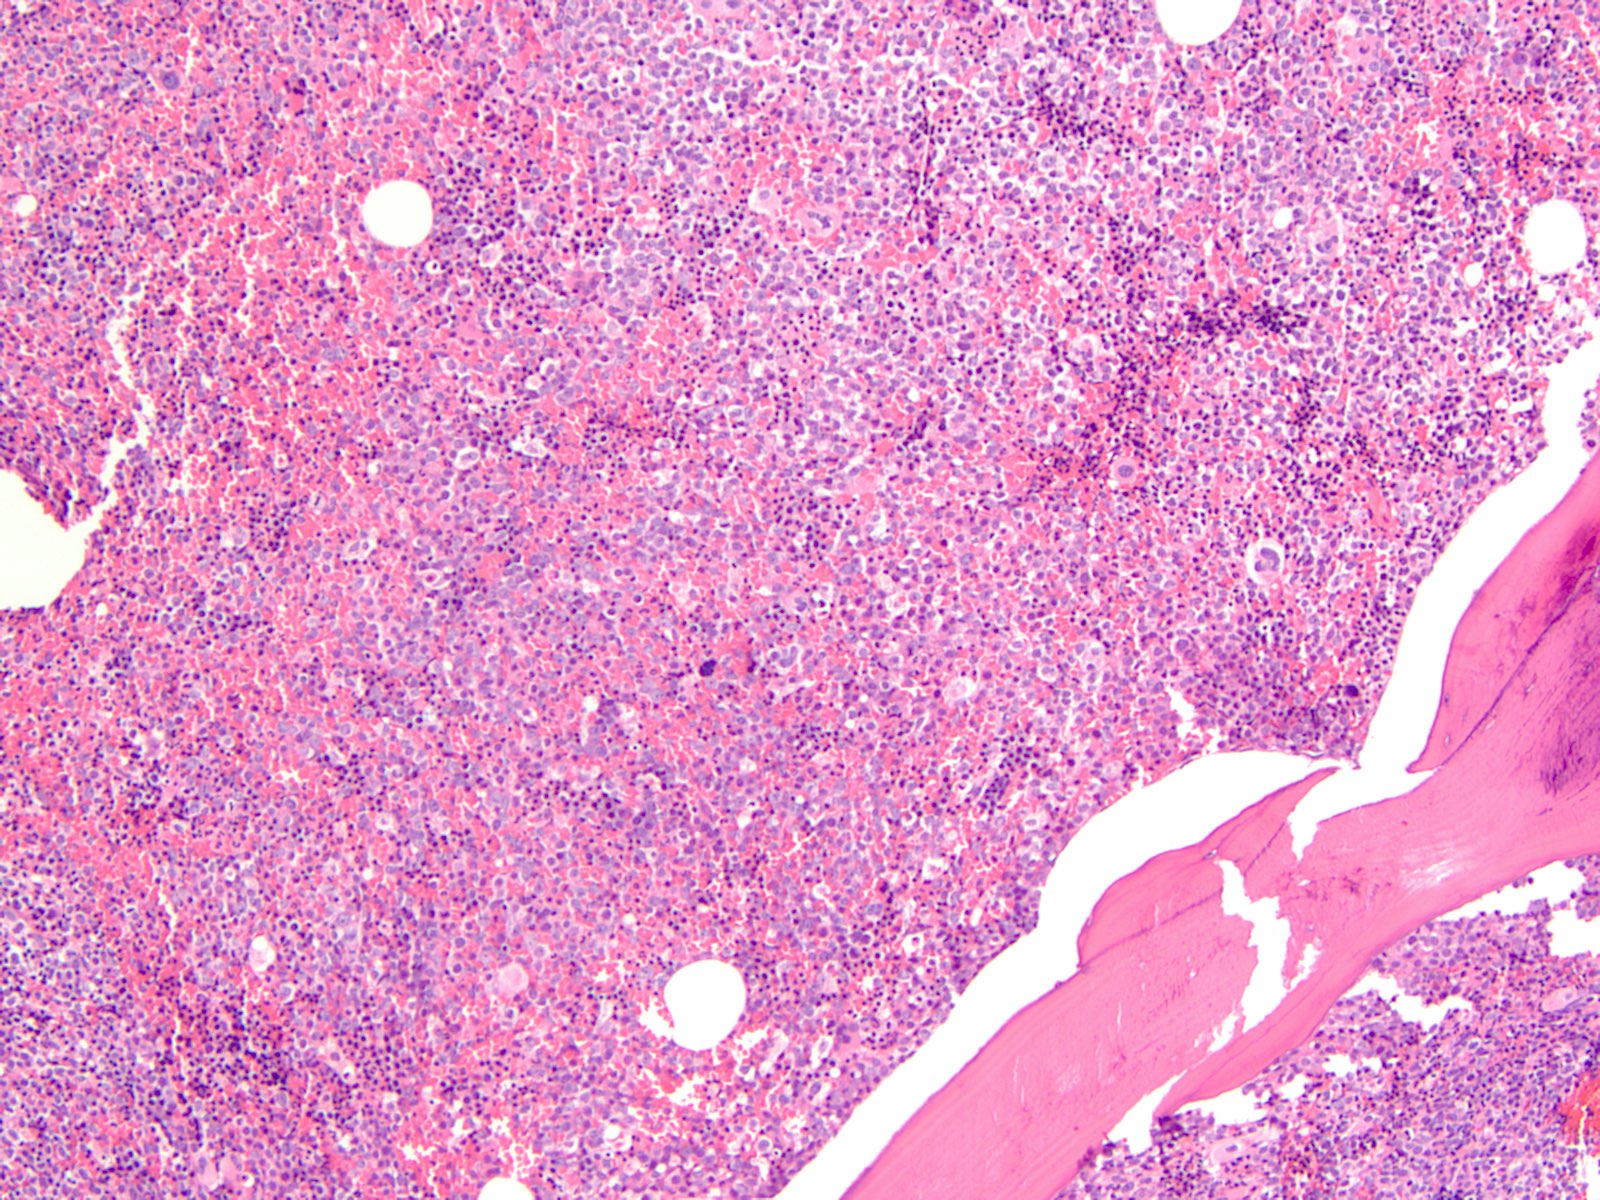
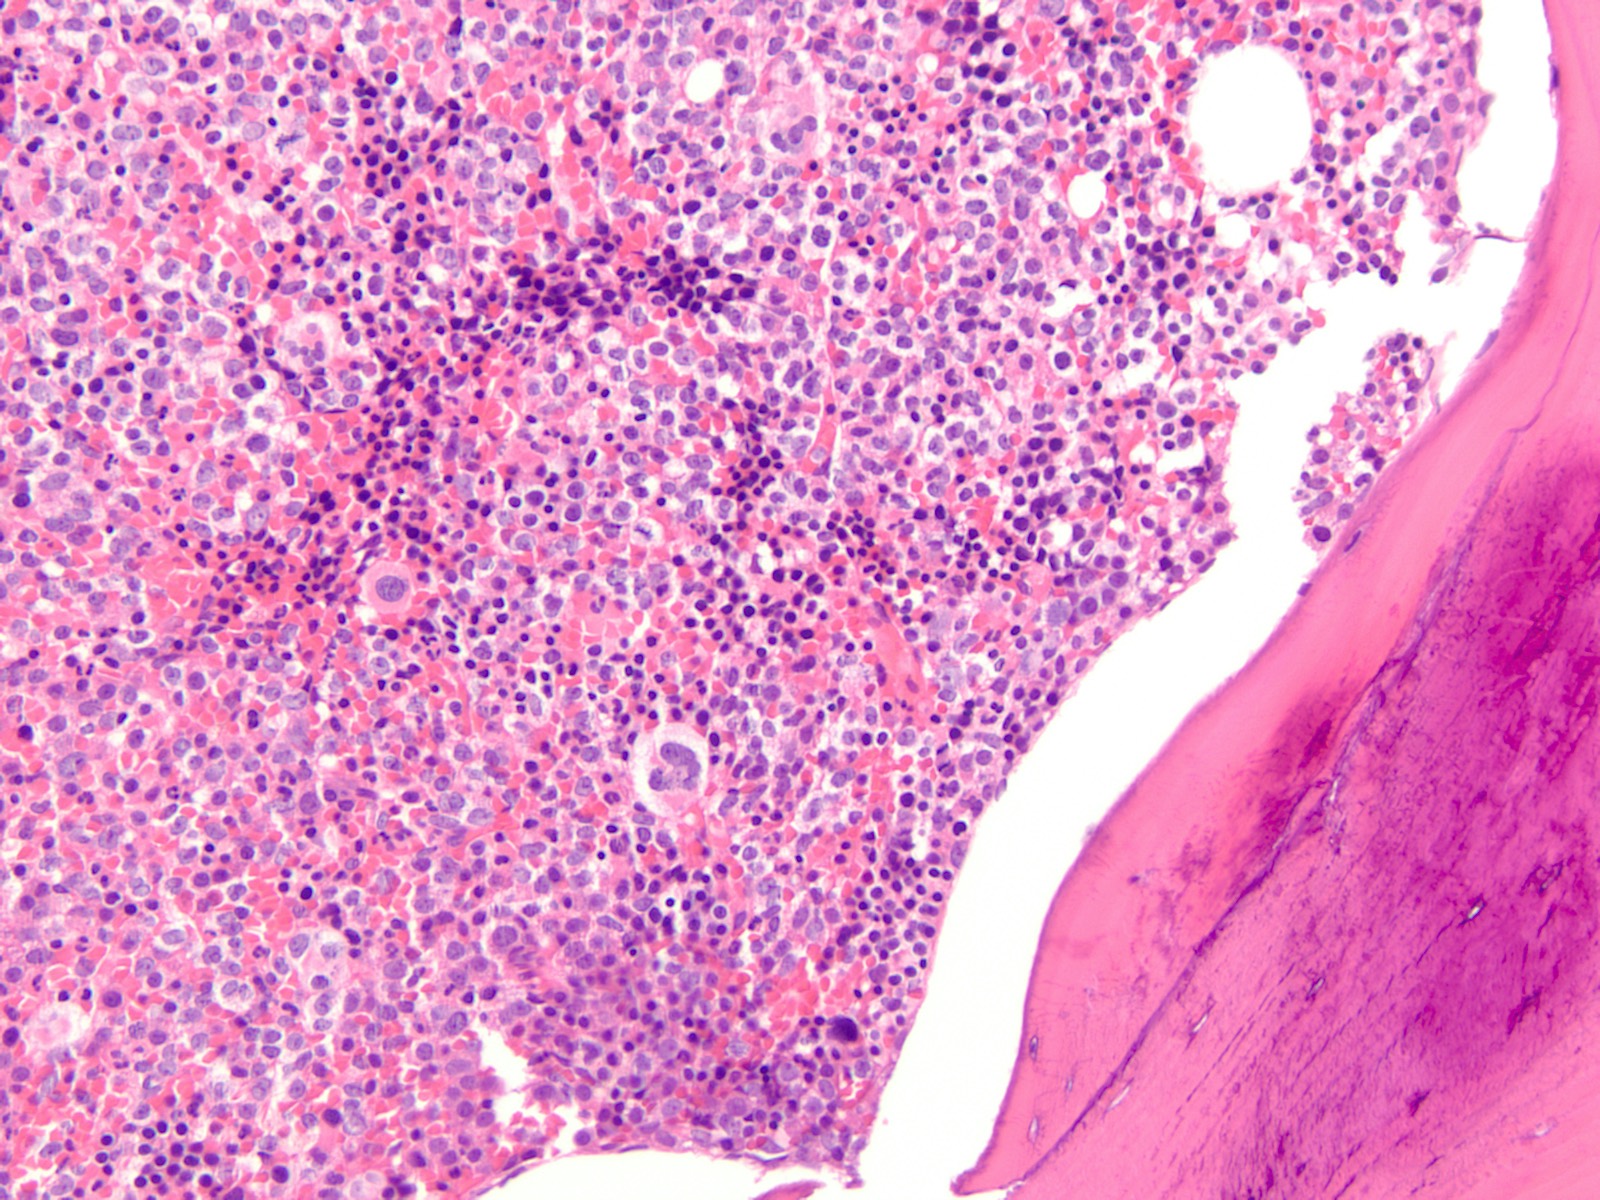
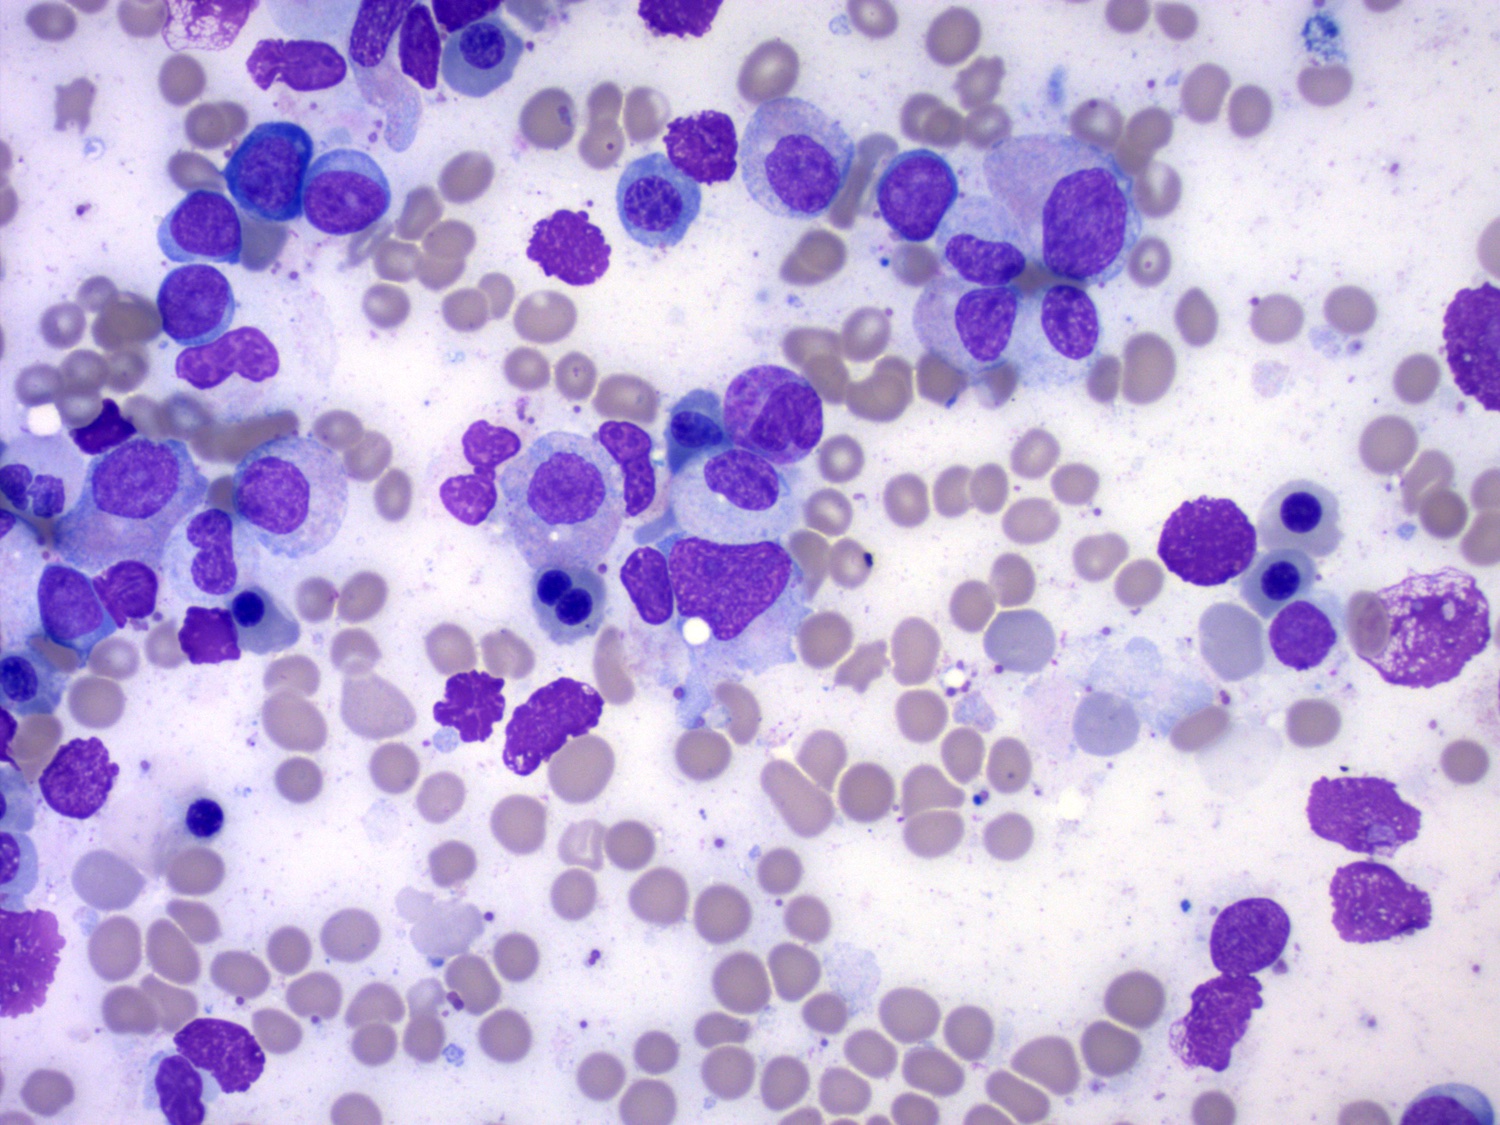
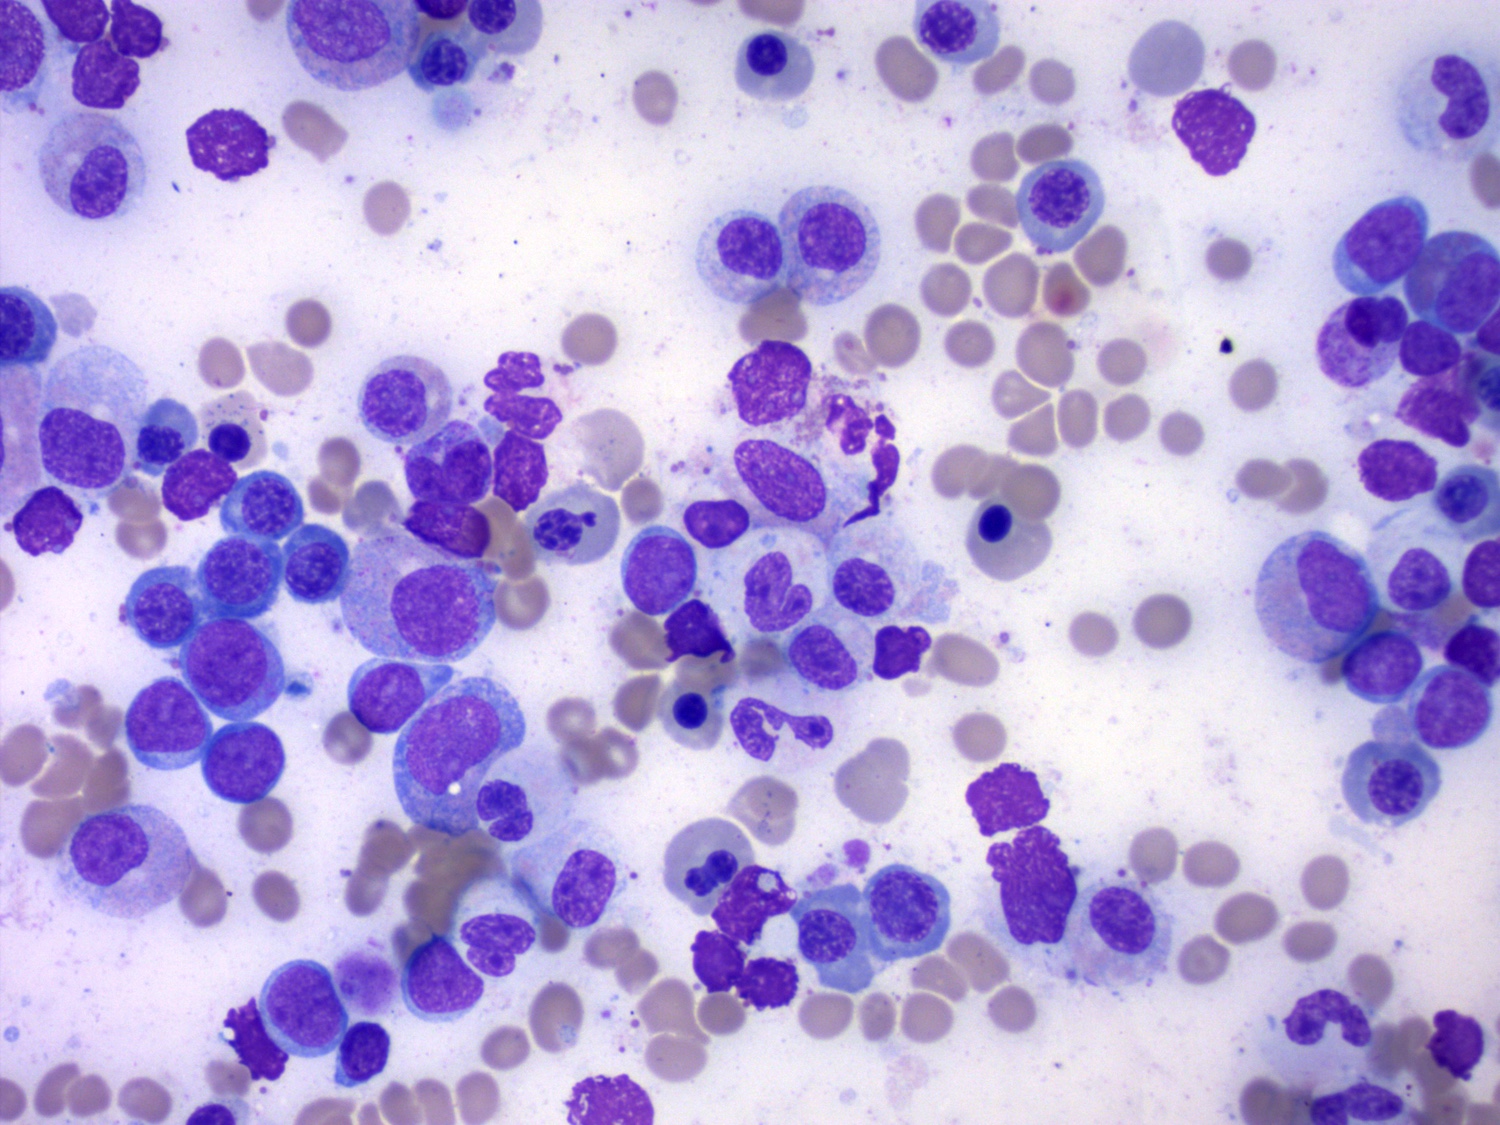
Blasts infiltrating the marrow
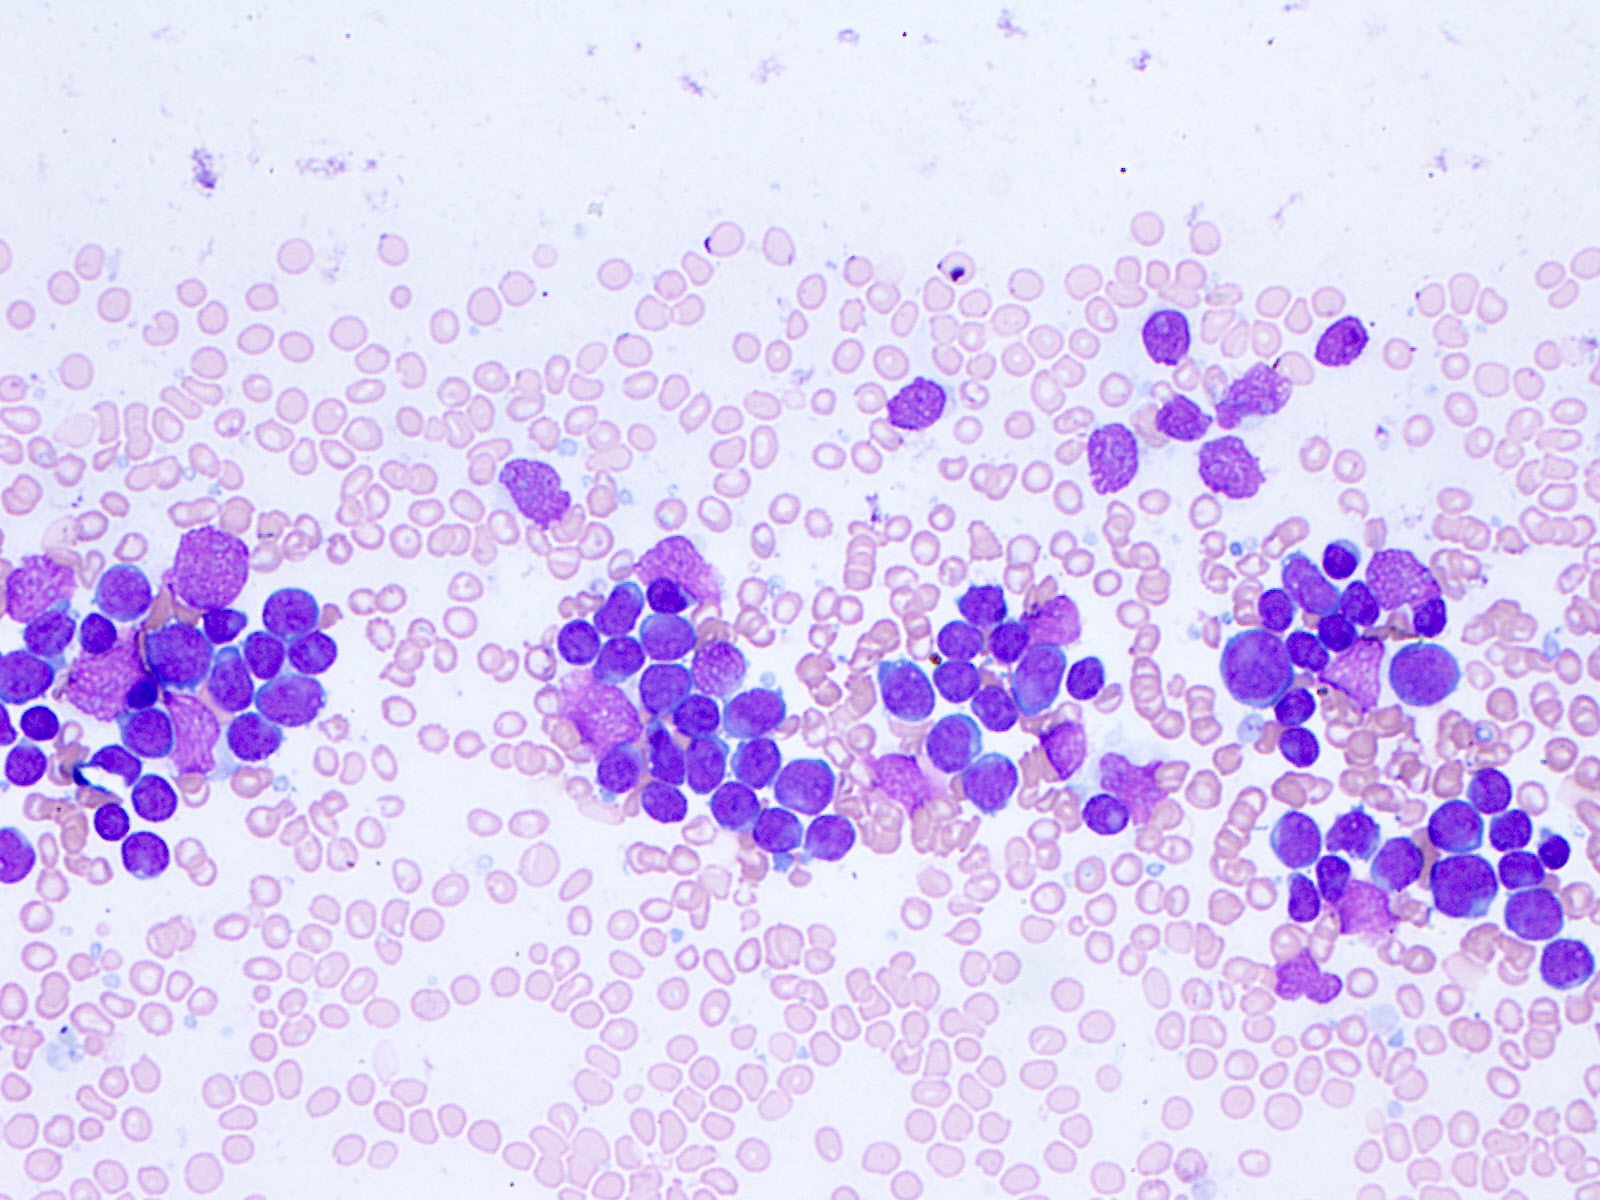
Blasts on aspirate smear
Contributed by Kristin Karner, M.D.
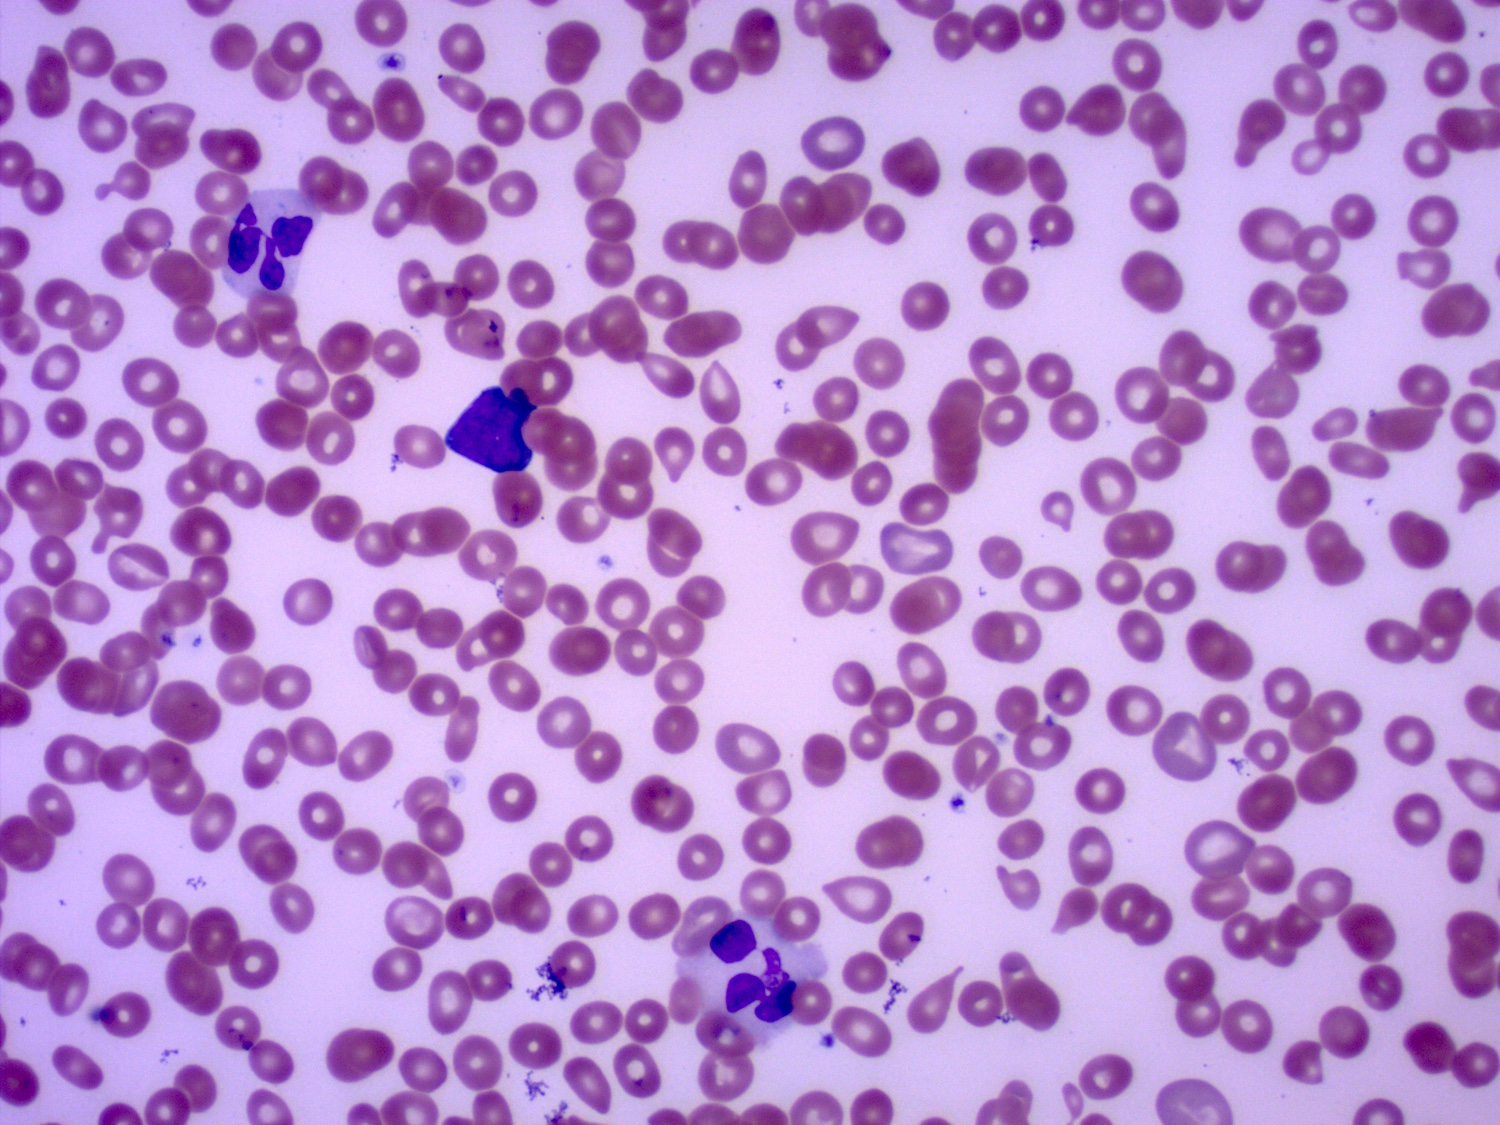
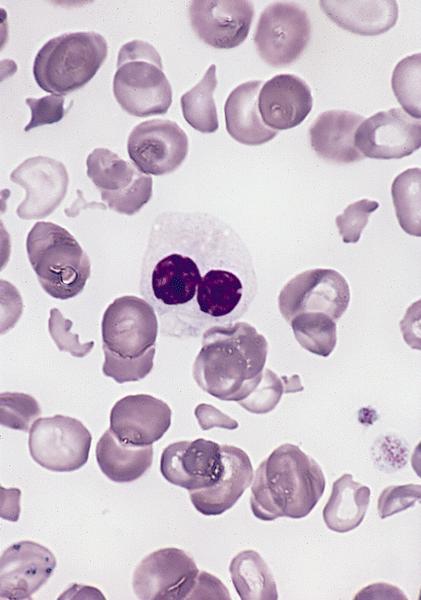
Blasts in peripheral blood
Contributed by Jessica Corean, M.D.
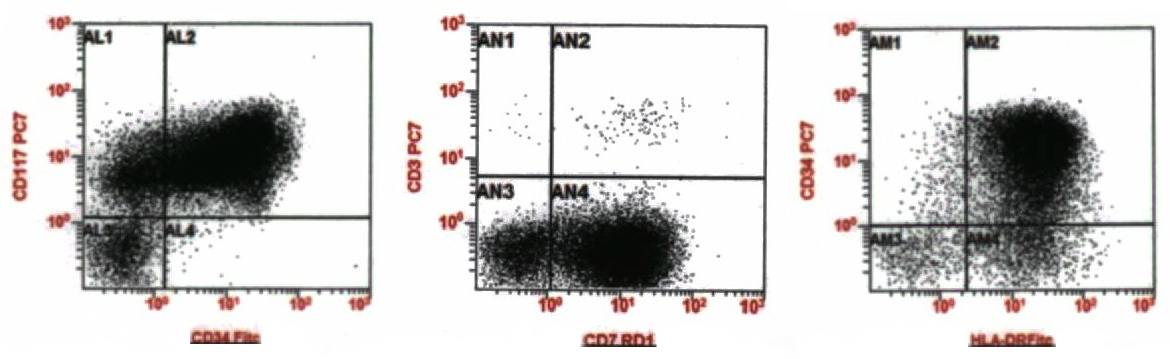
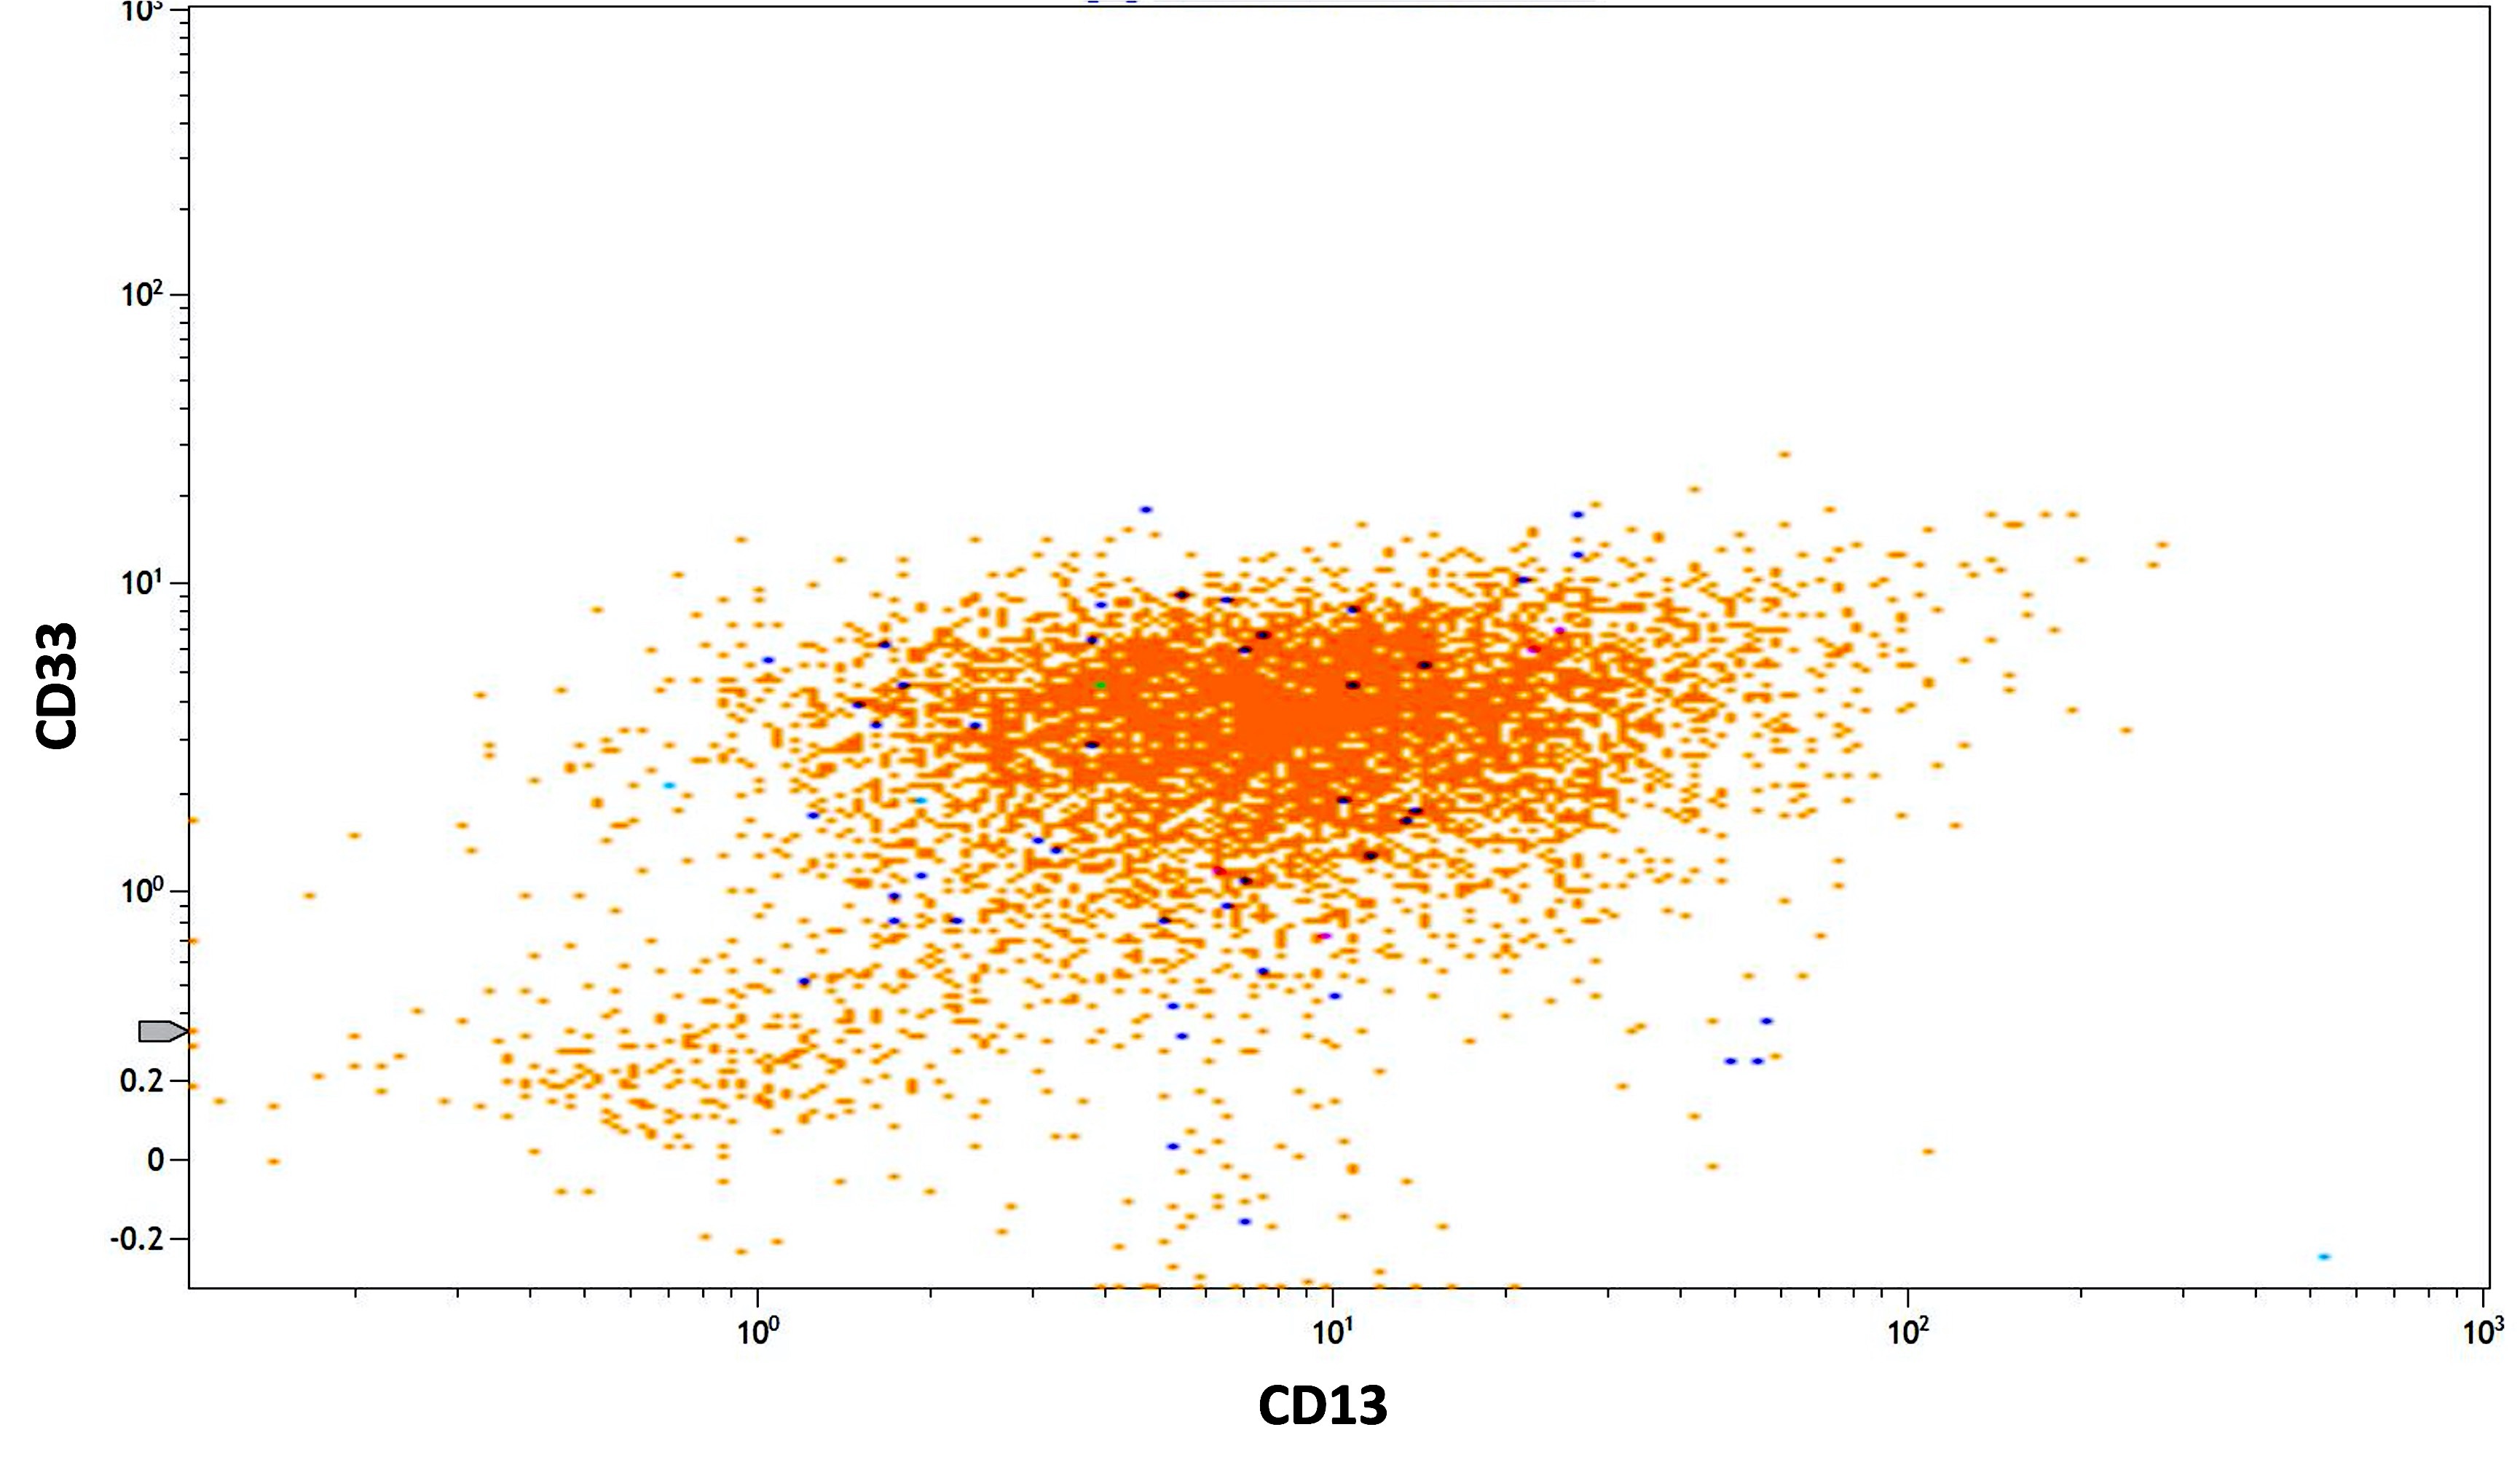
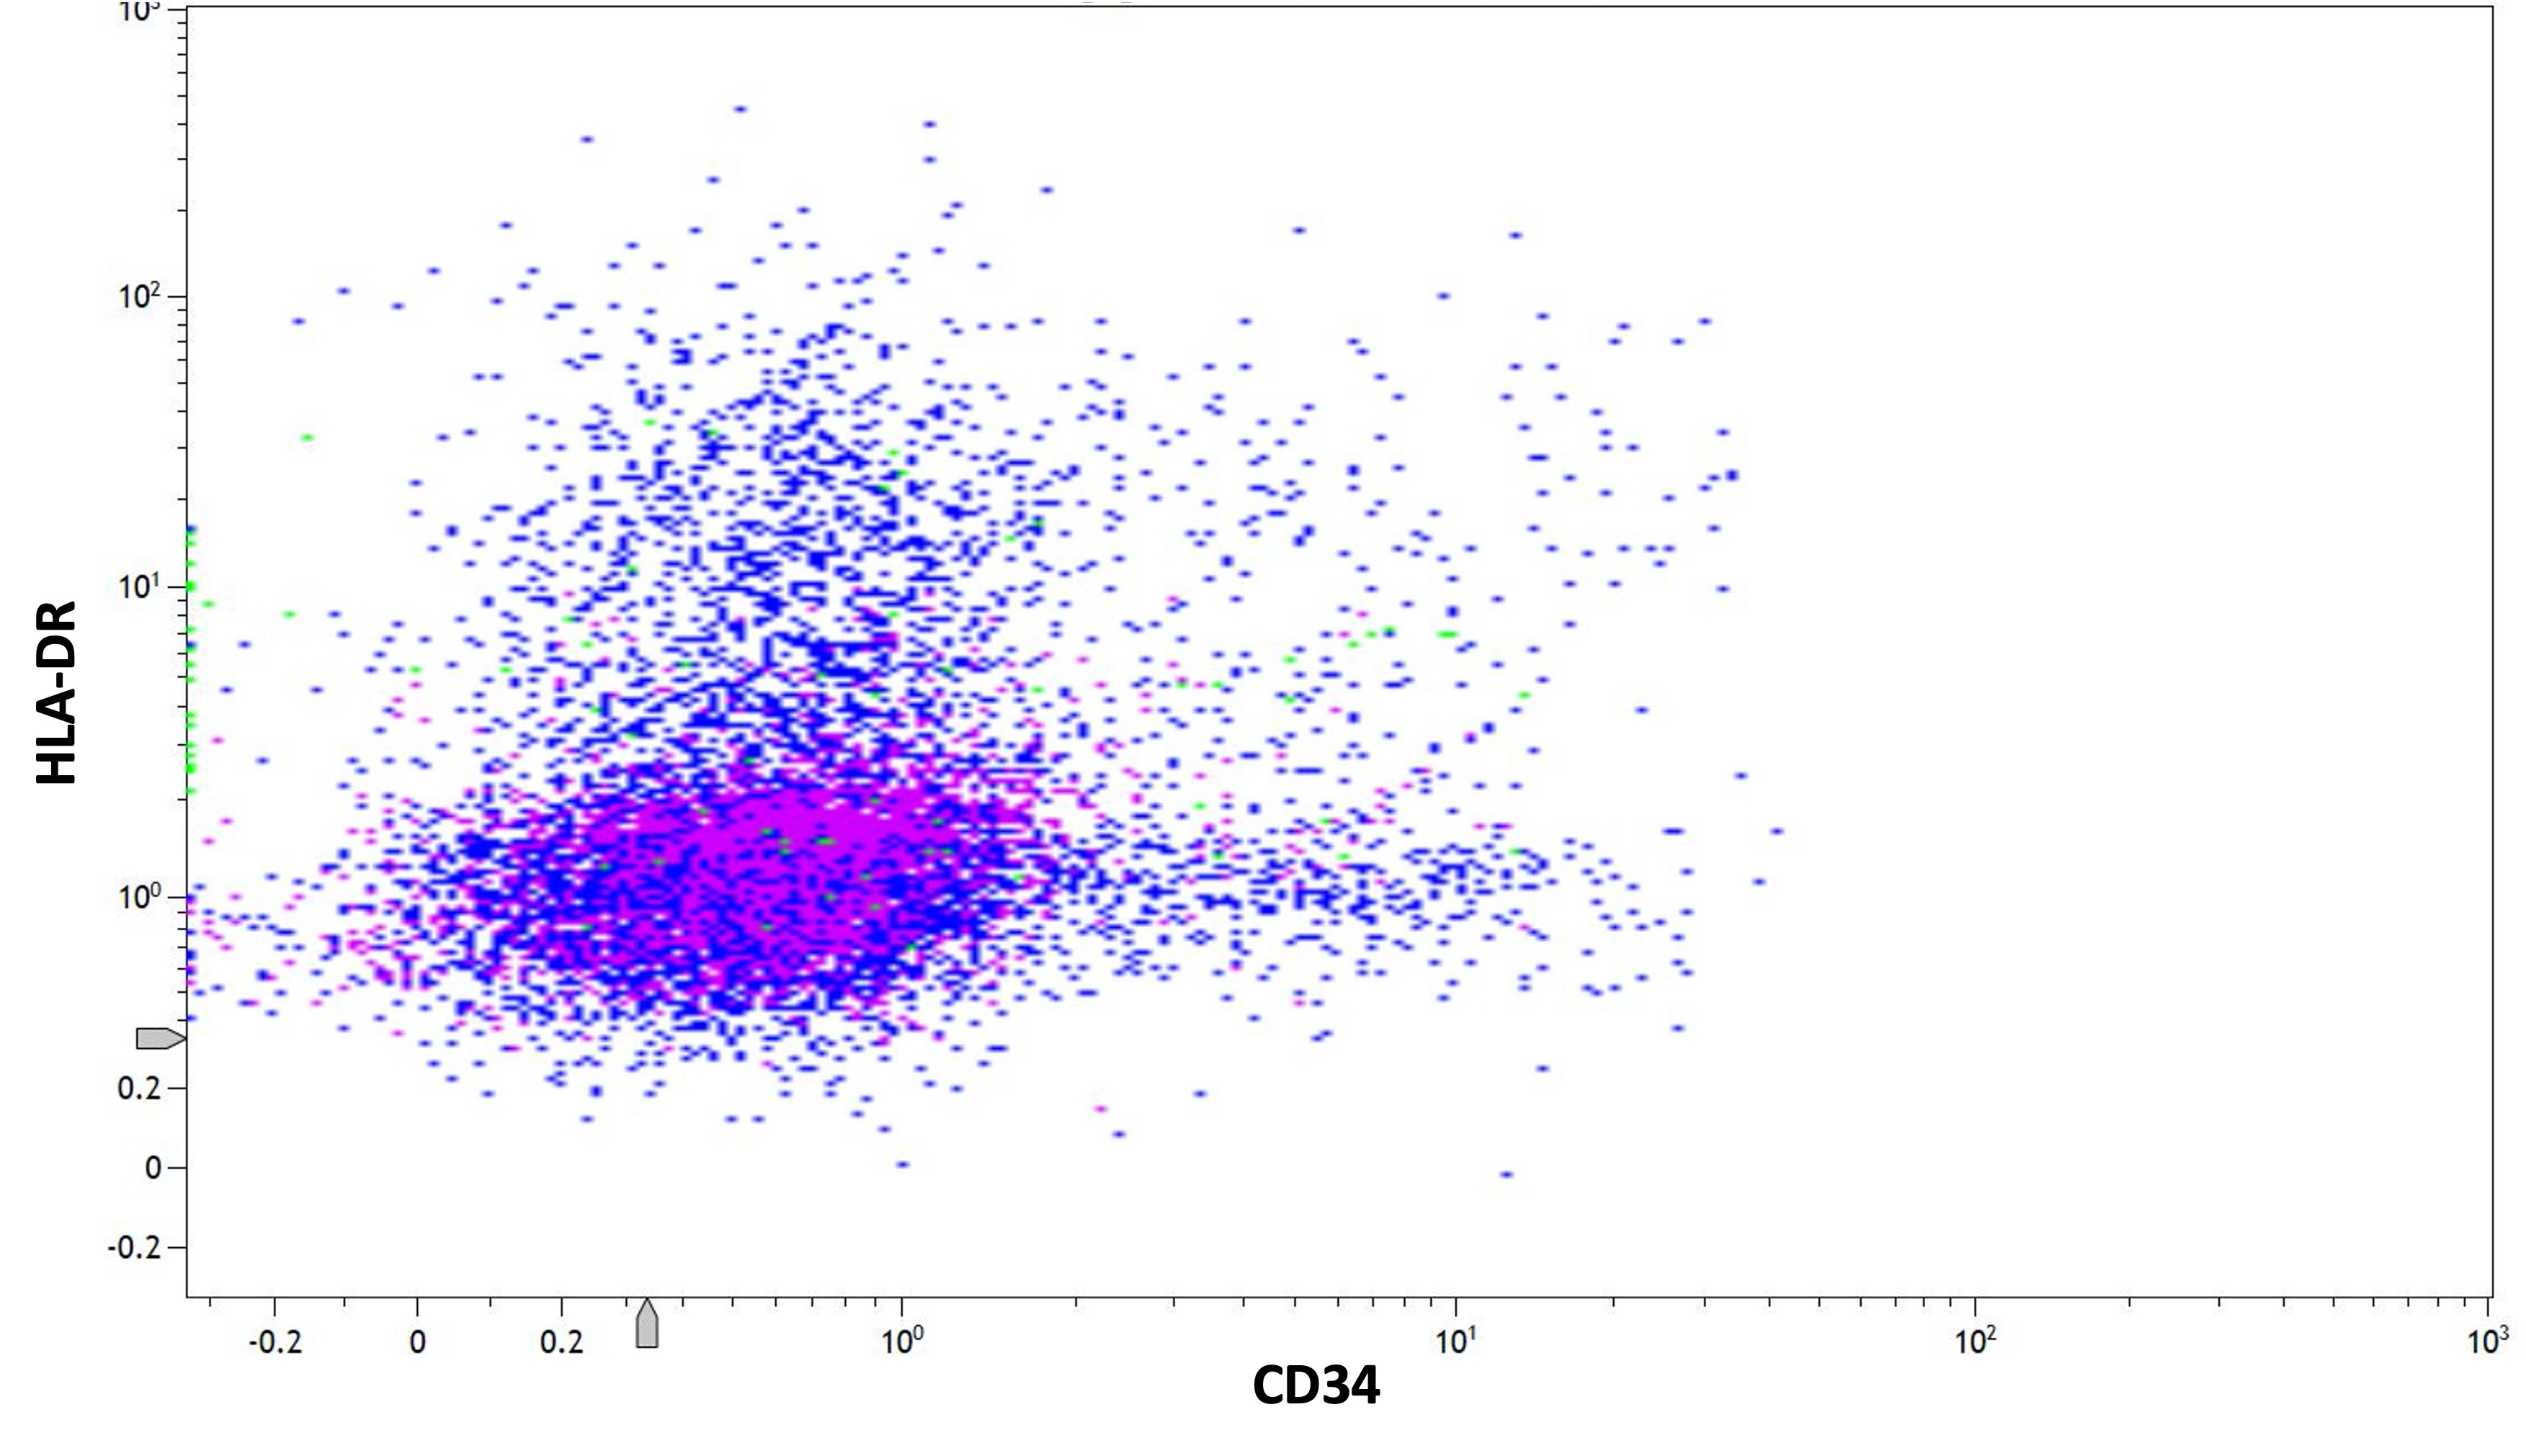
Typical immunophenotype
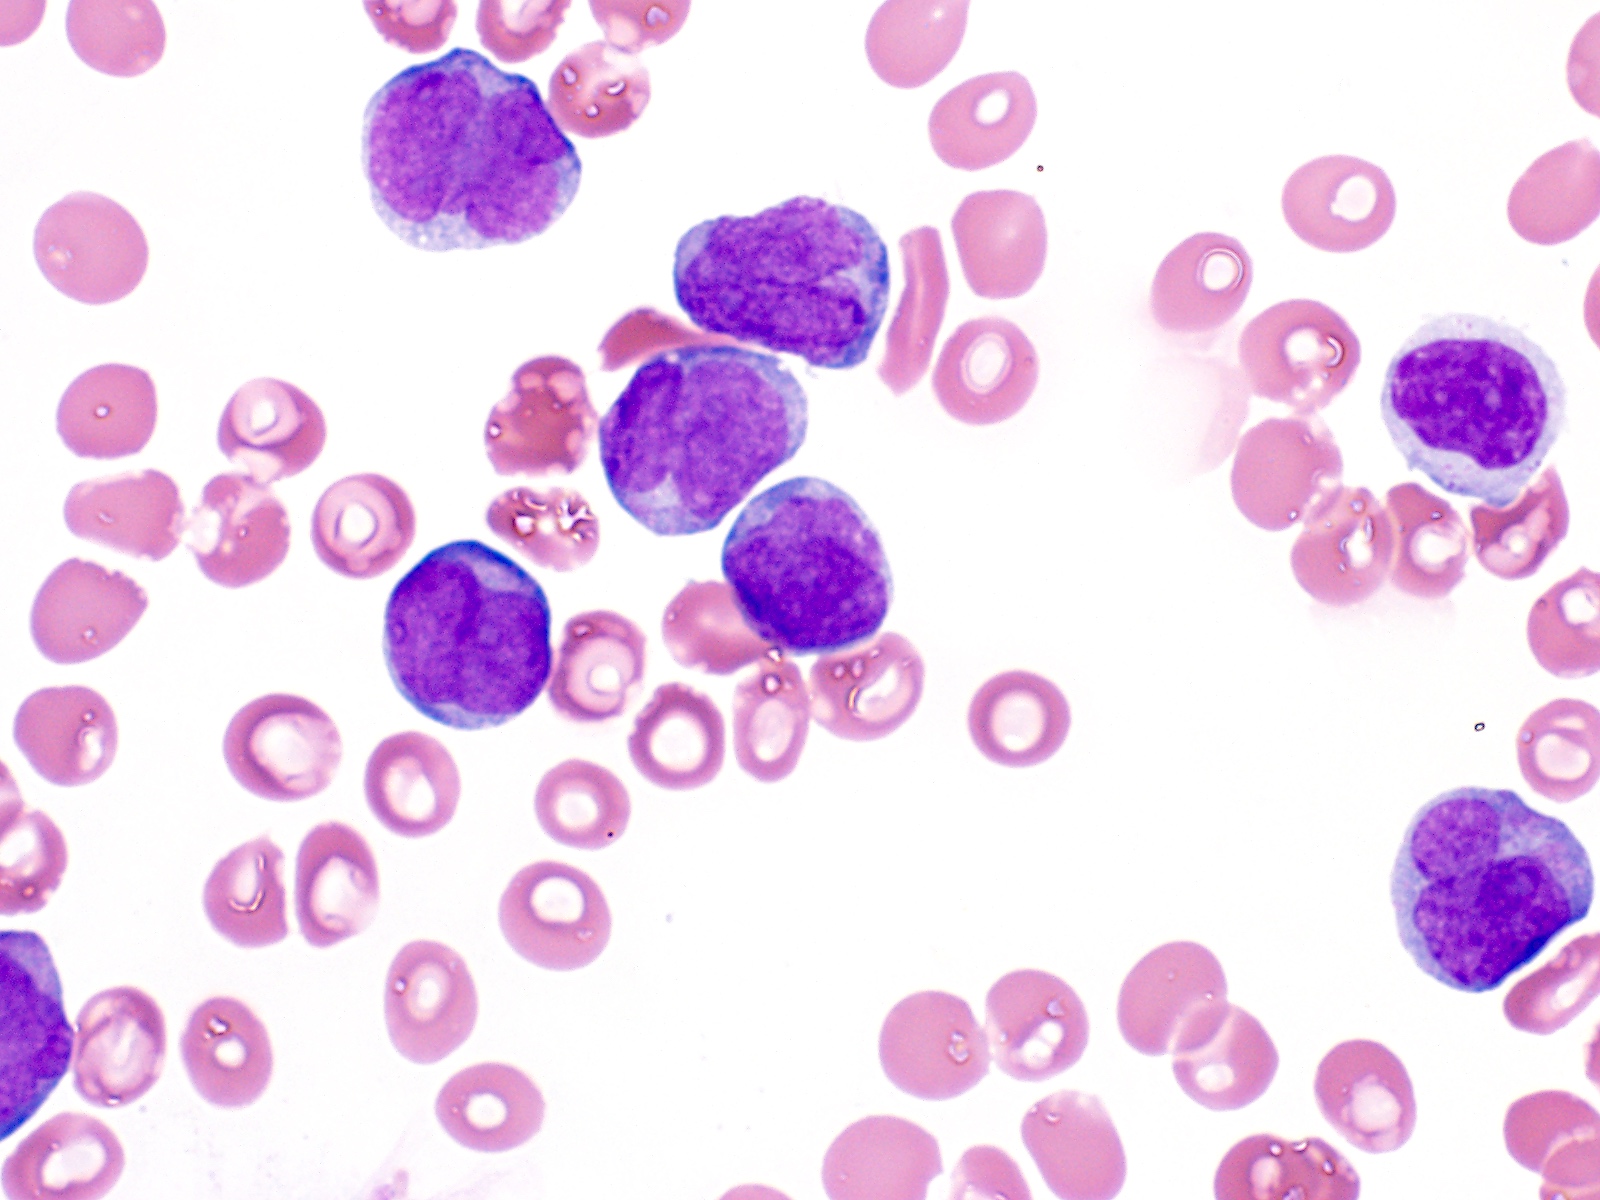
Contributed by Barina Aqil, M.D.
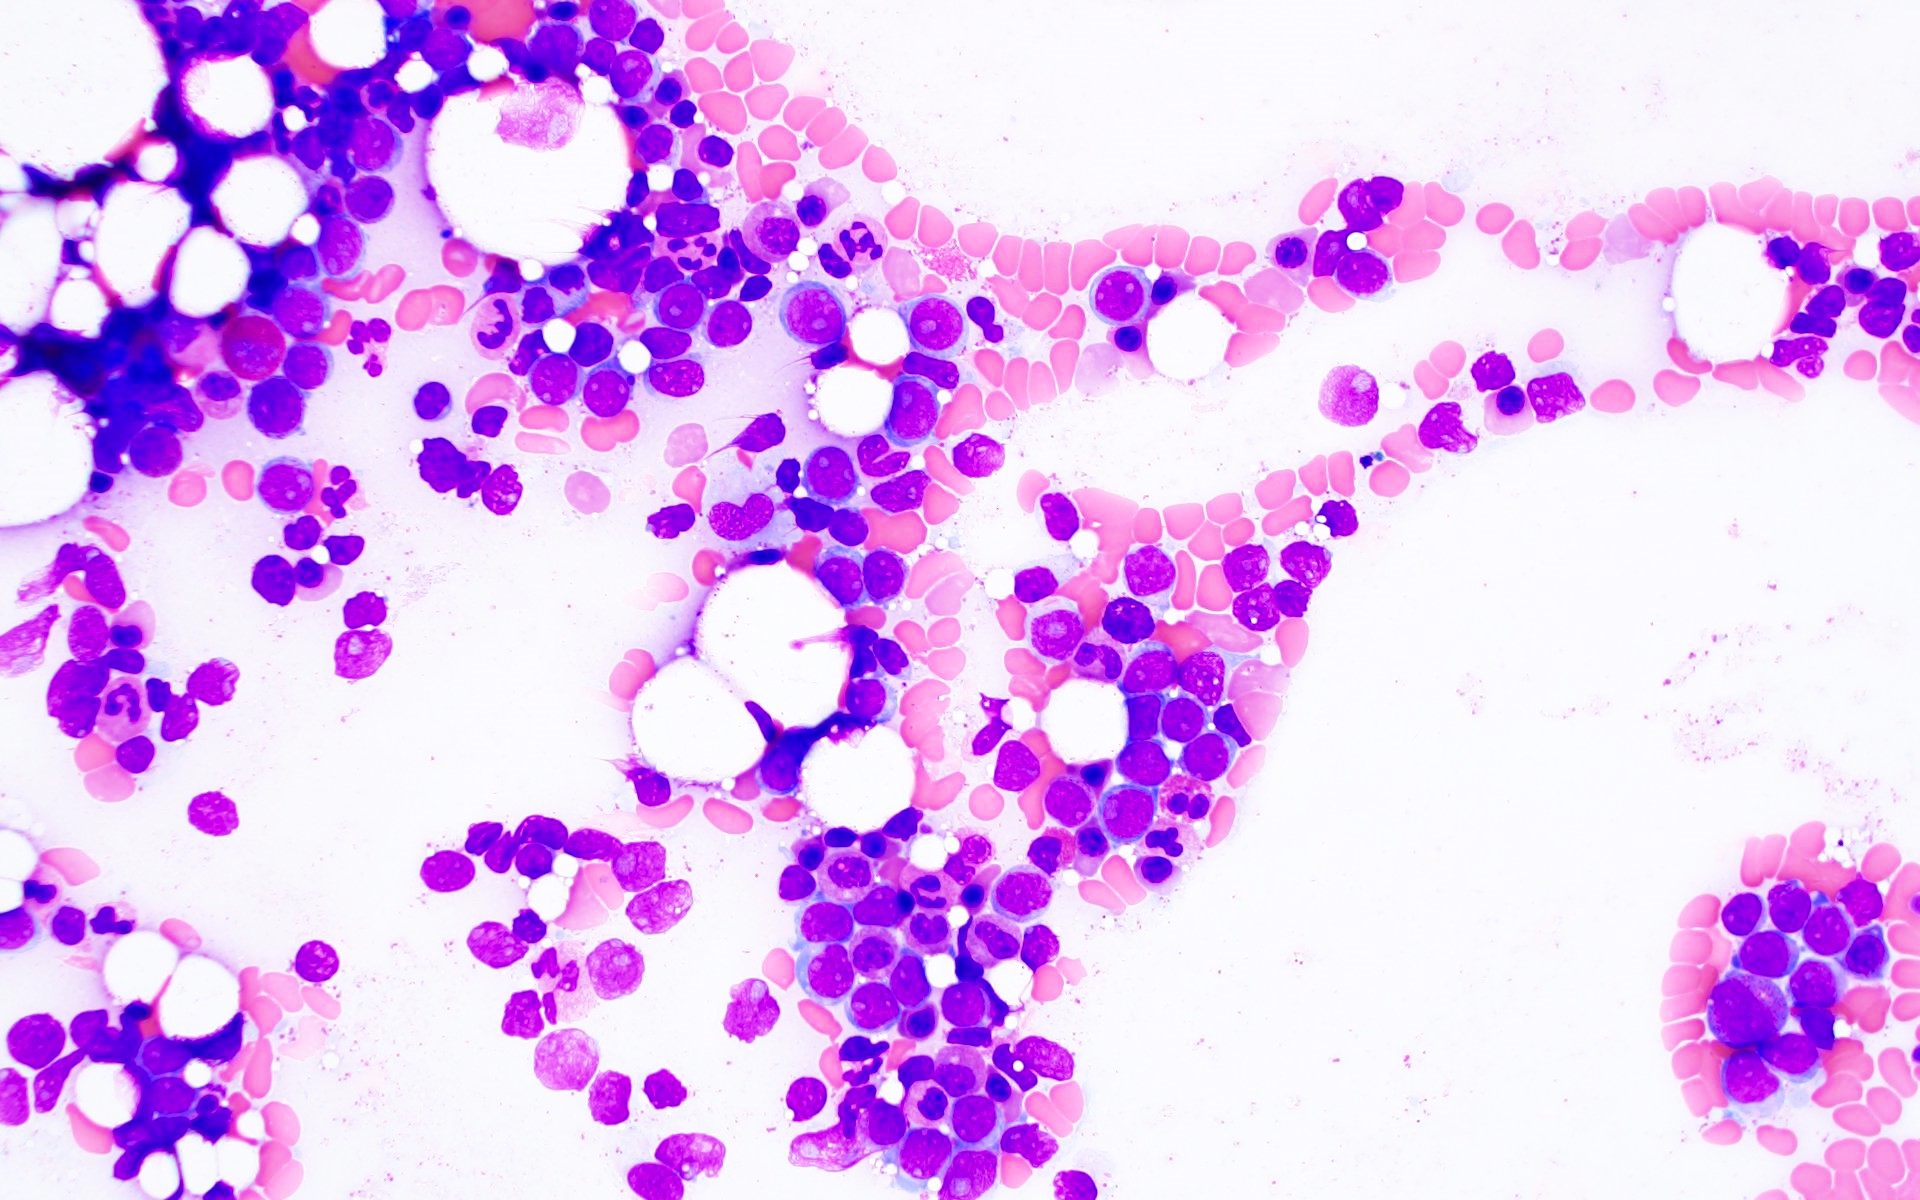
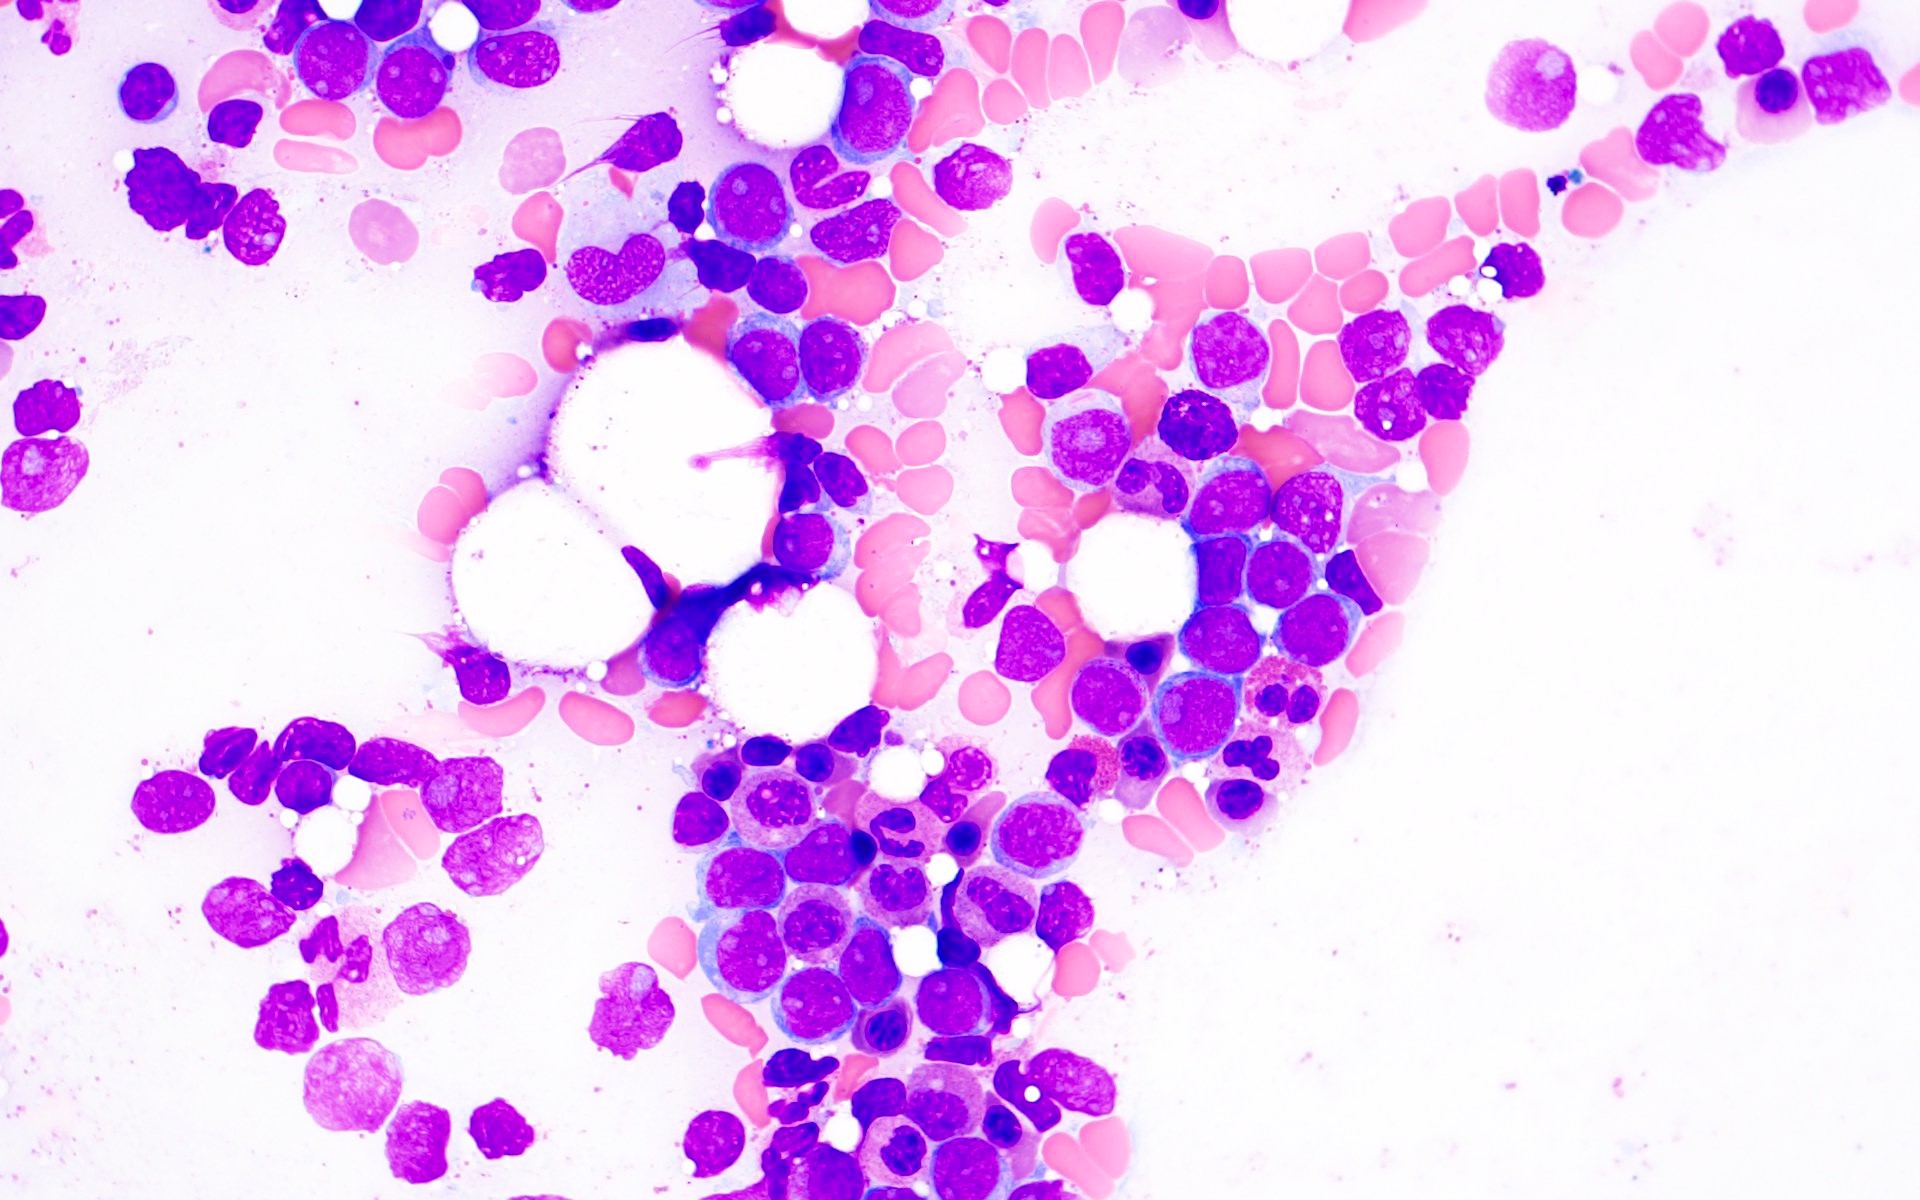
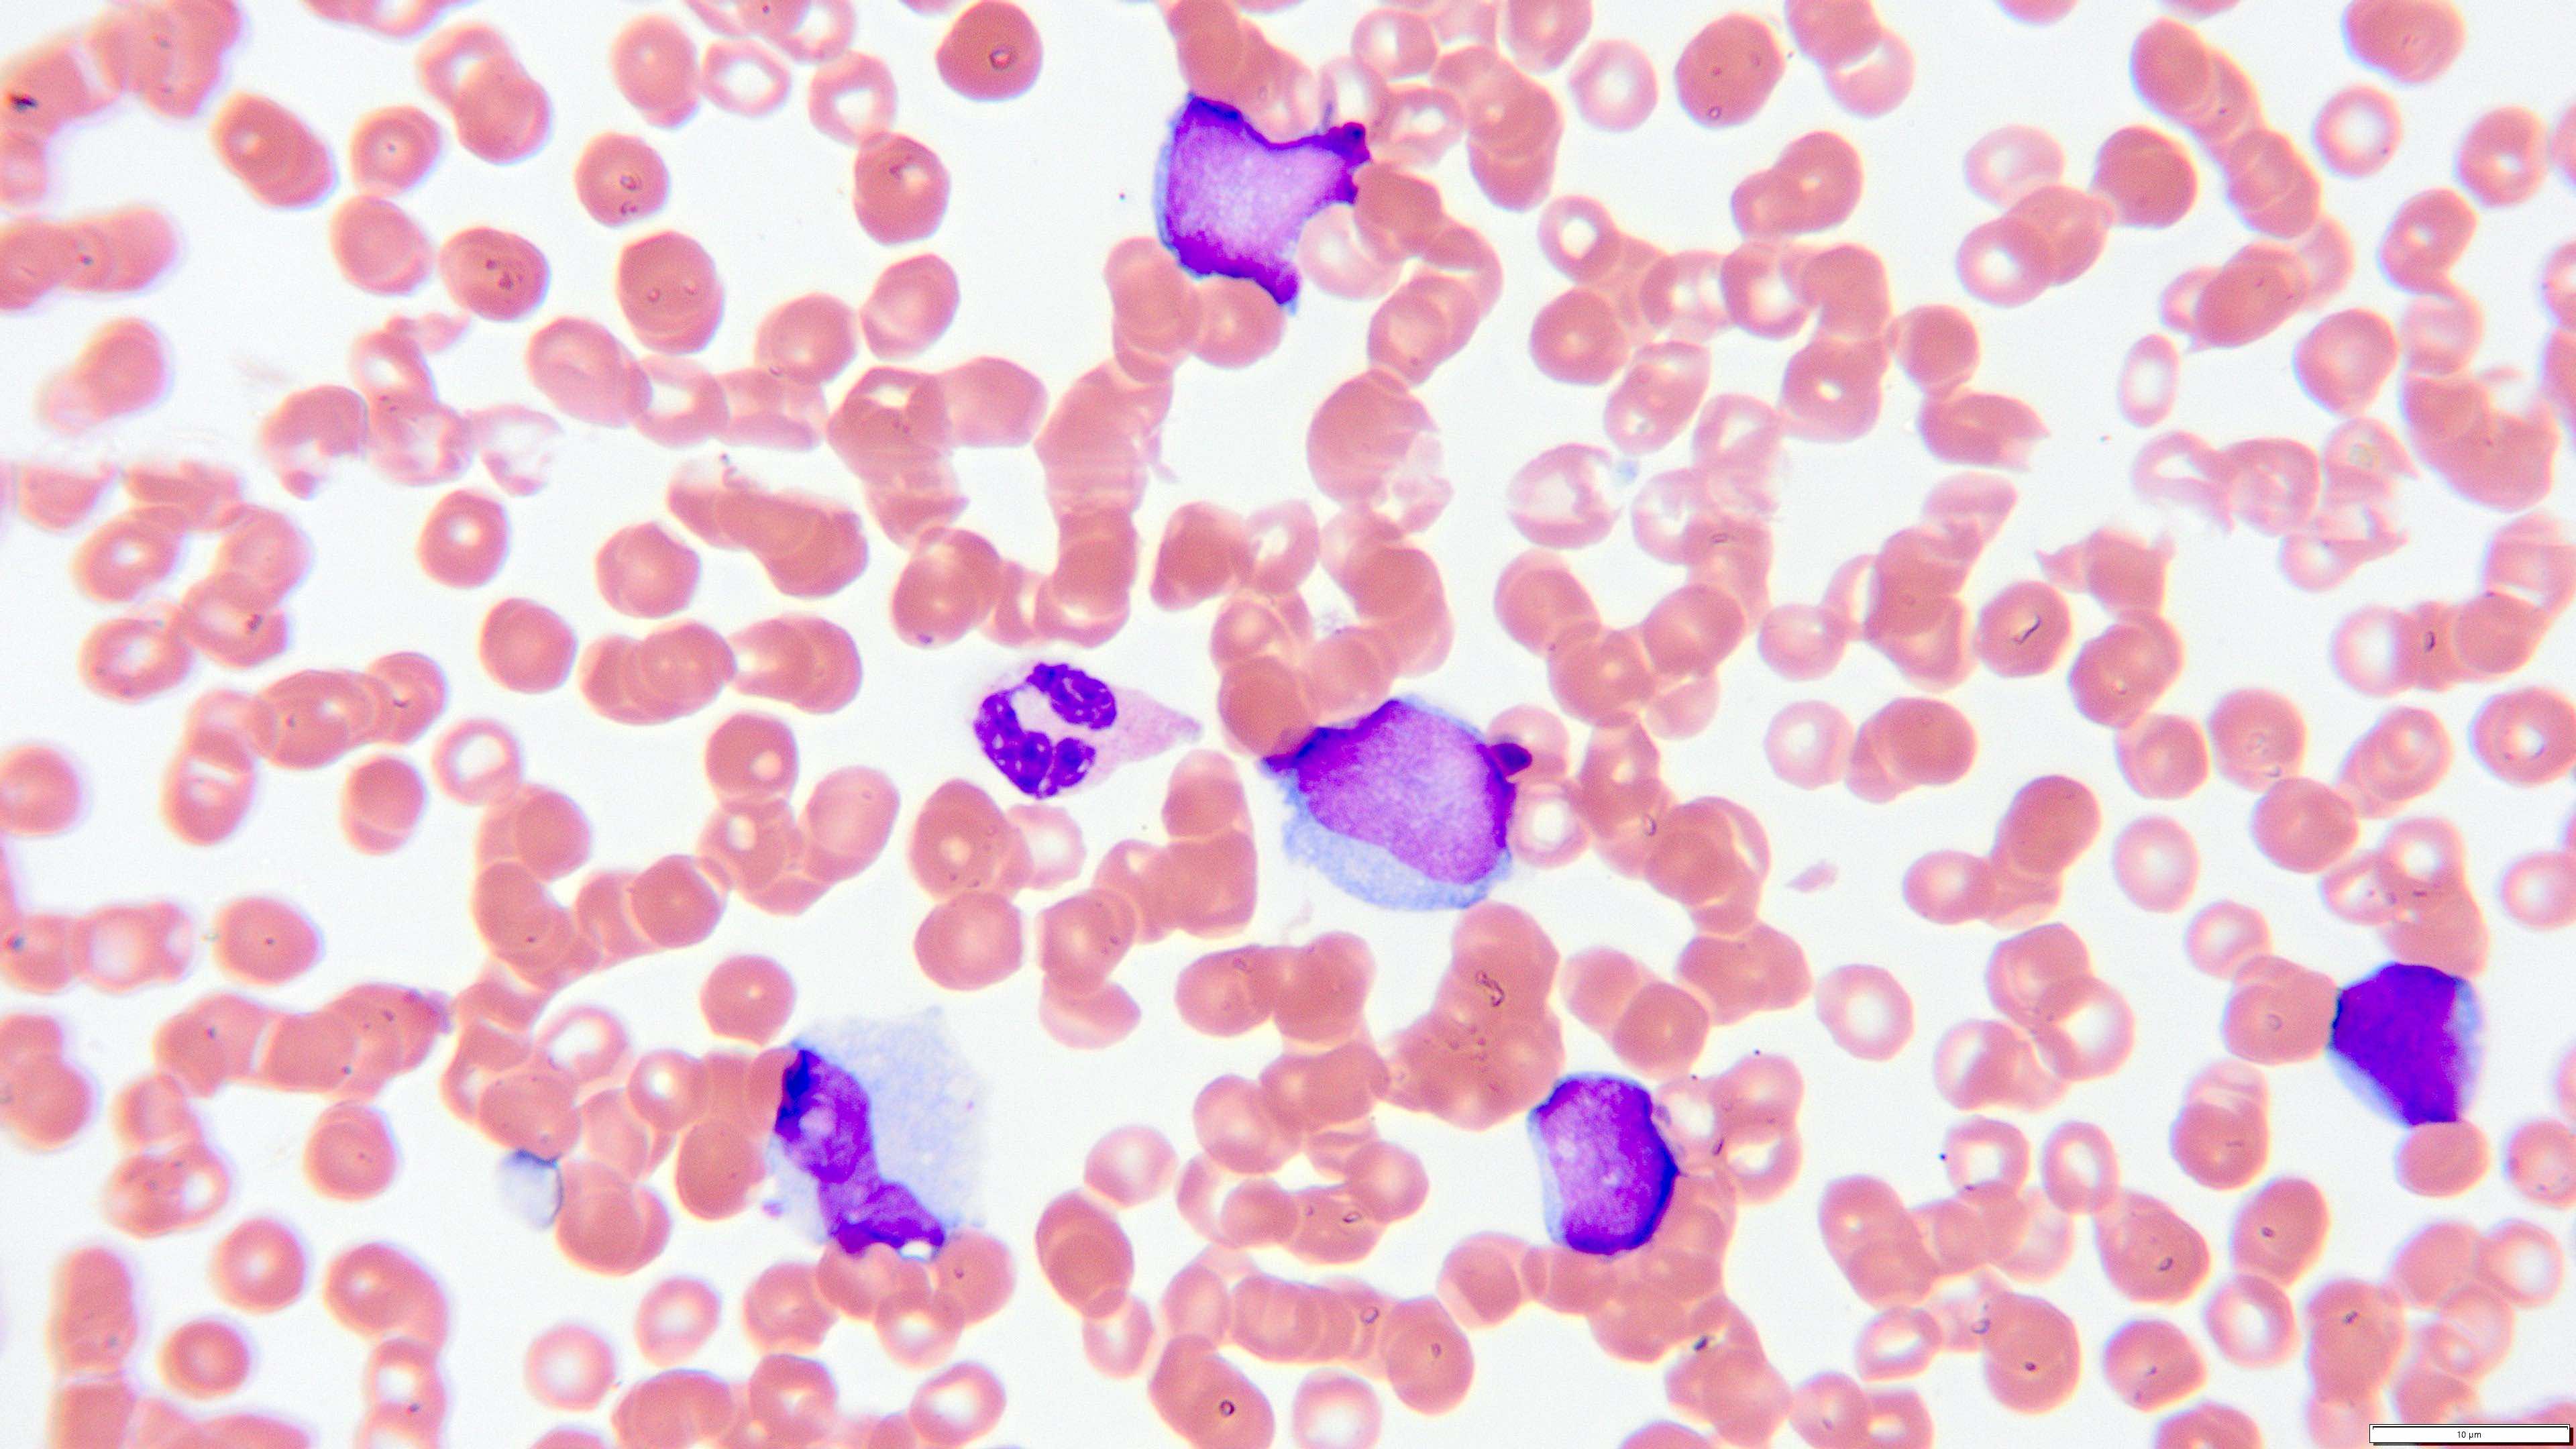
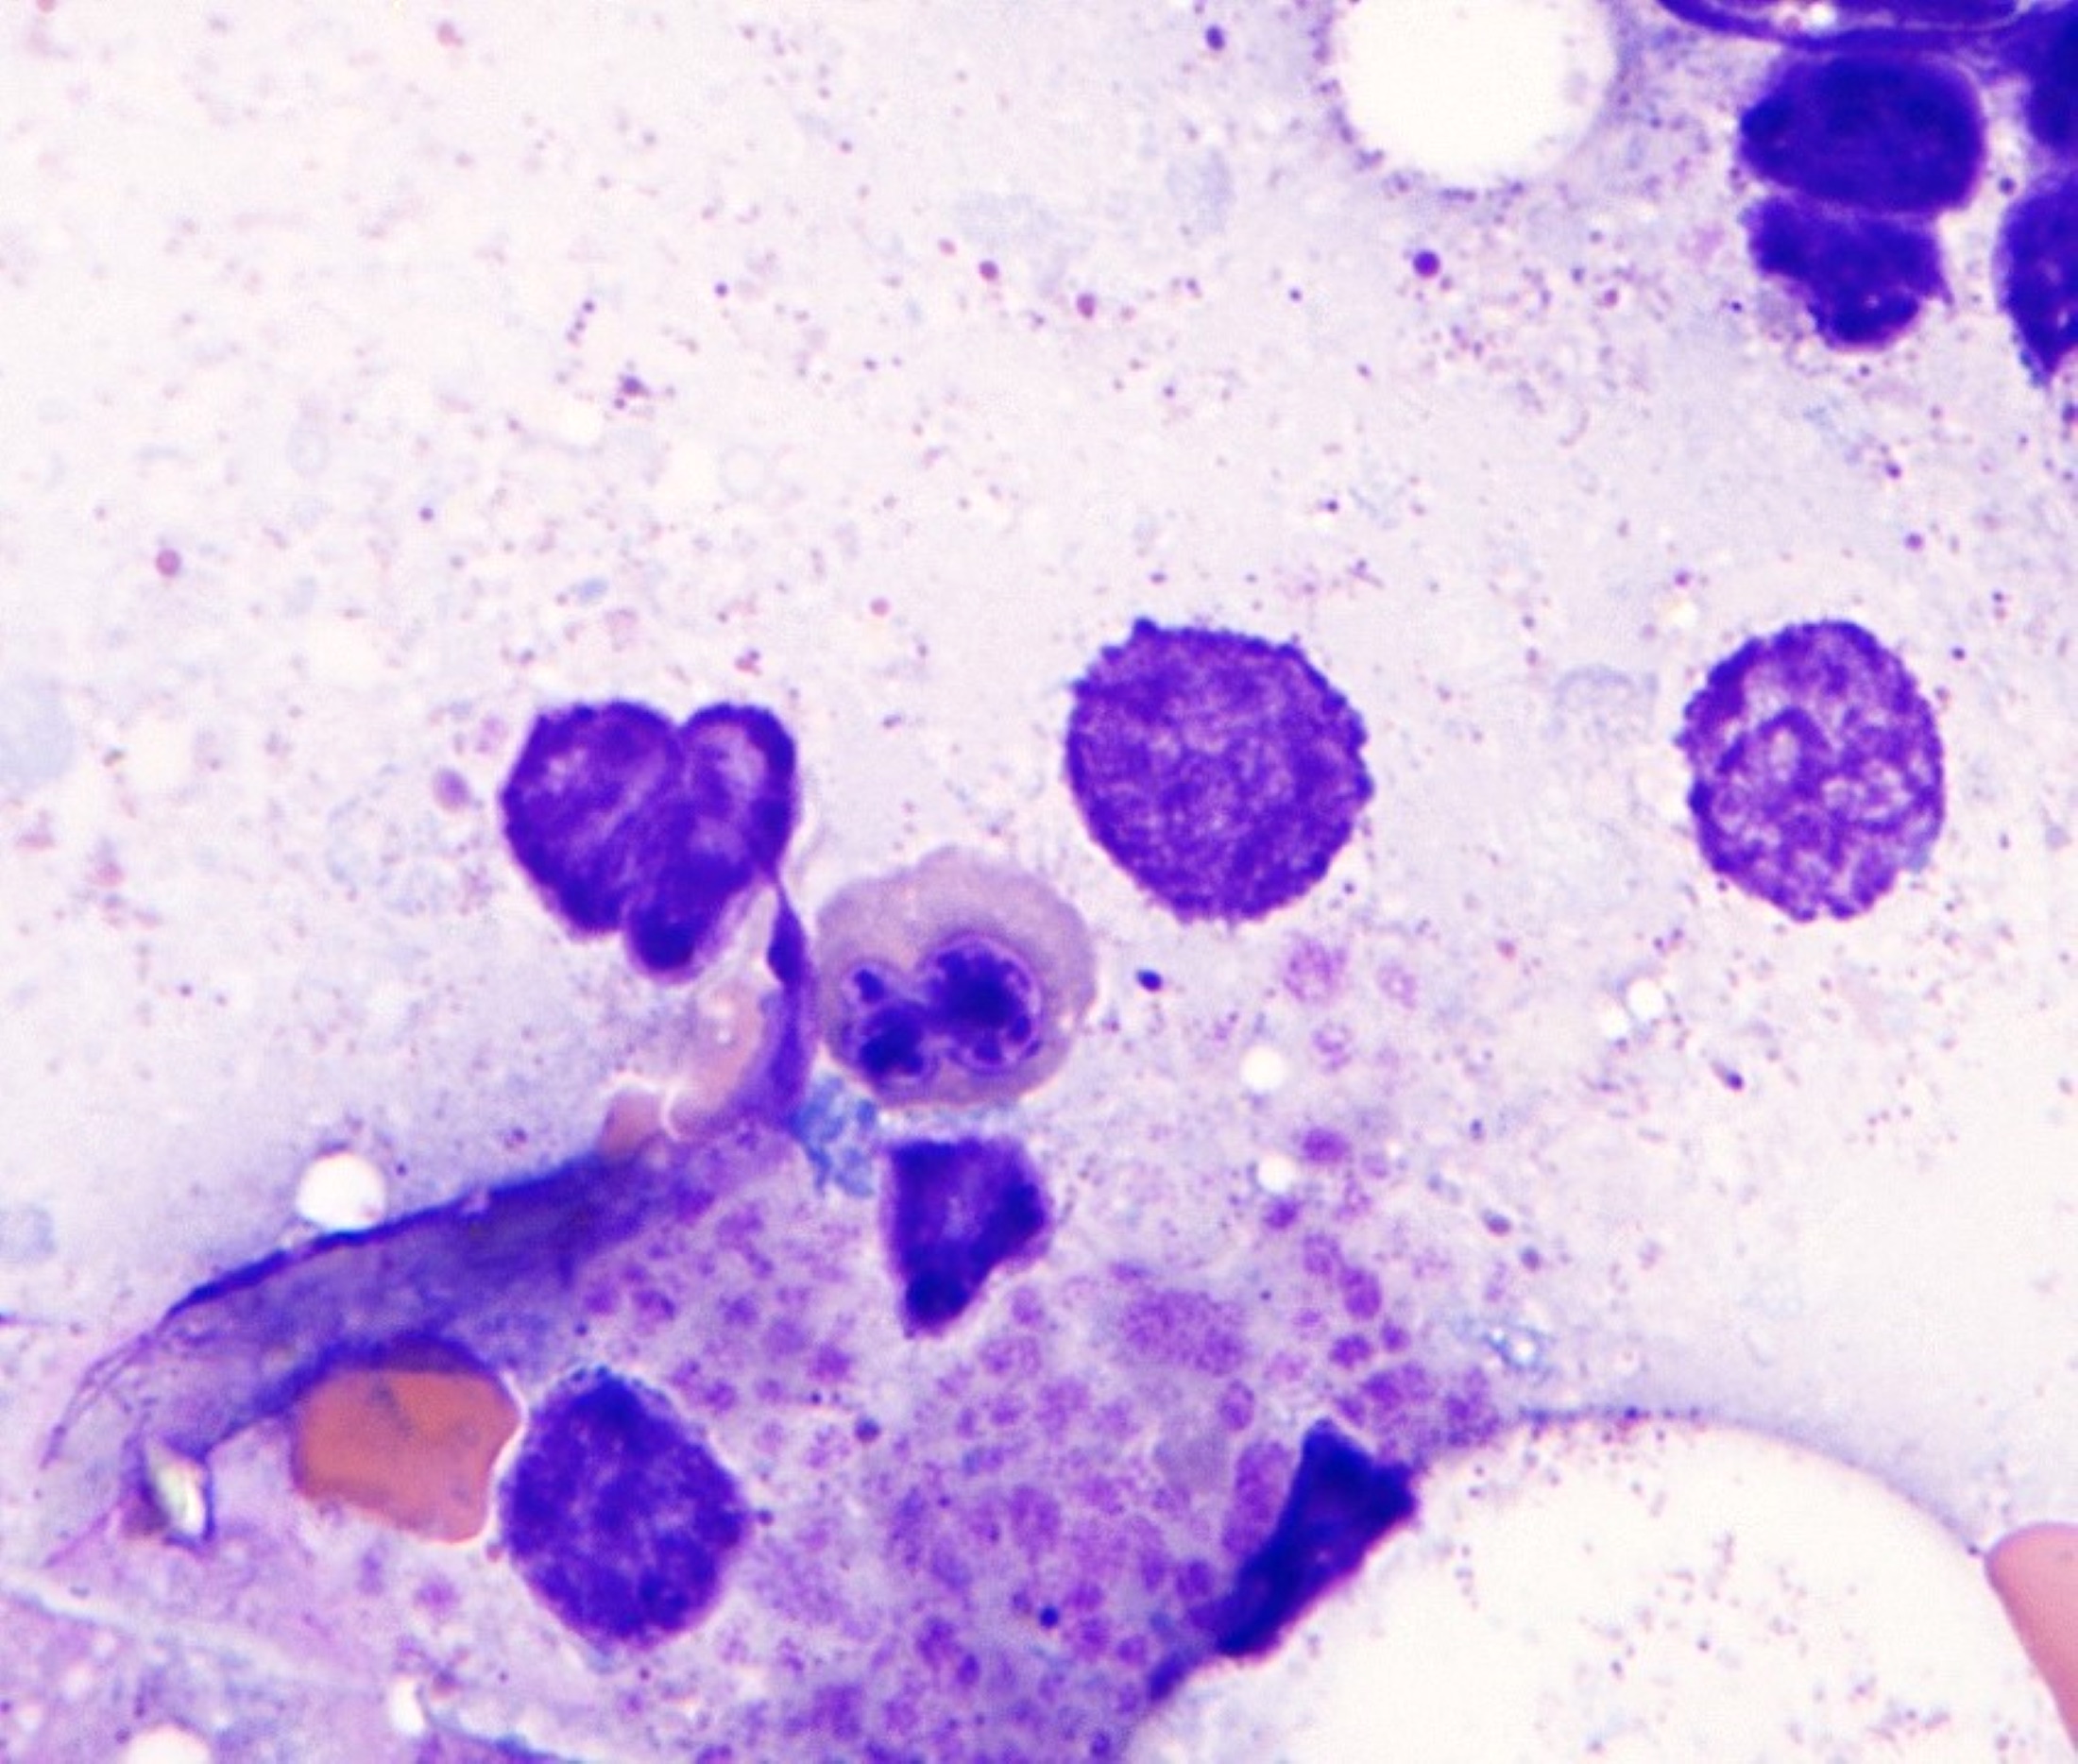
Increased blasts
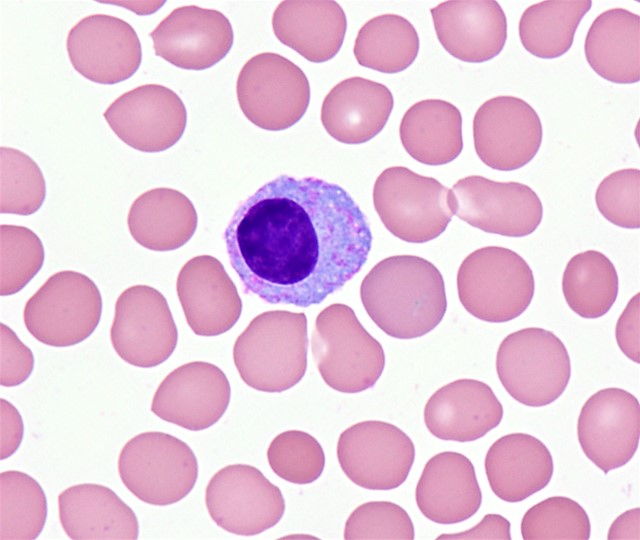
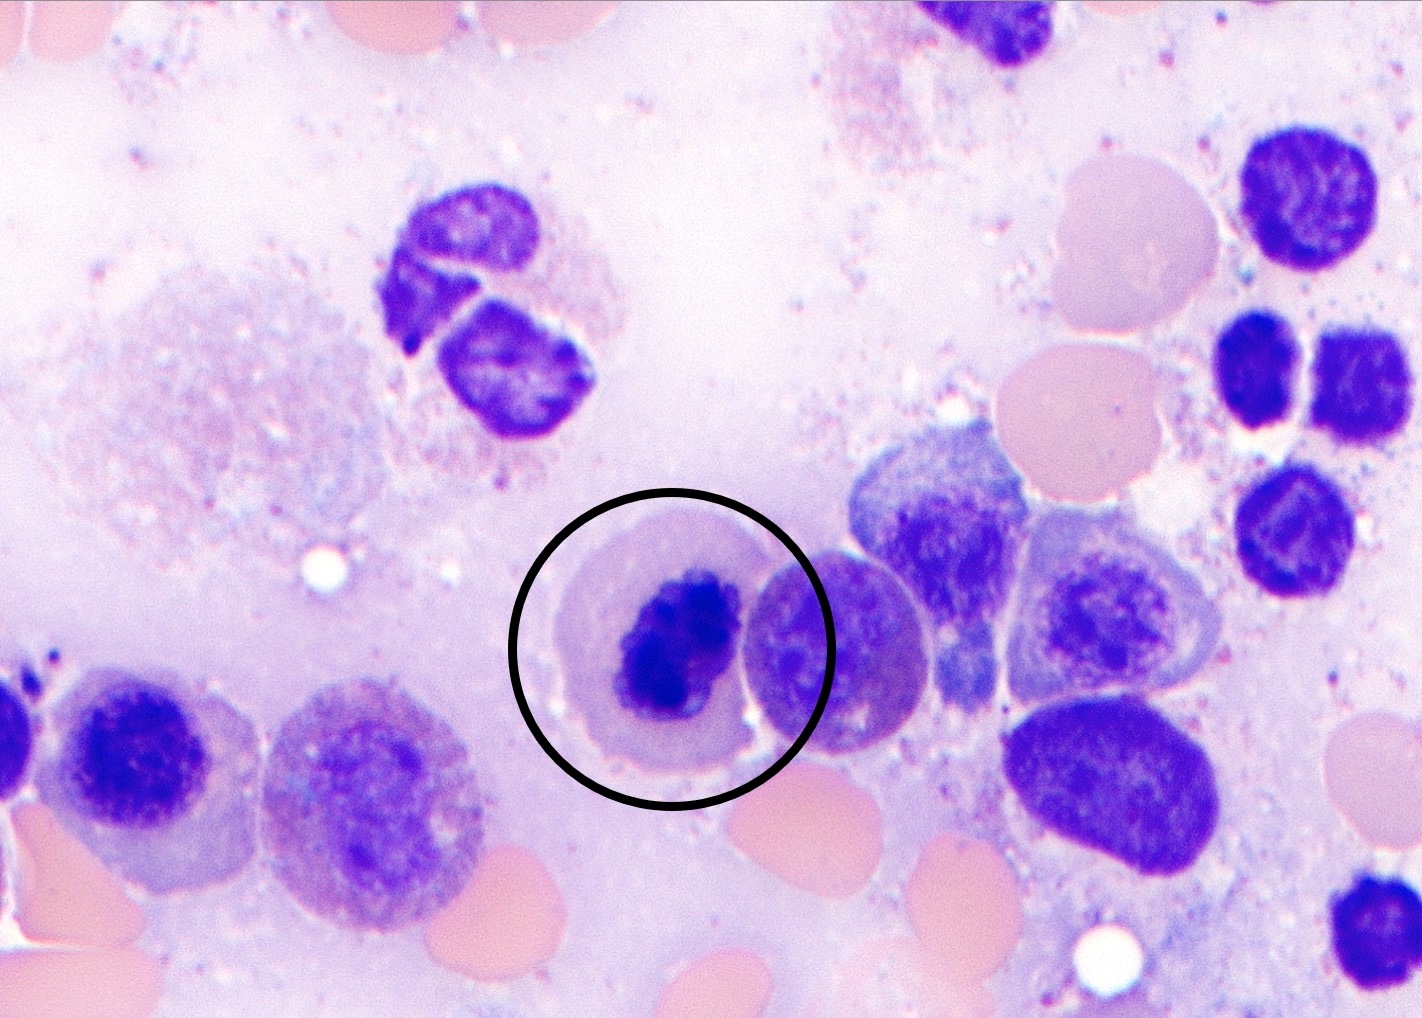
Atypical mononuclear cells
Blast morphology
CD34 positive blasts
Contributed by Barina Aqil, M.D.
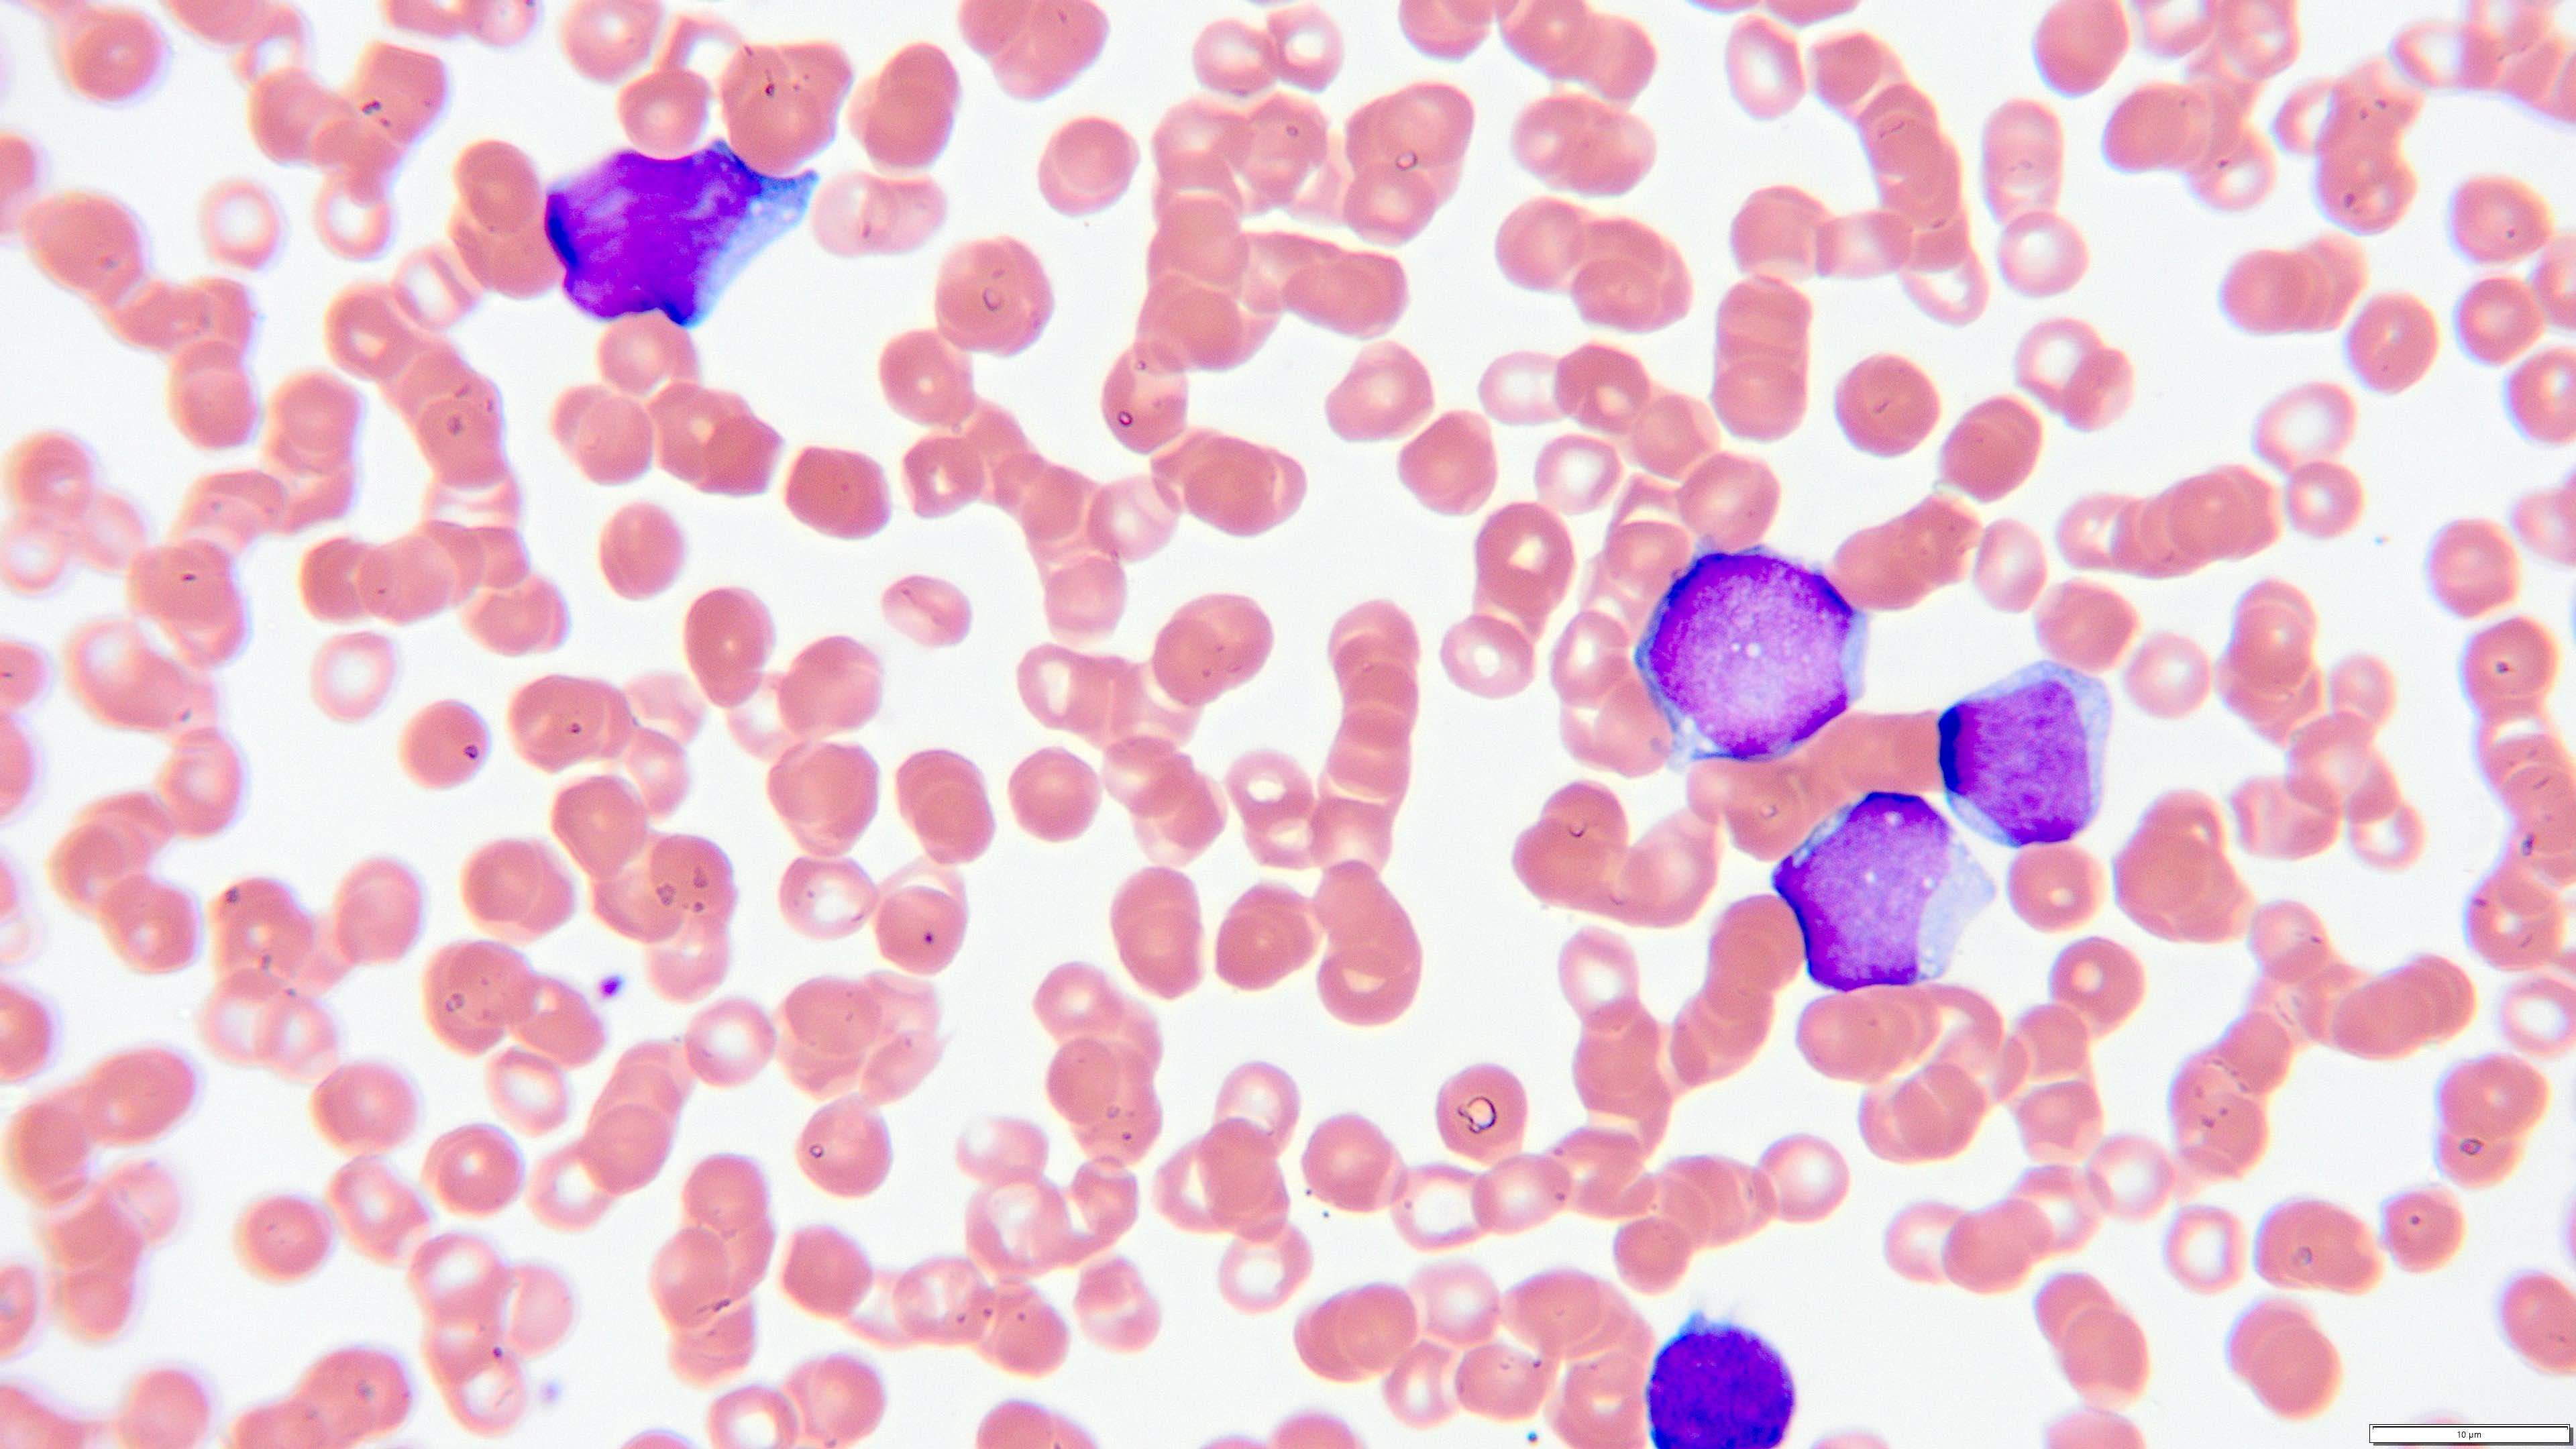
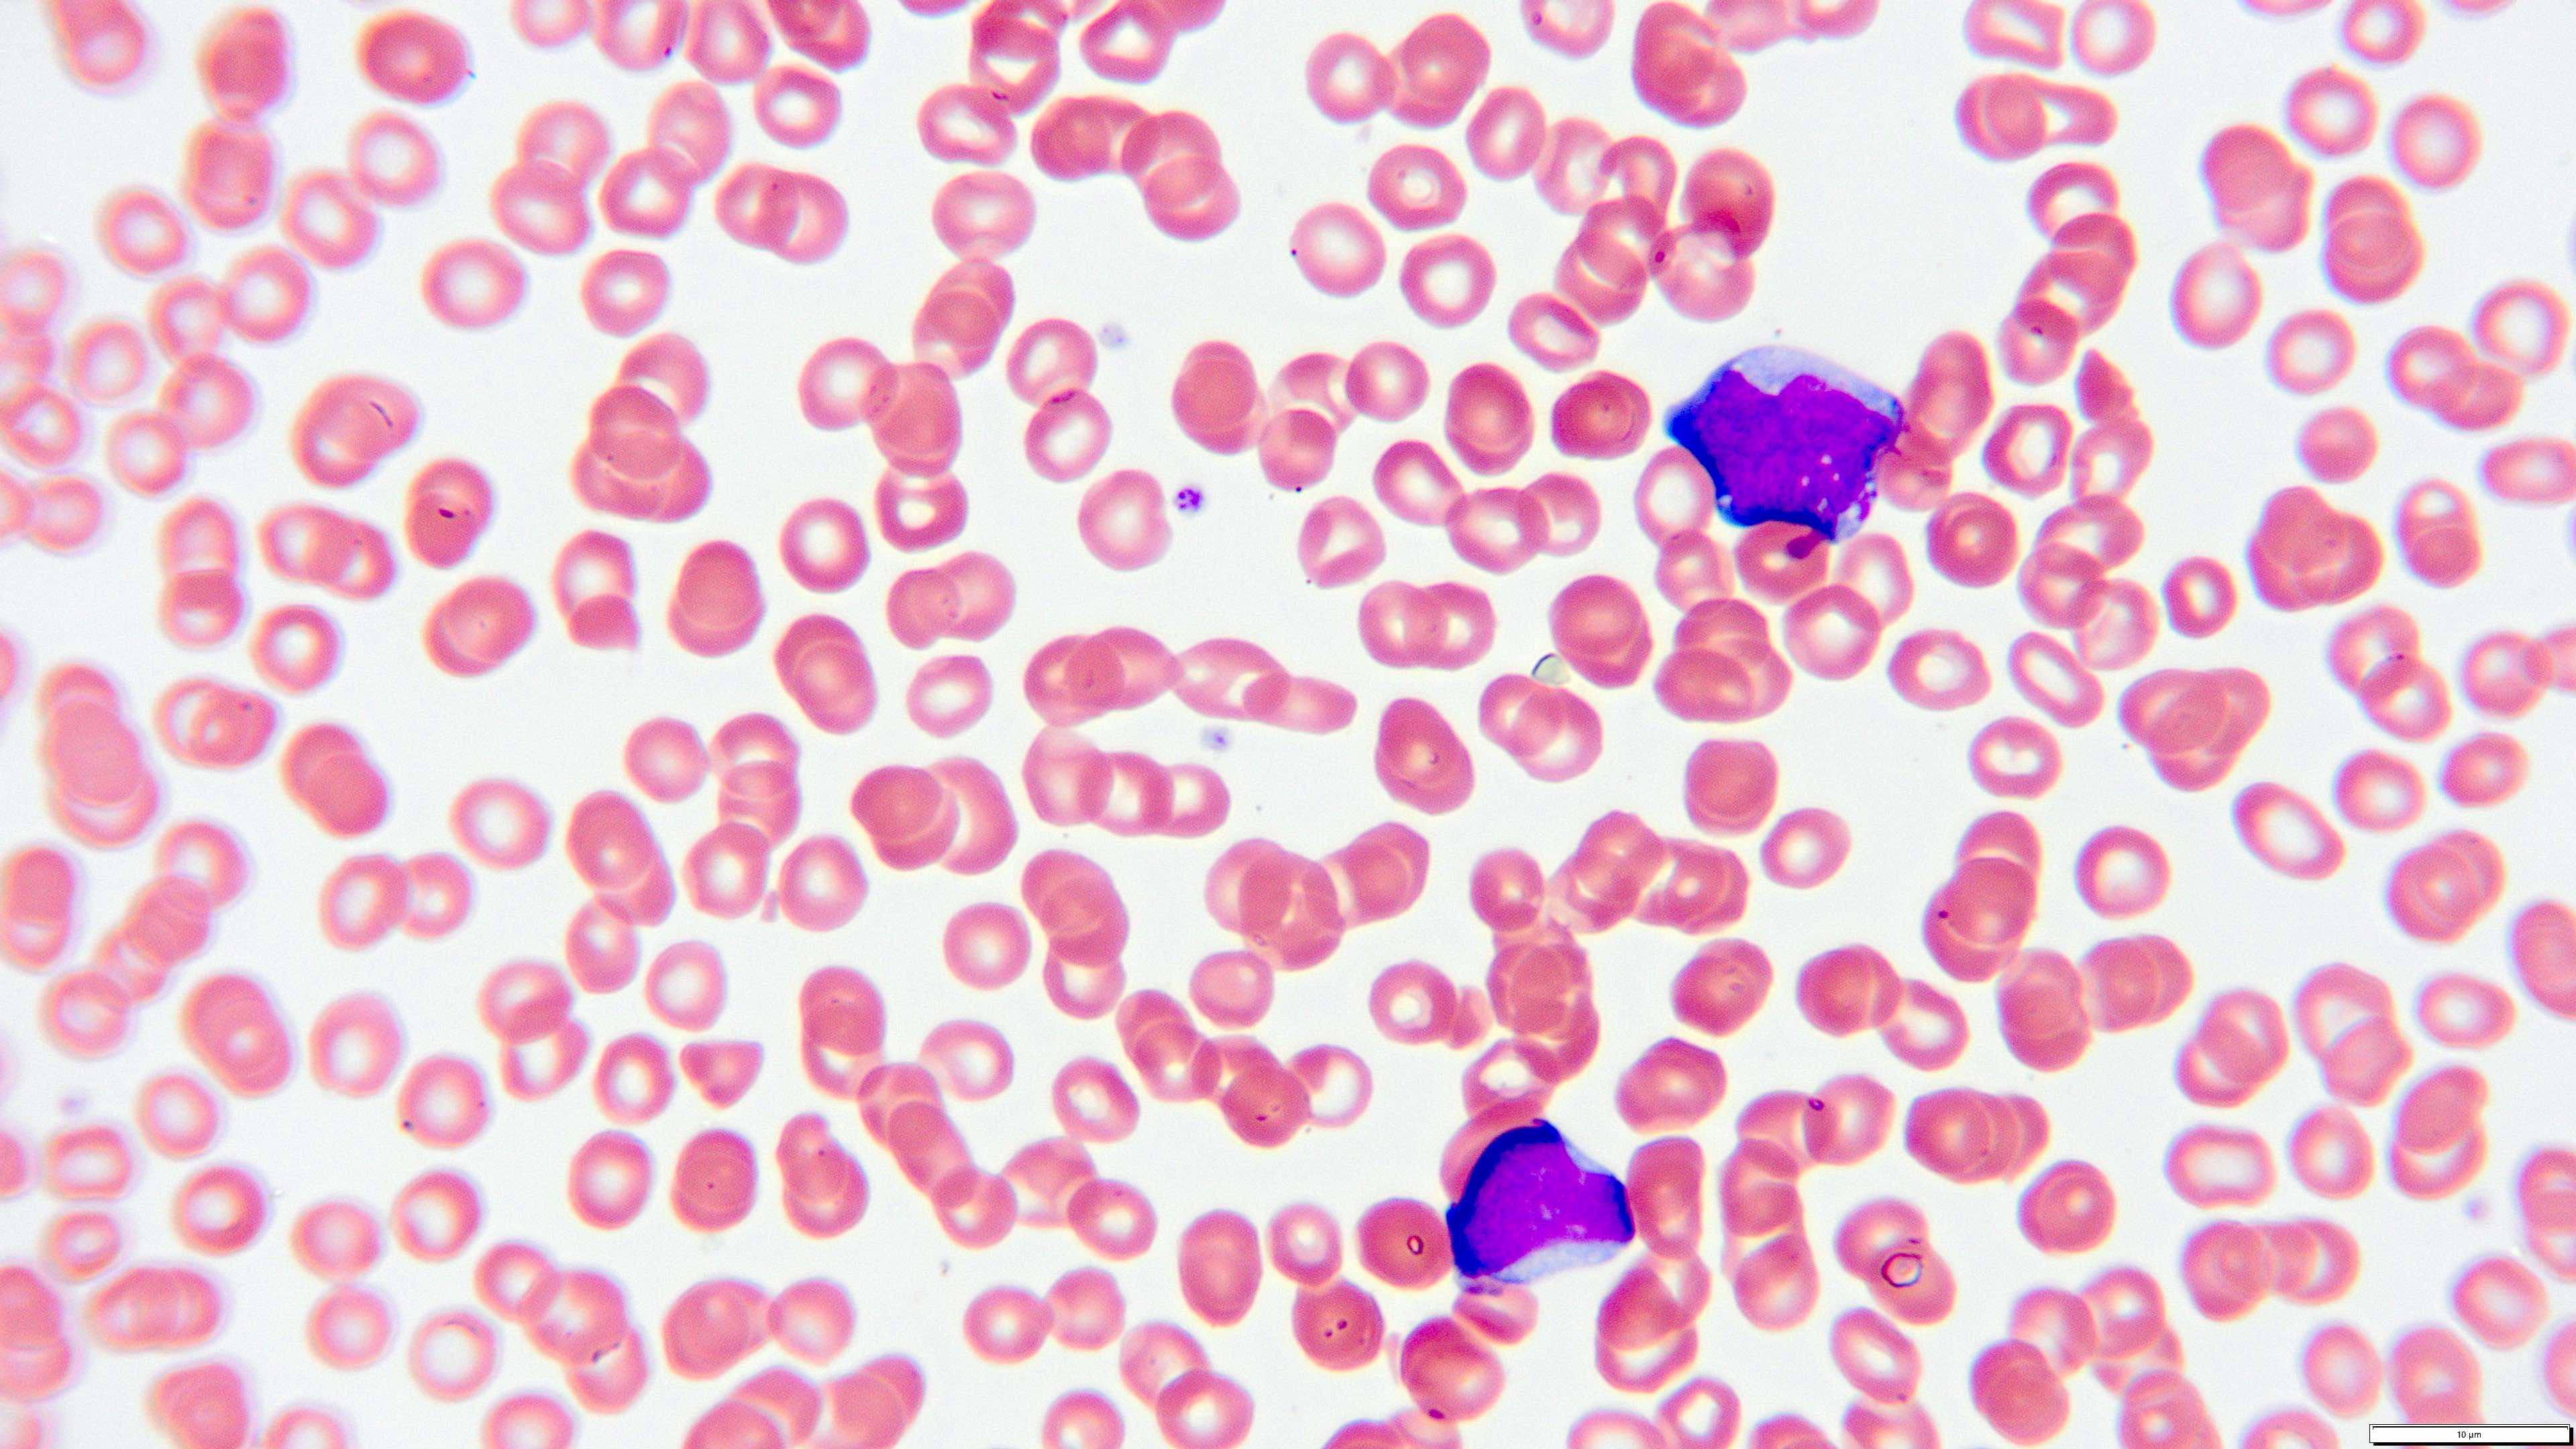
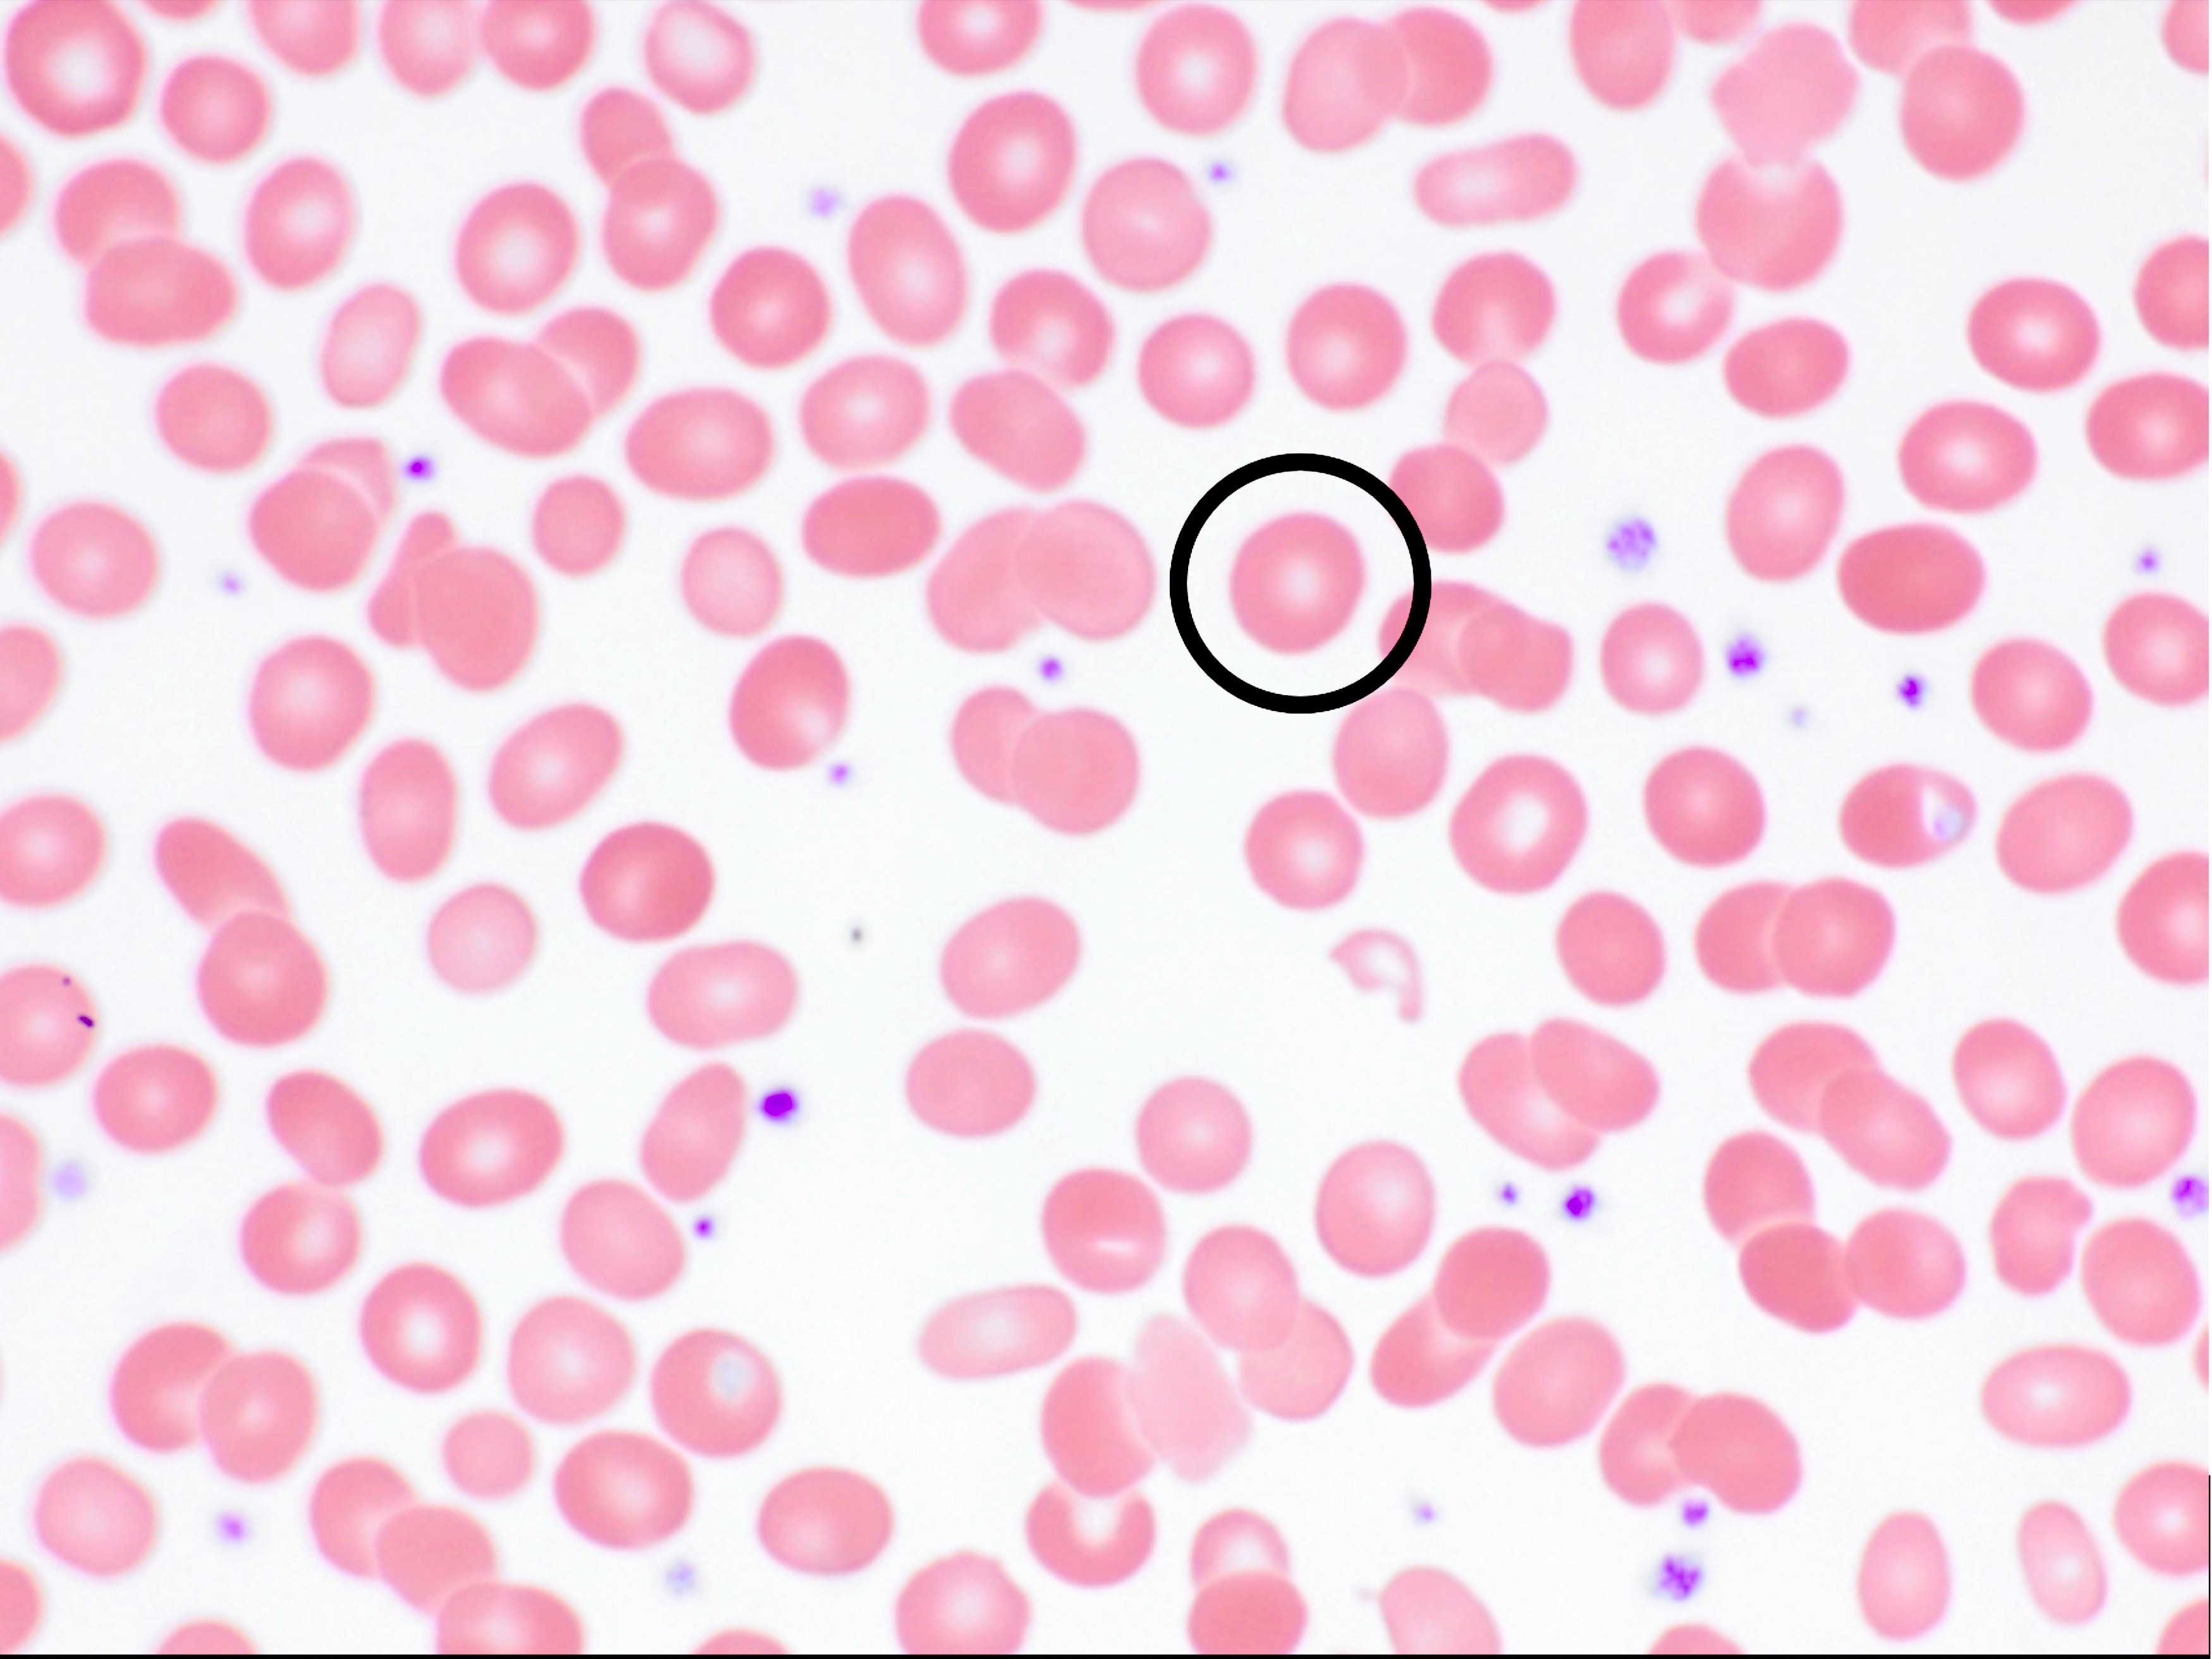
Circulating blasts
Contributed by Barina Aqil, M.D.
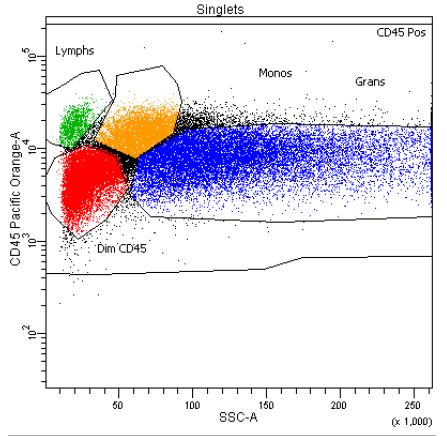
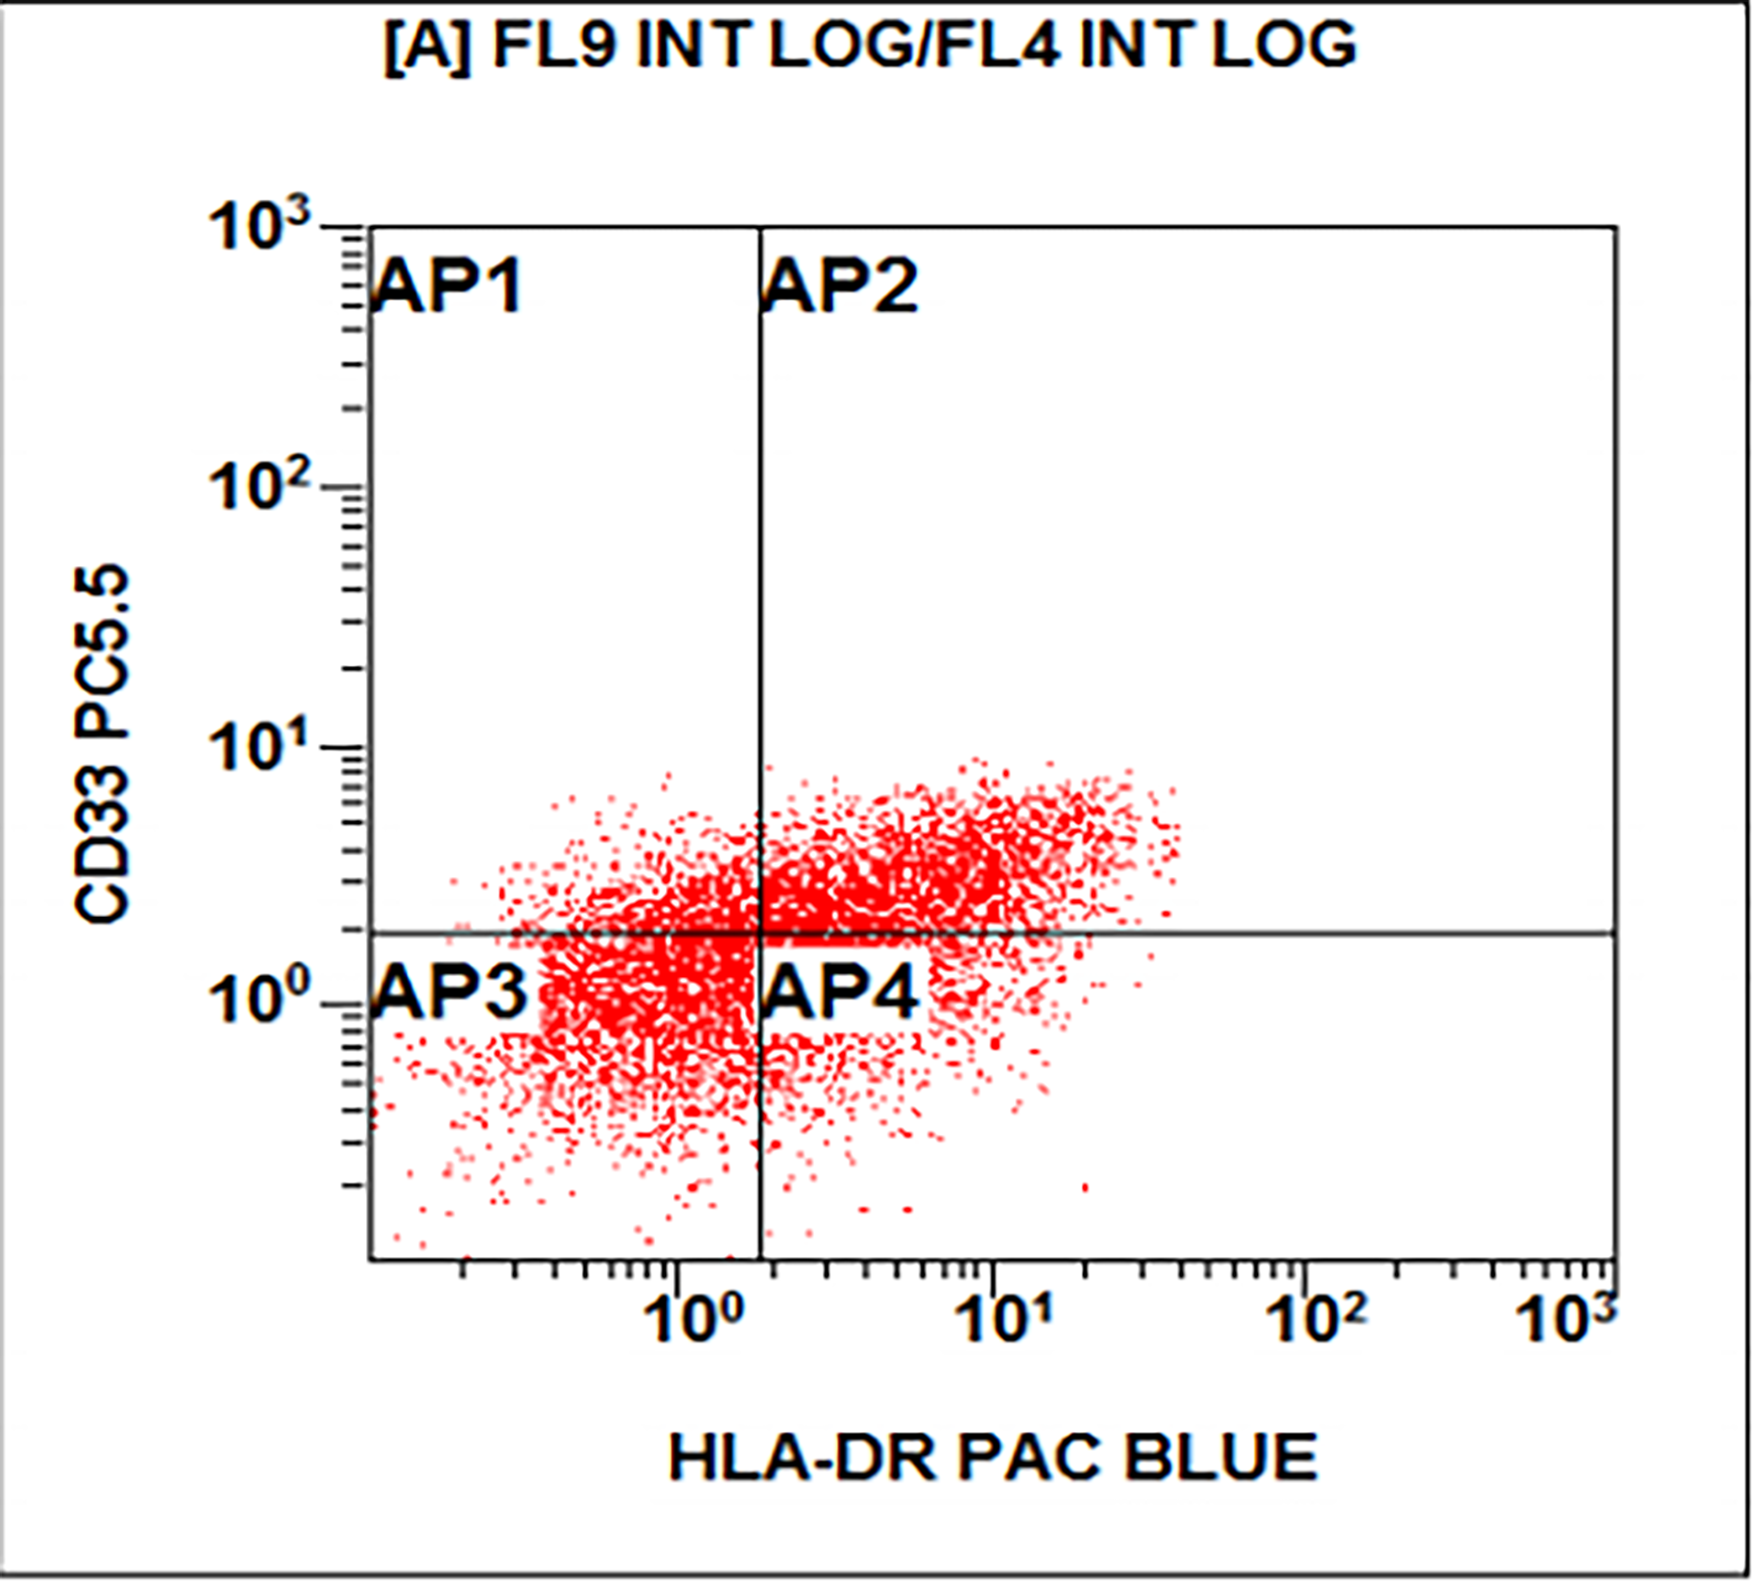
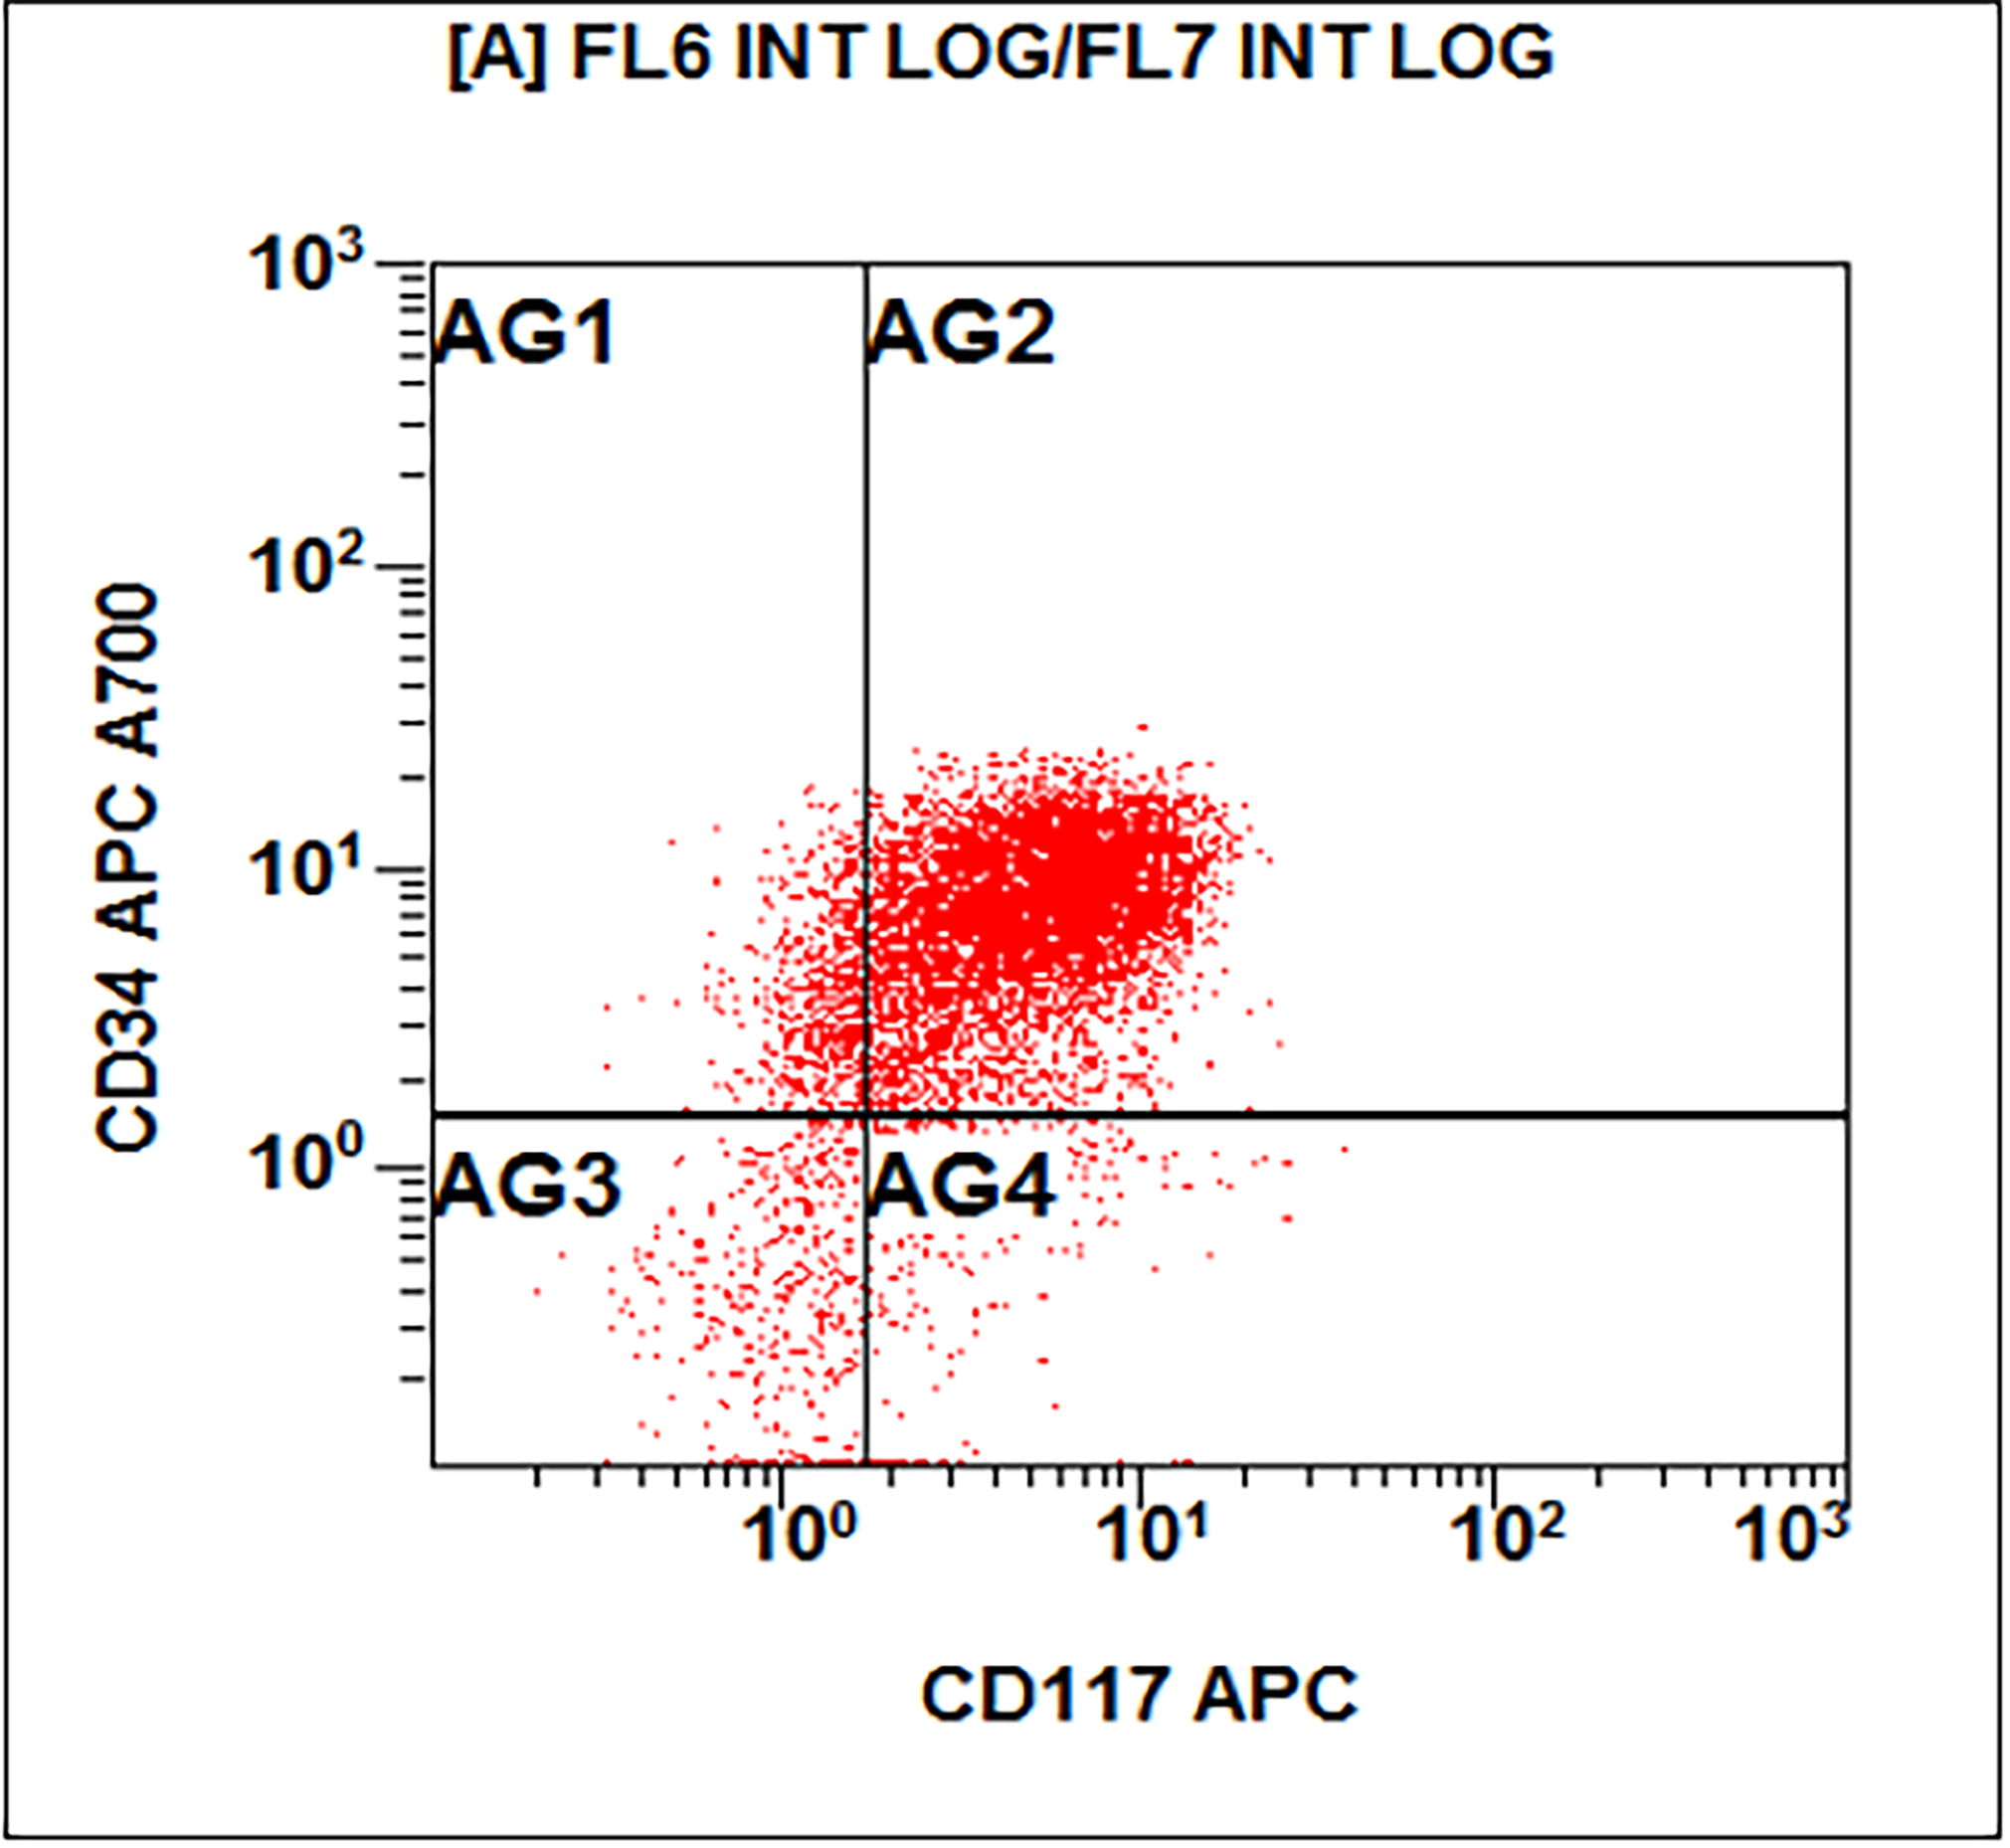
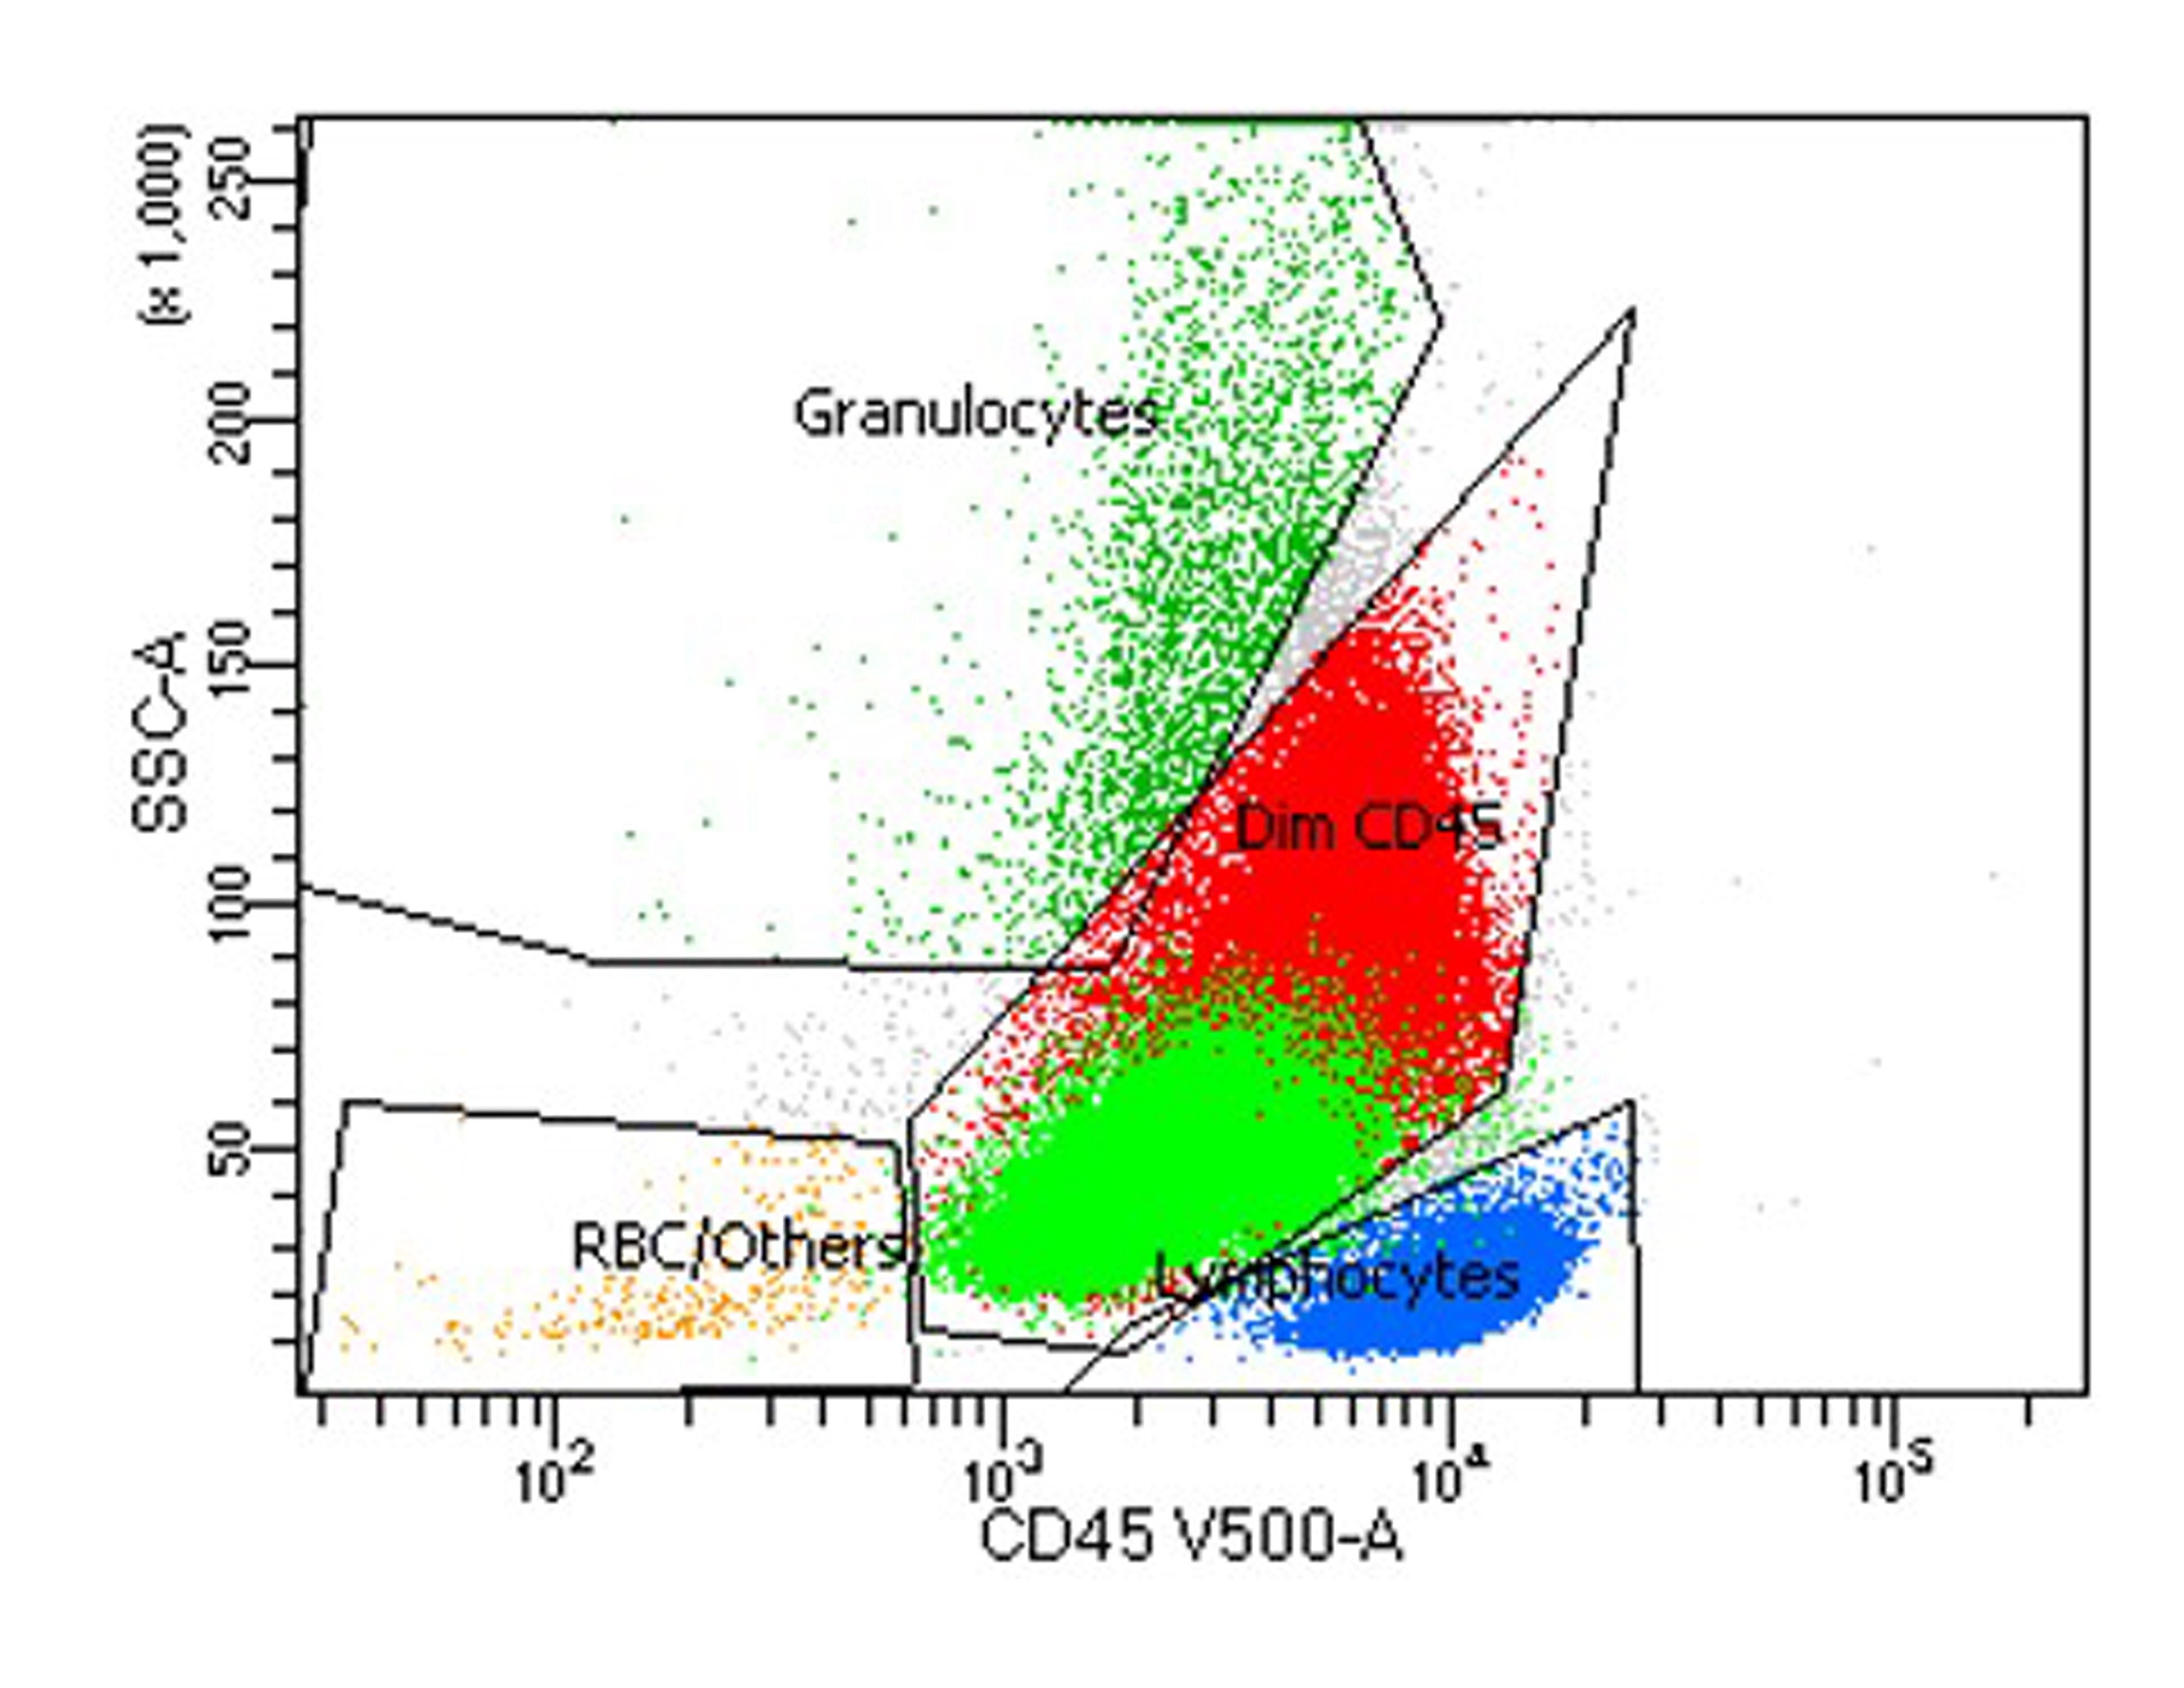
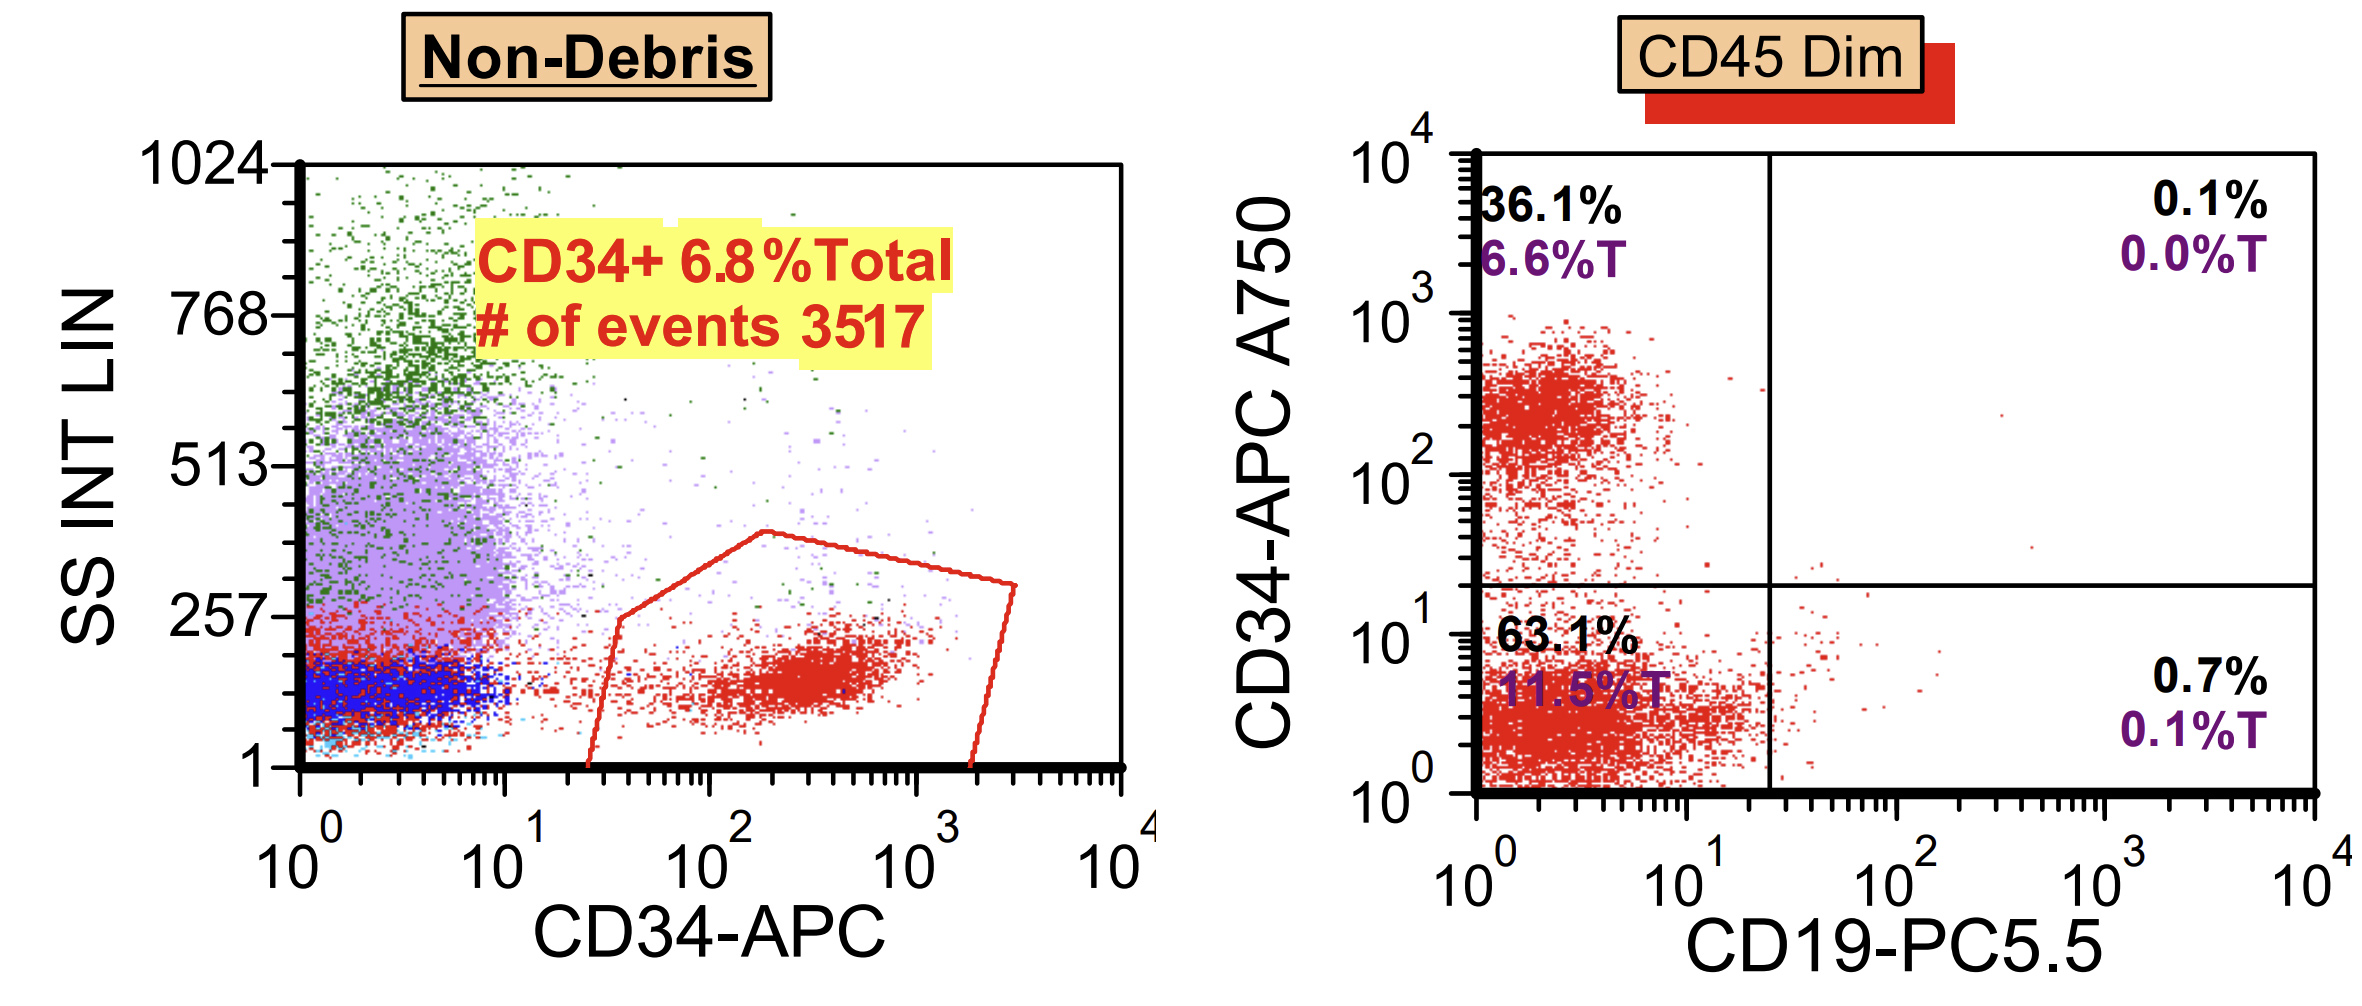
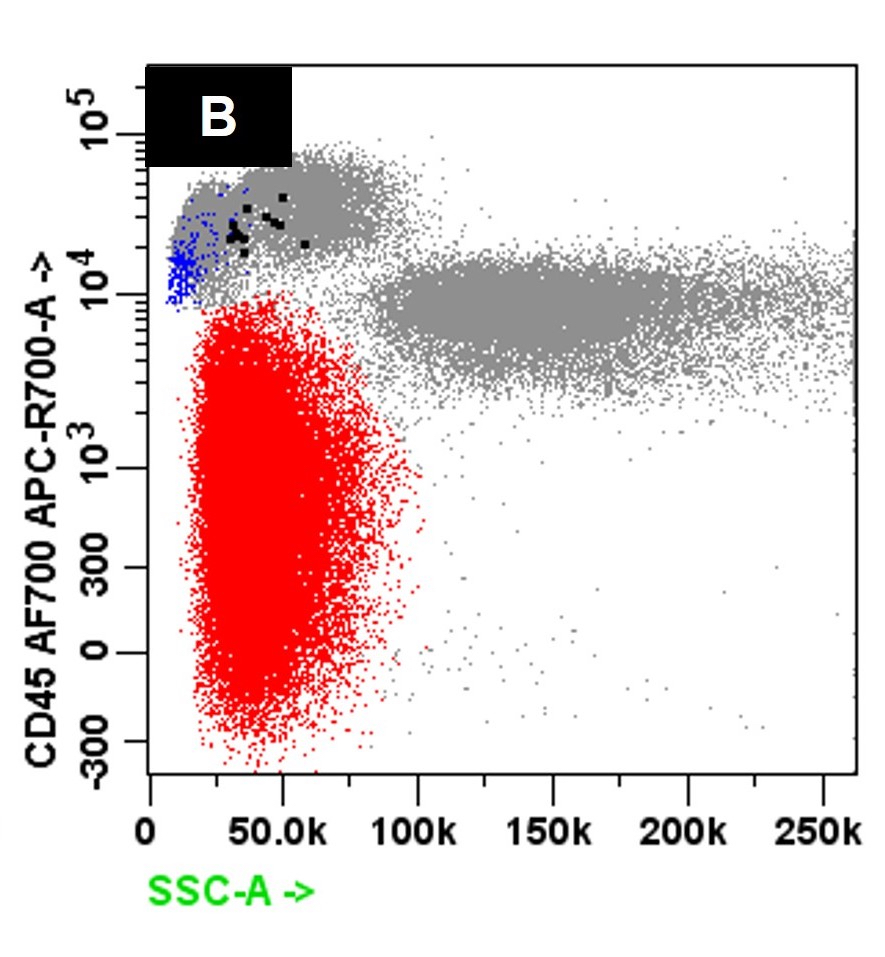
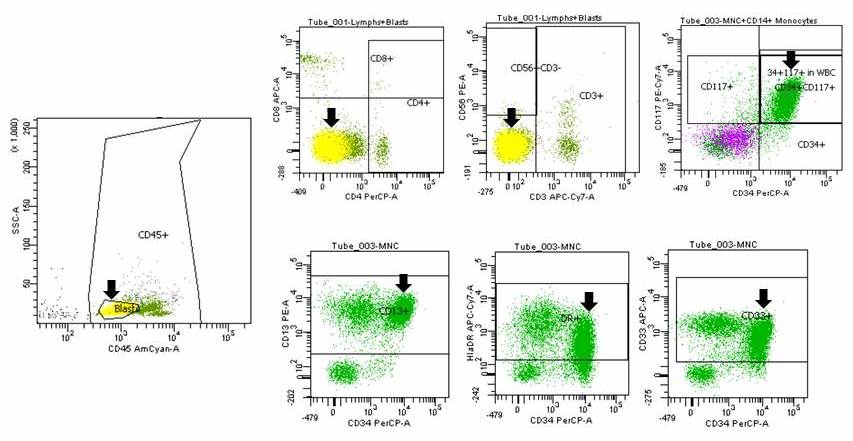
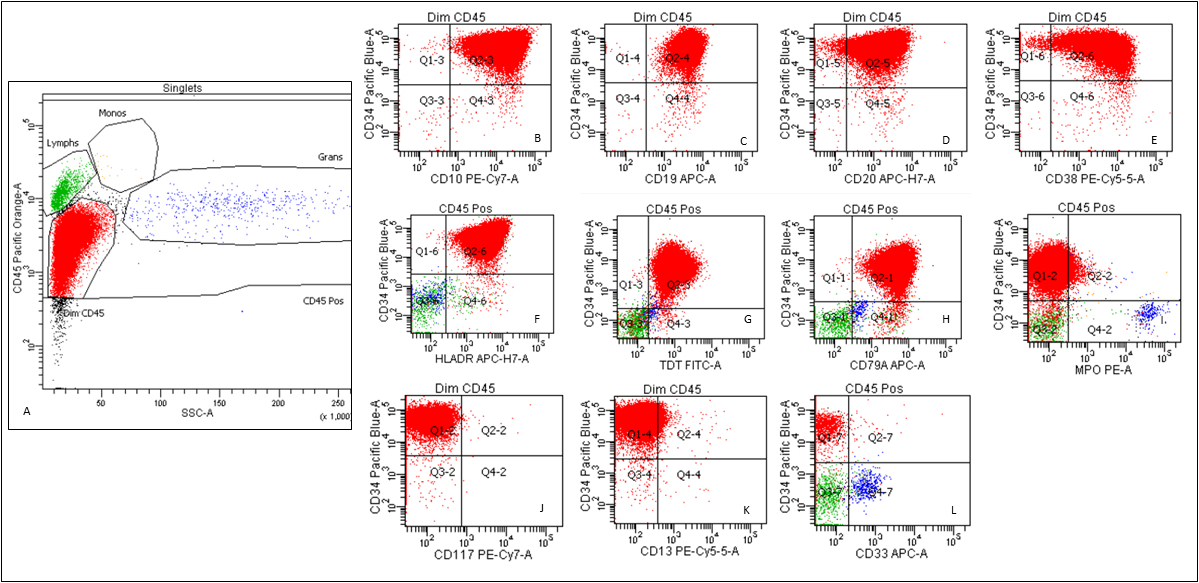
Dim CD45+ myeloid blasts
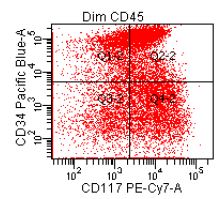
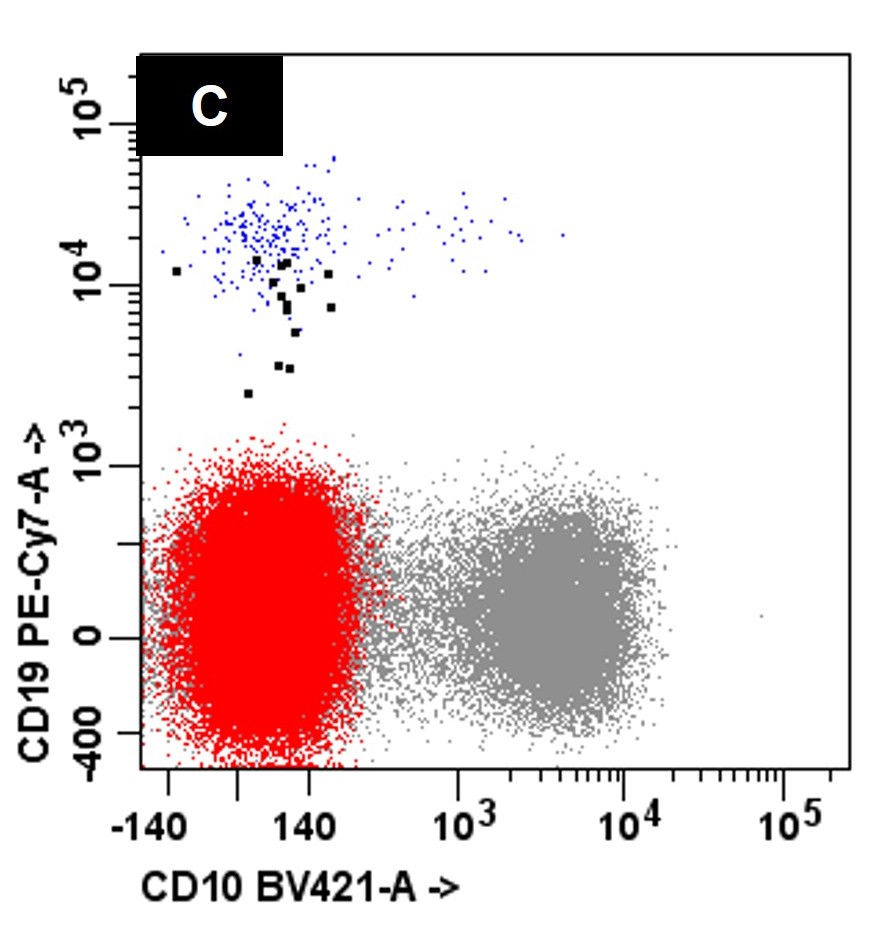
Partial CD34+ and CD117+
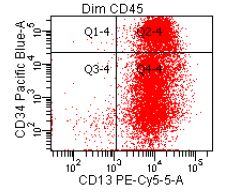
Partial CD13+
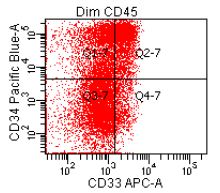
Dim CD33+
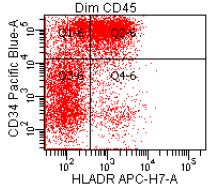
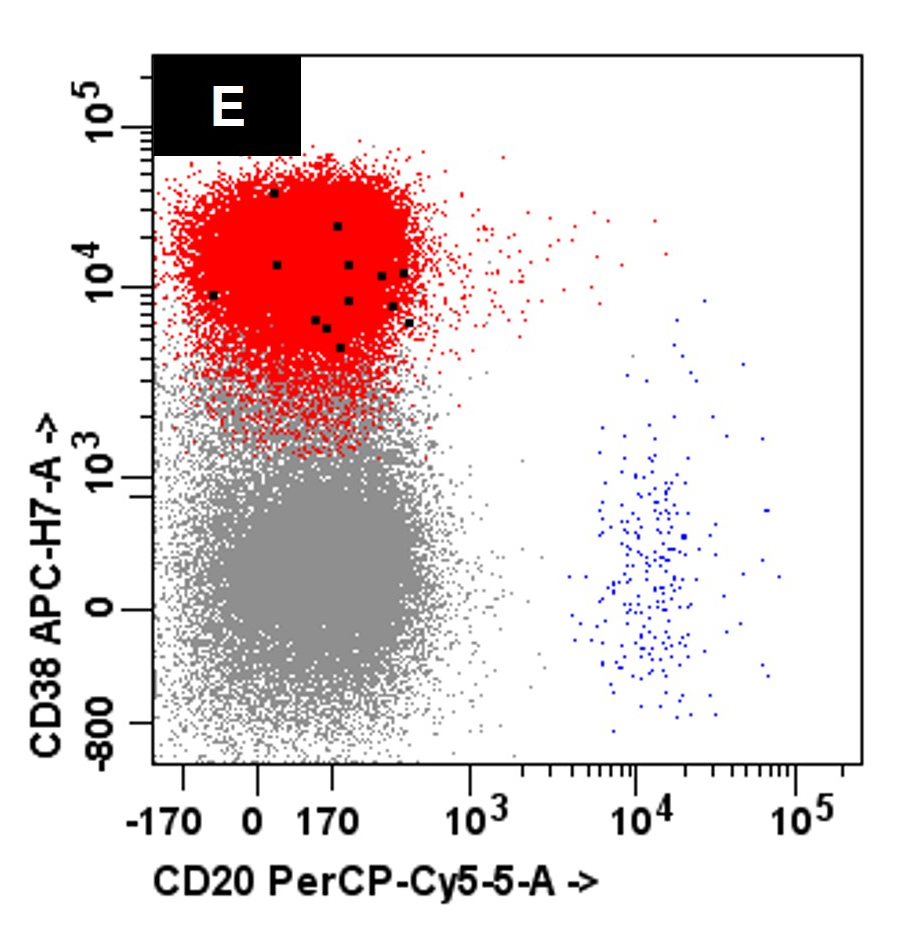
Partial HLA-DR+
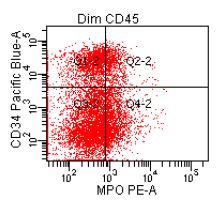
Predominantly MPO-
Contributed by Barina Aqil, M.D.
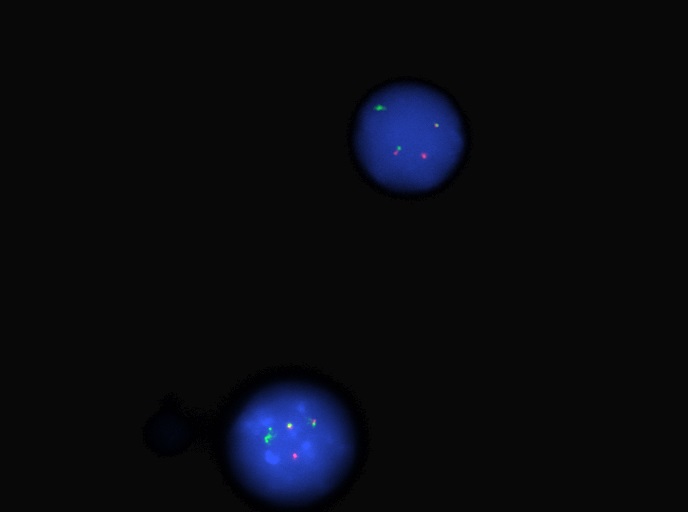
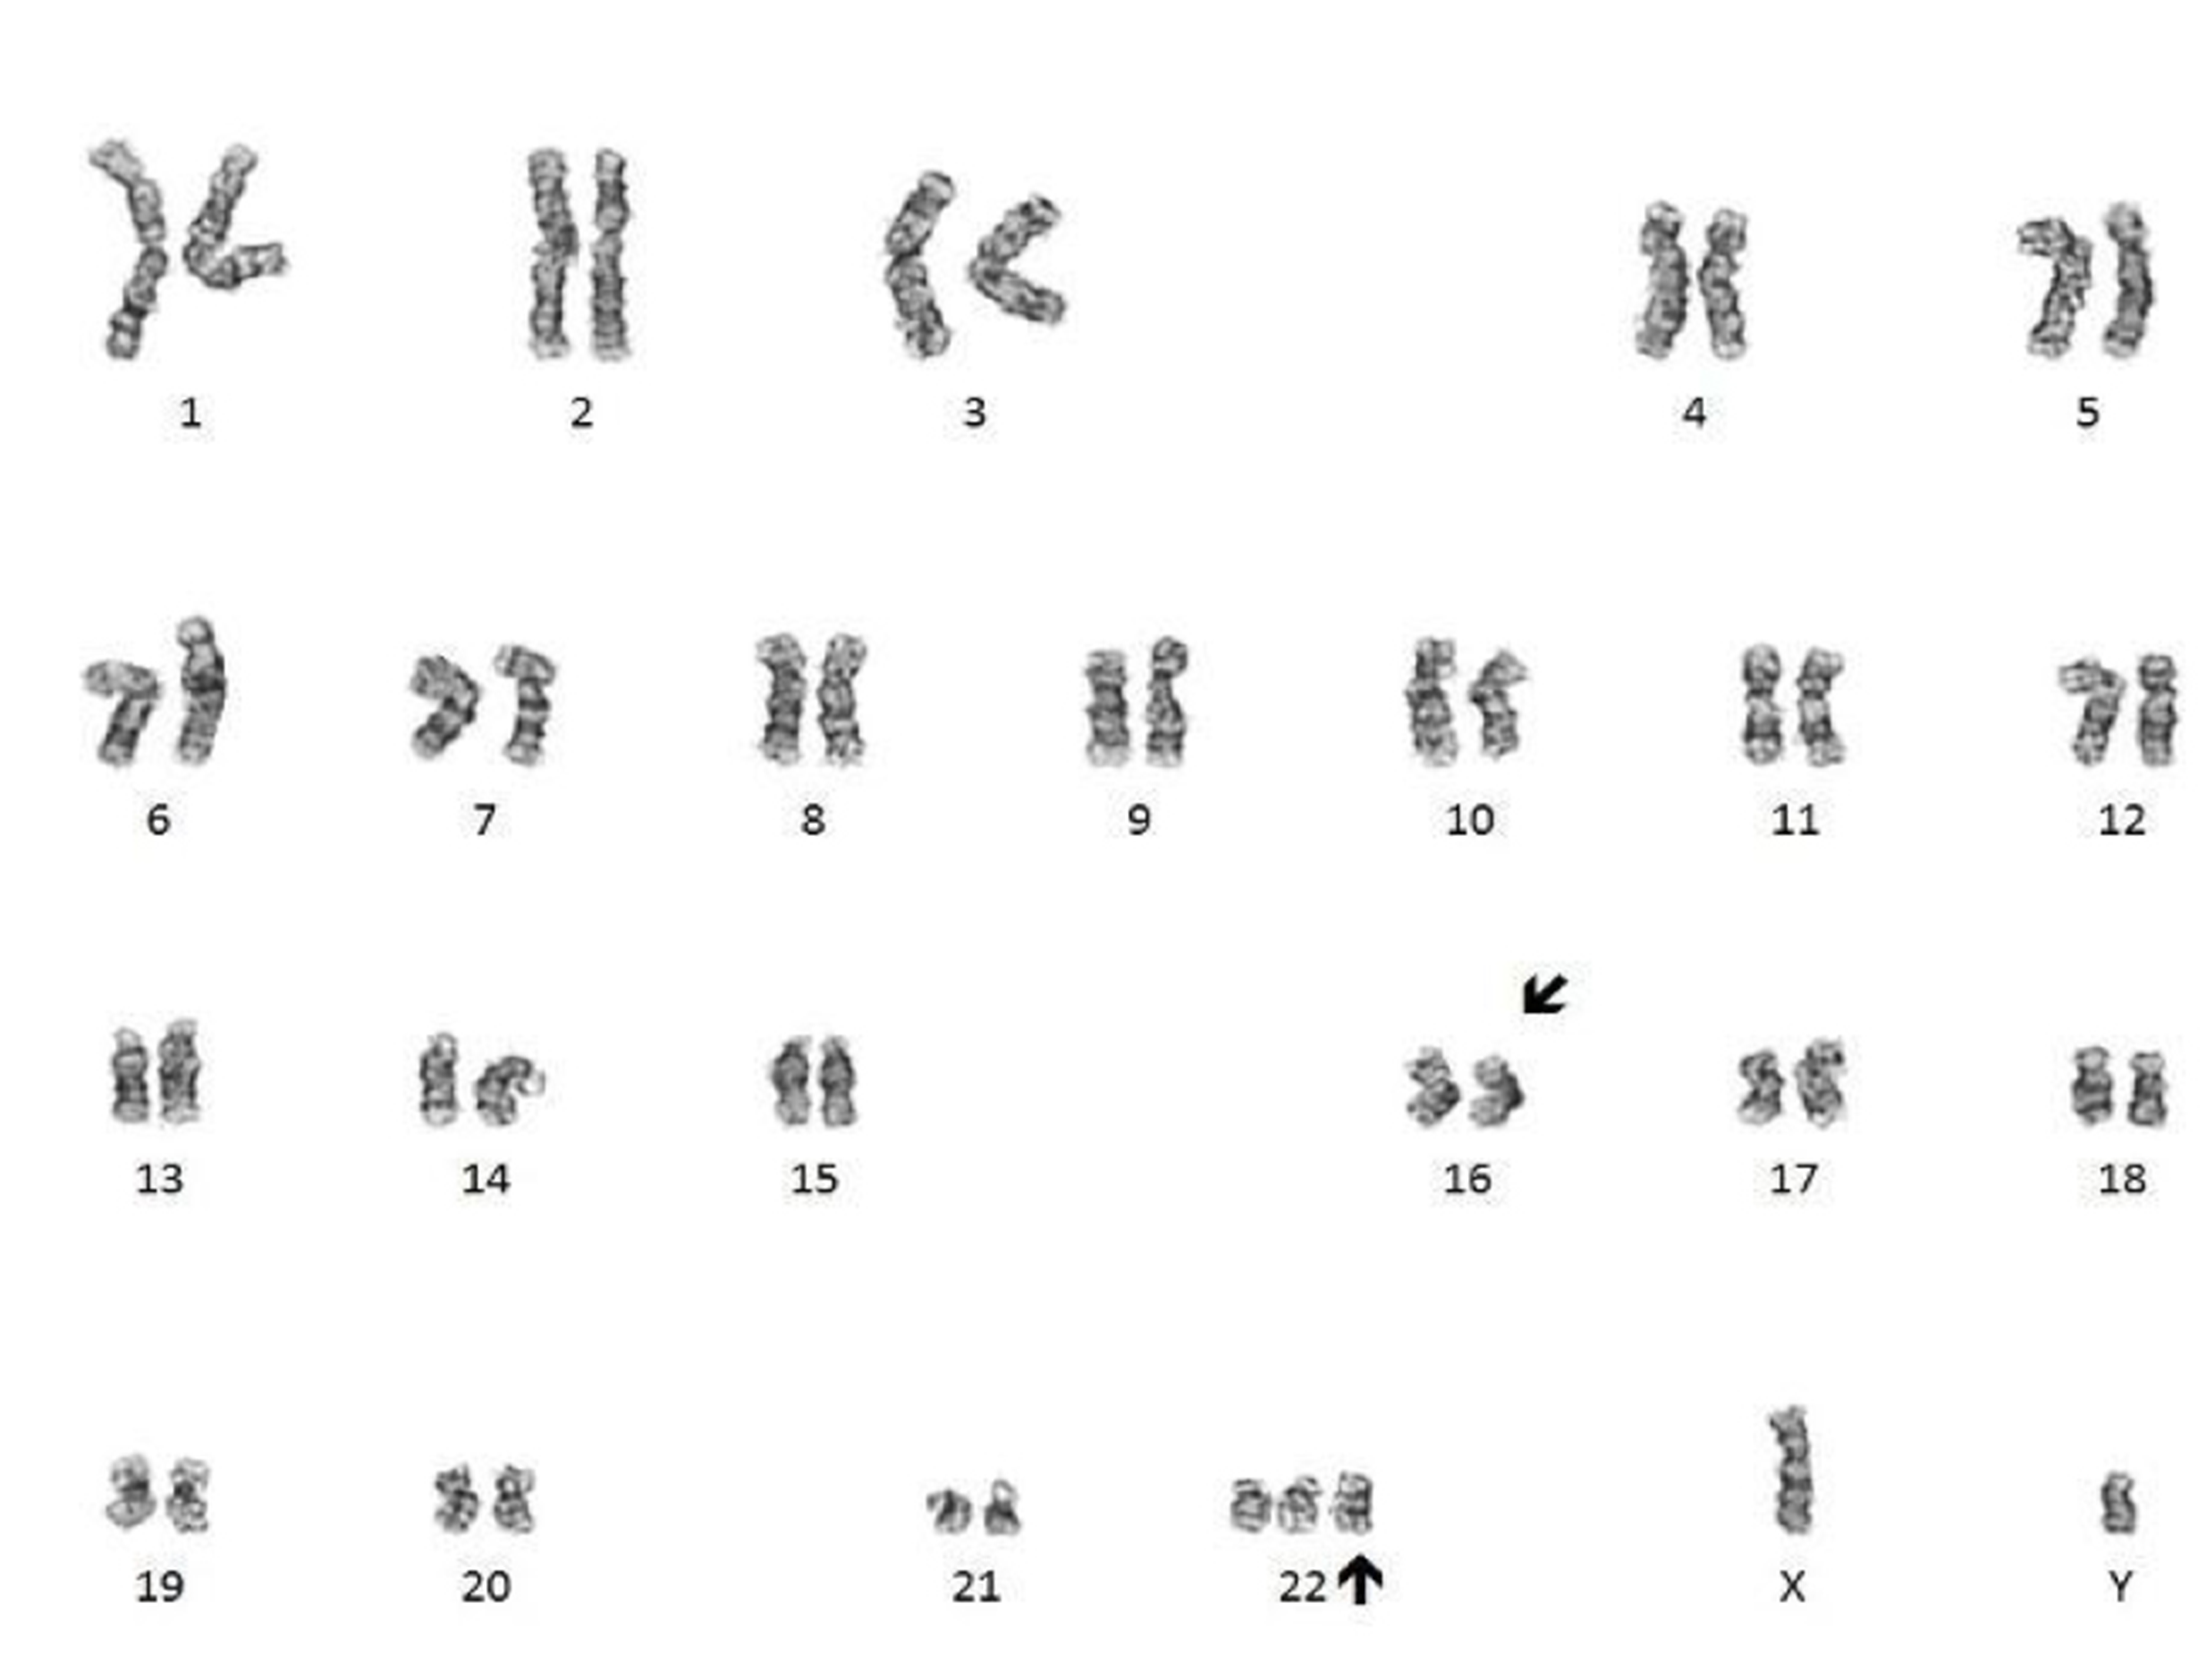
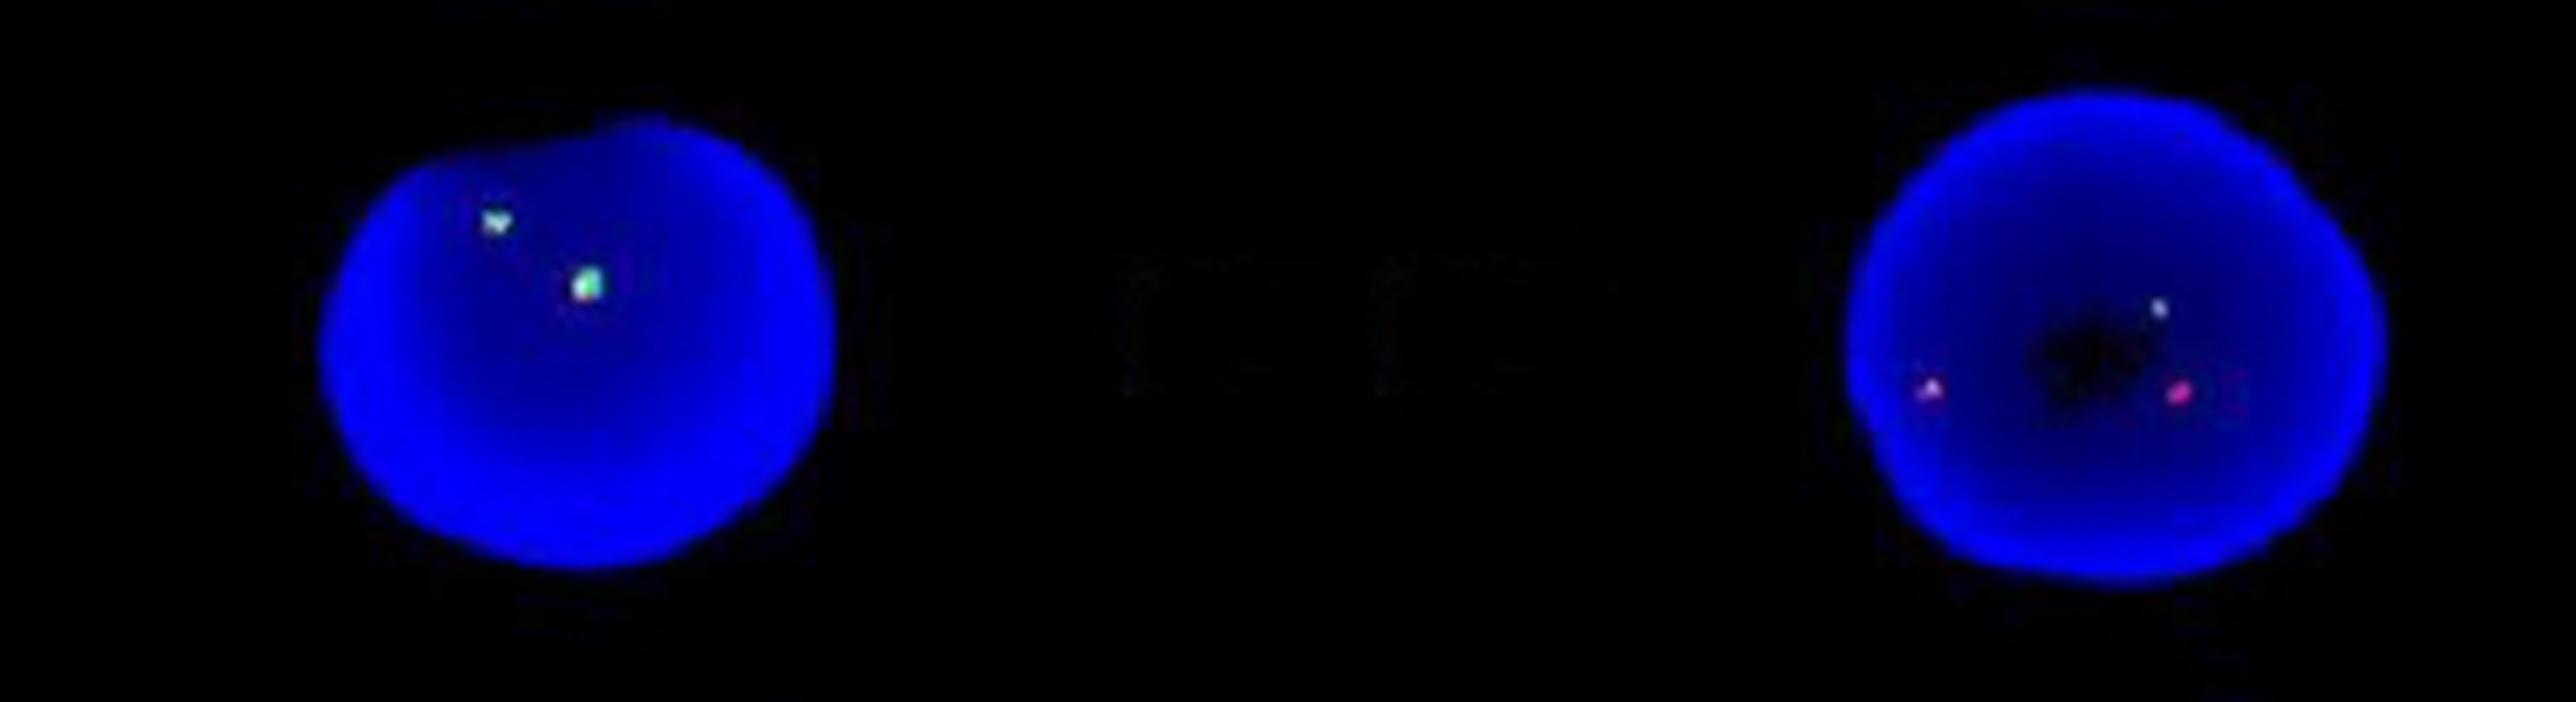
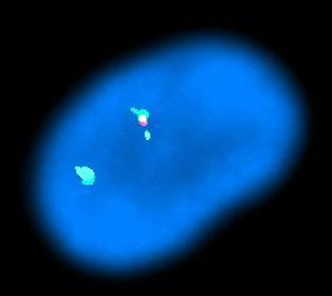
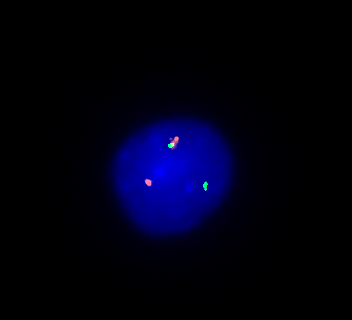
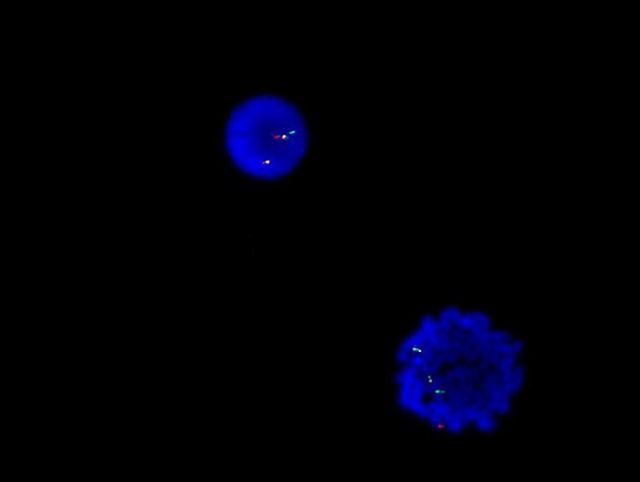
BCR::ABL1 fusion by FISH
Contributed by Etan Marks, D.O.
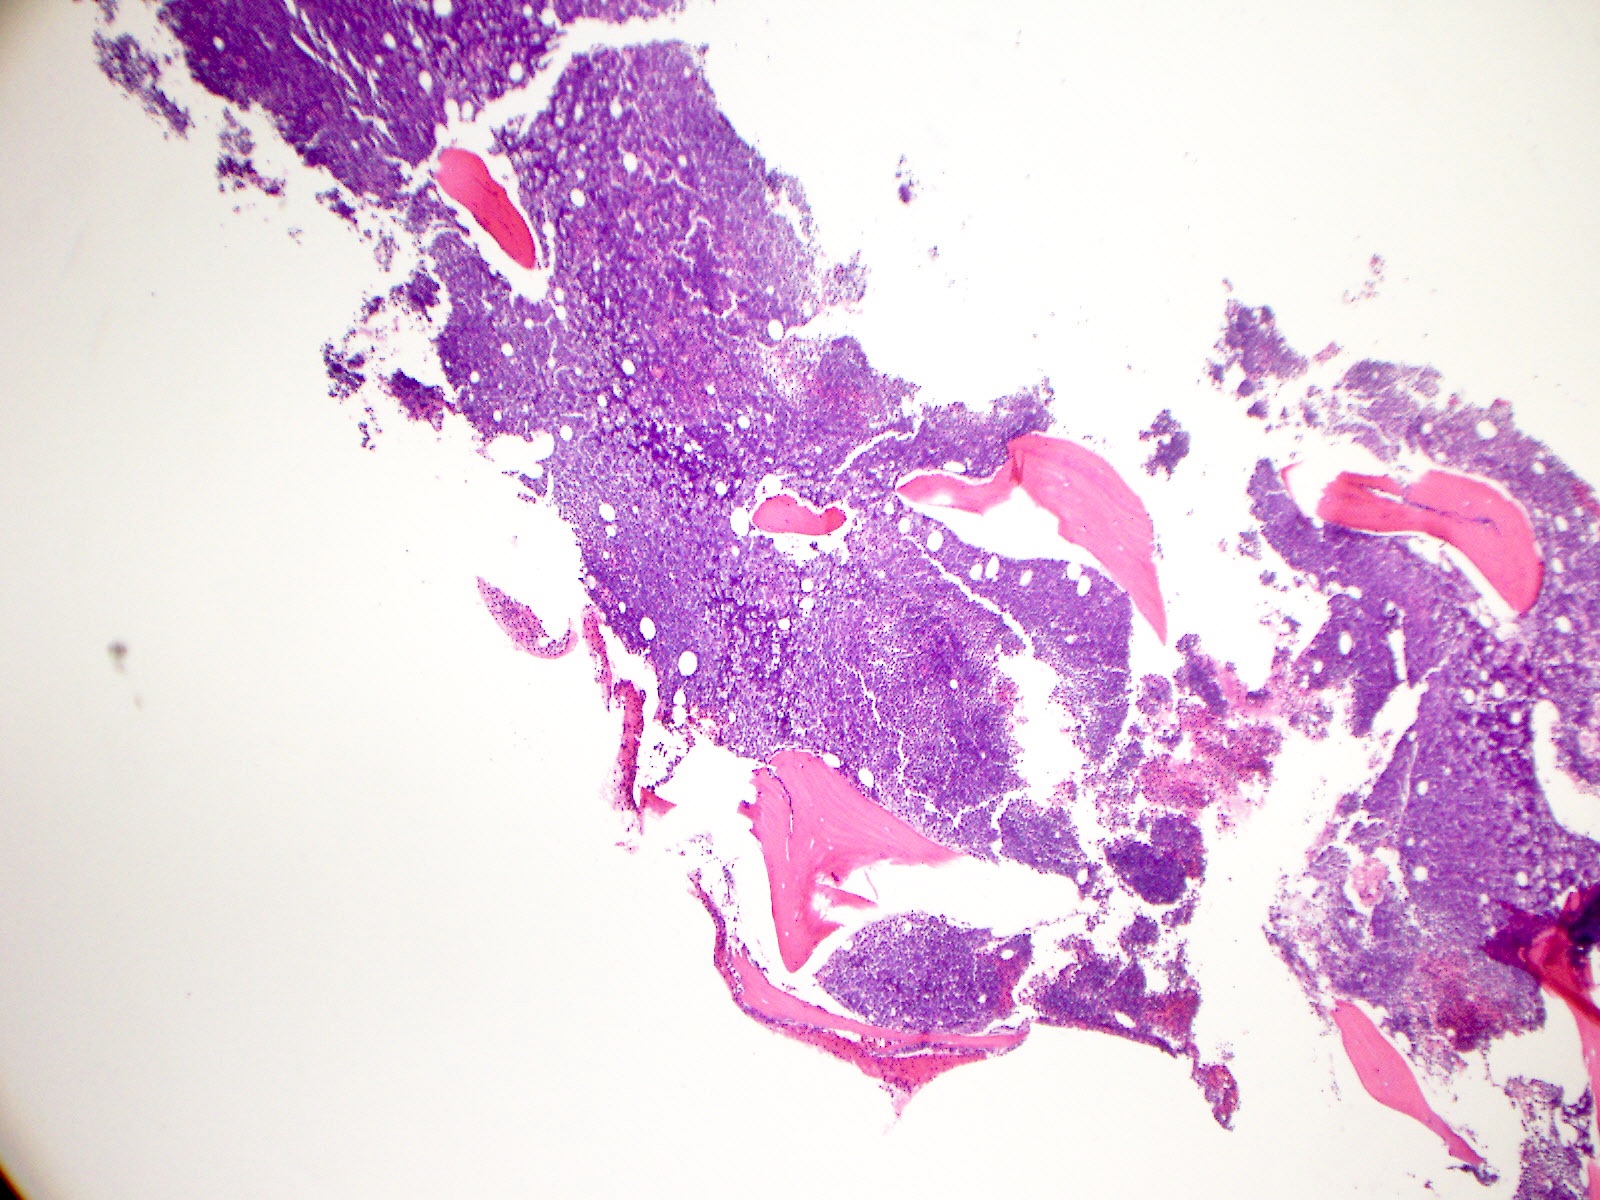


Bone marrow core biopsy
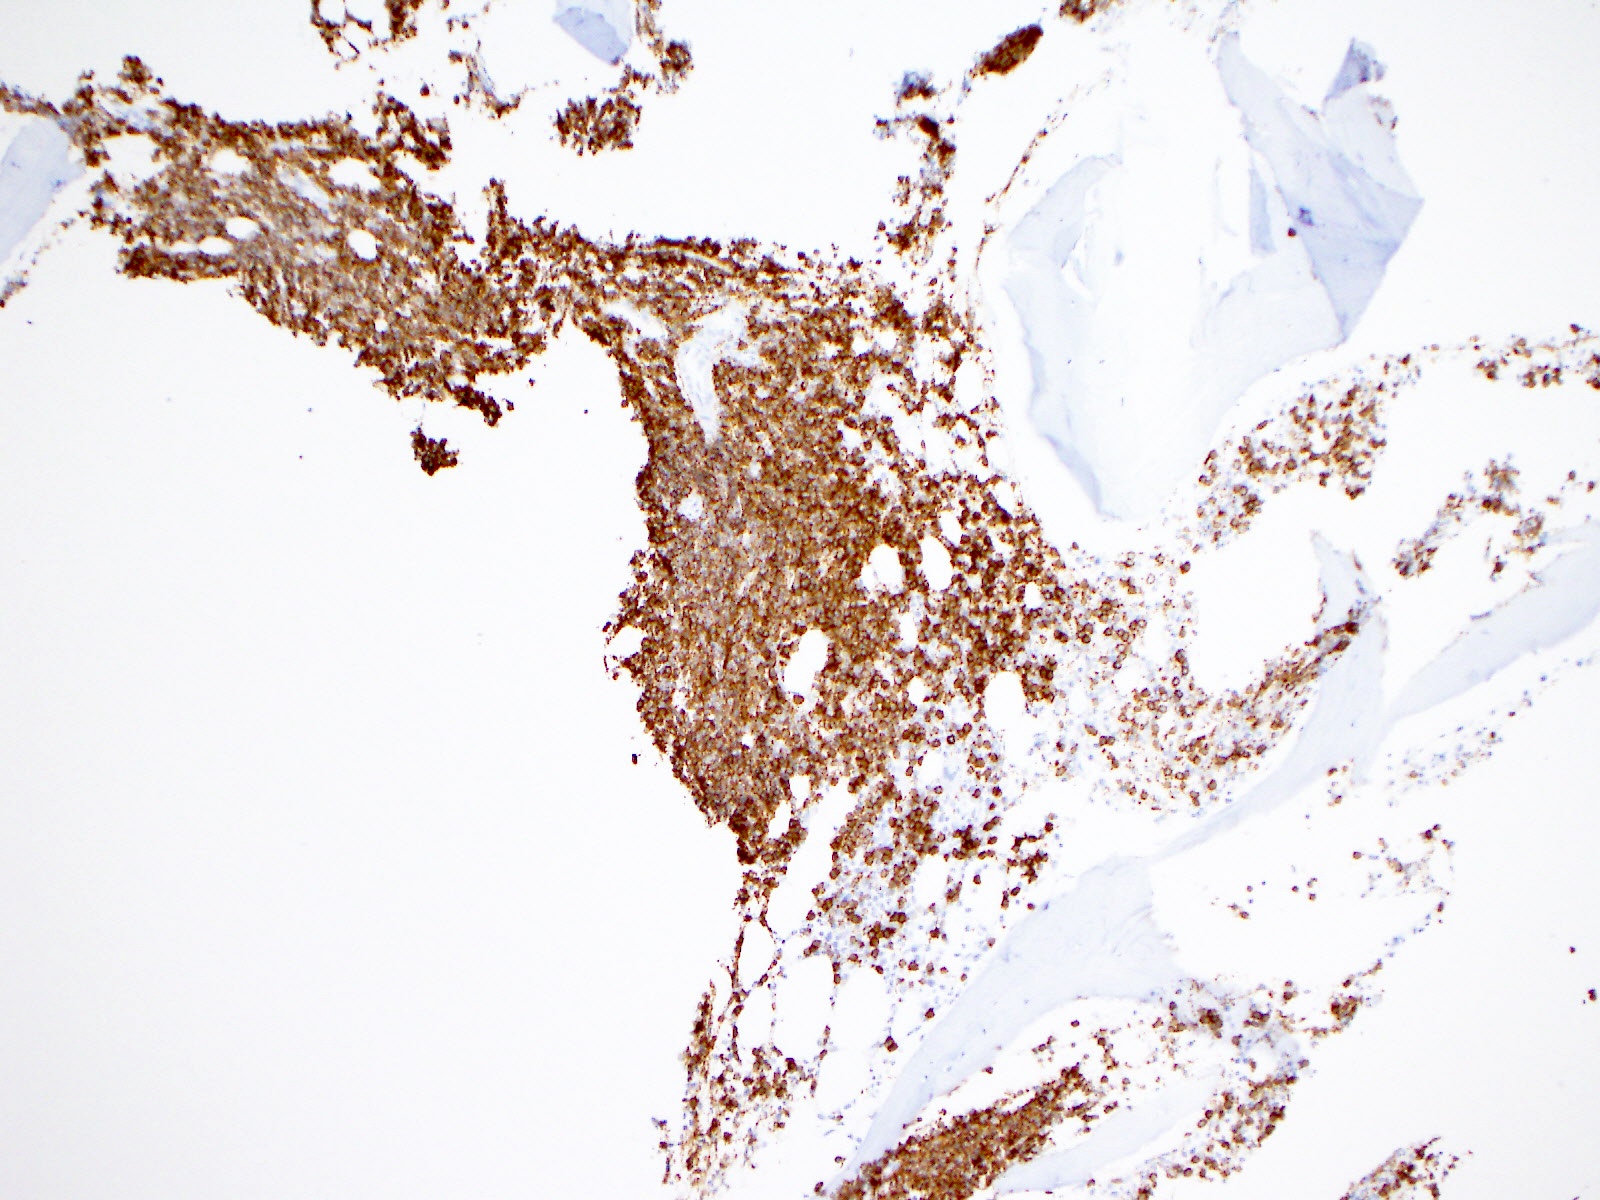
CD34 bone marrow
Contributed by Etan Marks, D.O.
Large irregular myeloblasts

Back to back myeloblasts
Contributed by Barina Aqil, M.D.

Increased blasts
Increased blasts
Atypical mononuclear cells
Blast morphology
Contributed by Barina Aqil, M.D.

Circulating blasts
Circulating blasts, MPO negative
Circulating blasts, ANB positive
Contributed by Barina Aqil, M.D.

Blast phenotype
Contributed by Barina Aqil, M.D.
Atypical mononuclear cells

Blast morphology

Increased blasts
Blasts
Contributed by Barina Aqil, M.D.

Circulating blasts
Contributed by Ameet R. Kini, M.D., Ph.D. and Maryam F. Raouf, M.D.
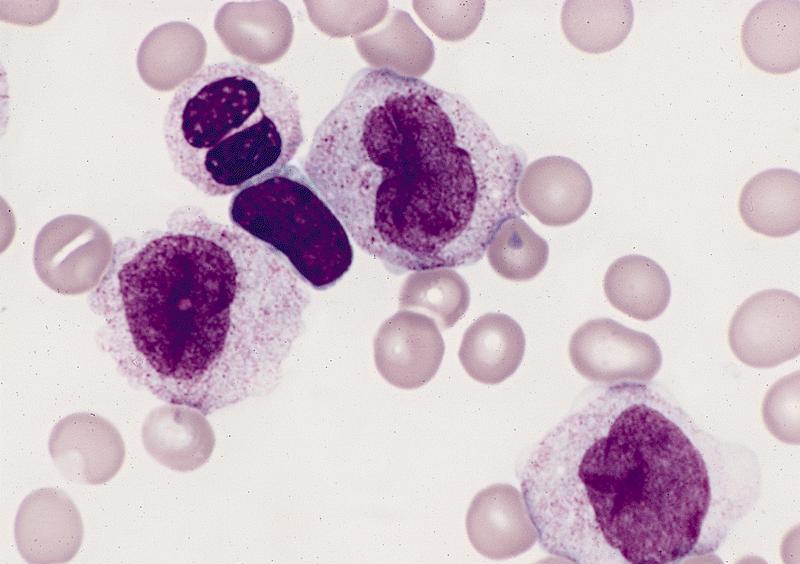
Increased blasts and promonocytes
Abnormal eosinophilic cell
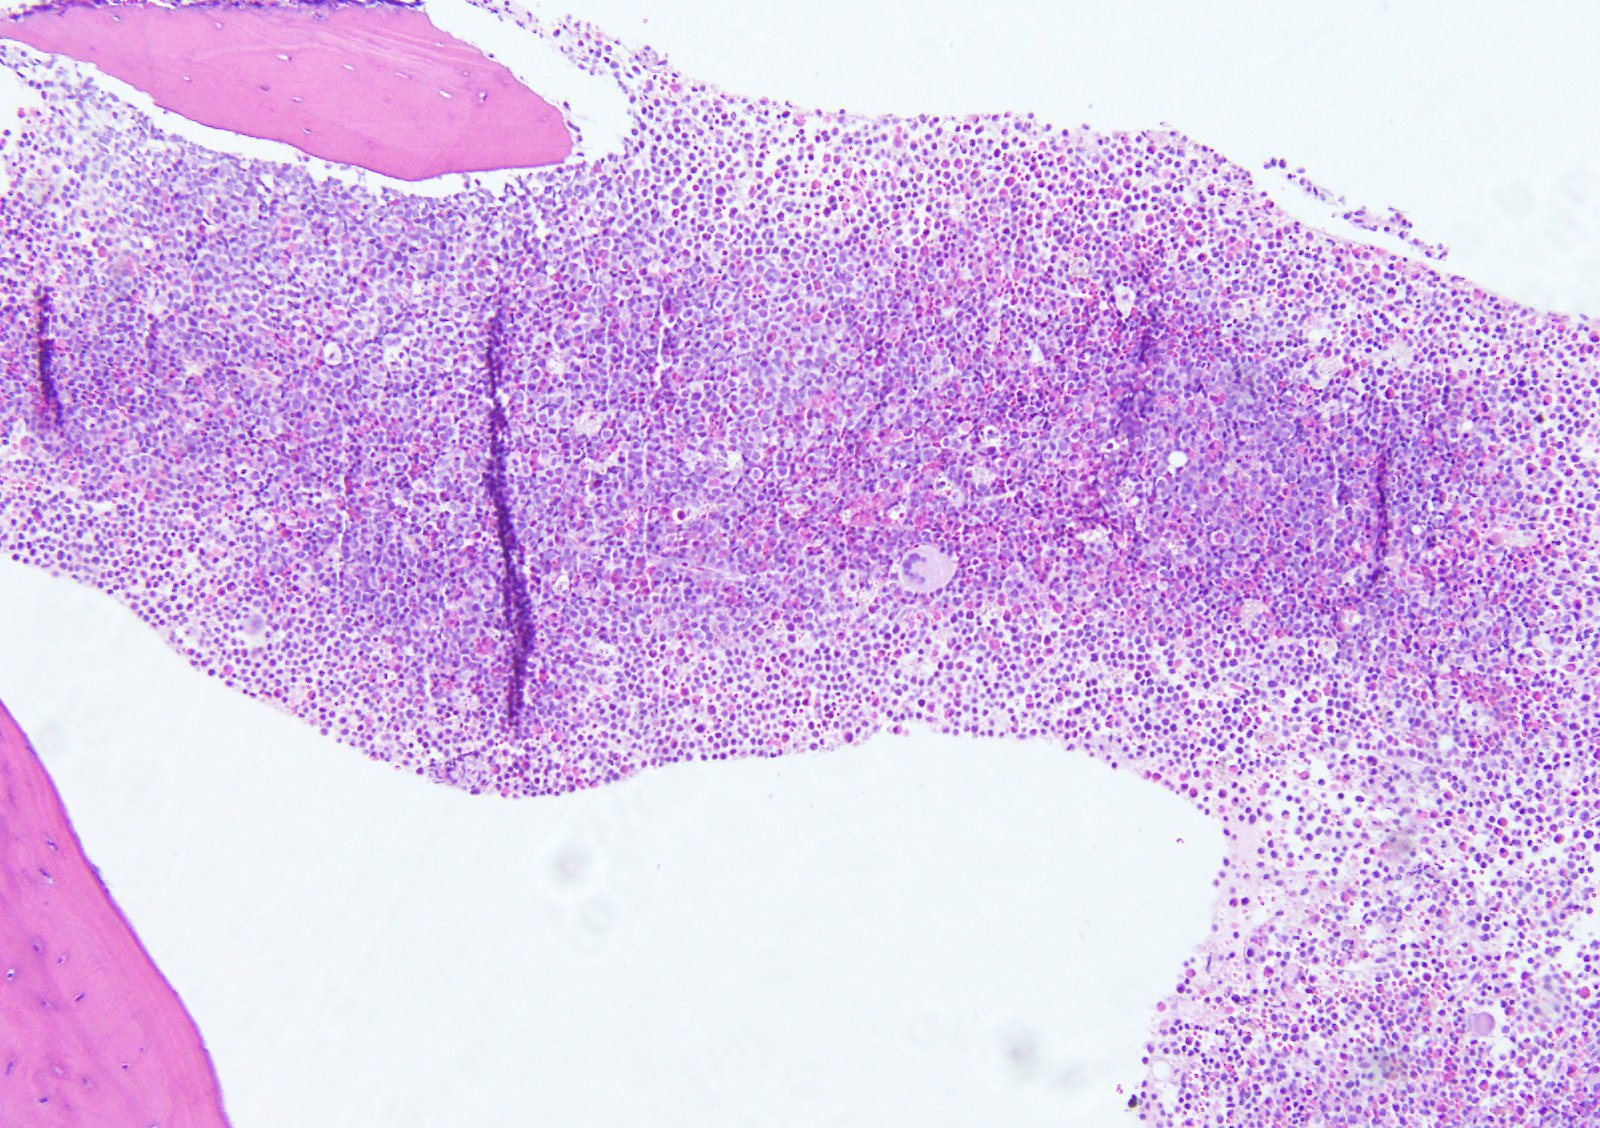
Hypercellular bone marrow
Images hosted on other servers:

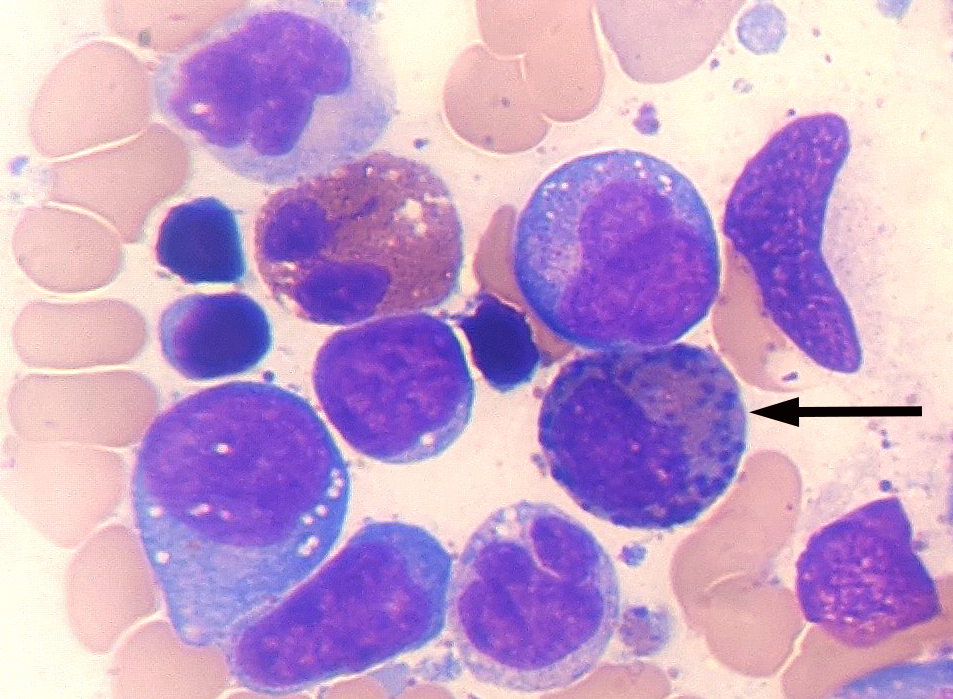
AML with abnormal eosinophils (arrow)

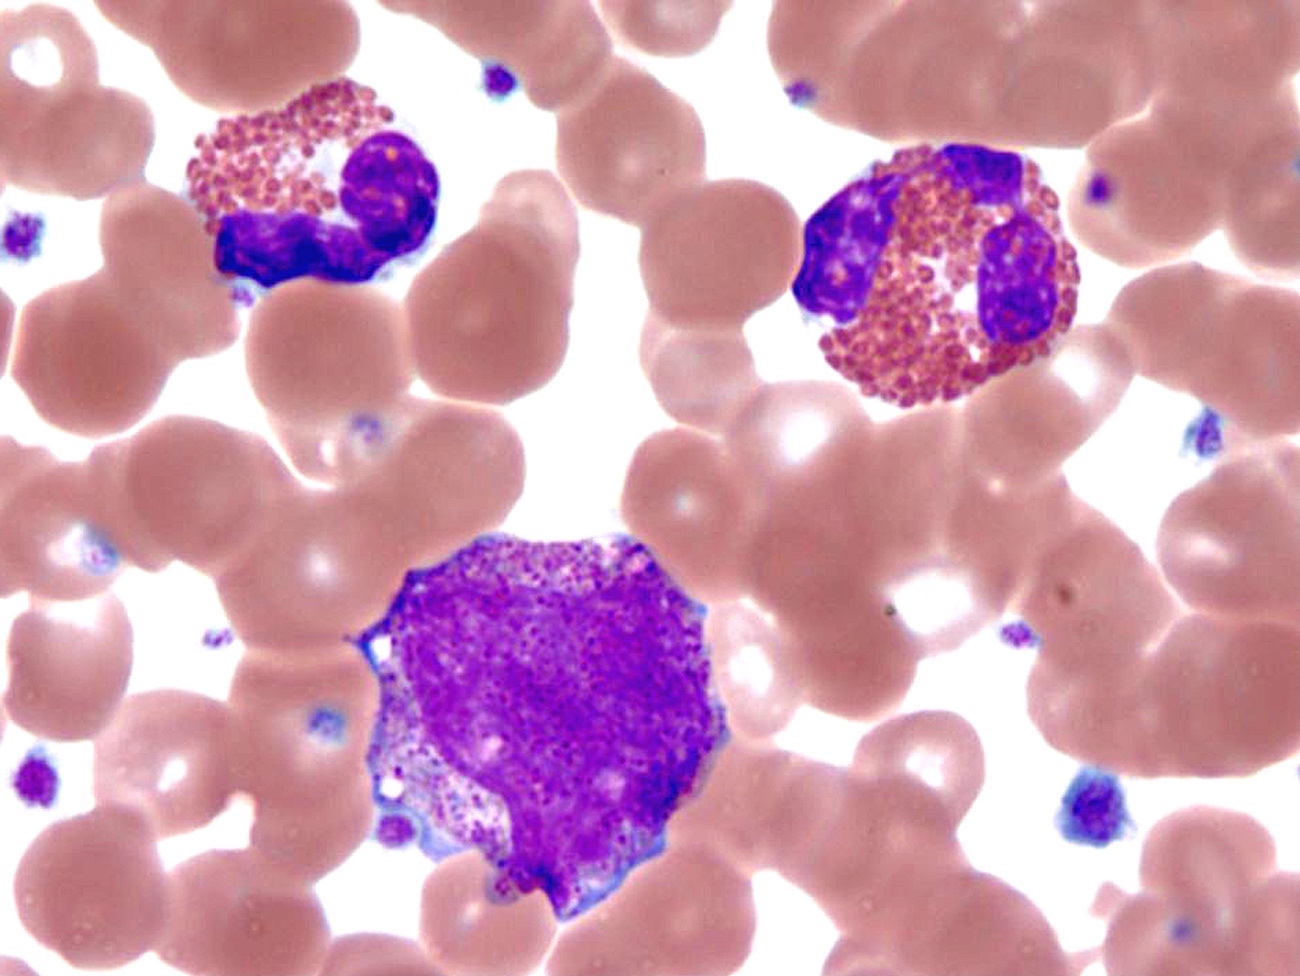
Abnormal eosinophils with prominent purple granules

Abnormal eosinophils cluster in patient with AMML

Abnormal immature eosinophil found in bone marrow

Abnormal eosinophil with basophilic granules
Contributed by Ameet R. Kini, M.D., Ph.D. and Maryam F. Raouf, M.D.
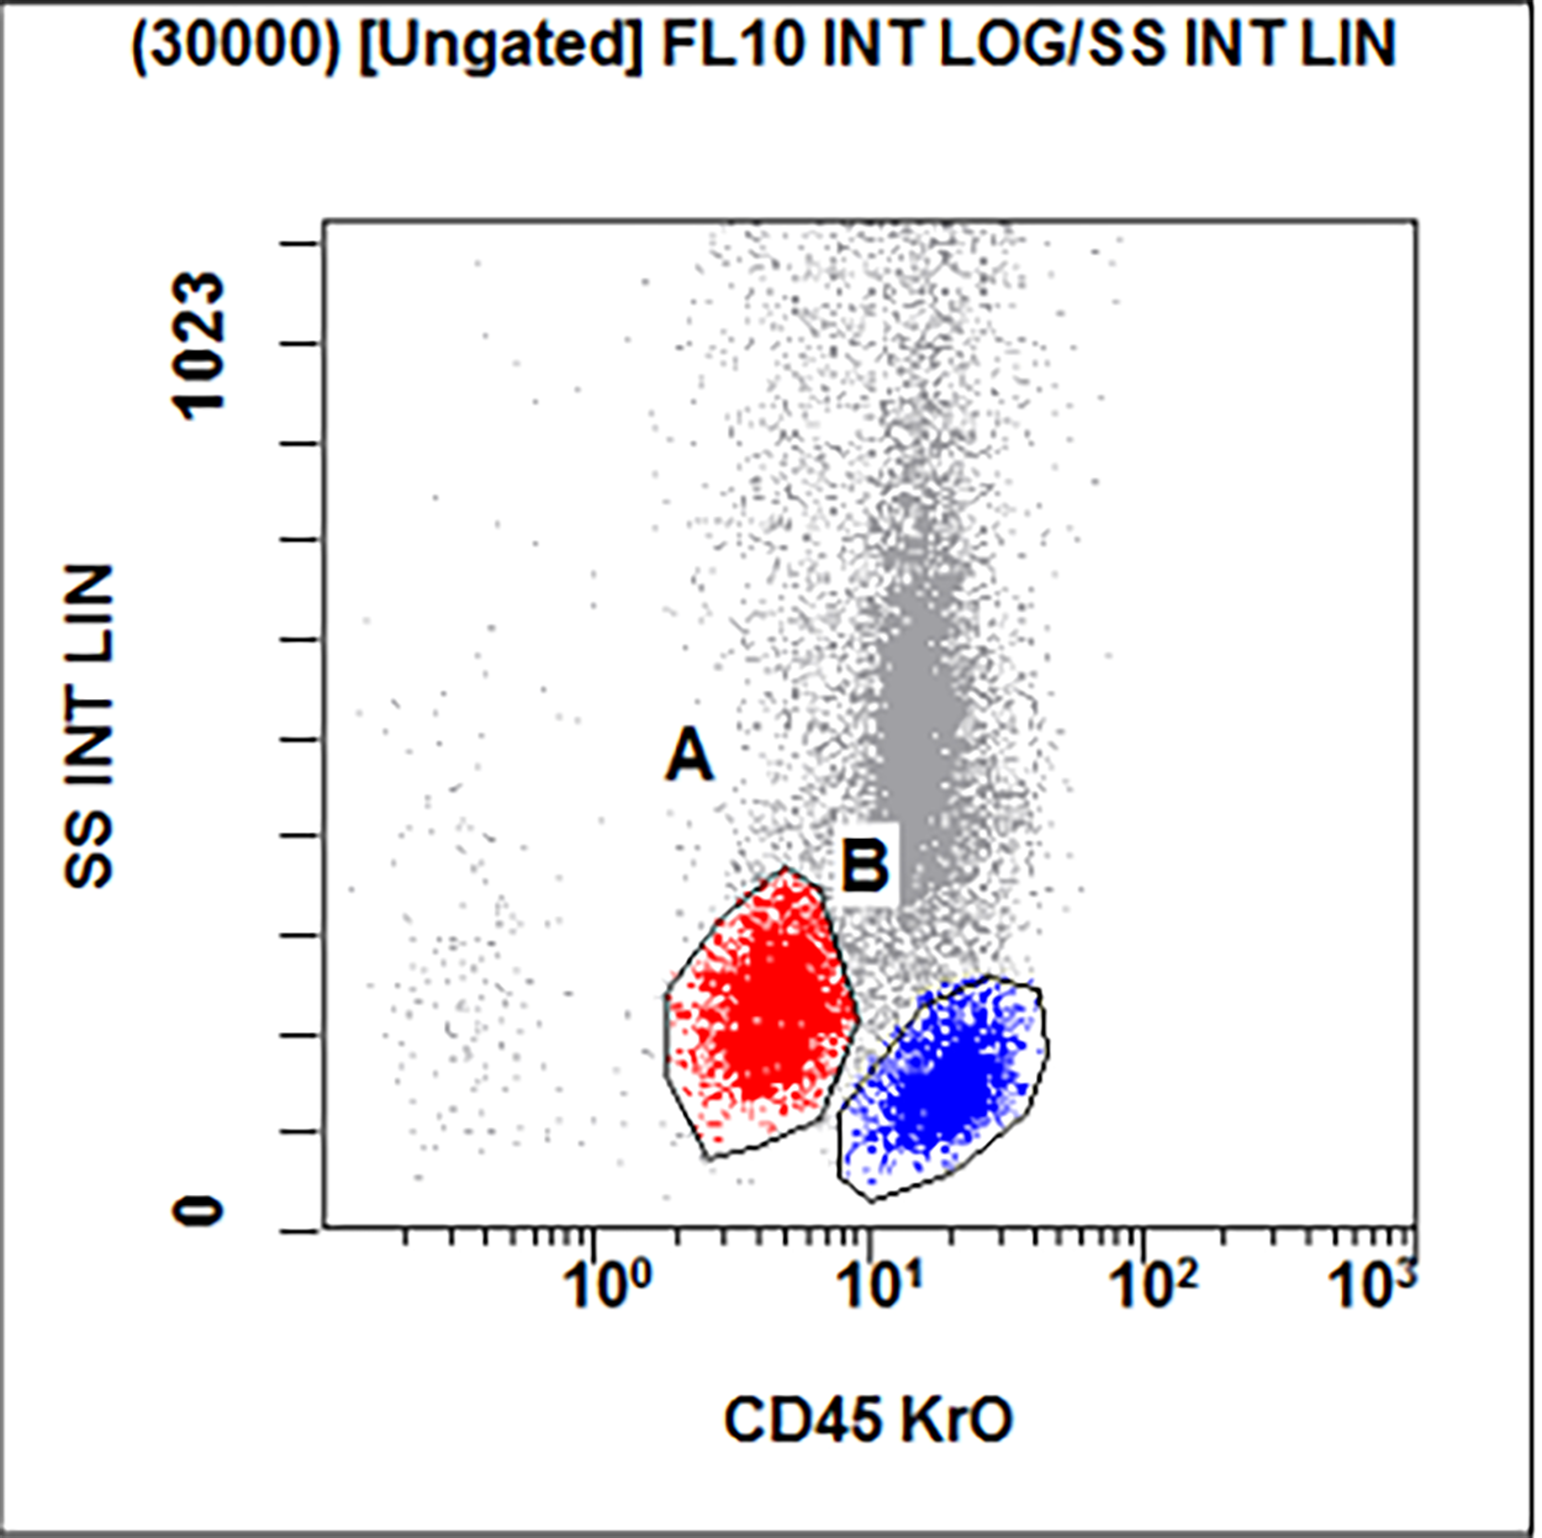
Blasts with dim CD45
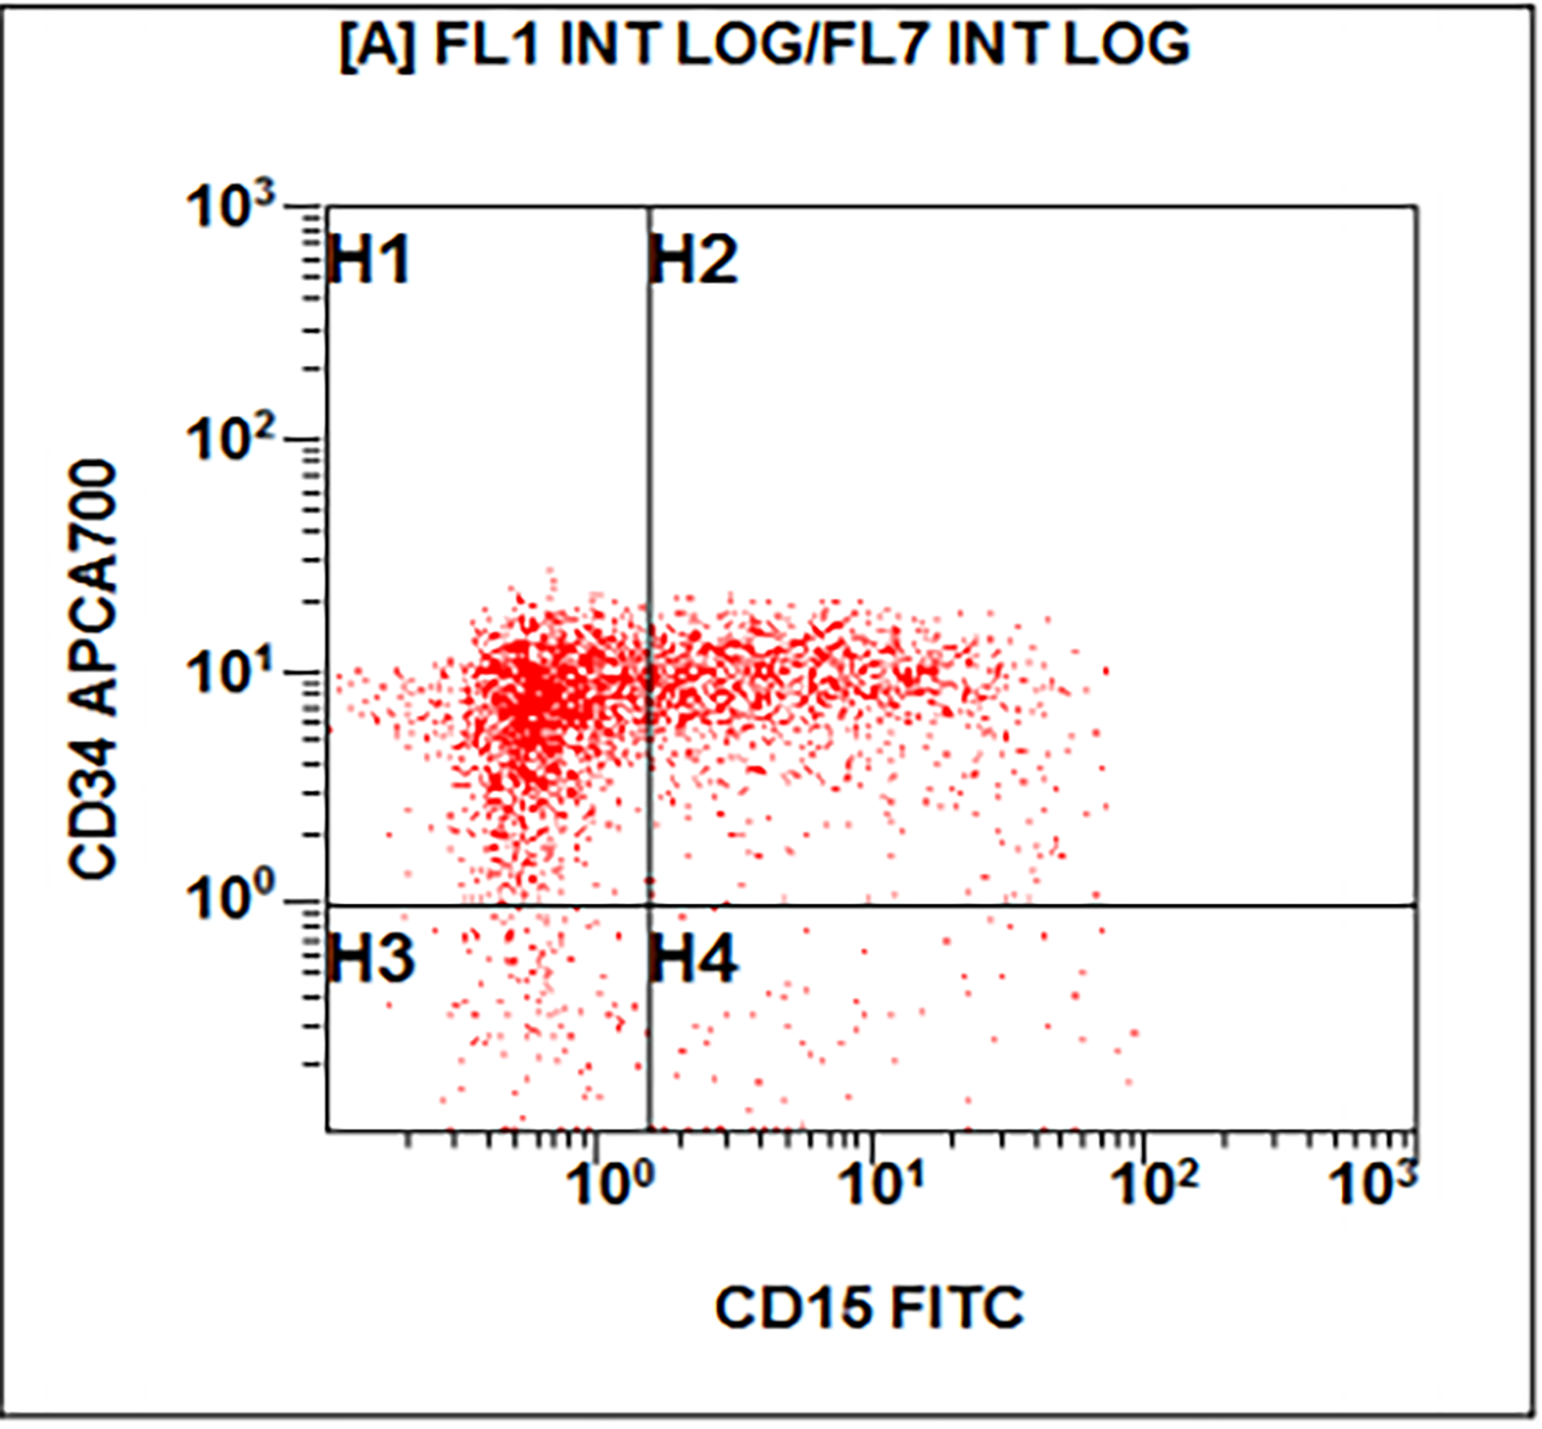
Blasts with CD34, CD15
Increased blasts with HLA-DR, CD33
Blasts with CD13, CD117
Contributed by Ameet R. Kini, M.D., Ph.D. and Maryam F. Raouf, M.D.
Inversion of chromosome 16
CBFB FISH
AML diagnosis
Targeted therapy for inv(16)
AML diagnosis and treatment
MRD in AML
Contributed by Alexa J. Siddon, M.D.
Hypercellular marrow with increased blasts
Aspirate with hypolobated megakaryocyte
Aspirate with blasts
Images hosted on other servers:

Double inv(3)(q21q26) and monosomy 7

FISH with EVI1 breakapart probe
AFIP images
Bone marrow
biopsy: markedly
hypercellular
marrow
Diagnosed as AML with maturation because no t(15;17) and no DIC but FISH not done, so may actually be acute promyelocytic leukemia
Myeloperoxidase positive blasts
Erythroid cells are negative
Bone marrow smears (Wright-Giemsa):
Type III myeloblasts
Myeloblasts,
promyelocytes,
myelocytes and
neutrophils
Several myeloblasts and maturing forms
Pseudopods, cytoplasm and prominent Auer rods
Several blasts have prominent nucleoli and Auer rods
AFIP images
Numerous primary granules and fusion of Auer rods
AFIP images
Bone marrow smear
(Wright-Giemsa):
no differentiated
features
Bone marrow biopsy:
complete replacement
of marrow by blasts
without differentiation
Myeloblasts are negative for myeloperoxidase
Images hosted on other servers:

Bone marrow smear
(Wright-Giemsa):
no differentiated
features

Blasts are positive for myeloperoxidase by IHC
Images hosted on other servers:

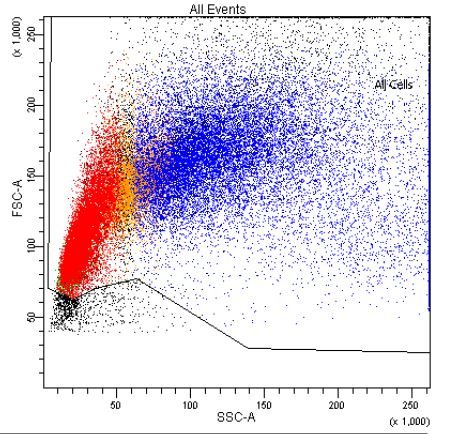
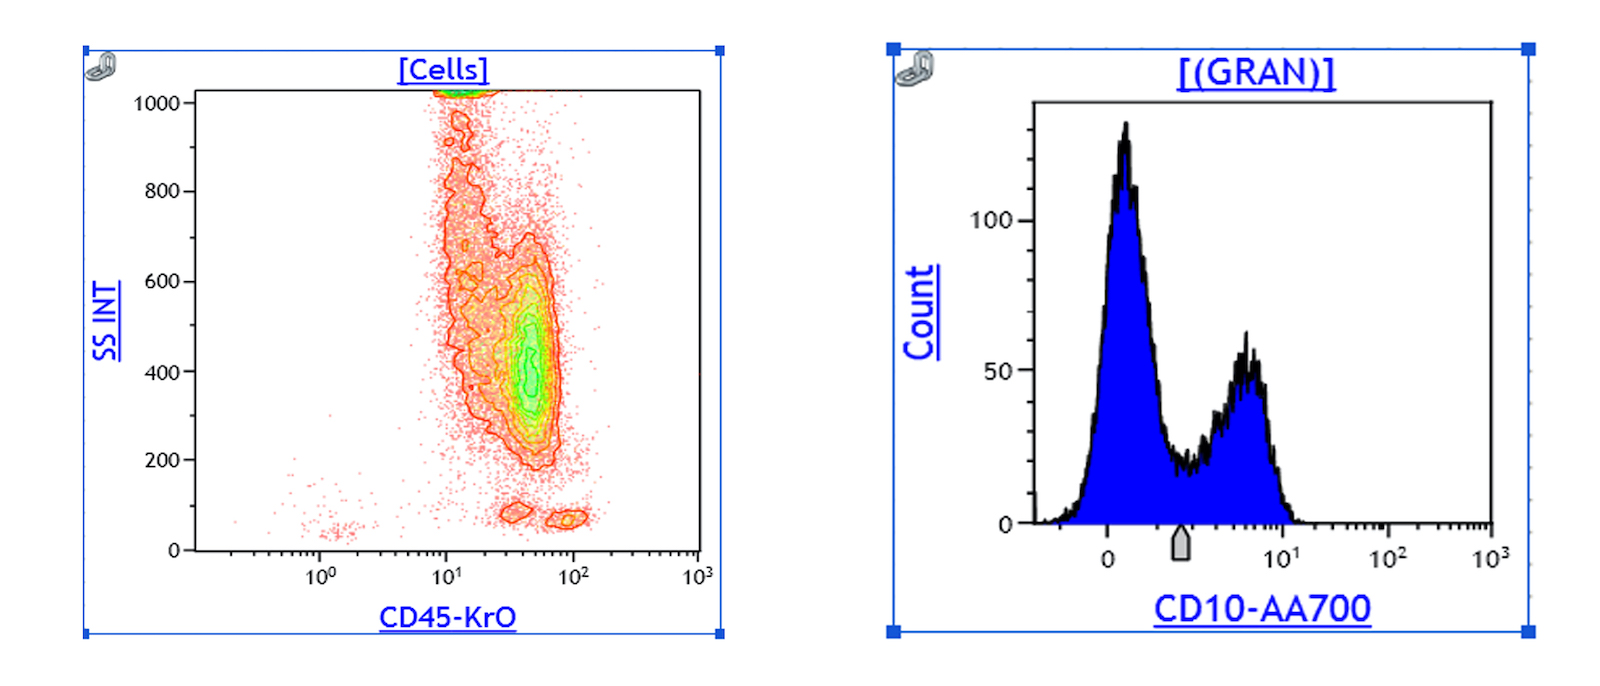
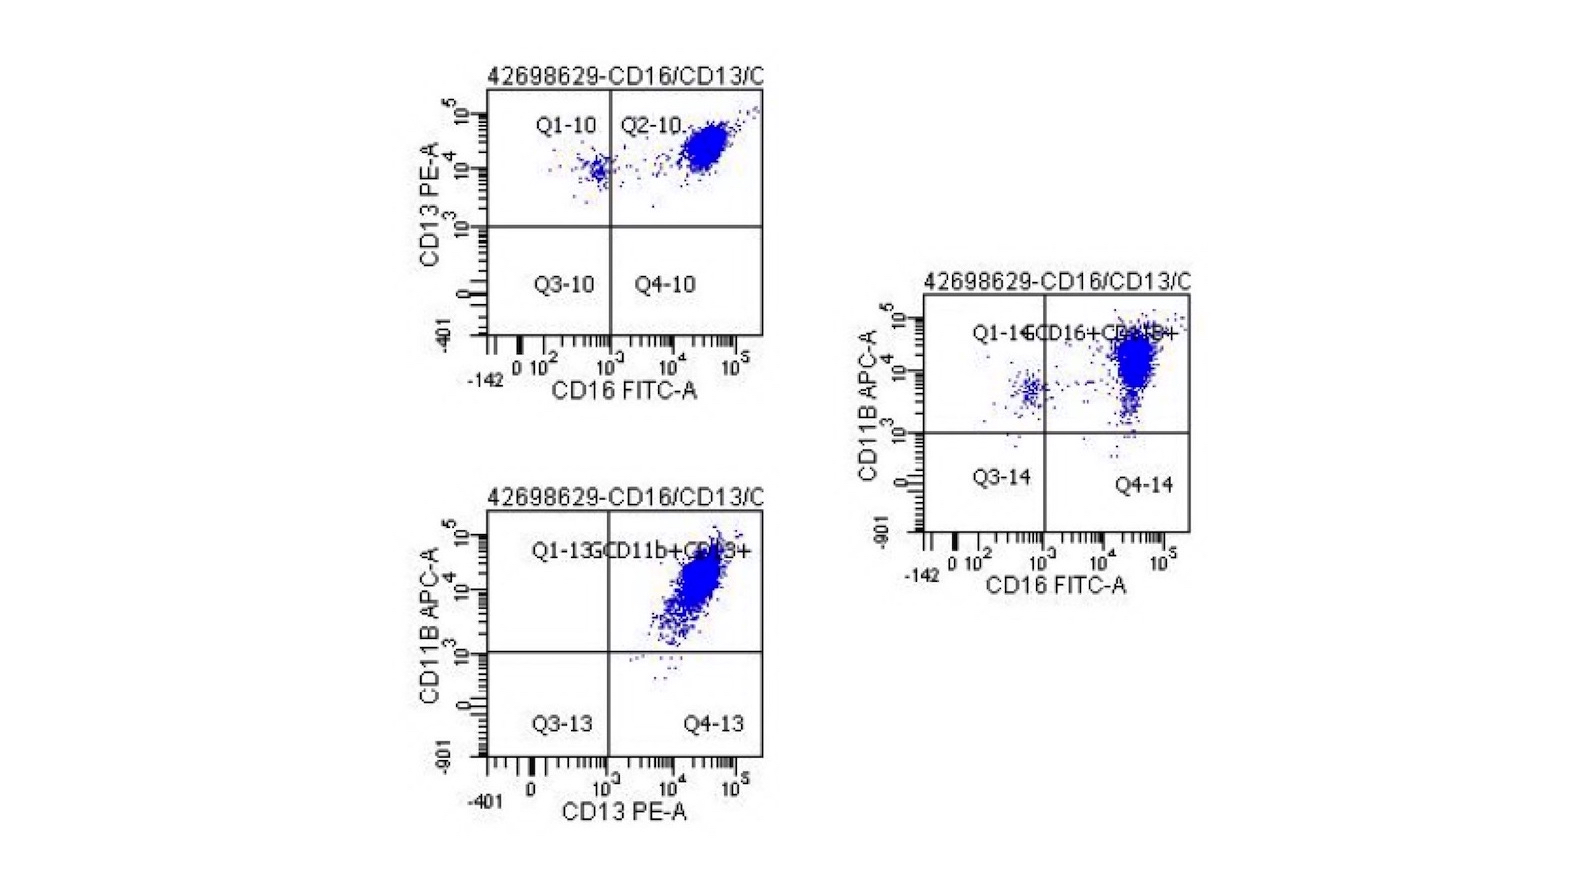
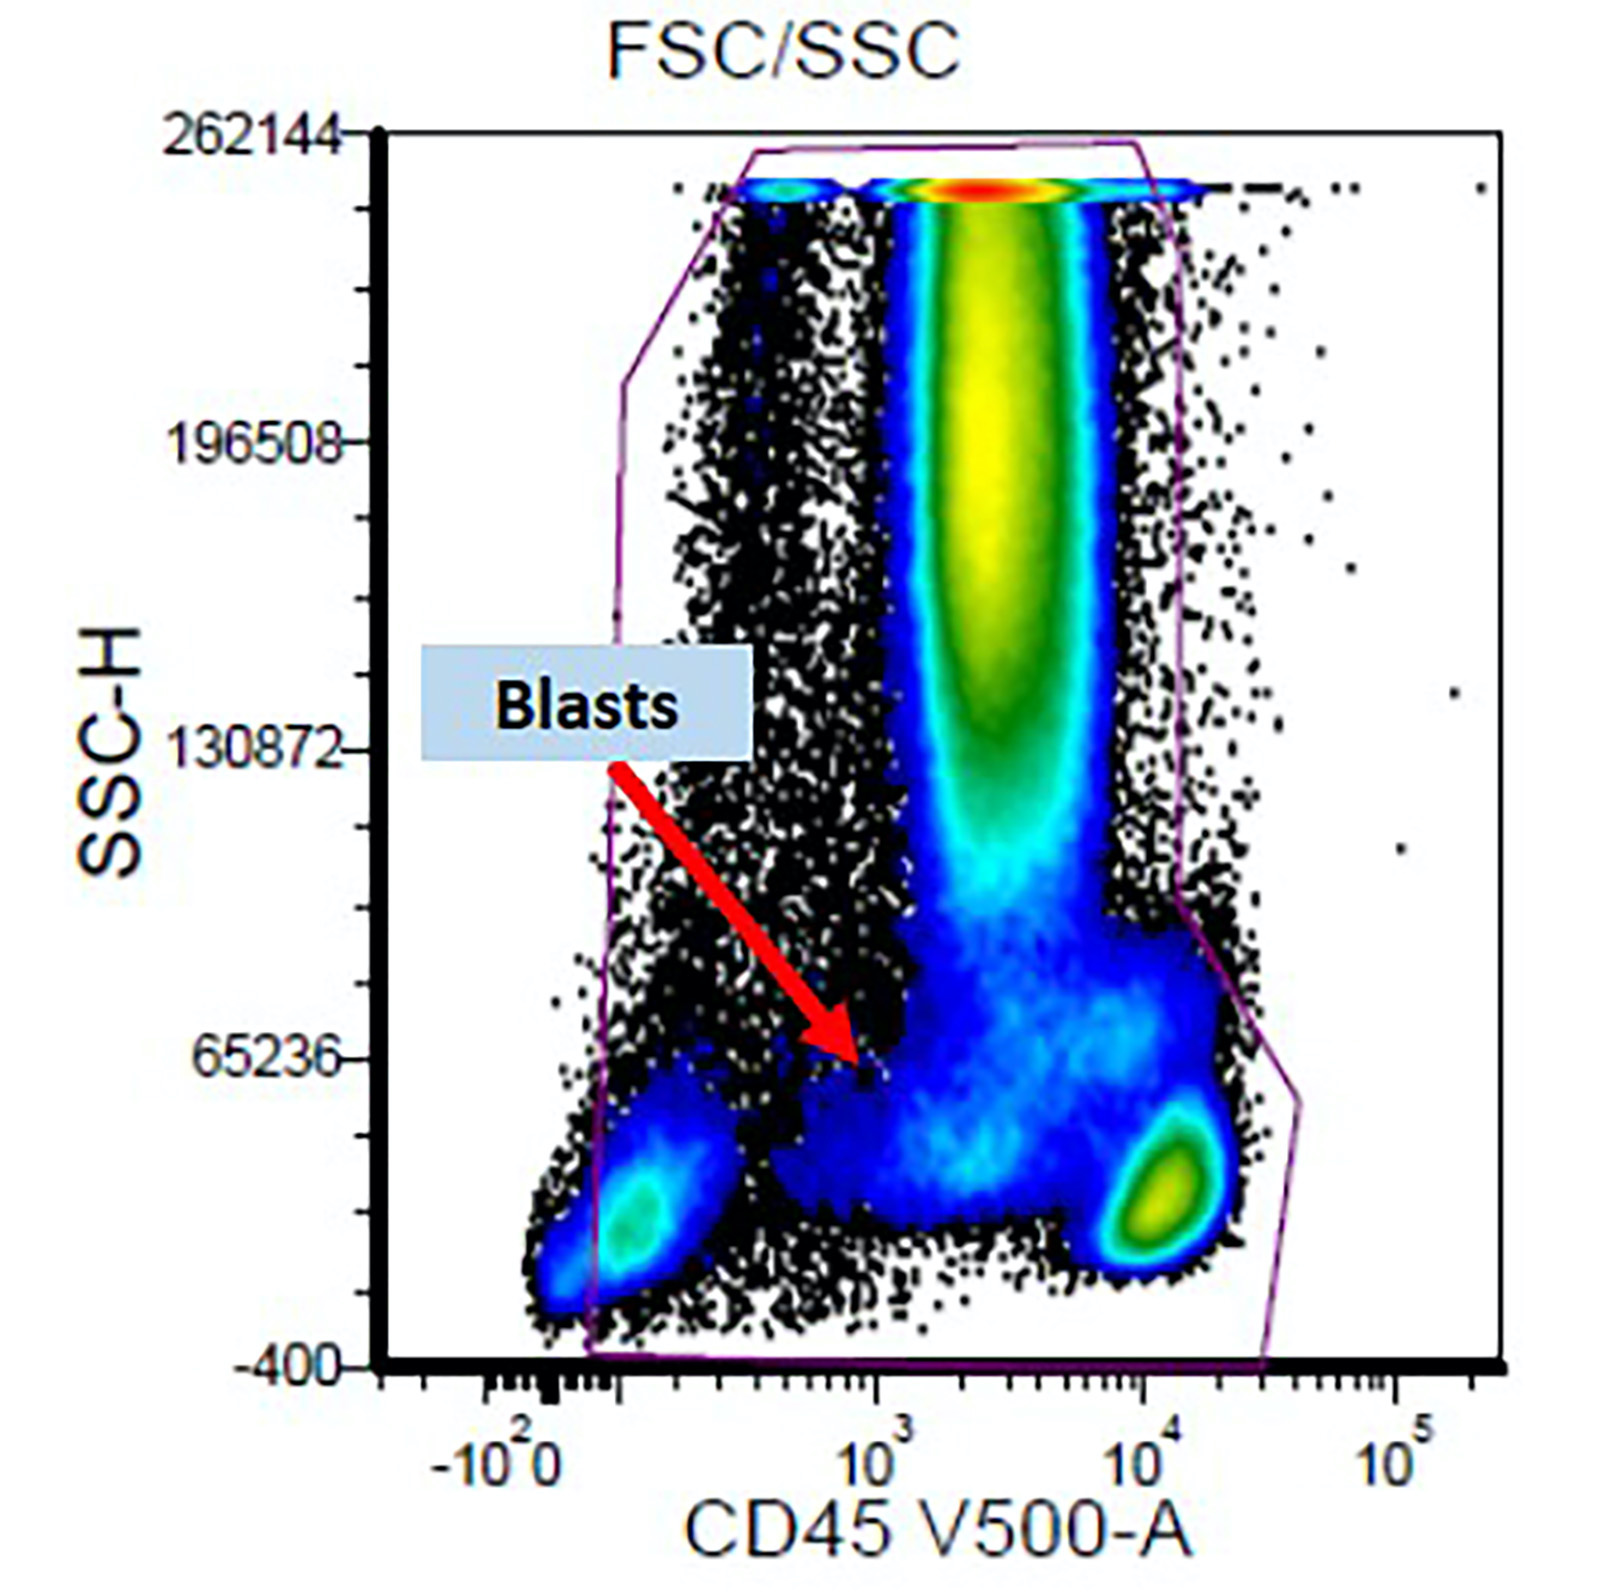
Various gating plots
AFIP images
Granules are myeloperoxidase positive
Images hosted on other servers:

Granules are myeloperoxidase positive
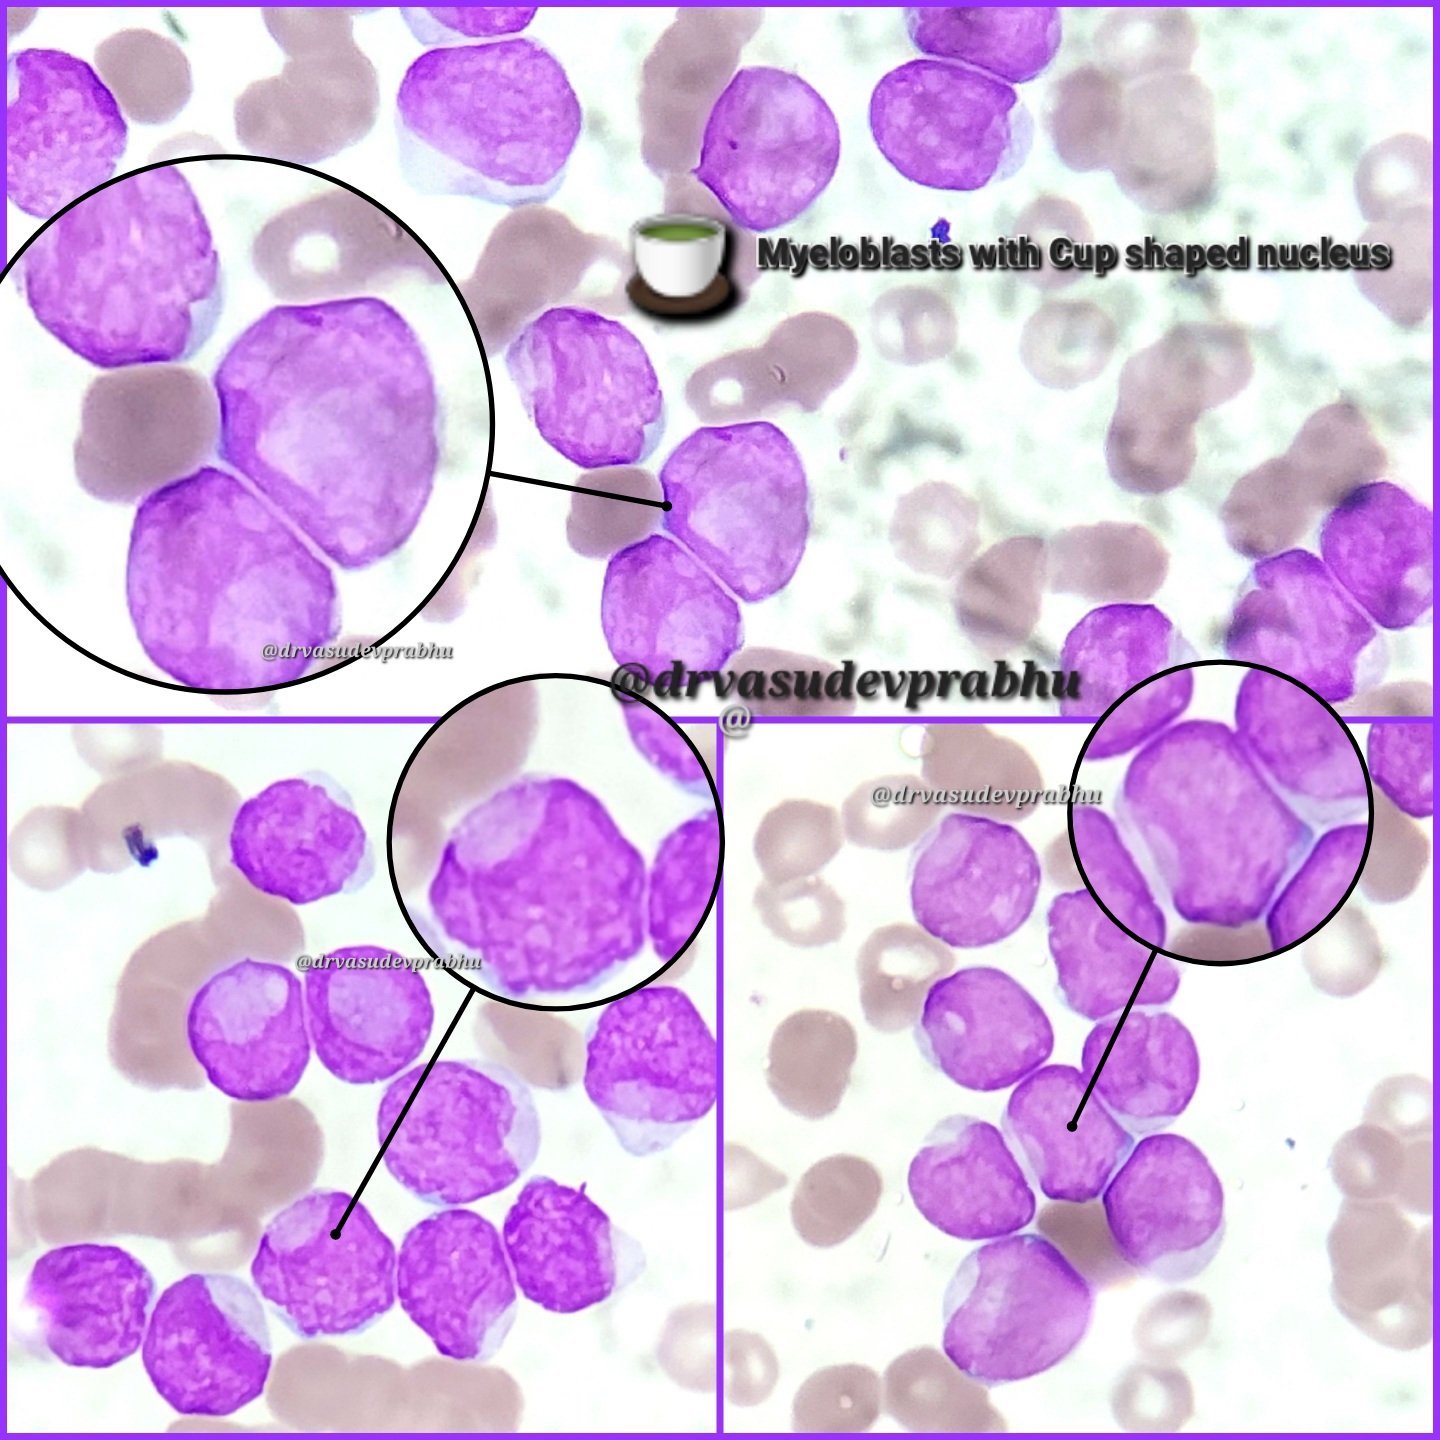
Contributed by Kamran M. Mirza, M.D., Ph.D.
Blasts with cup-like indentations
Contributed by Genevieve M. Crane, M.D., Ph.D.
Bone marrow core biopsy
Bone marrow clot
Bone marrow clot, CD34
Bone marrow clot, CD117
Contributed by Genevieve M. Crane, M.D., Ph.D.
Bone marrow aspirate with increased blasts
Contributed by Genevieve M. Crane, M.D., Ph.D.
Peripheral blood smear with increased blasts
Contributed by Srishti Gupta, M.B.B.S., M.D. and Elizabeth Courville, M.D.
Hypercellular bone marrow
Dysmegakaryopoiesis

Dysmegakaryopoiesis

CD34 positive blasts
Hypercellular bone marrow
Dysmyelopoiesis and blasts

Myeloid dysplasia with blasts
Bilineage dysplasia
Contributed by Srishti Gupta, M.B.B.S., M.D. and Elizabeth Courville, M.D.
Hypogranular neutrophils, blast
Hypogranular, hypolobate neutrophil, blast
Hypogranular, hypolobate neutrophil
Contributed by Eli Williams, Ph.D.

Deletion of 7(q)
Images hosted on other servers:

Frequent KMT2A partner genes
Contributed by William Morrow, M.D.

Aspirate with increased blasts

Aspirate with increased monoblasts

Increased monoblasts

Clot section blast aggregate

Core biopsy blast sheets
Muramidase (lysozyme) IHC

CD4 IHC
Contributed by William Morrow, M.D.

Circulating blasts
Circulating monoblasts
Contributed by William Morrow, M.D.

Flow CD33 versus CD64

Flow CD11b versus CD64

Flow CD33 versus CD34
Contributed by William Morrow, M.D.
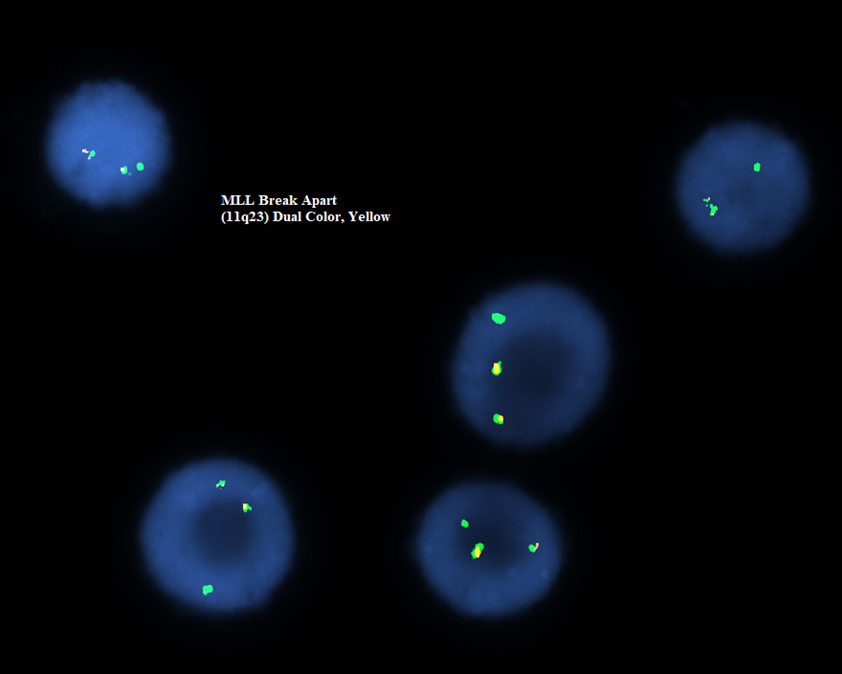
KMT2A break apart FISH
Images hosted on other servers:

Cryptic KMT2A::MLLT4 fusion

FISH of KMT2A::SEPT5 fusion
AFIP images
Specific granules
resemble
Chediak-Higashi
anomaly
Contributed by Hatem Kaseb, M.D., Ph.D., M.P.H.
Numerous blasts
Numerous blasts and myelodysplasia related changes
Contributed by Hatem Kaseb, M.D., Ph.D., M.P.H.
Scattered blasts
Contributed by Sean Gu, M.D., Ph.D., Alexa J. Siddon, M.D. and AFIP images
Left shift
Blasts
Aspirate morphology
Bone marrow smear (Wright-Giemsa)
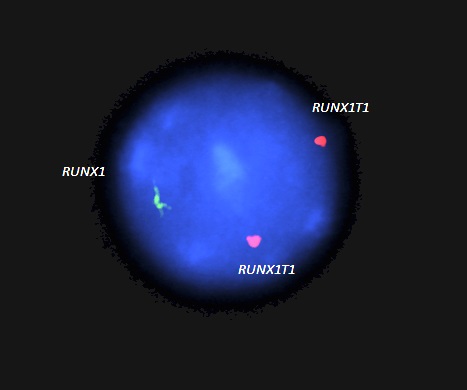
Images hosted on other servers:

Myeloblast in AML with t(8;21)
Contributed by Genevieve M. Crane, M.D., Ph.D.
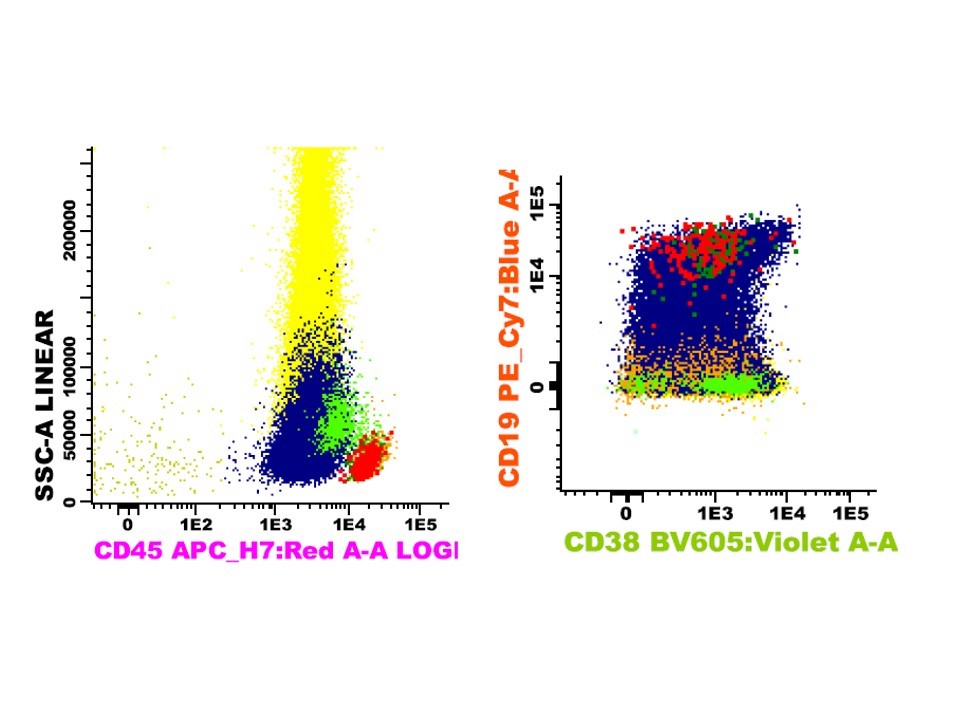
Partial CD19 expression in AML with t(8;21)
AFIP images
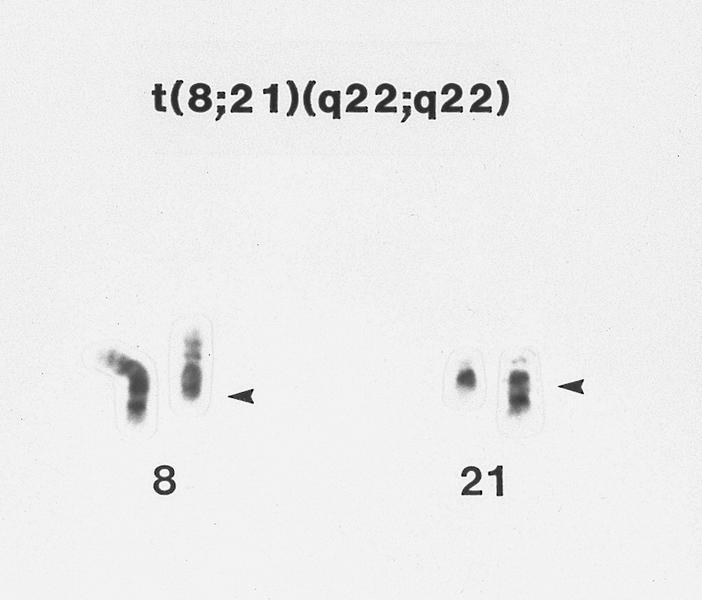
t(8;21) with abnormal chromosomes
Images hosted on other servers:

FISH probes showing
2 abnormal yellow
fusions made of red
and green probes
AFIP images
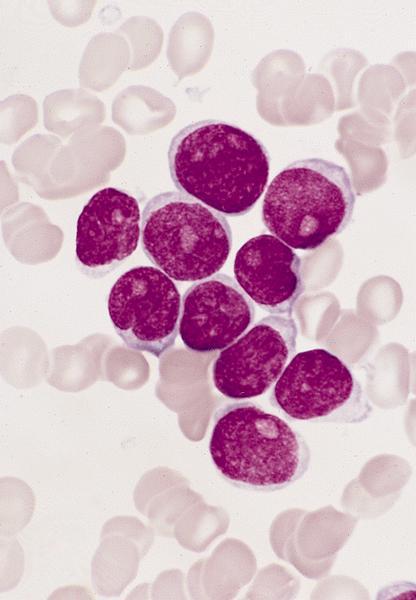
Blasts show mild size variation
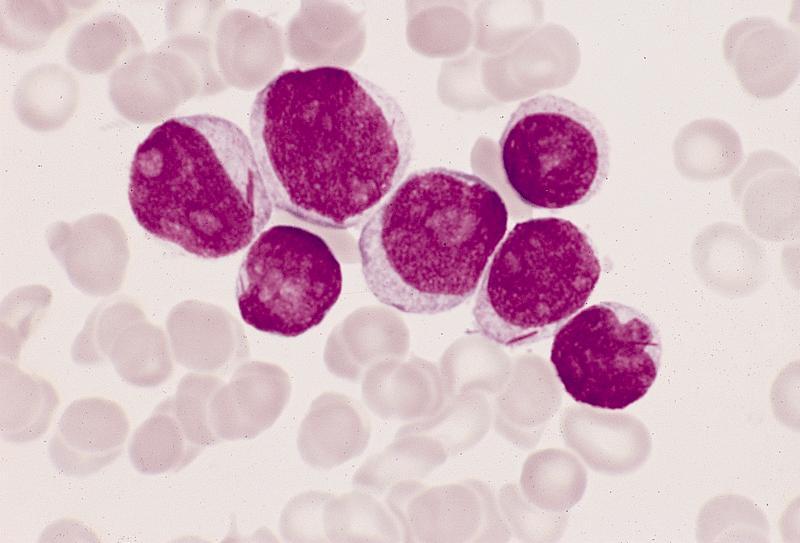
Blasts show more variation in size and number of nucleoli
Myeloblasts have irregular nuclei
Myeloblasts have marked size variation
Some variation in size
Large myeloblasts
with abundant
eosinophilic
cytoplasm
Agranular myeloblasts
Bone marrow biopsy
Myeloblasts are myeloperoxidase+
Numerous granules are Sudan black B+
AFIP images
Peripheral blood smear
AFIP images
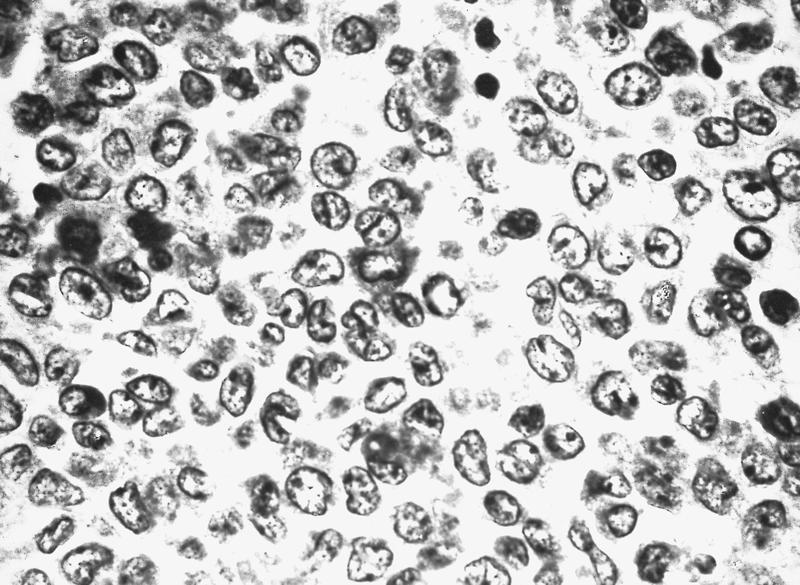
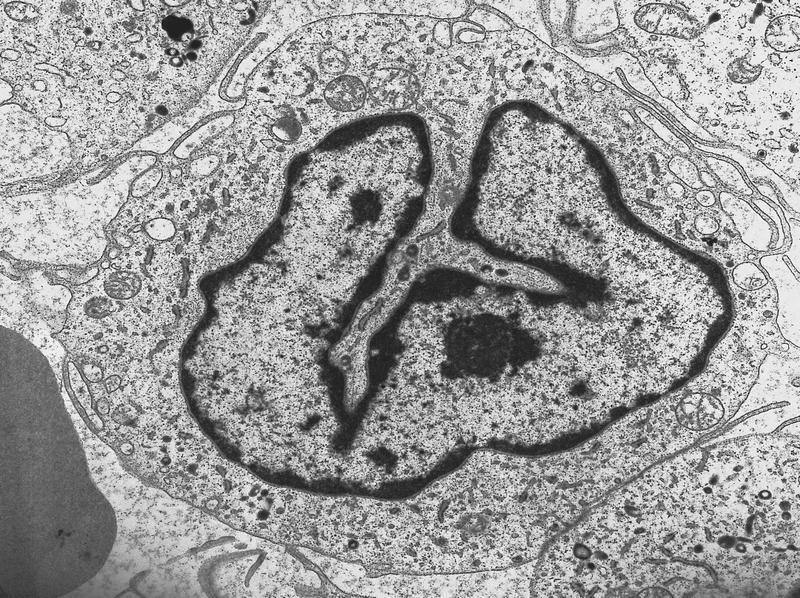
Numerous electron dense granules in Golgi region
Contributed by Anamarija M. Perry, M.D., @sanamloghavi on Twitter and AFIP
Hypercellular bone marrow
Abnormal promyelocytes
 Contributed by @sanamloghavi on Twitter (see original post here)">
APL with PML::RARA
 Contributed by @sanamloghavi on Twitter (see original post here)">

APL with PML::RARA
Bone marrow biopsy
Bone marrow smear (Wright-Giemsa)
Treatment related
Microgranular variant
Contributed by Anamarija M. Perry, M.D.
Microgranular variant
Contributed by Anamarija M. Perry, M.D.
Classic variant, CD13+ and CD33+
Classic variant, HLA-DR- and CD34-
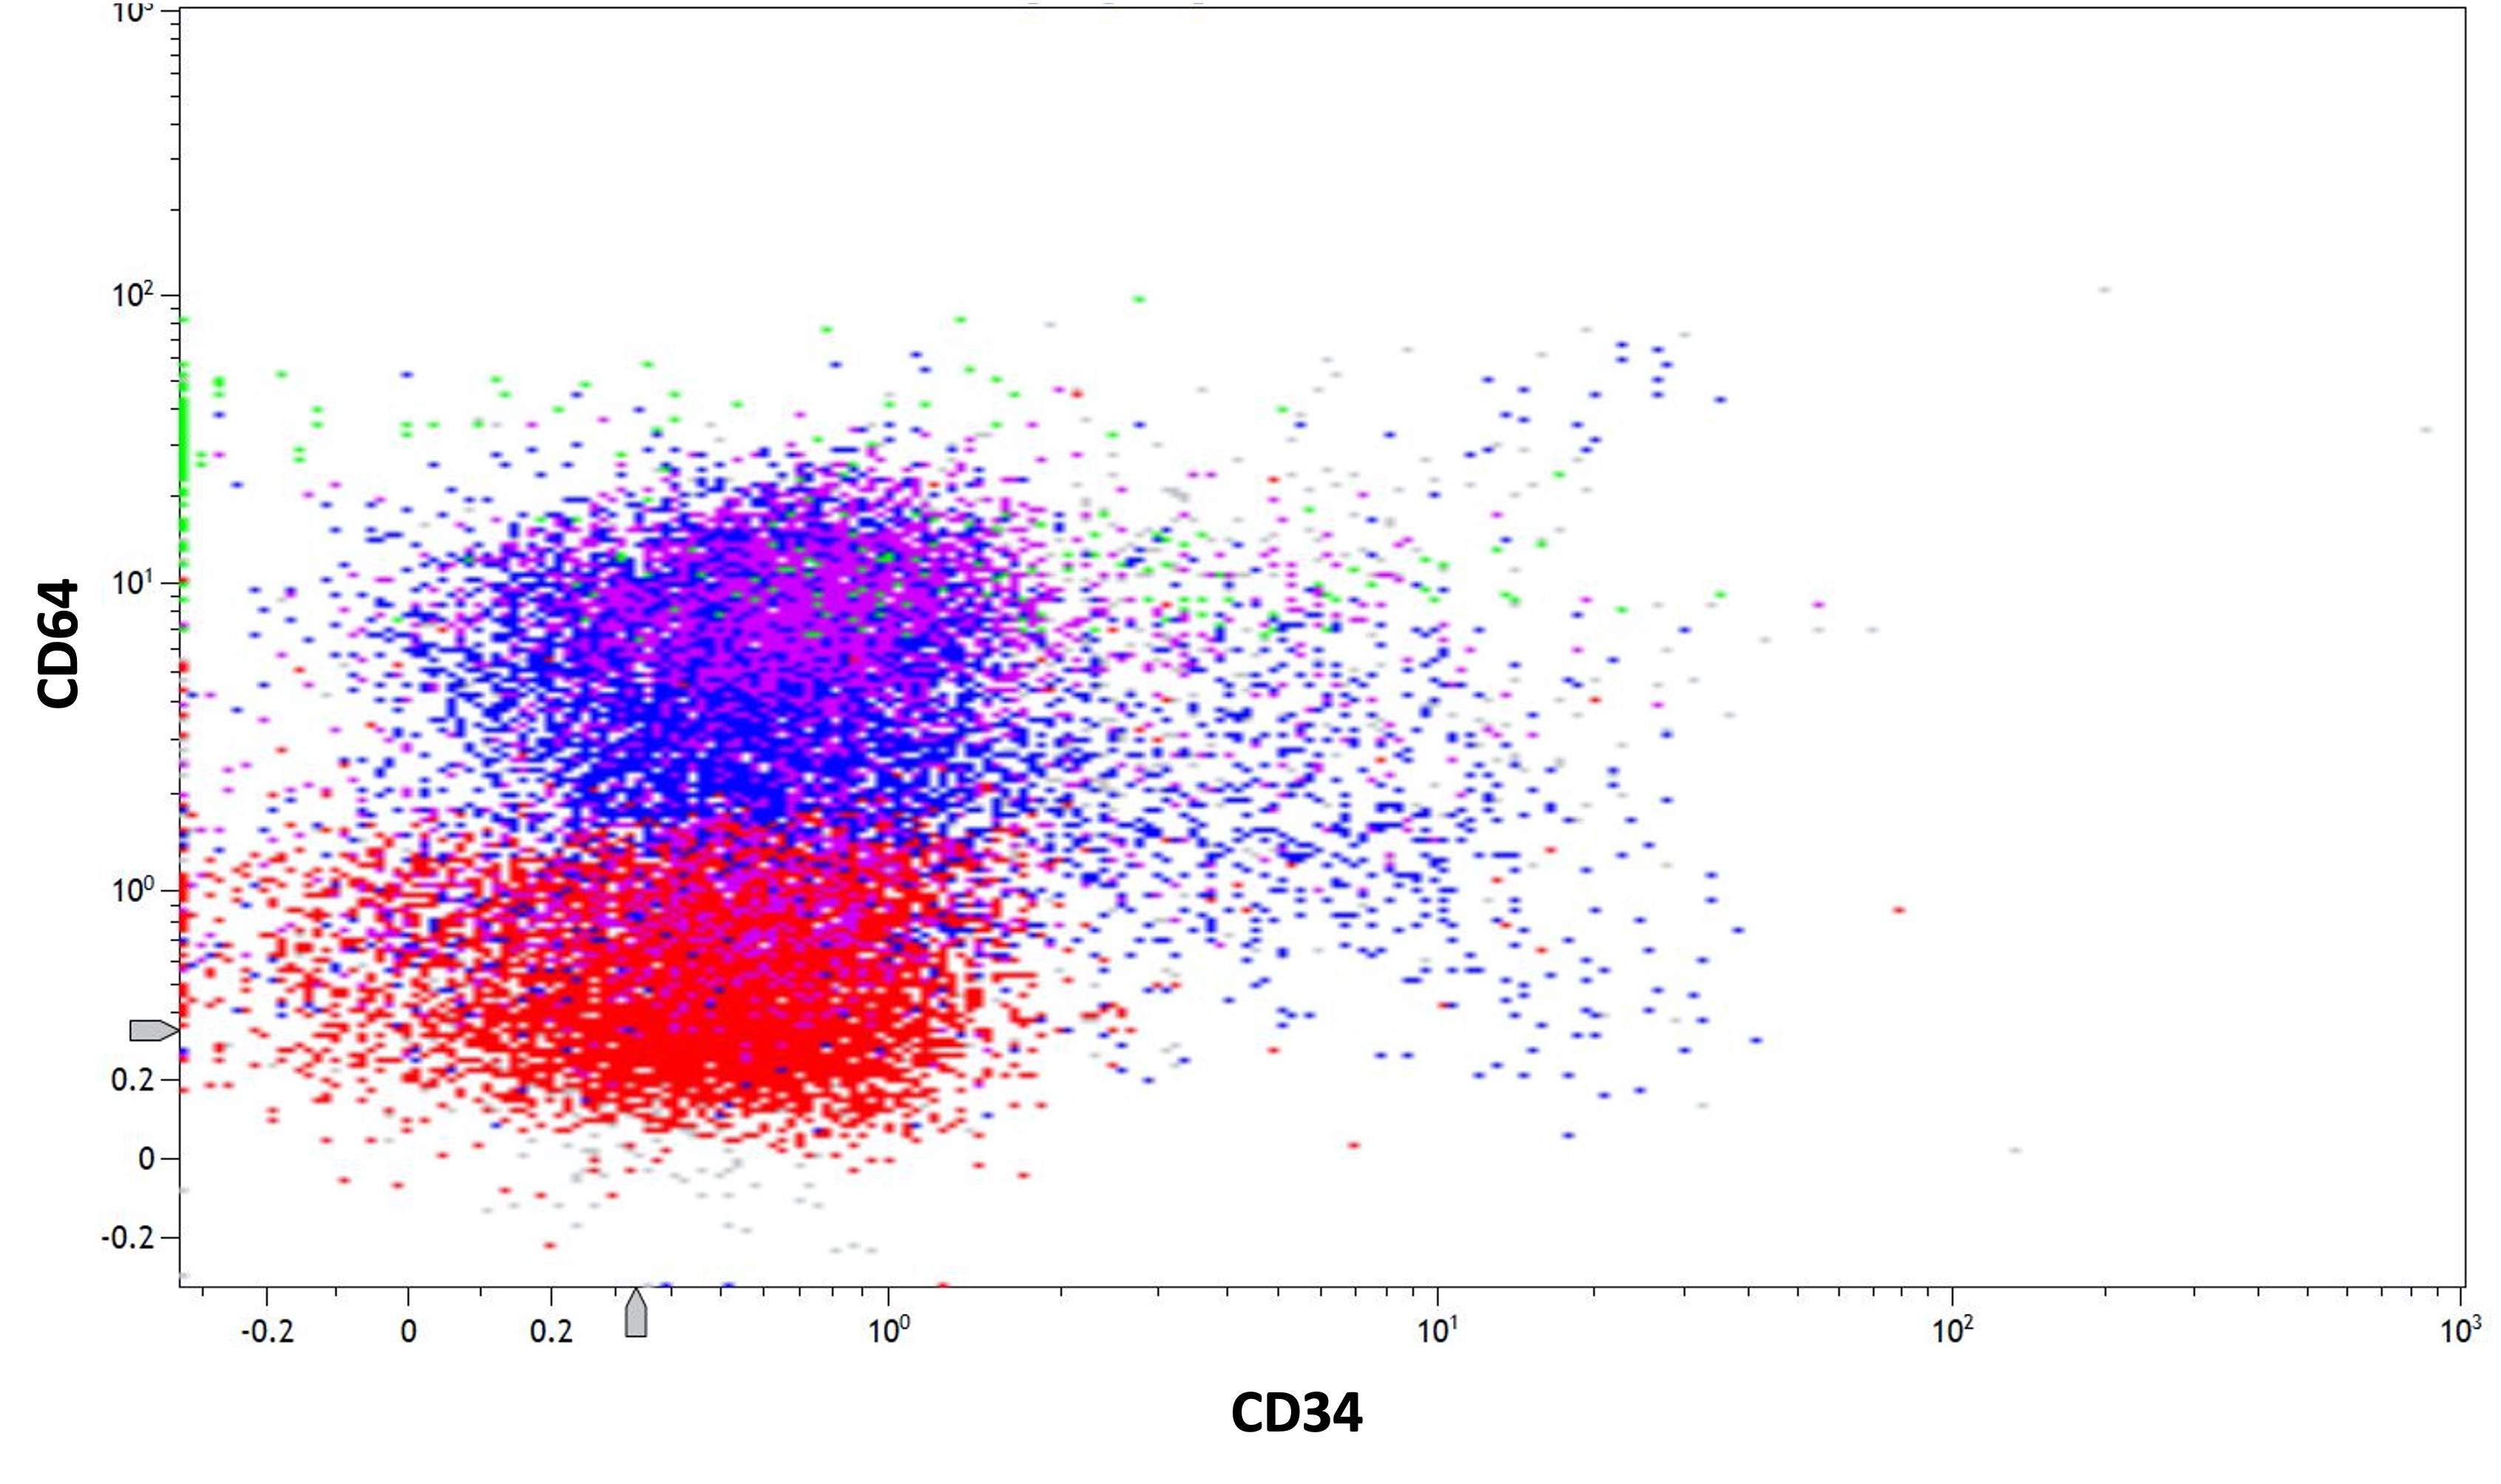
Classic variant, CD34- and CD64+
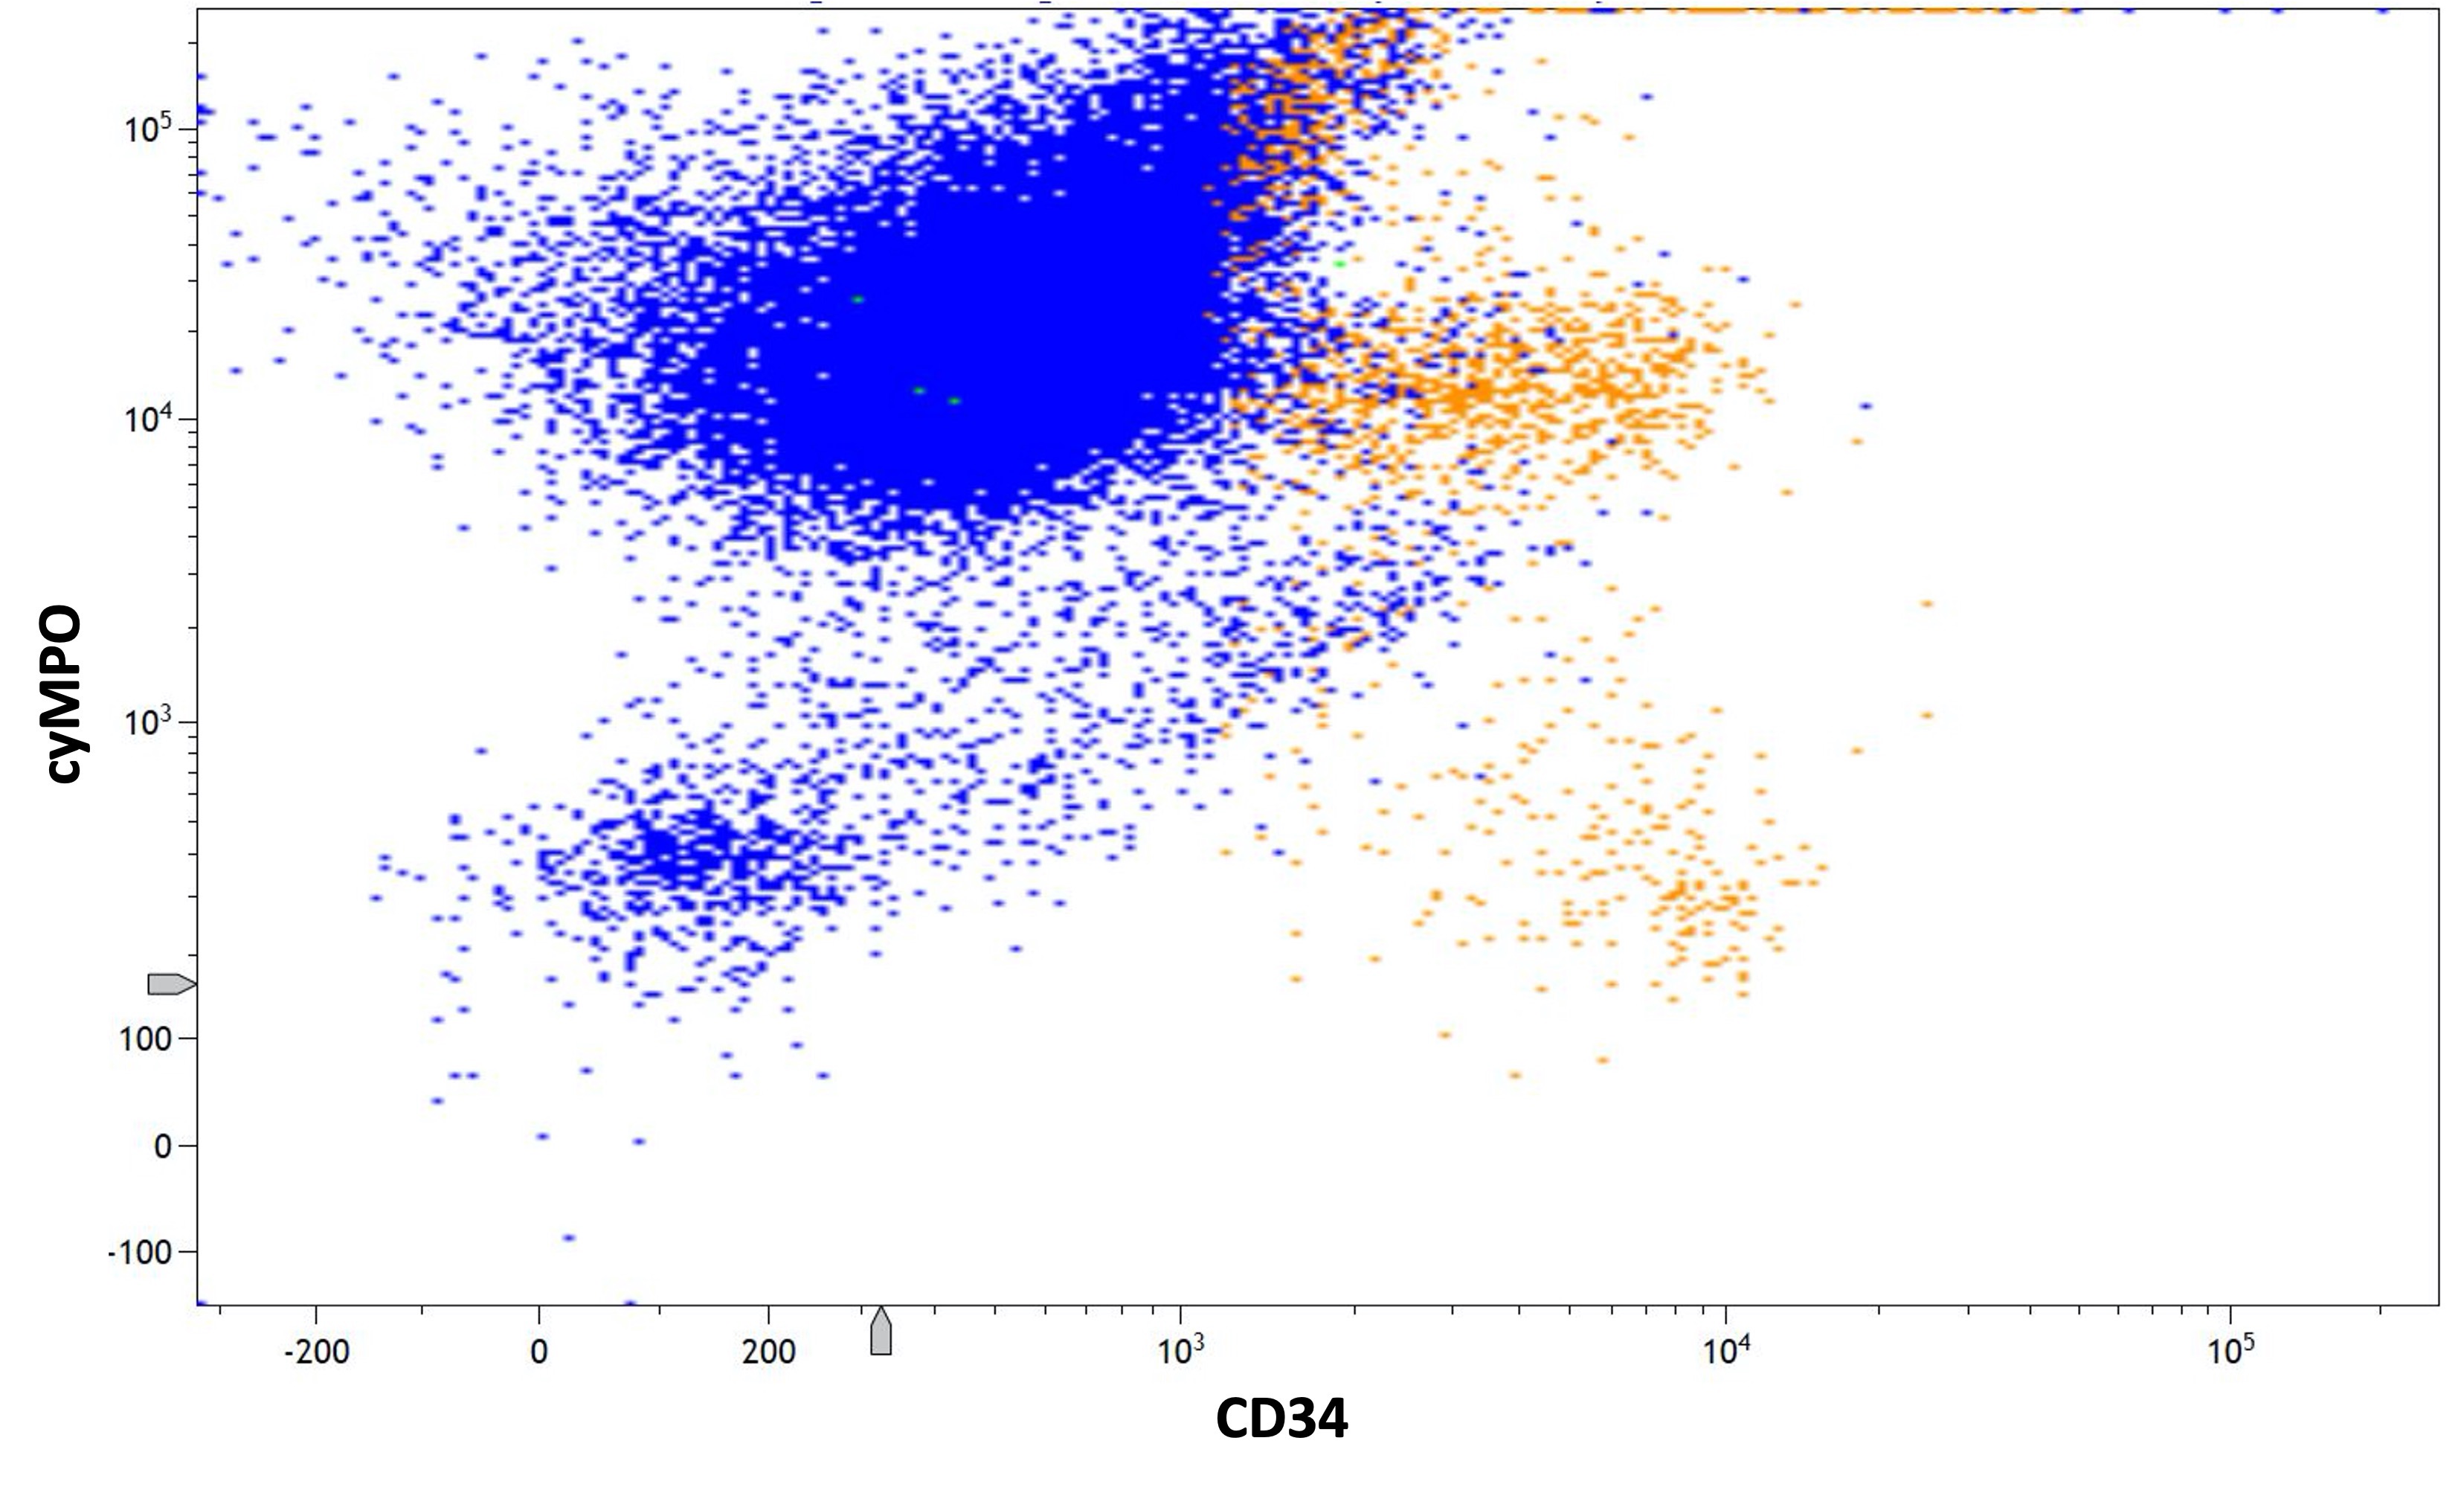
Classic variant, CD34- and cyMPO+
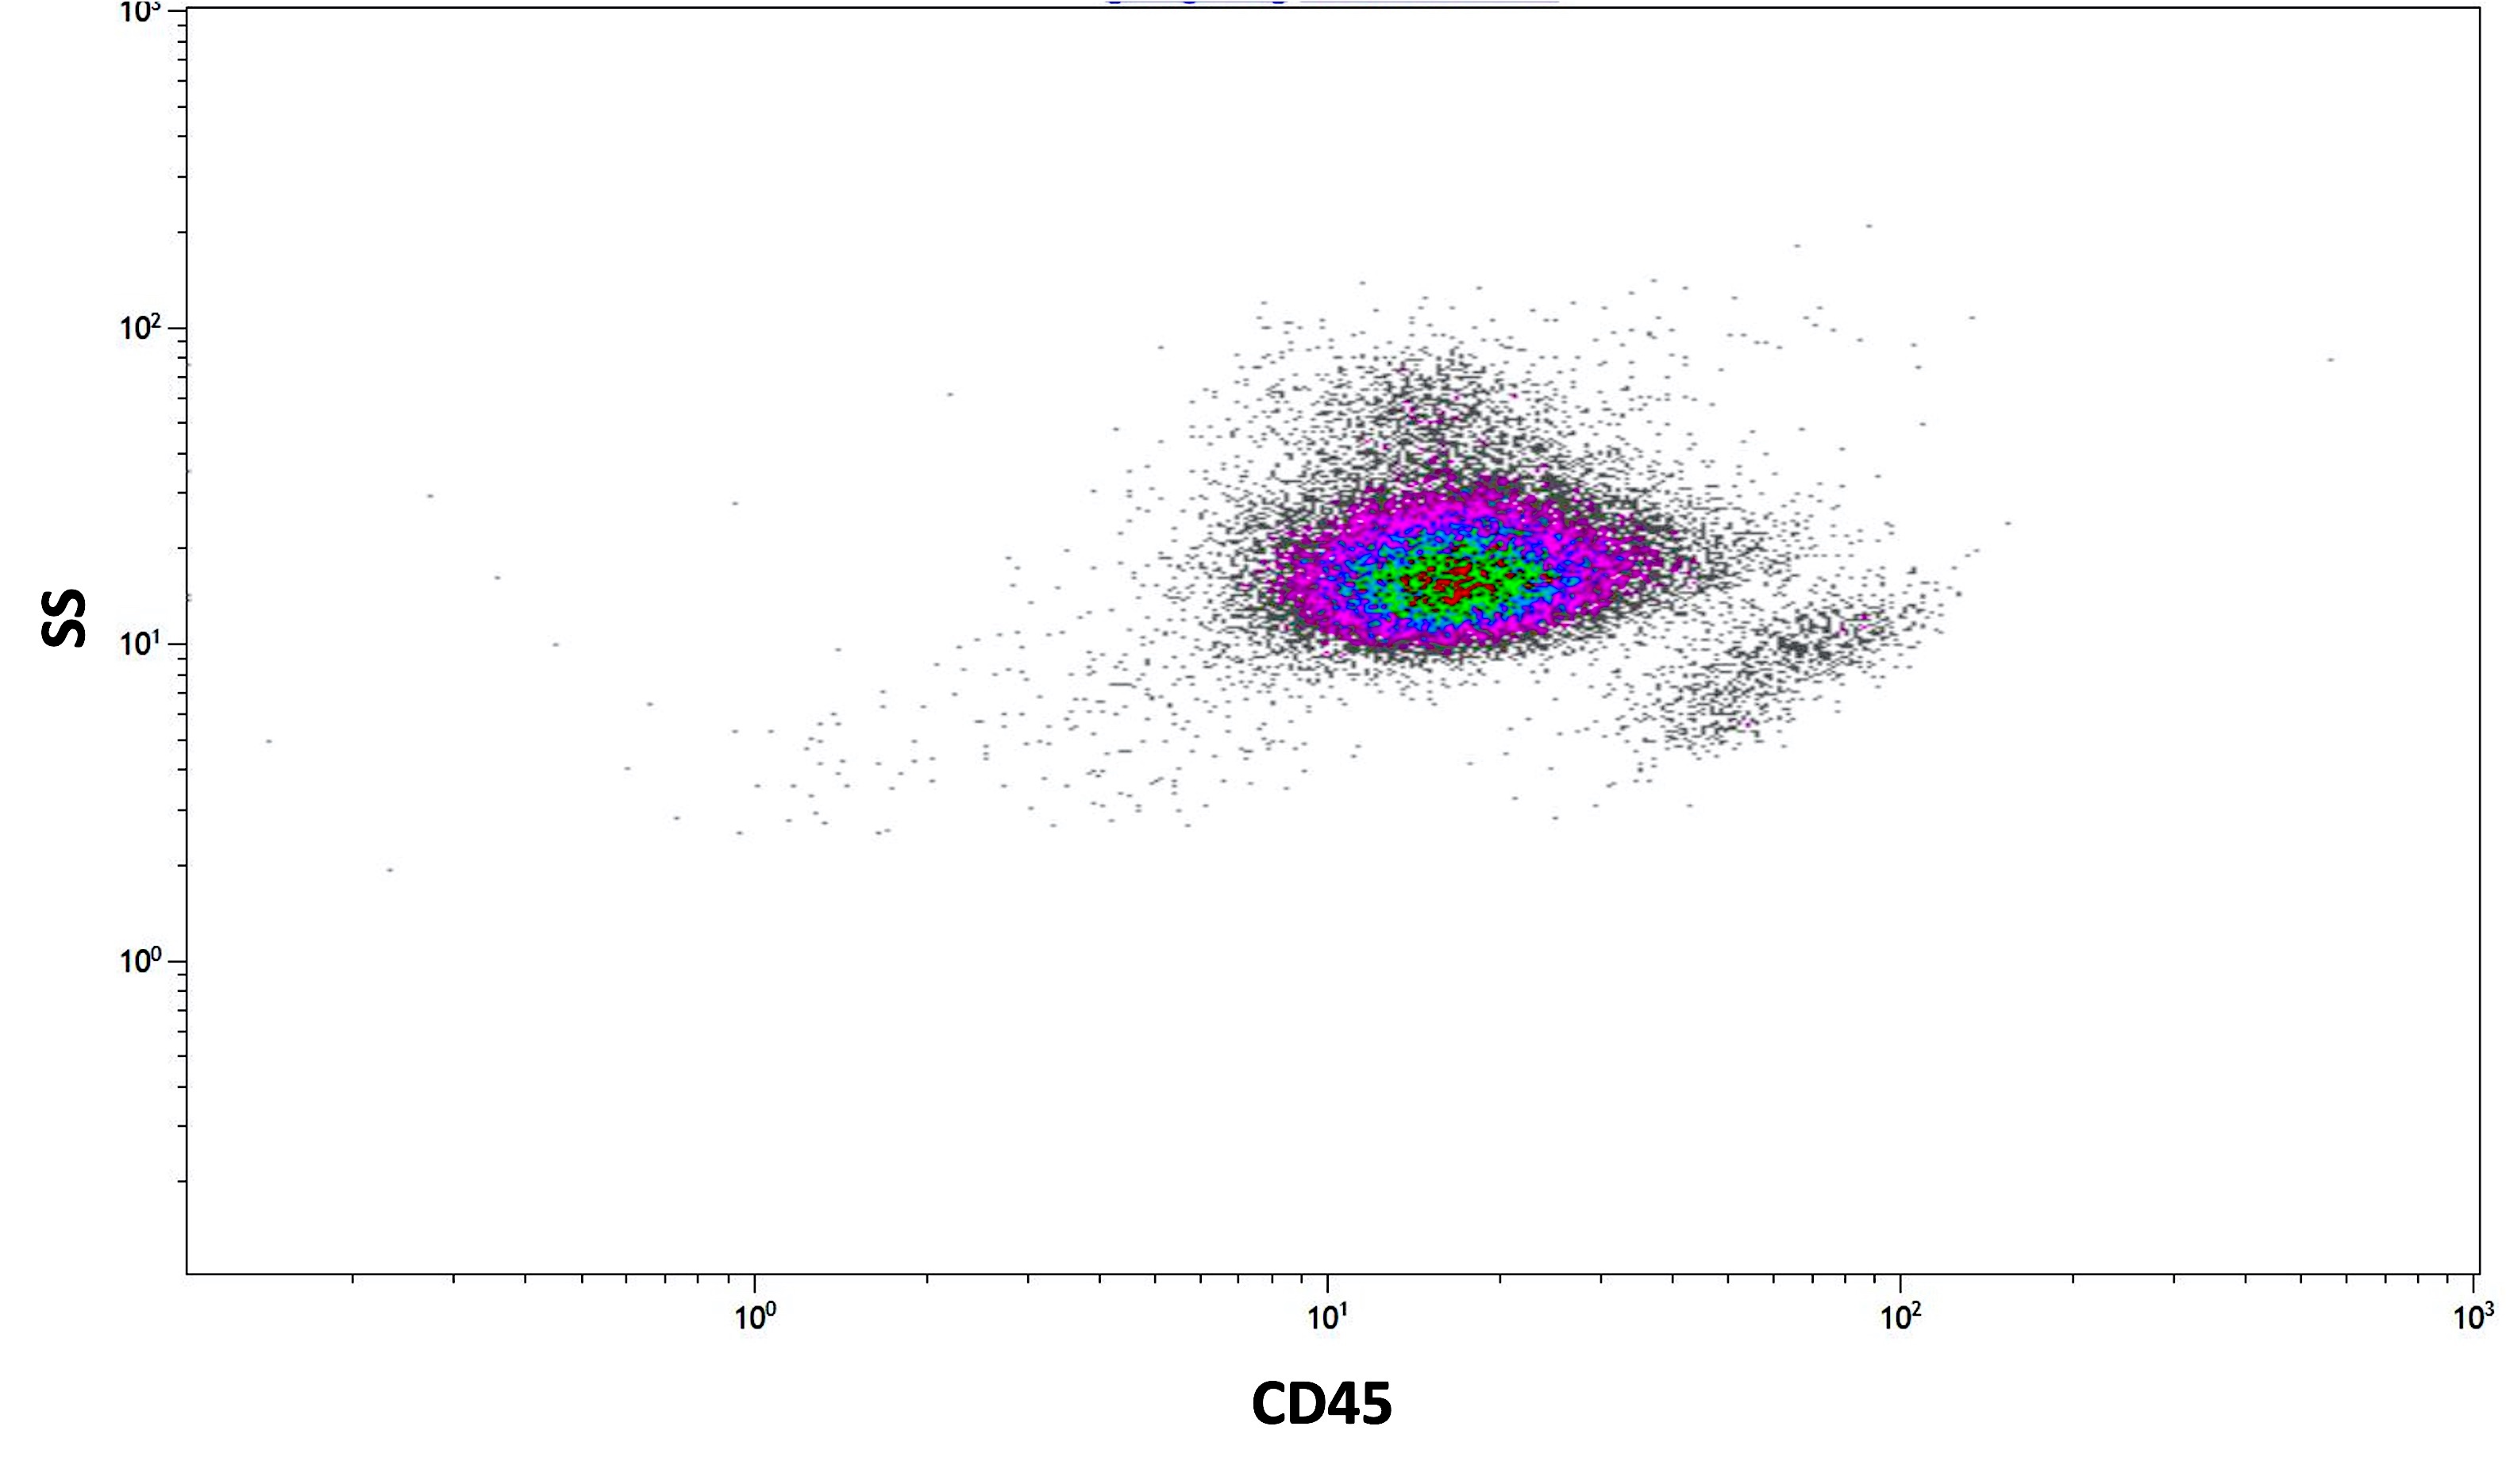
Microgranular variant, moderate CD45
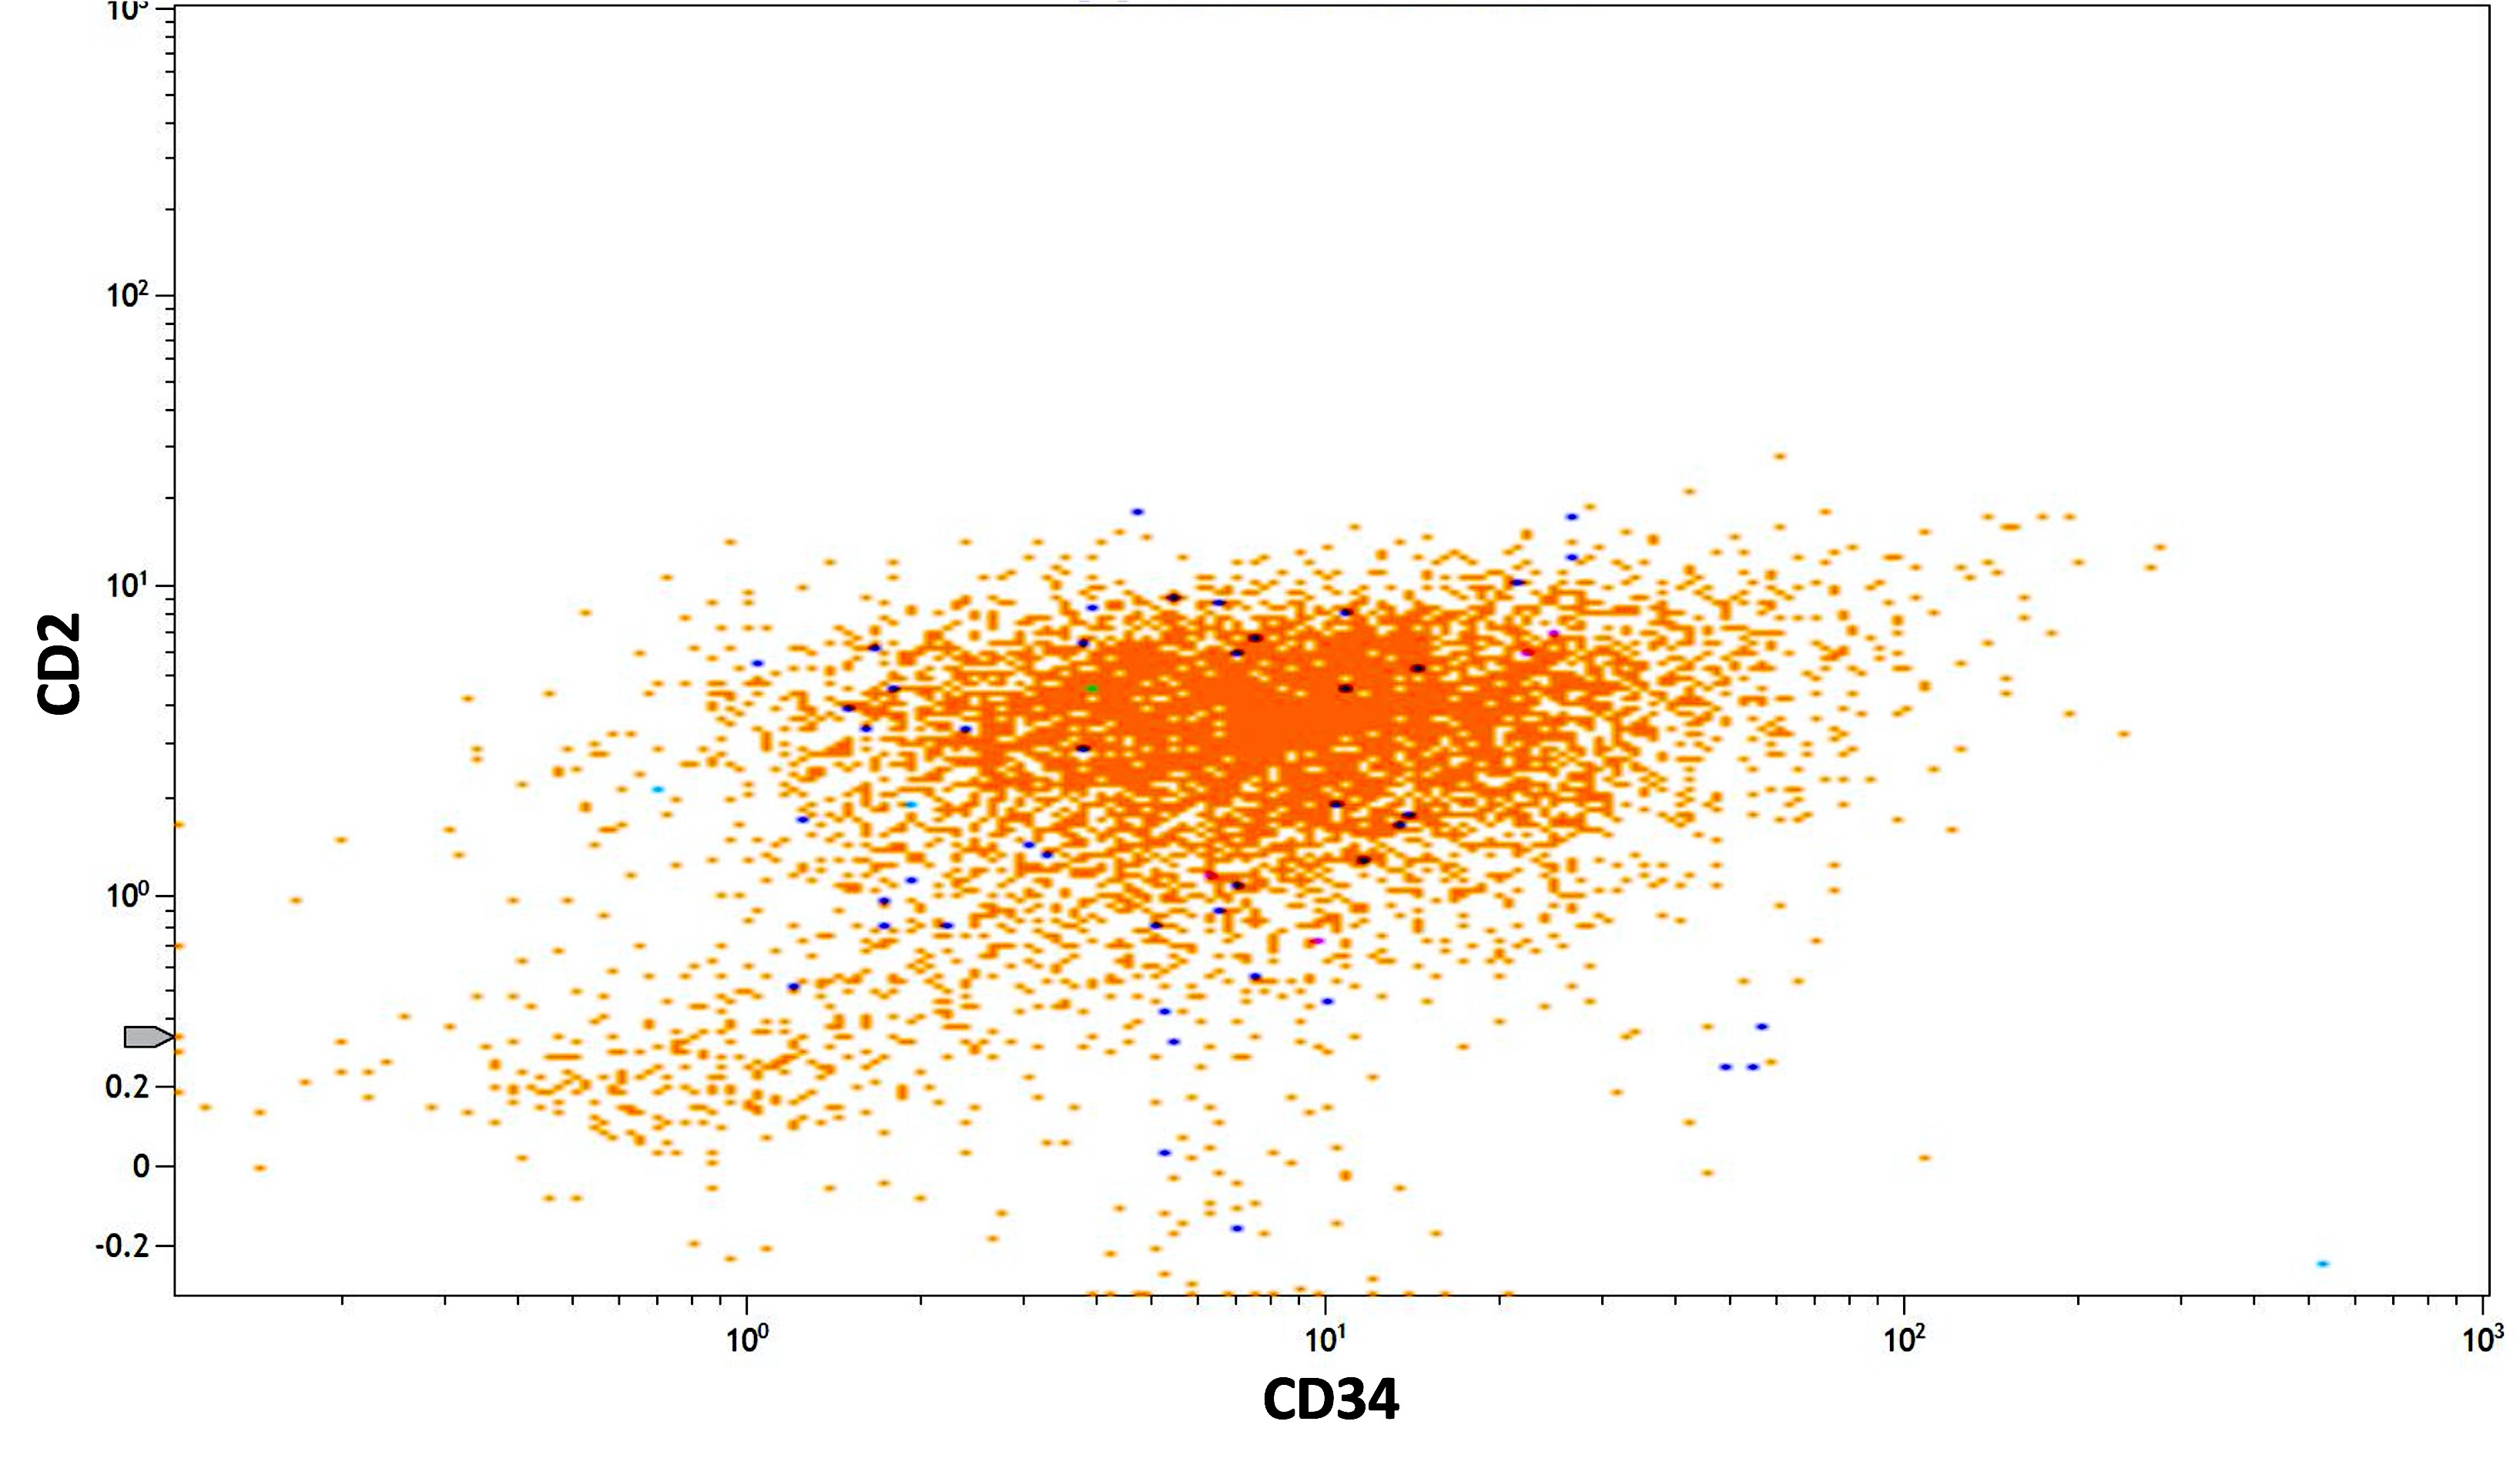
Microgranular variant, CD2+ and CD34+
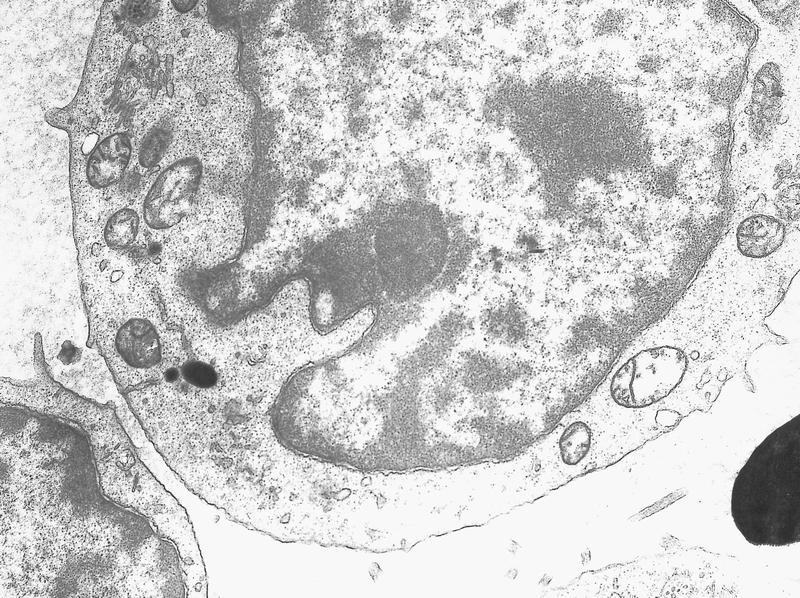
AFIP images
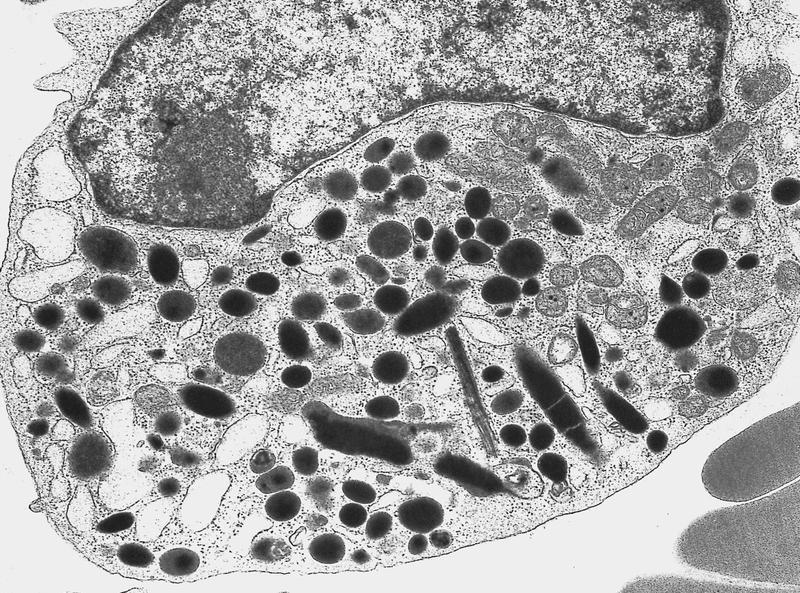
Cytoplasm and nucleus
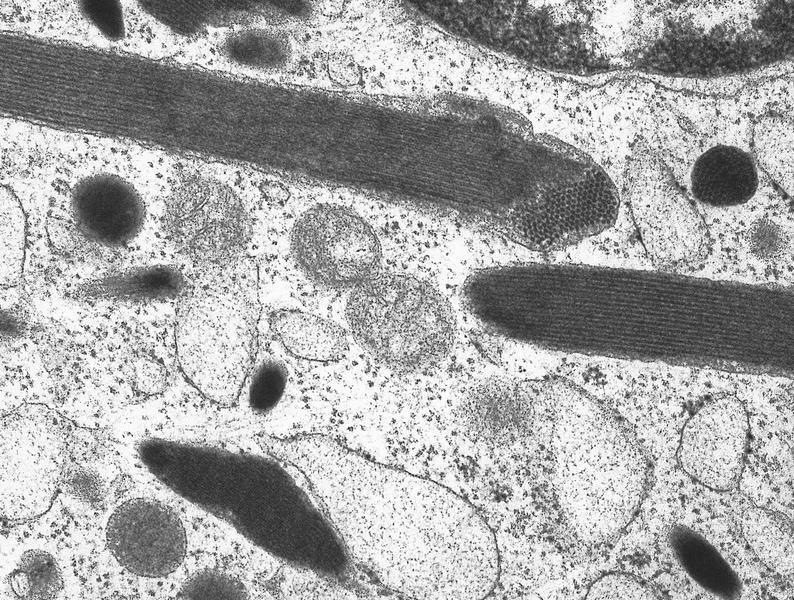
Cross section of Auer rod
Microgranular variant
Small granules and stellate array
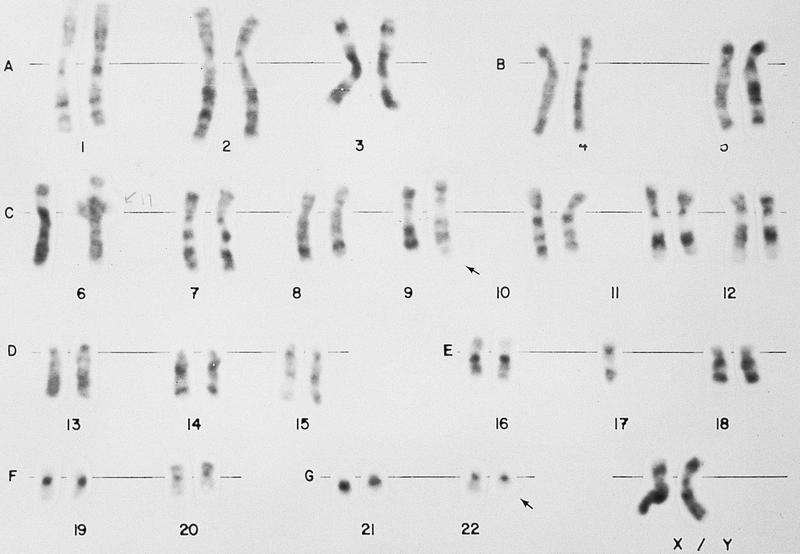
Contributed by Anamarija M. Perry, M.D. and Lina Shao, Ph.D.
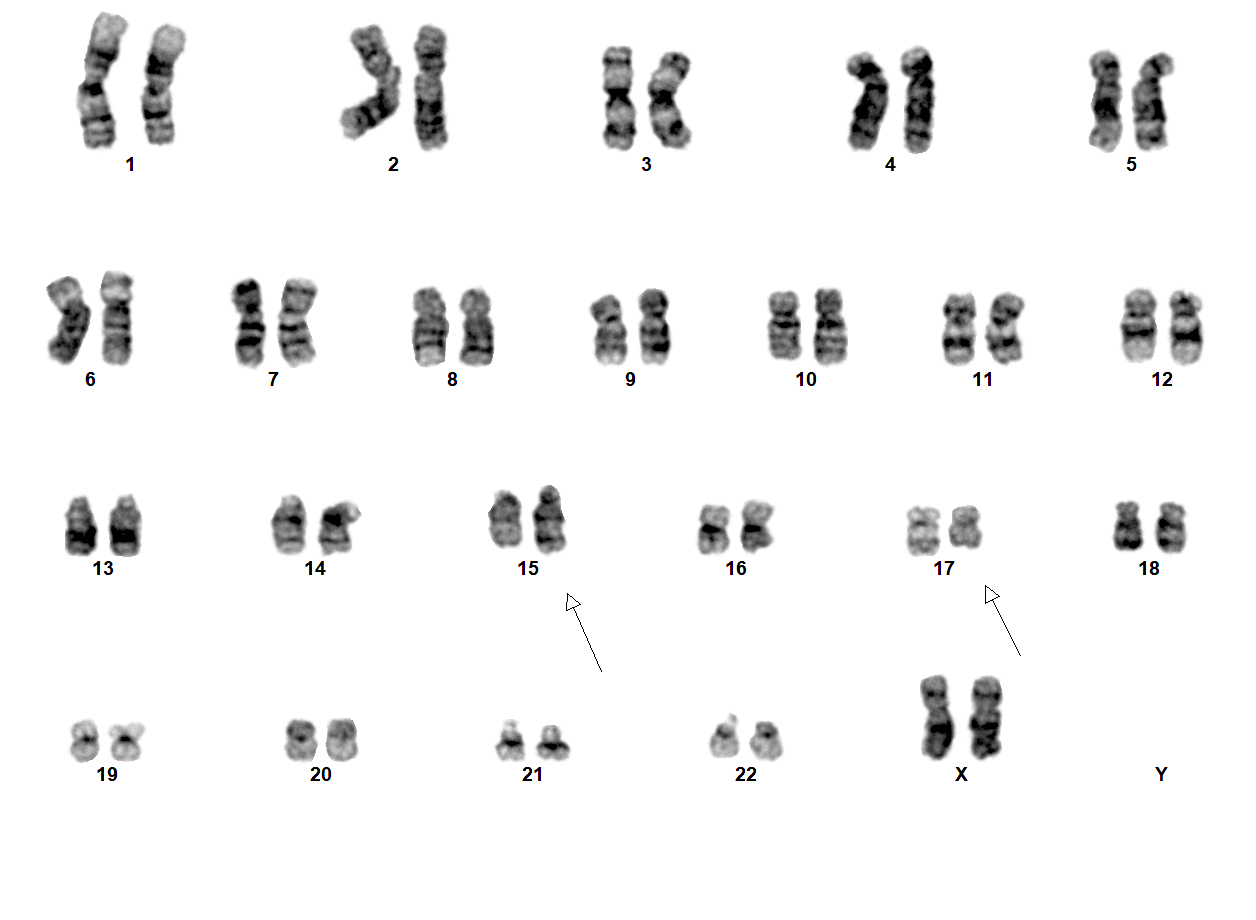
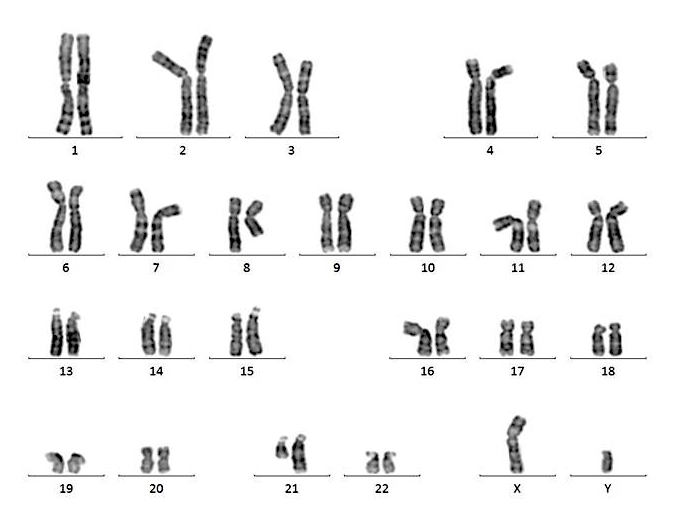
Karyotype
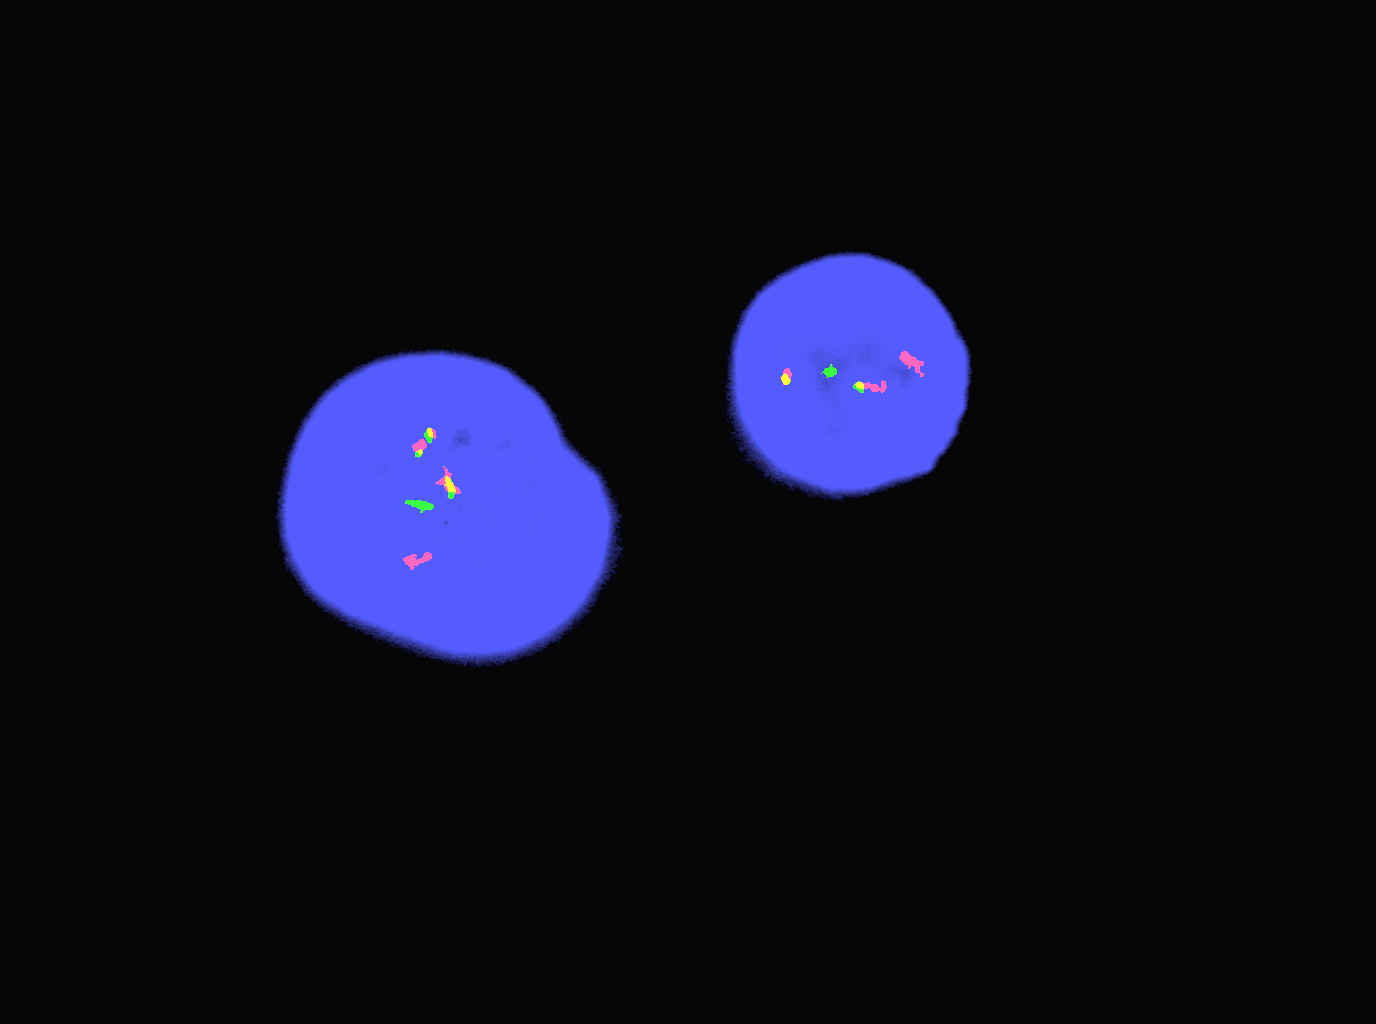
FISH study
| Immunophenotypic profile of basophils, plasmacytoid dendritic cells (pDC) and mast cells | ||||
| CD203c | Positive | Positive | Negative | Positive |
| CD123 | Positive | Positive / Negative | Positive | Negative |
| HLA-DR | Negative | Positive / Negative | Positive (high) | Positive (low) |
| CD34 | Negative | Negative | Negative | Negative |
| CD117 | Negative | Negative | Negative | Positive |
| CD38 | Positive | Positive / Negative | Negative | Positive (low) |
| CD33 | Positive | Positive / Negative | Negative | Positive (moderate) |
| CD64 | Negative | Positive / Negative | Negative | Negative |
Contributed by Pallavi Khattar, M.D.
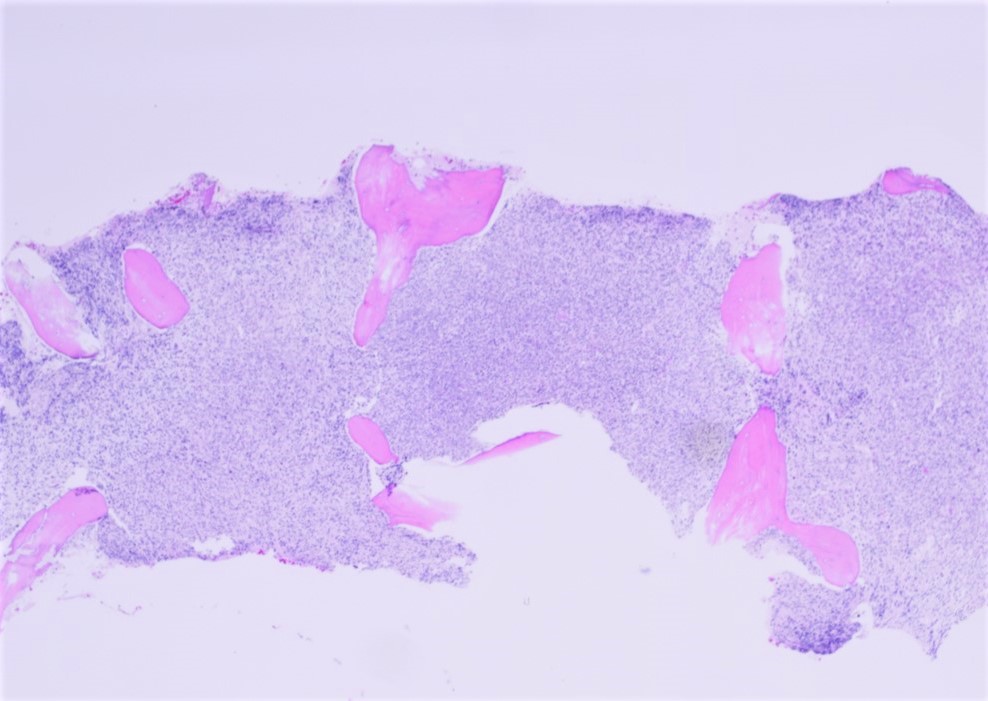
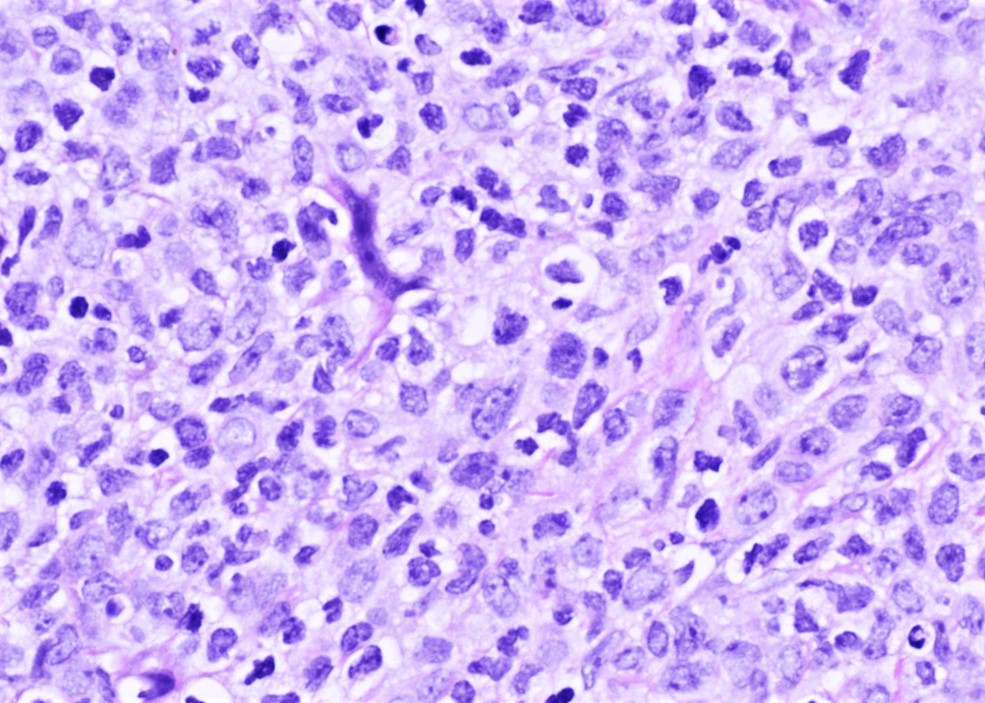
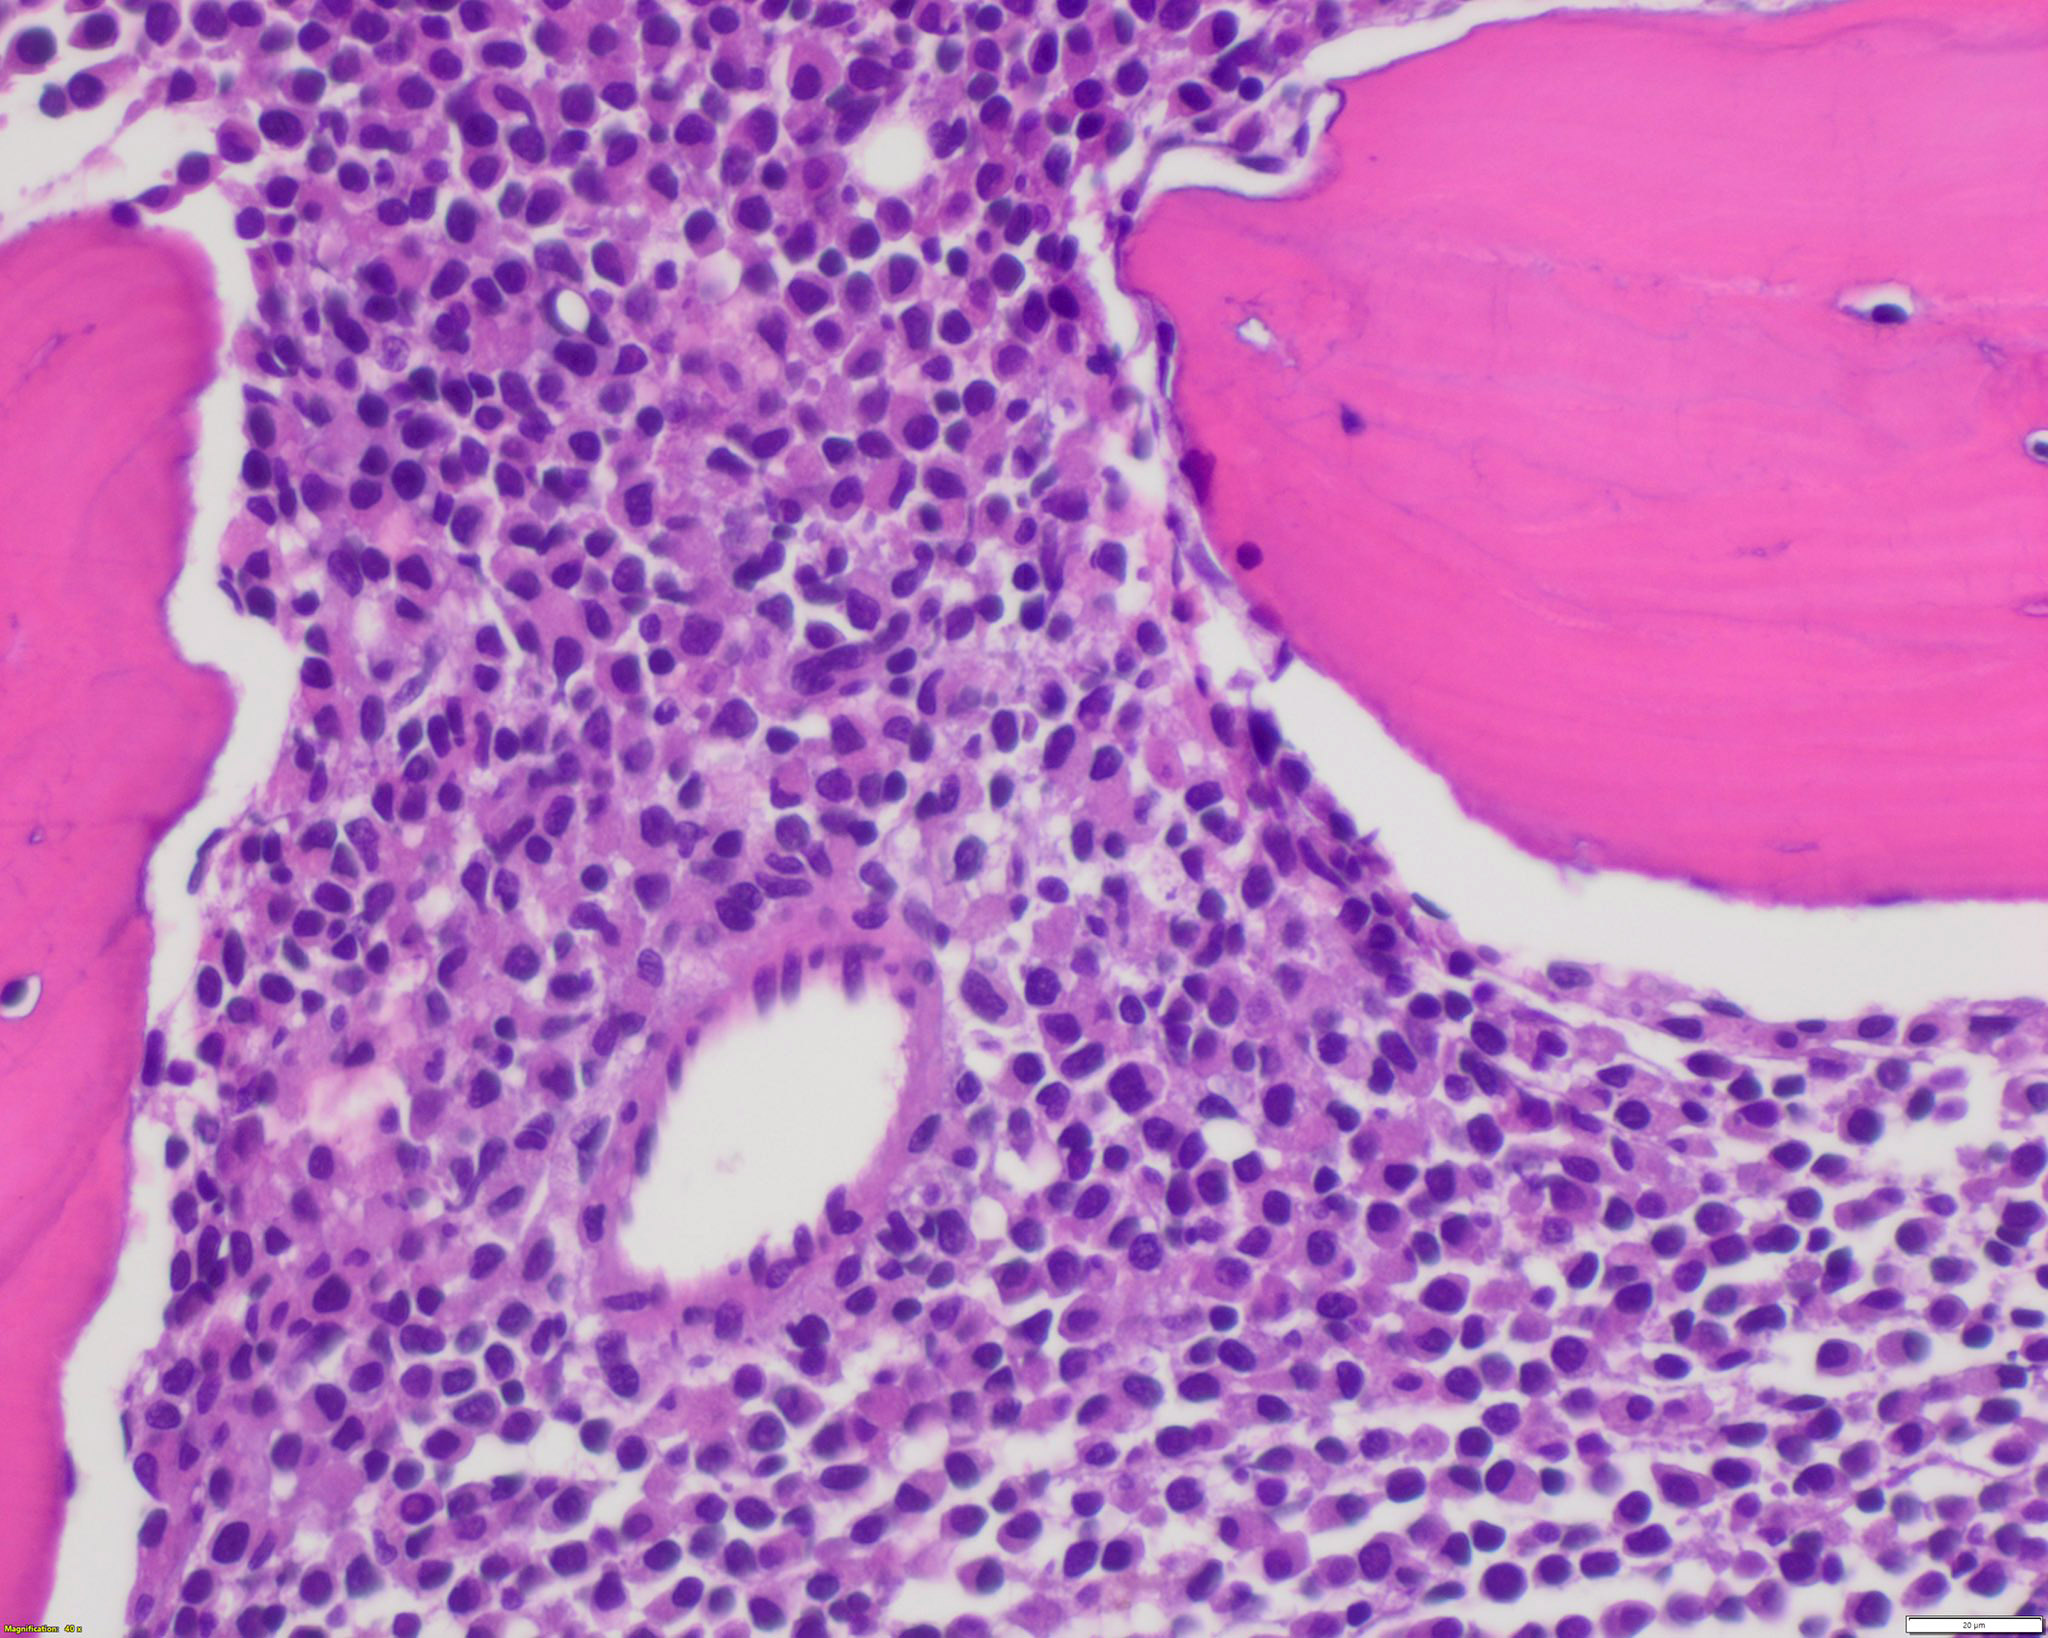
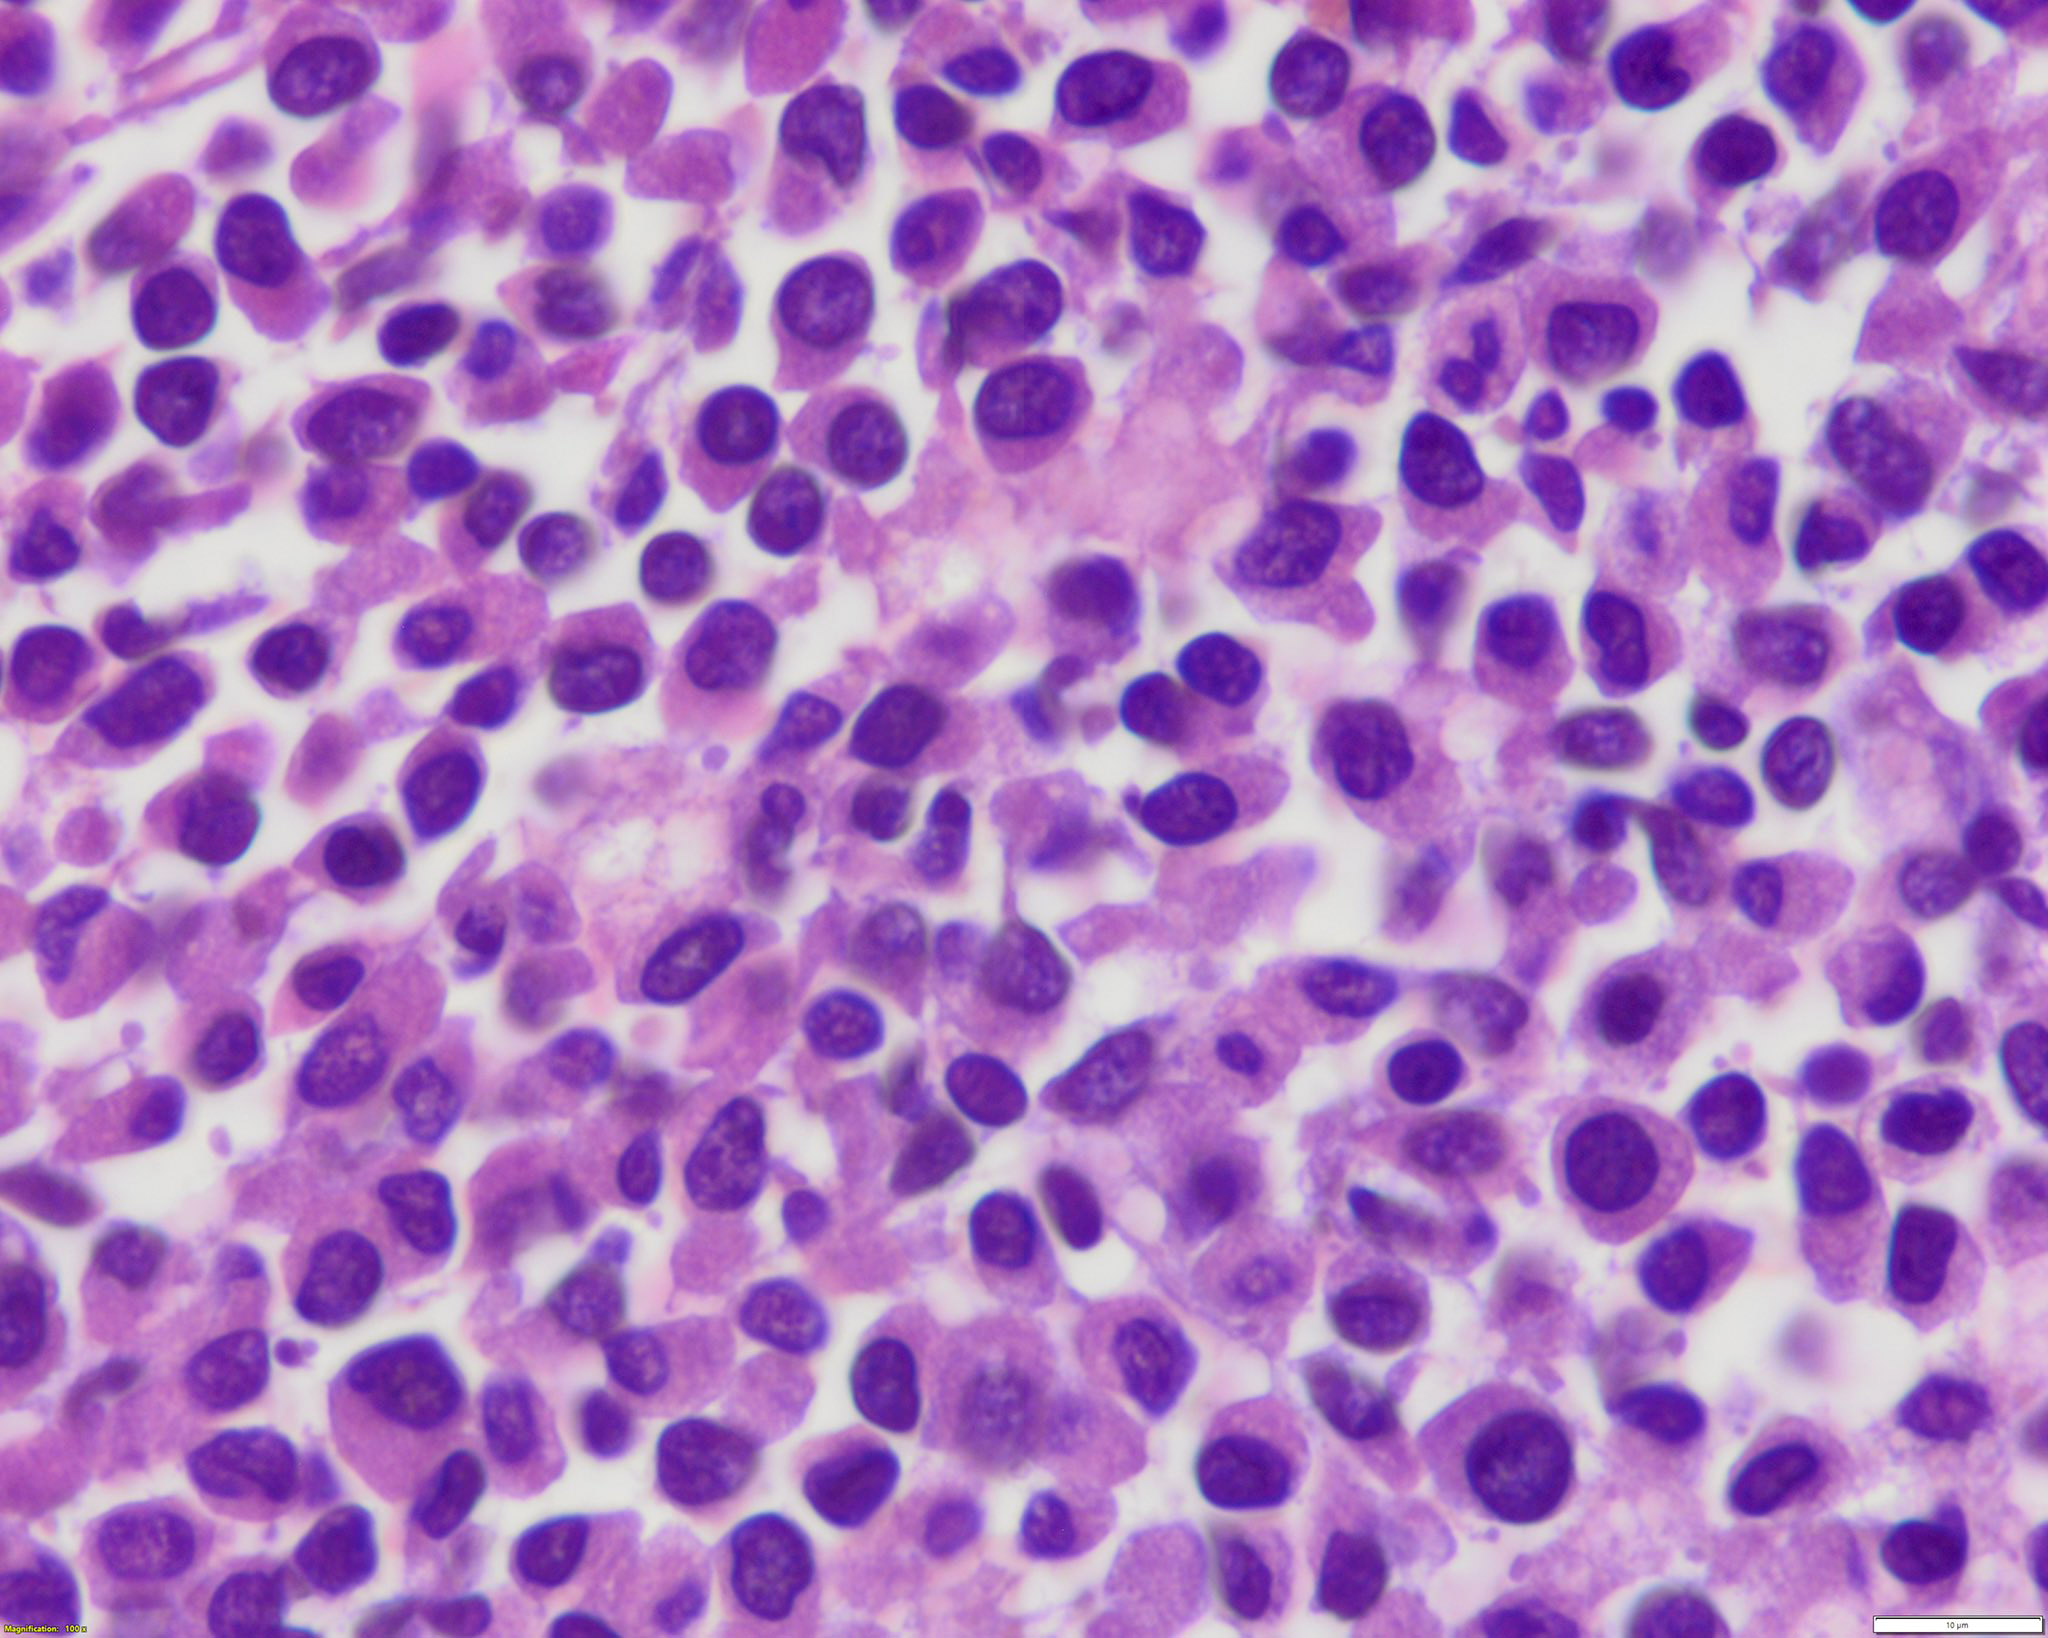
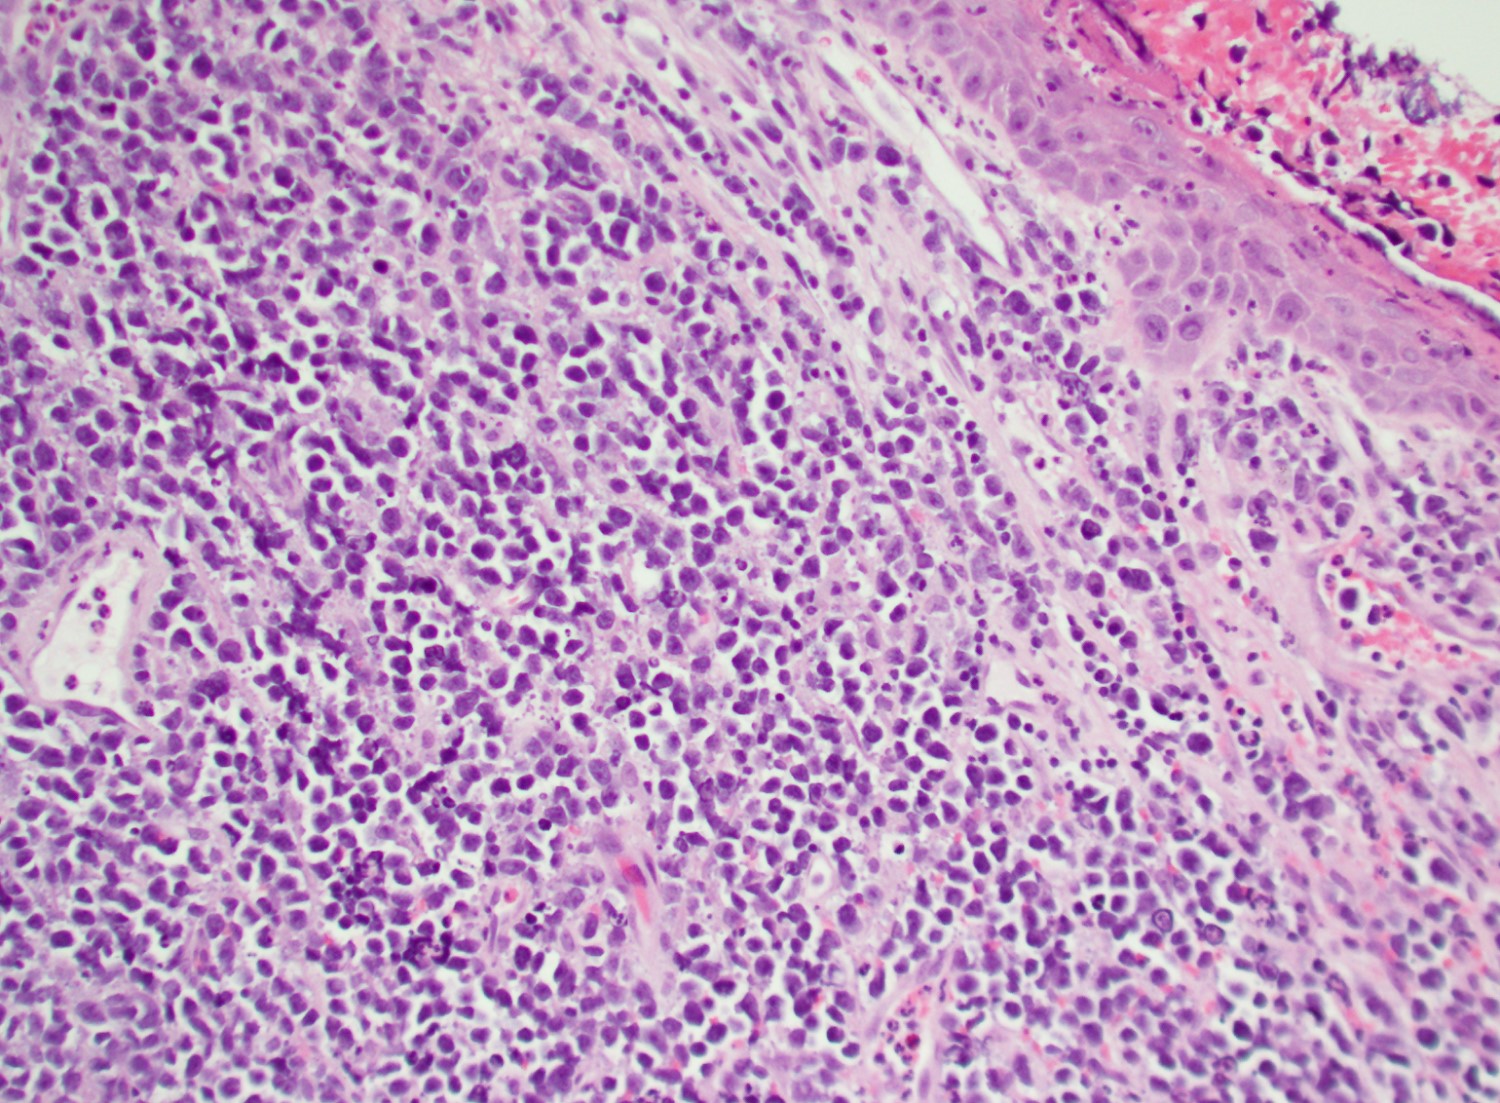
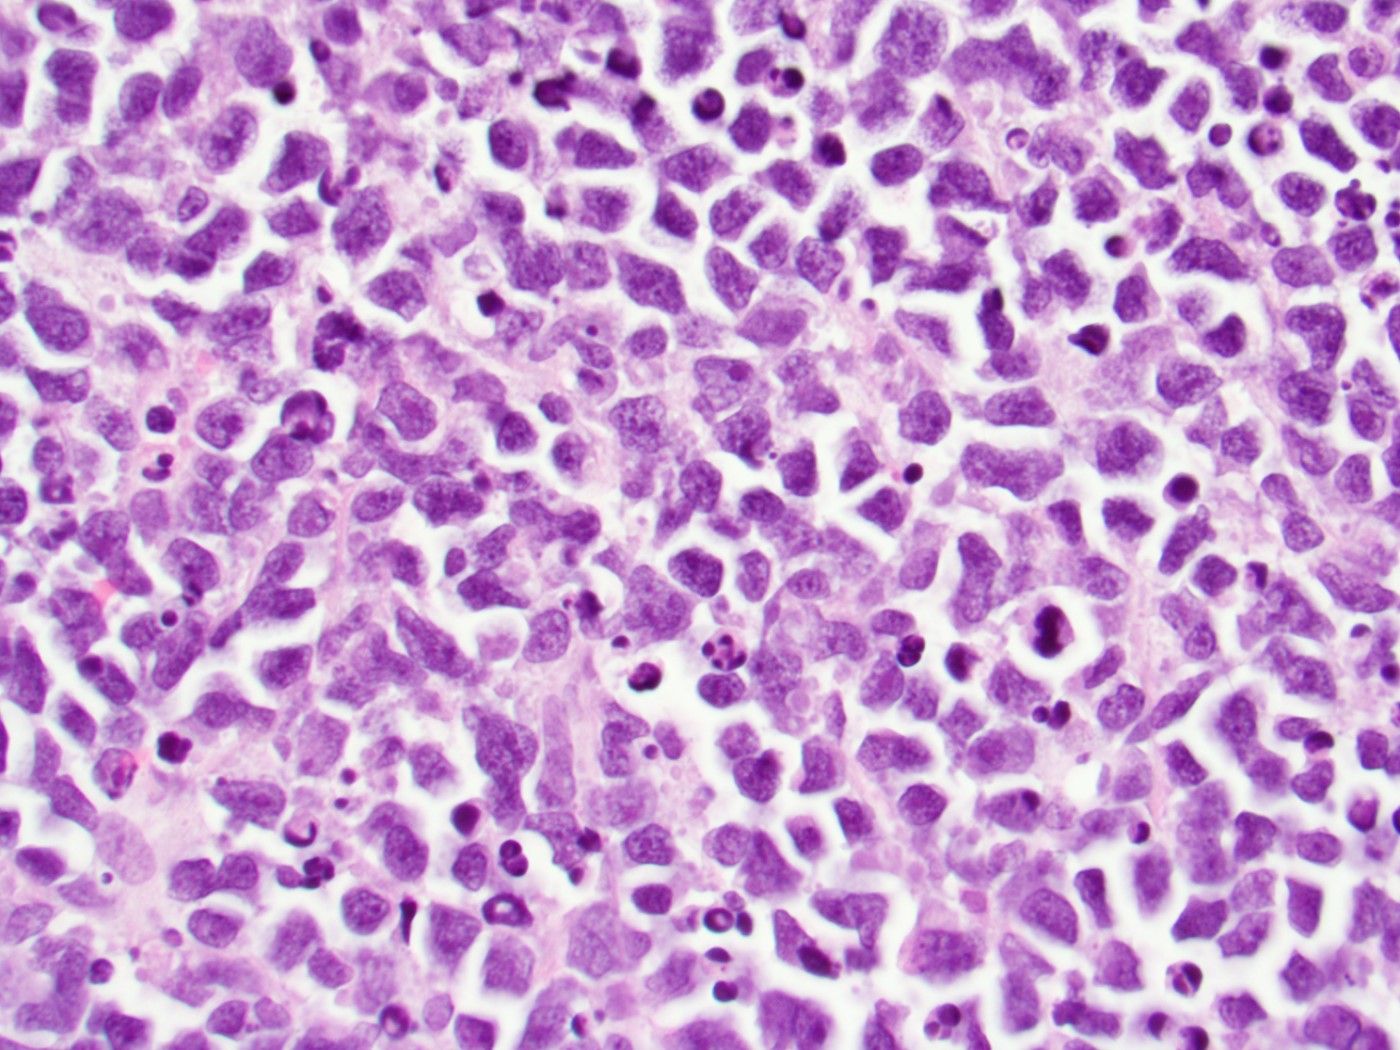
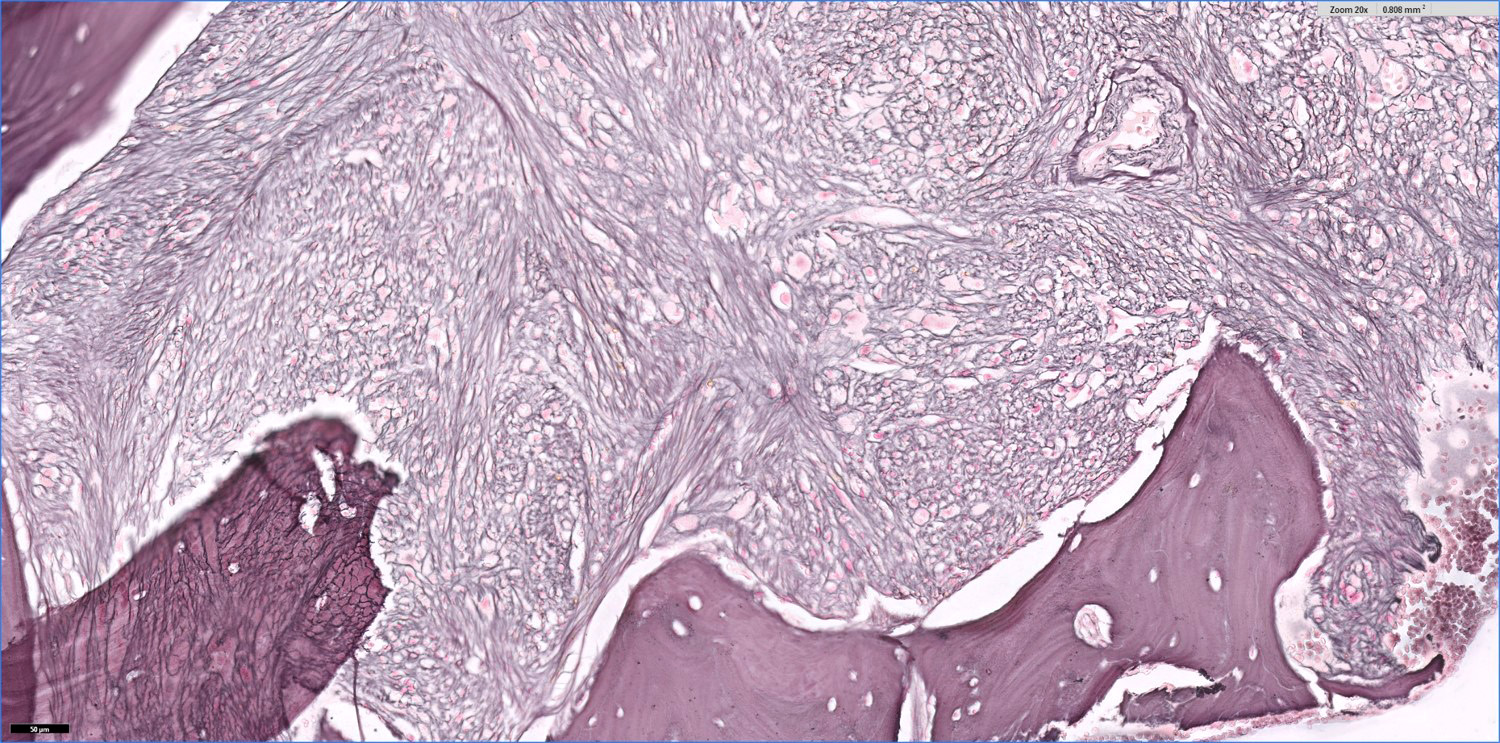
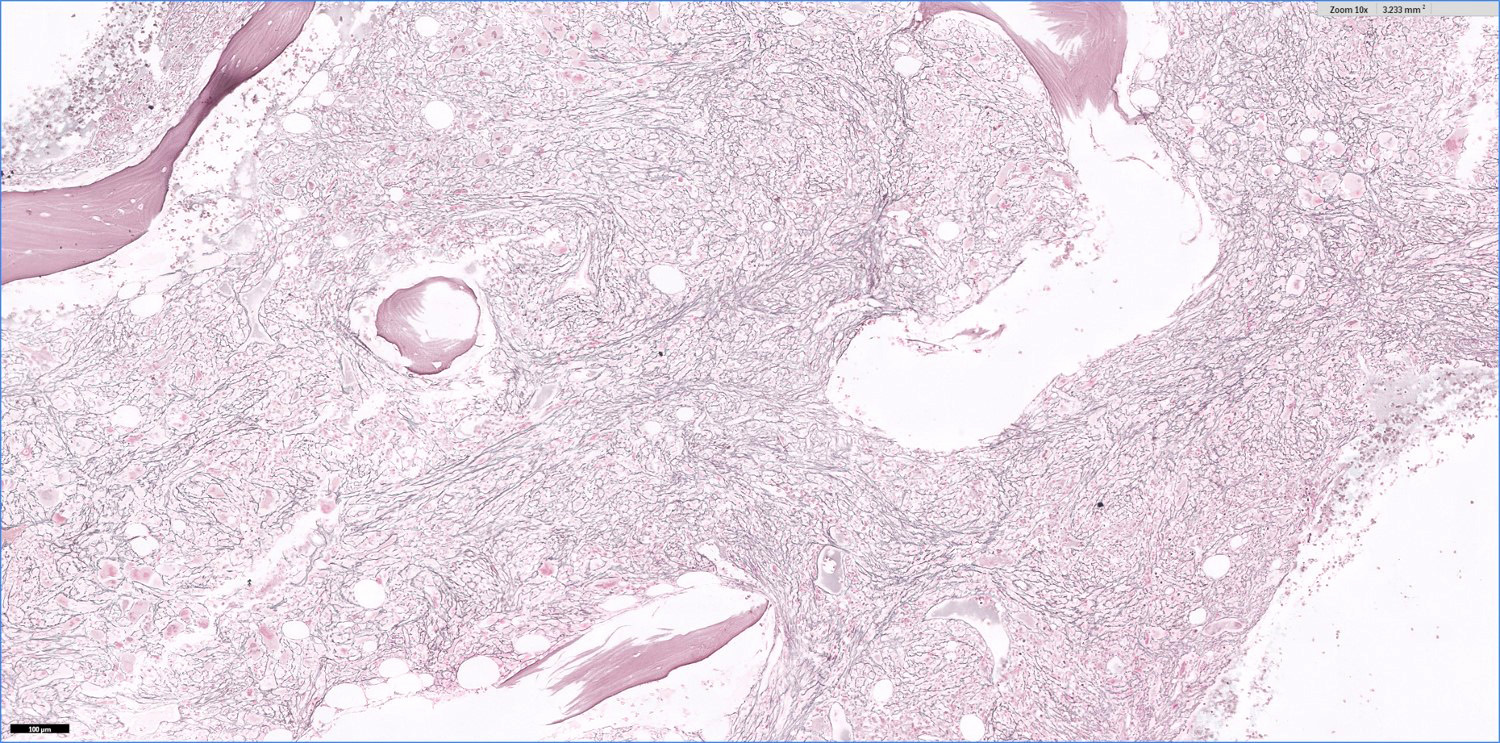
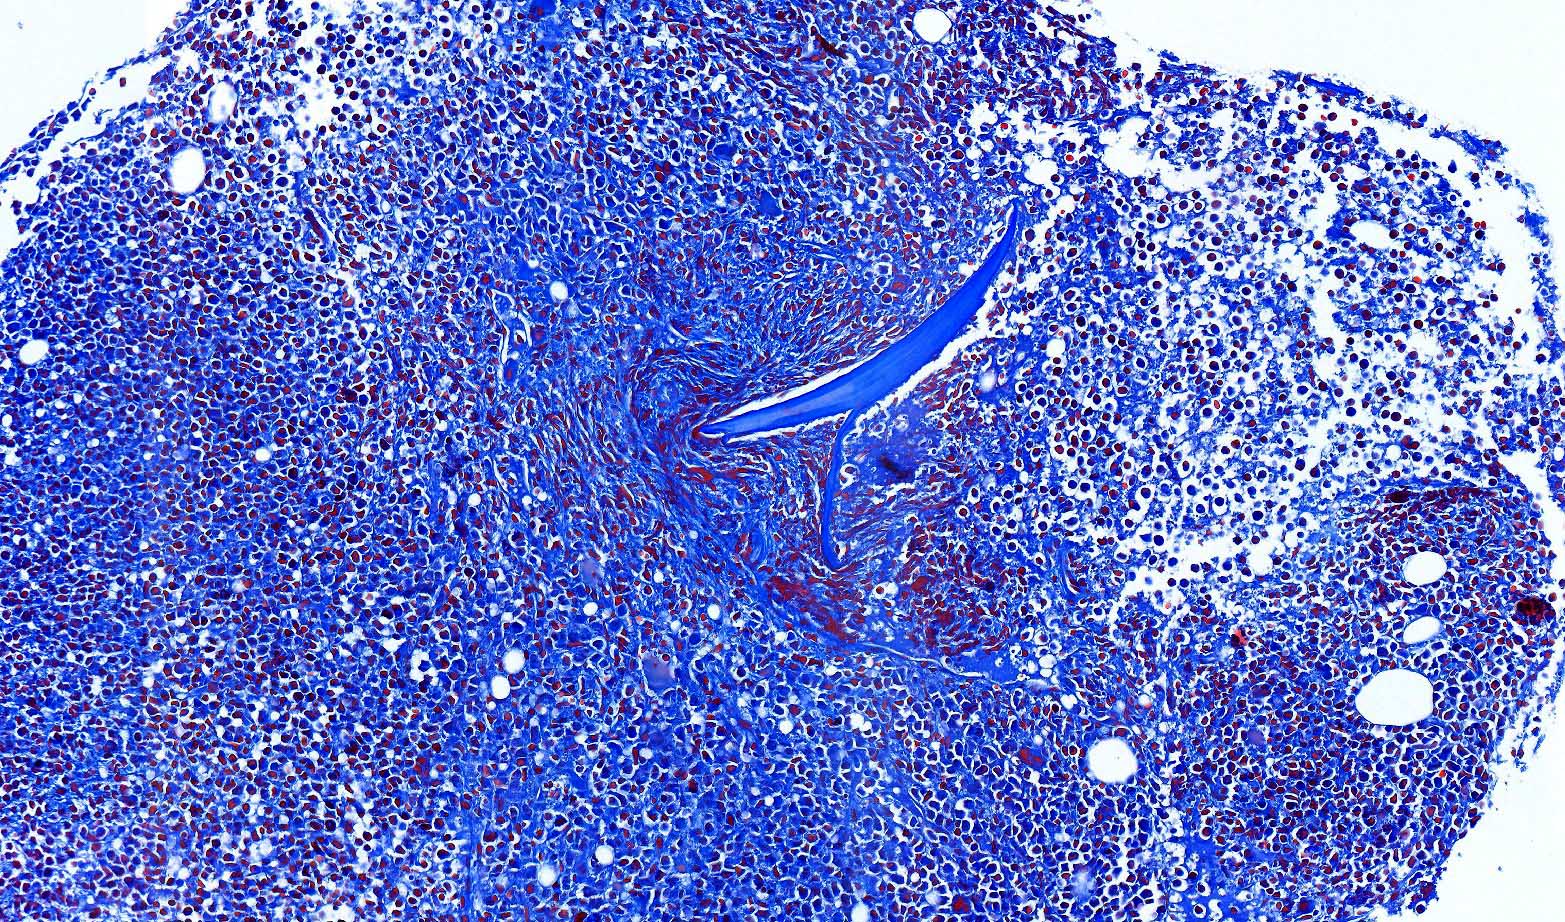
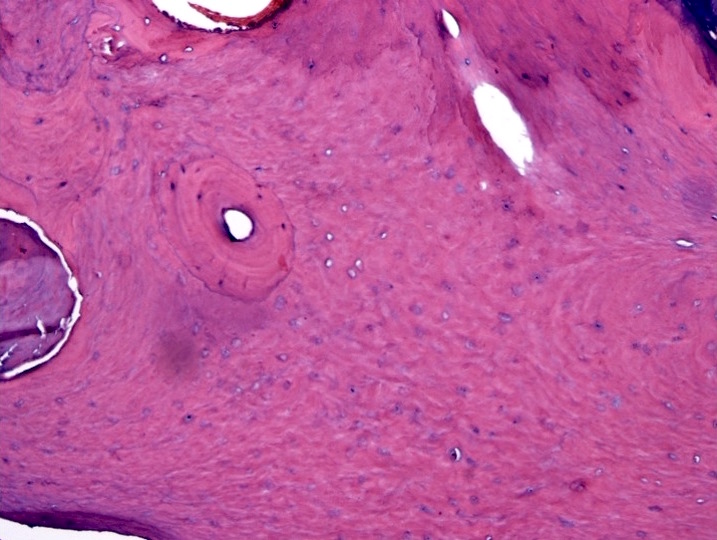
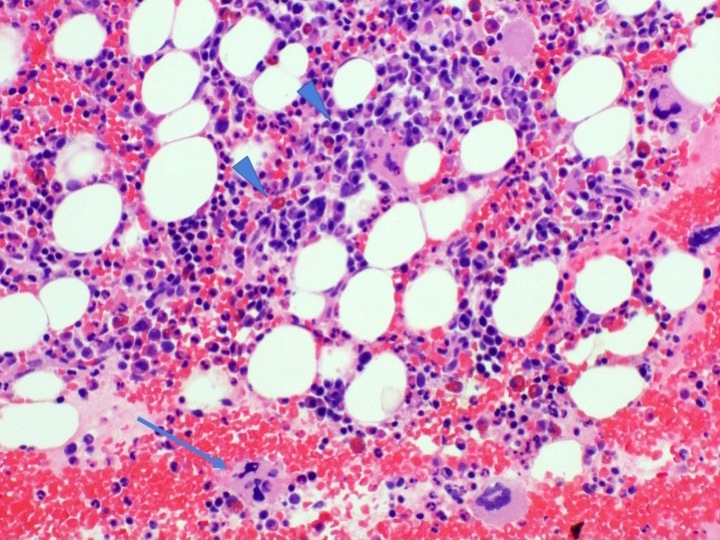
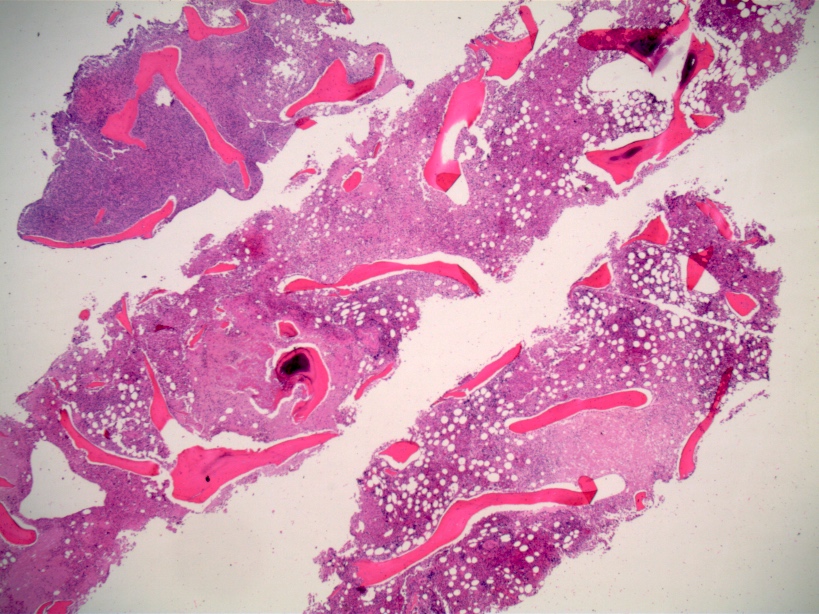
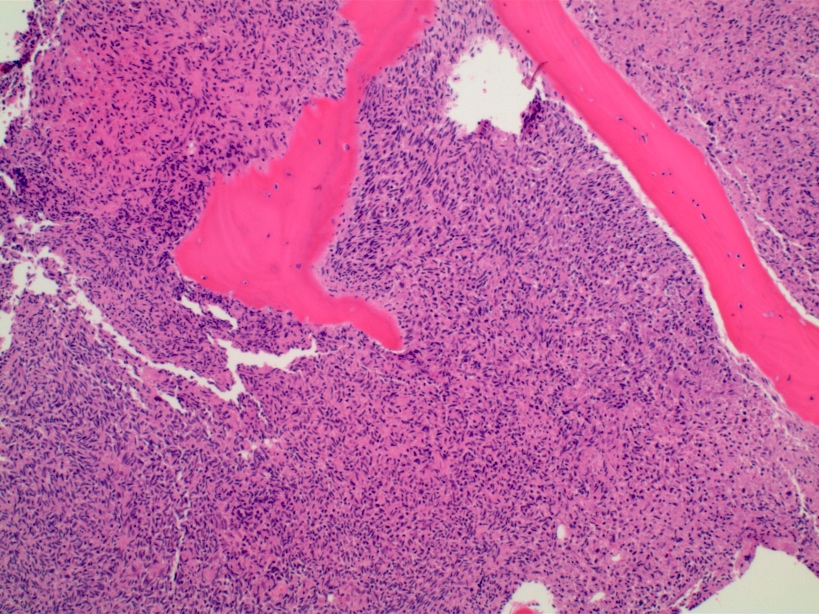
Bone marrow biopsy
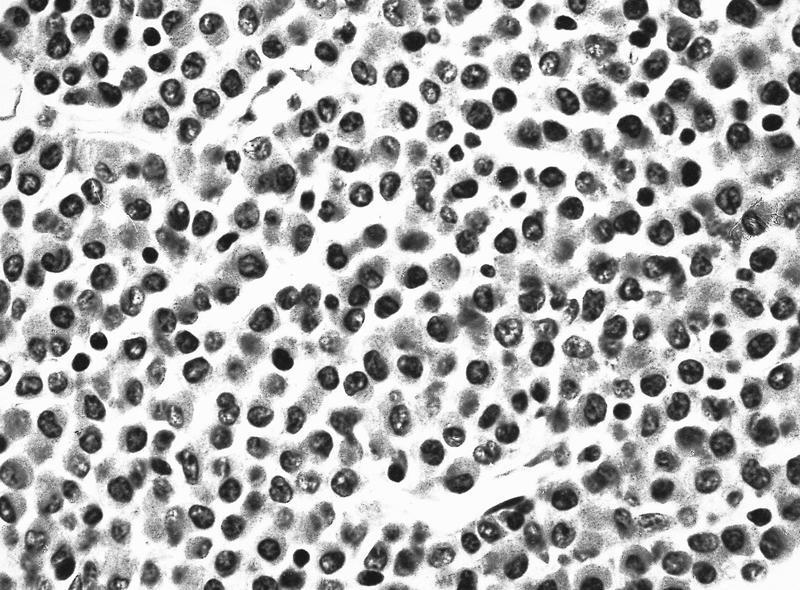
Bone marrow biopsy - reticulin stain
Images hosted on other servers:

T-LBL mediastinal involvement
Contributed by Patricia Tsang, M.D.
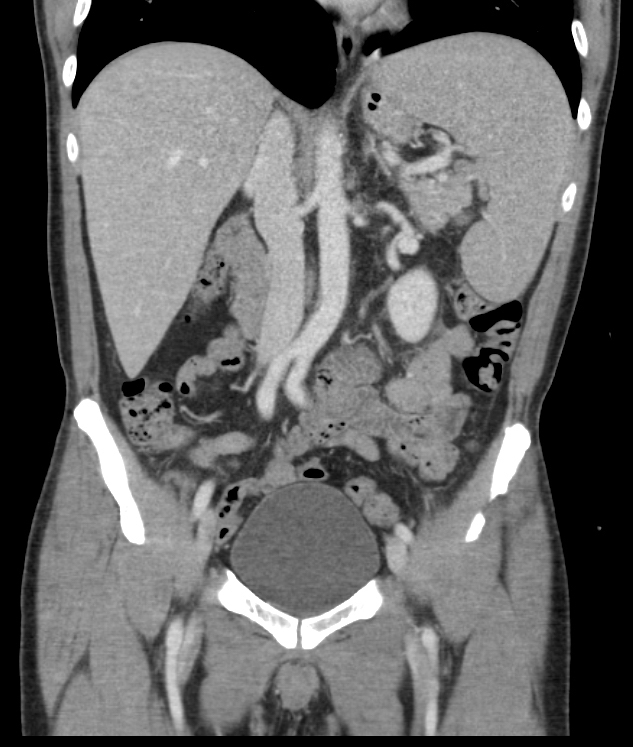
B-LBL retroperitoneal fibroadipose
B-LBL tongue
B-LBL tongue
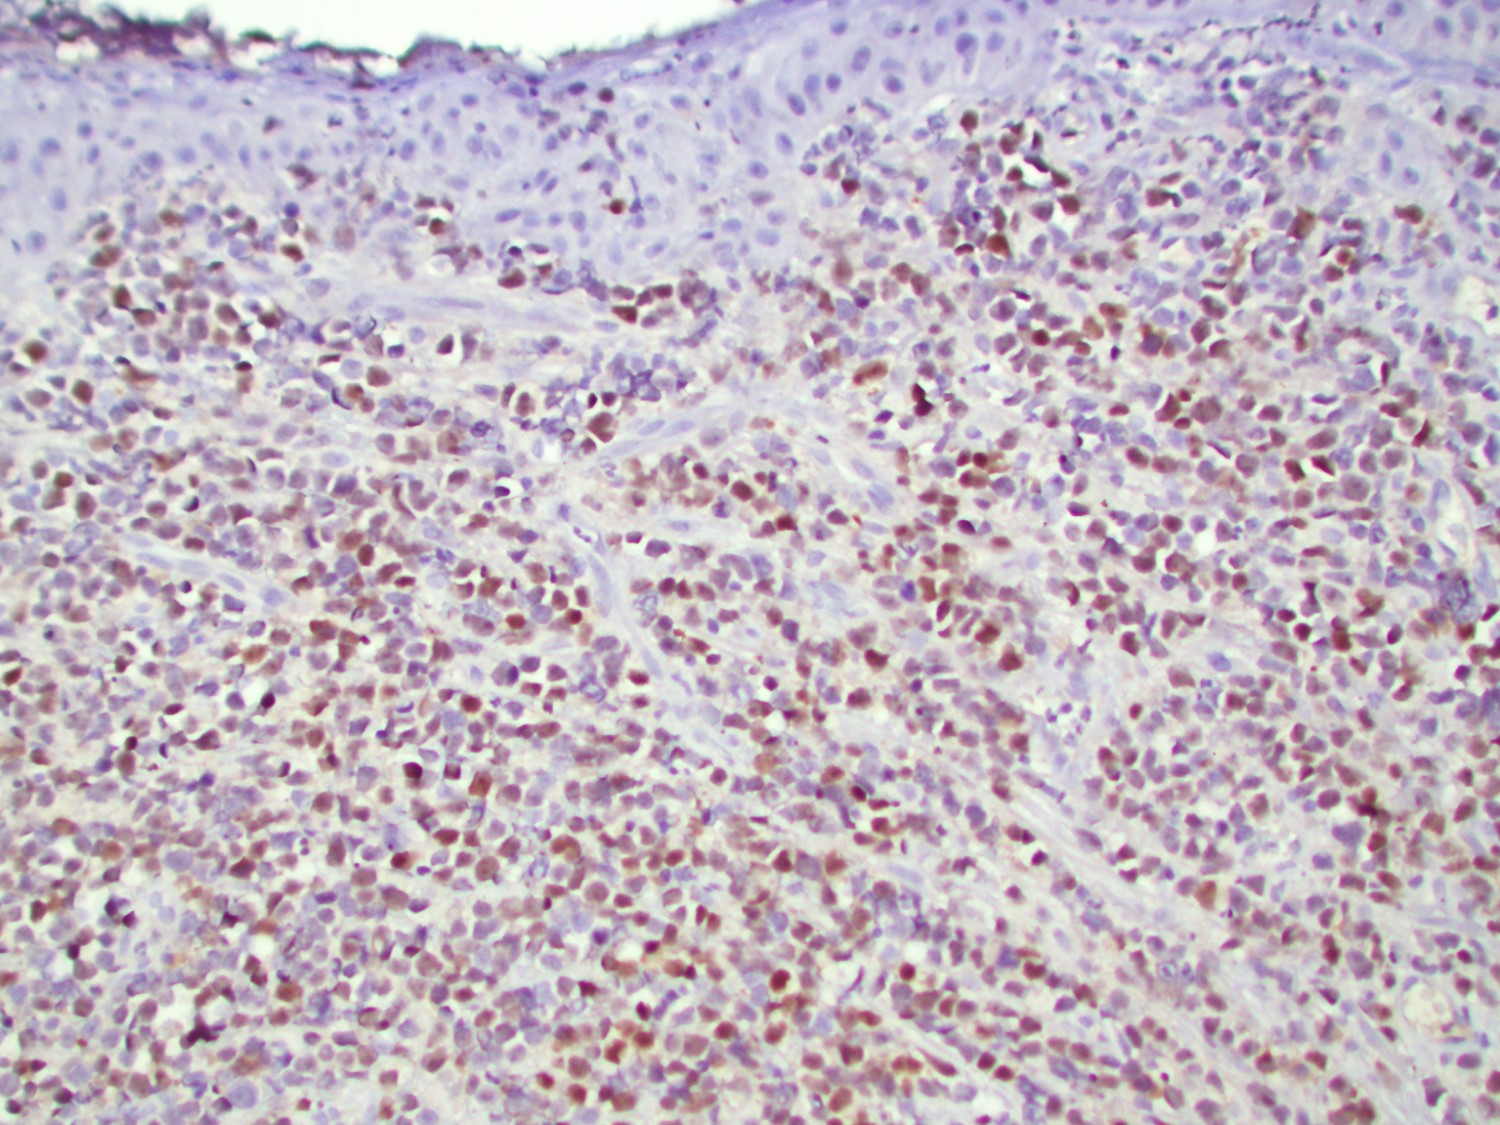
B-LBL tongue TdT
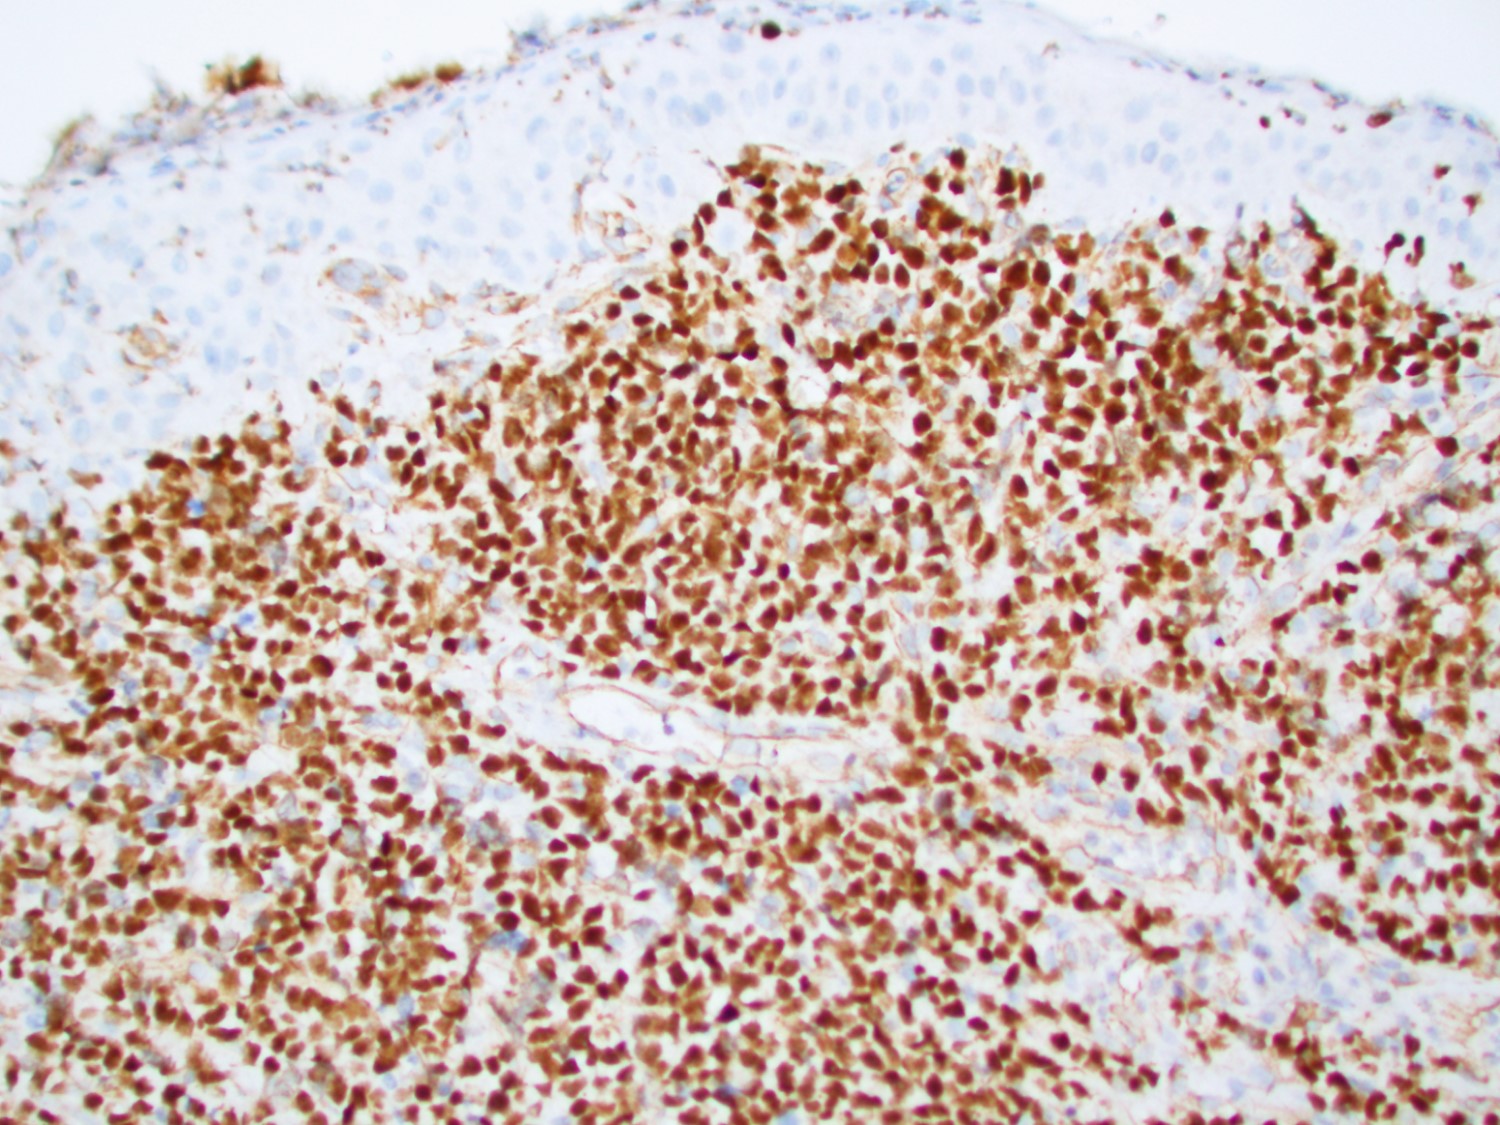
B-LBL tongue PAX5
B-LBL tongue CD20
T-LBL starry sky
T-LBL lymph node
T-LBL CD1a
Contributed by Patricia Tsang, M.D.
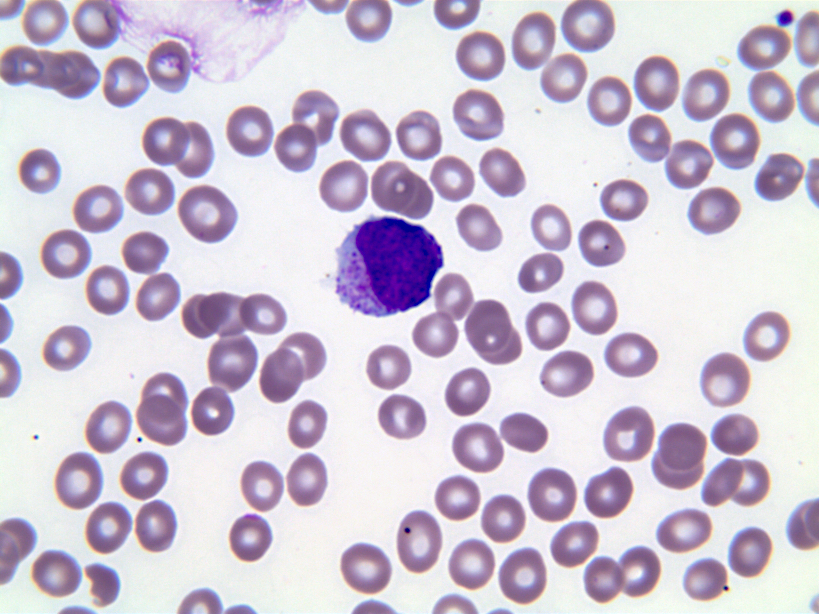
T lymphoblast on blood smear
Contributed by Patricia Tsang, M.D.
B lymphoblastic lymphoma
Contributed by Ramya Gadde, M.D., Rose Beck, M.D., Ph.D. and AFIP
Increased myelomonocytic population
Lysozyme immunostain
Bone marrow biopsy

Increased blasts and blast equivalents
Mixture of monocytes and neutrophils
Promonocytes
Promonocytes and dysplastic neutrophil
Promonocytes and myelocytes
Chloroacetate and nonspecific esterase stains
AFIP images
Myeloblast, neutrophilic myelocyte and promonocyte
Contributed by Ramya Gadde, M.D. and Rose Beck, M.D., Ph.D.

Blast and monocytic population
Contributed by Julie Feldstein, M.D. and AFIP
Bone marrow trephine biopsy
Reticulin

Bone marrow biopsy
Lymph node biopsy
Bone marrow smear (Wright-Giemsa)
Stains
AFIP images
Peripheral smear (Wright-Giemsa)
AFIP images
Child with t(4;11)(q21;q23)
Lymphoblasts and monoblasts
Monoblasts, promonocytes and lymphoblasts
AFIP images
Monocytoid blast
Contributed by Ling Zhang, M.D.
Bone marrow biopsy
Bone marrow biopsy
Bone marrow aspirate smear
Contributed by Ling Zhang, M.D.
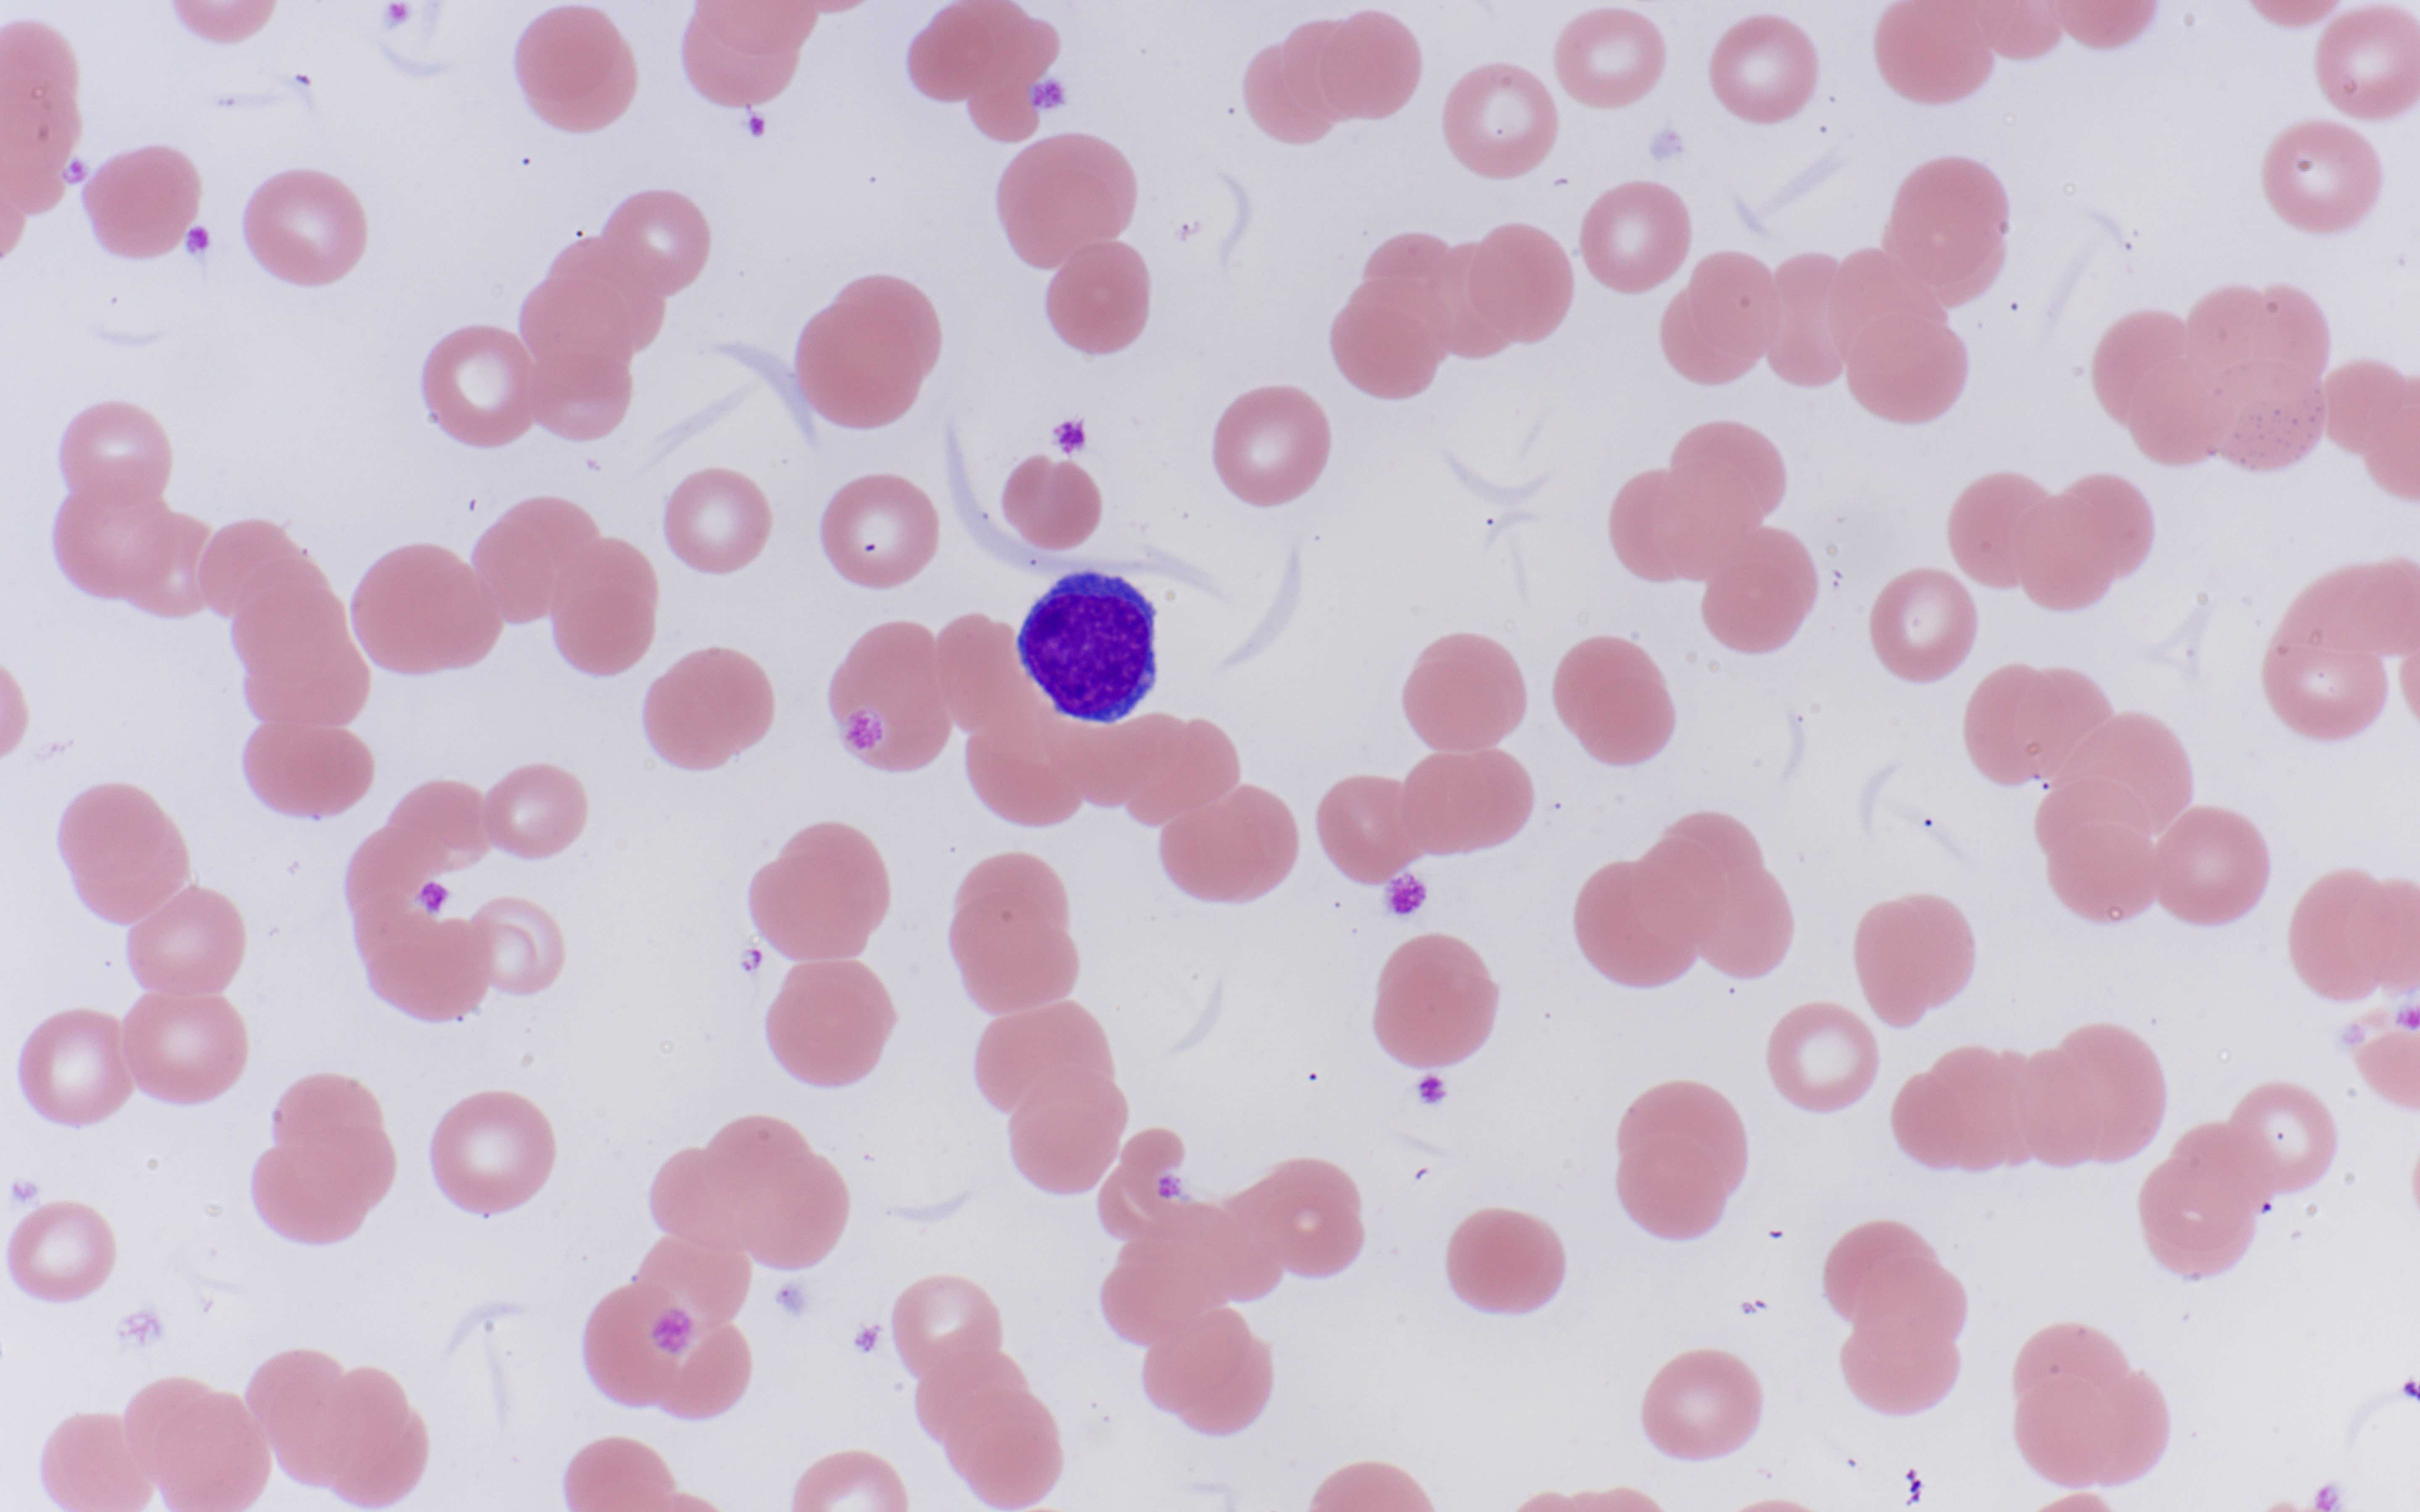
Peripheral blood smear
Contributed by Hatem Kaseb, M.D., Ph.D., M.P.H.
Lymphoblasts
Contributed by Hatem Kaseb, M.D., Ph.D., M.P.H.
Lymphoblasts
Contributed by Joseph Khoury, M.D.
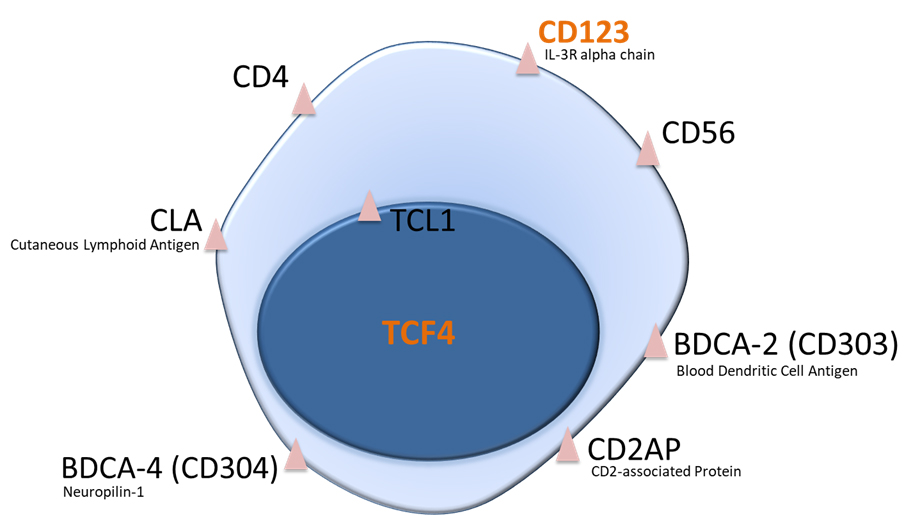
Markers expressed by pDCs
Contributed by Joseph Khoury, M.D.
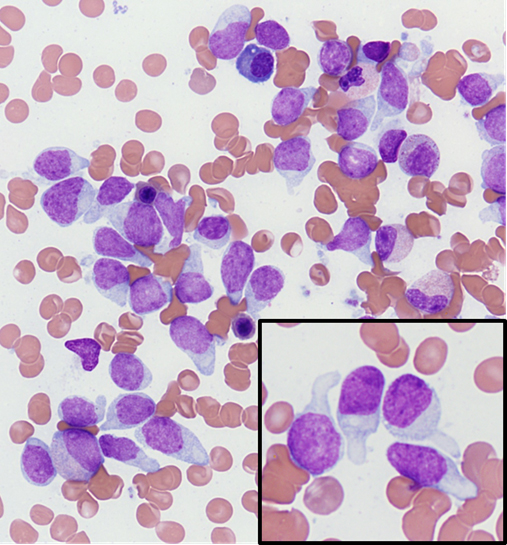
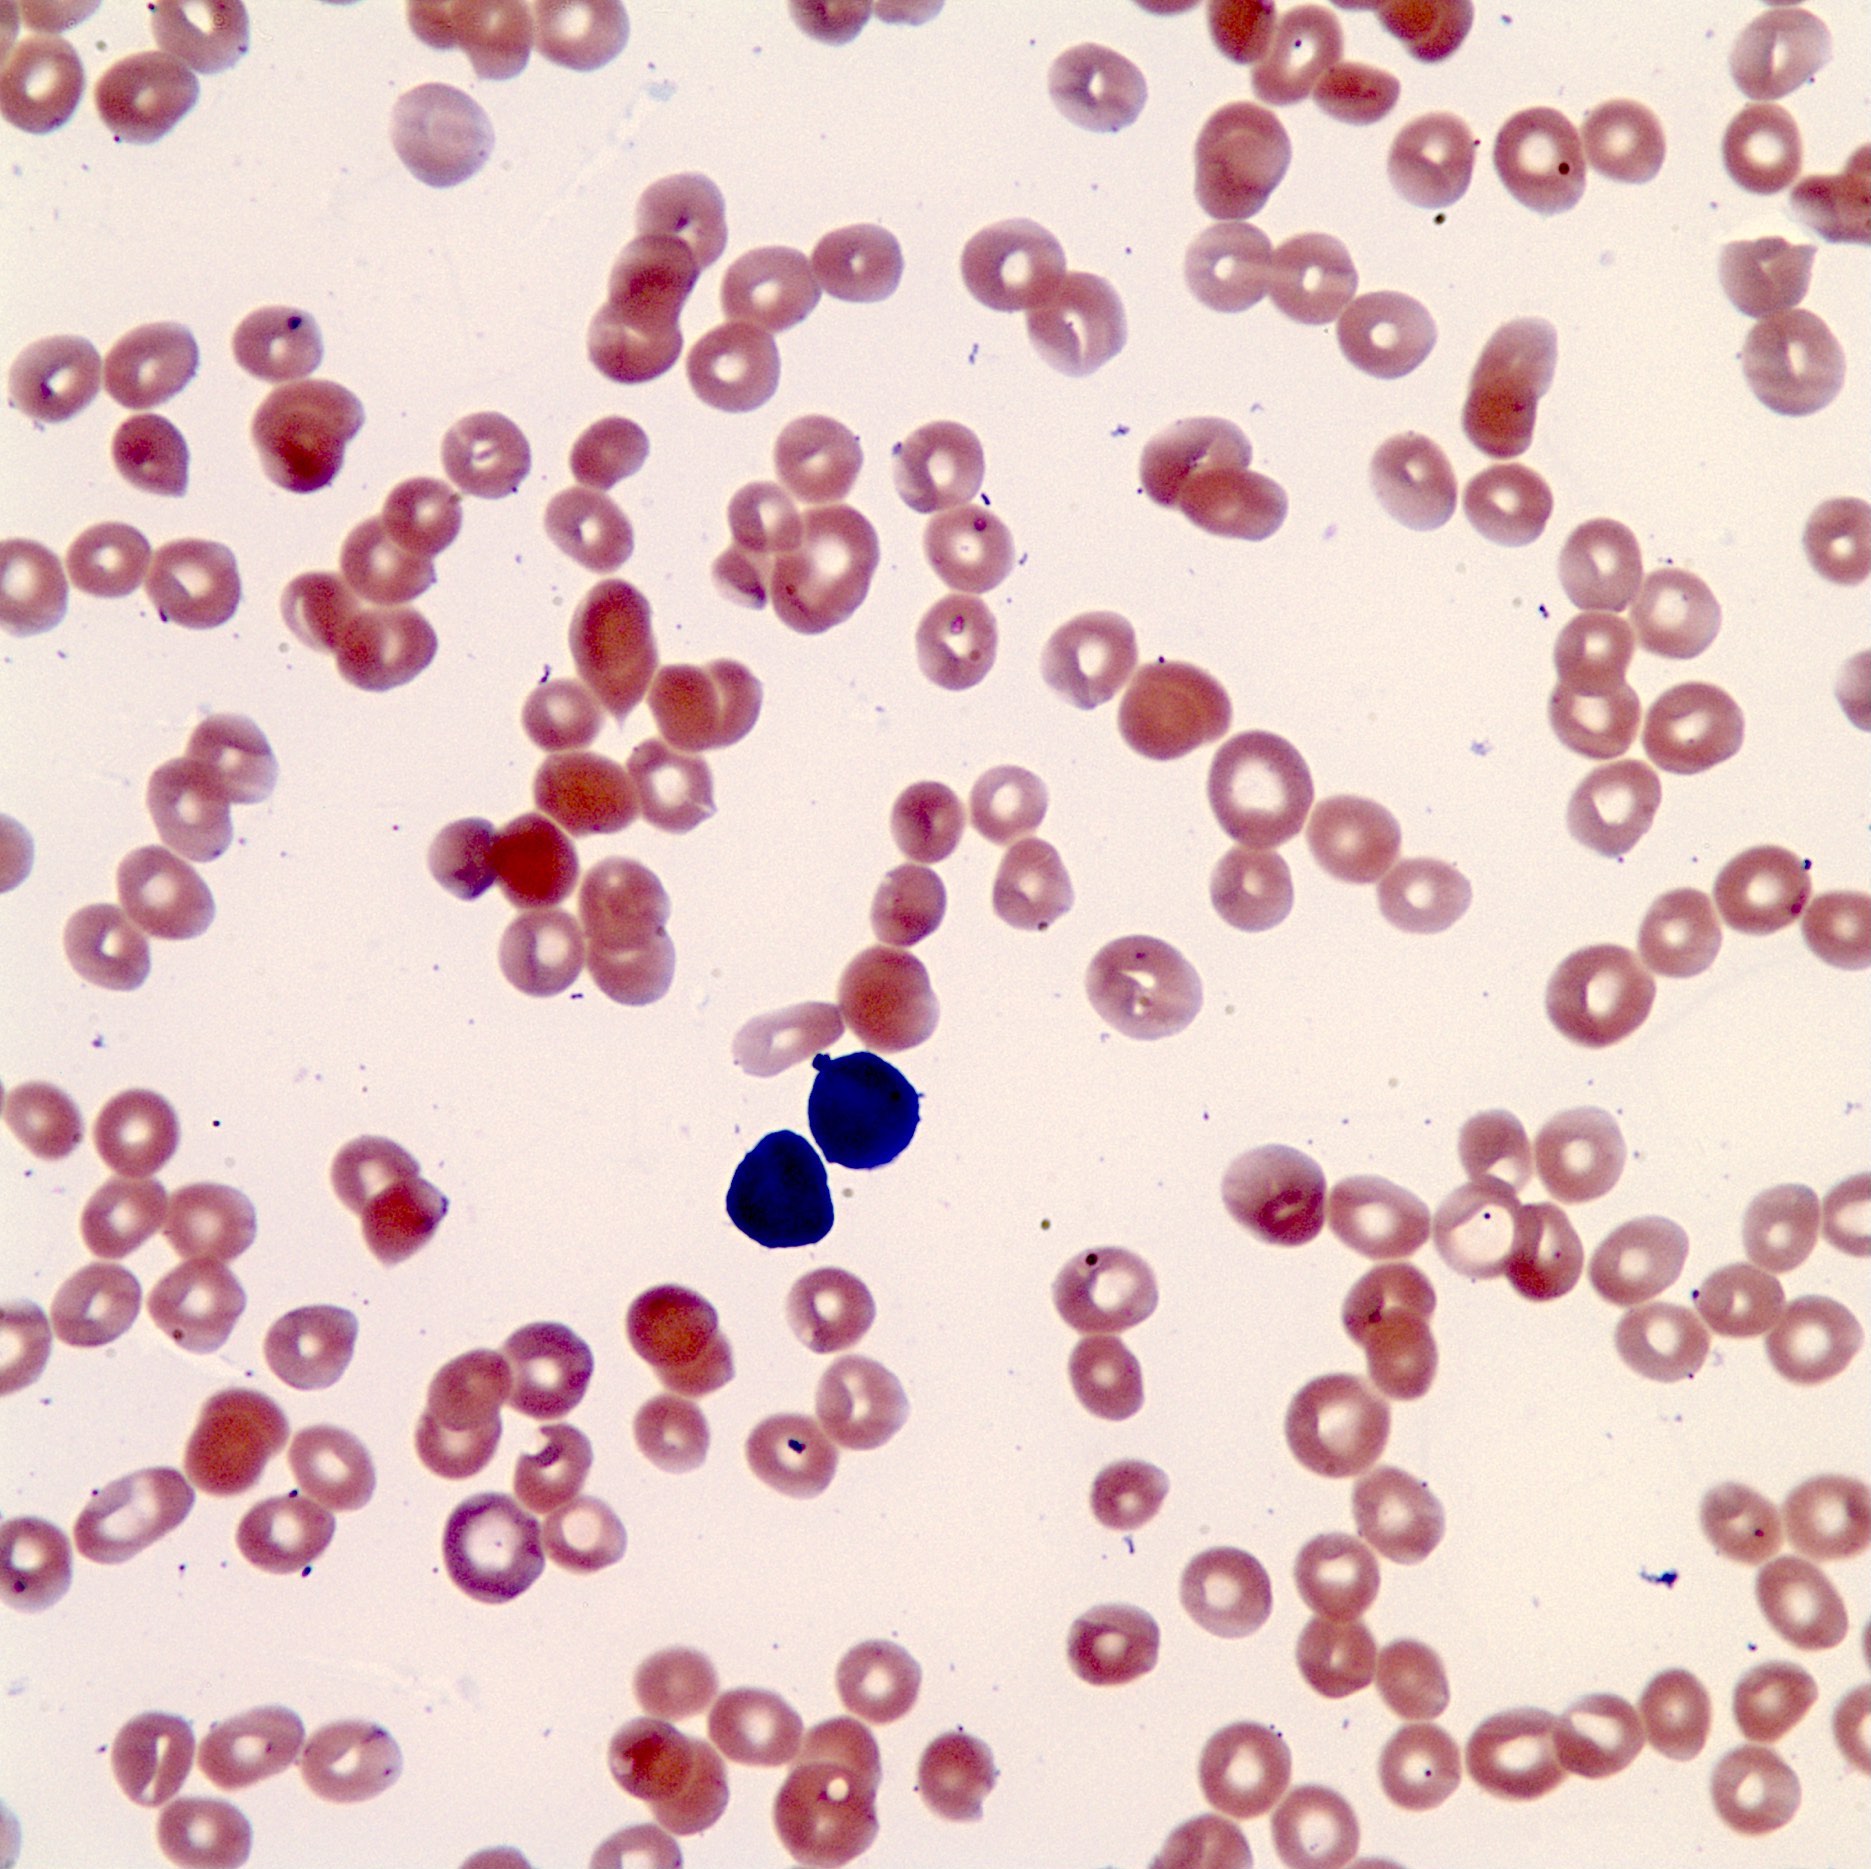
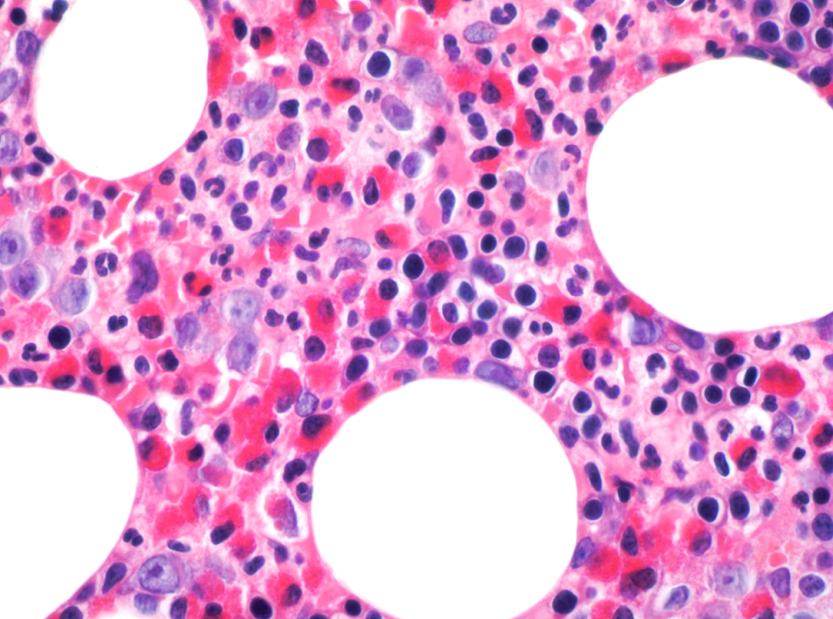
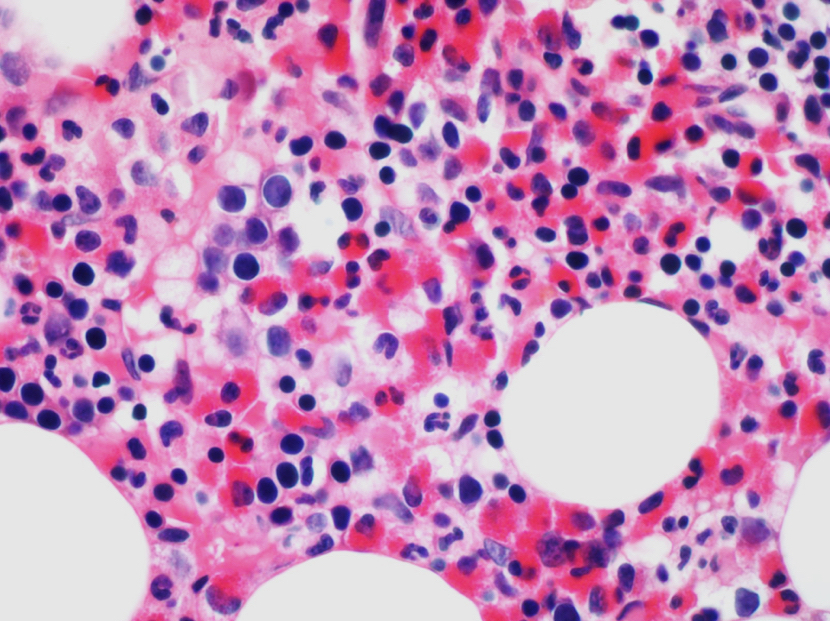
Cytomorphology of BPDCN cells

Bone marrow involvement by BPDCN
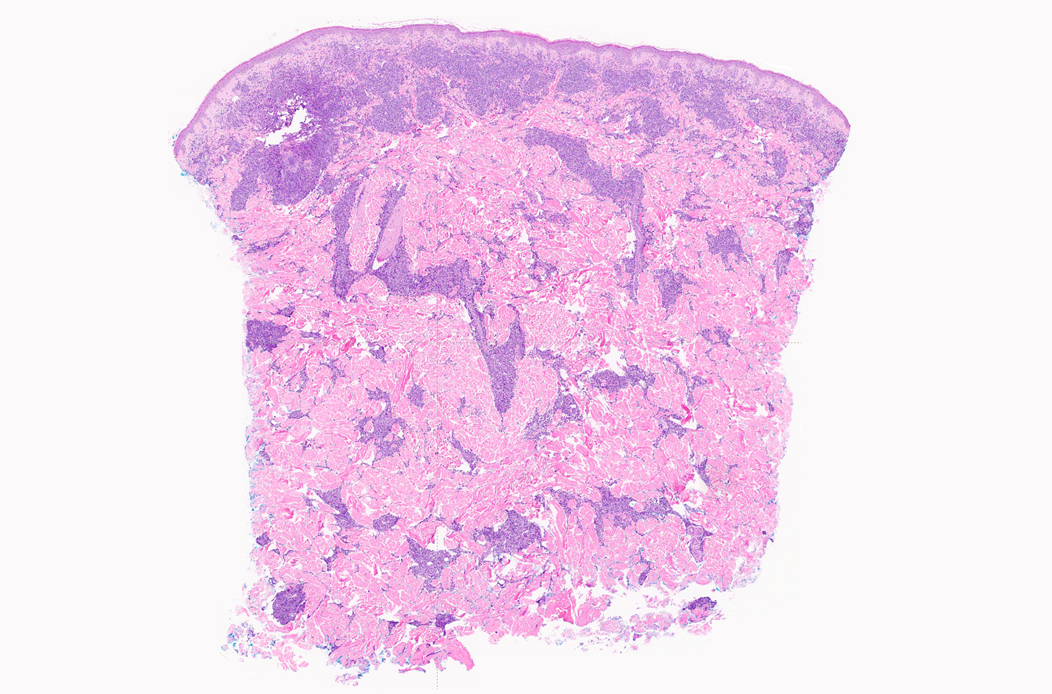
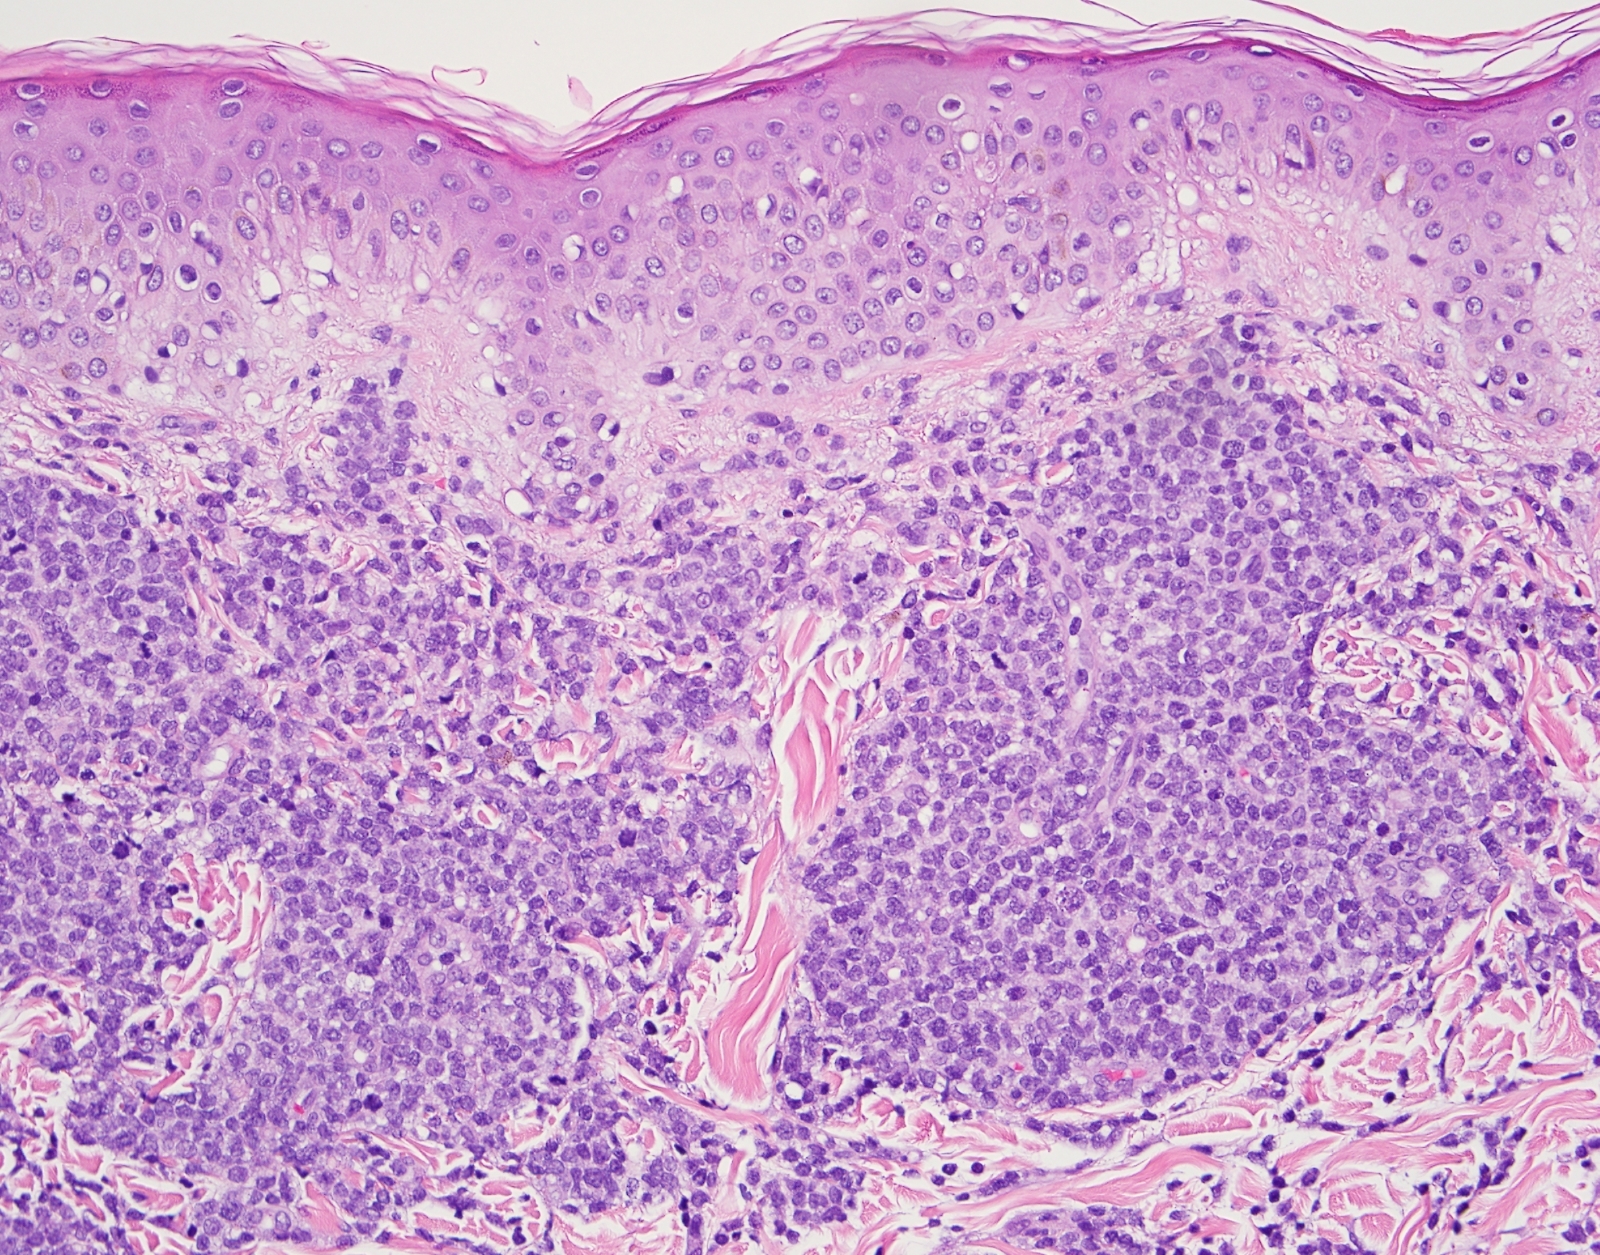
Skin involvement by BPDCN
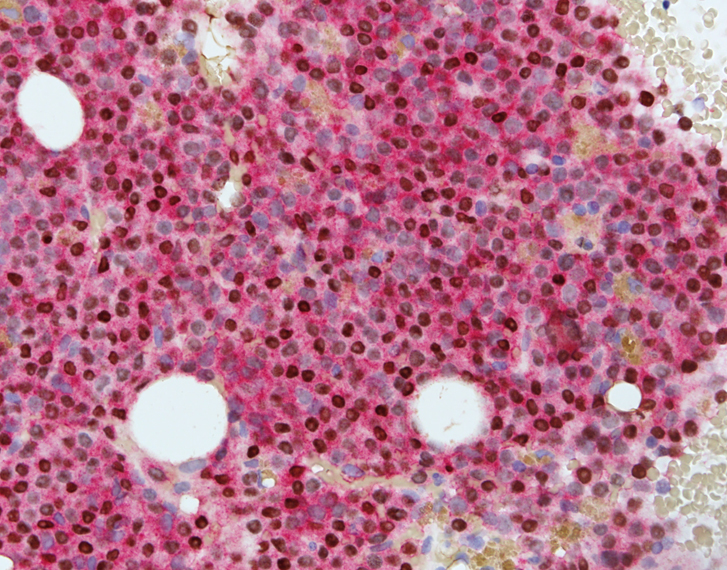
TCF4 / CD123 dual color stain in bone marrow
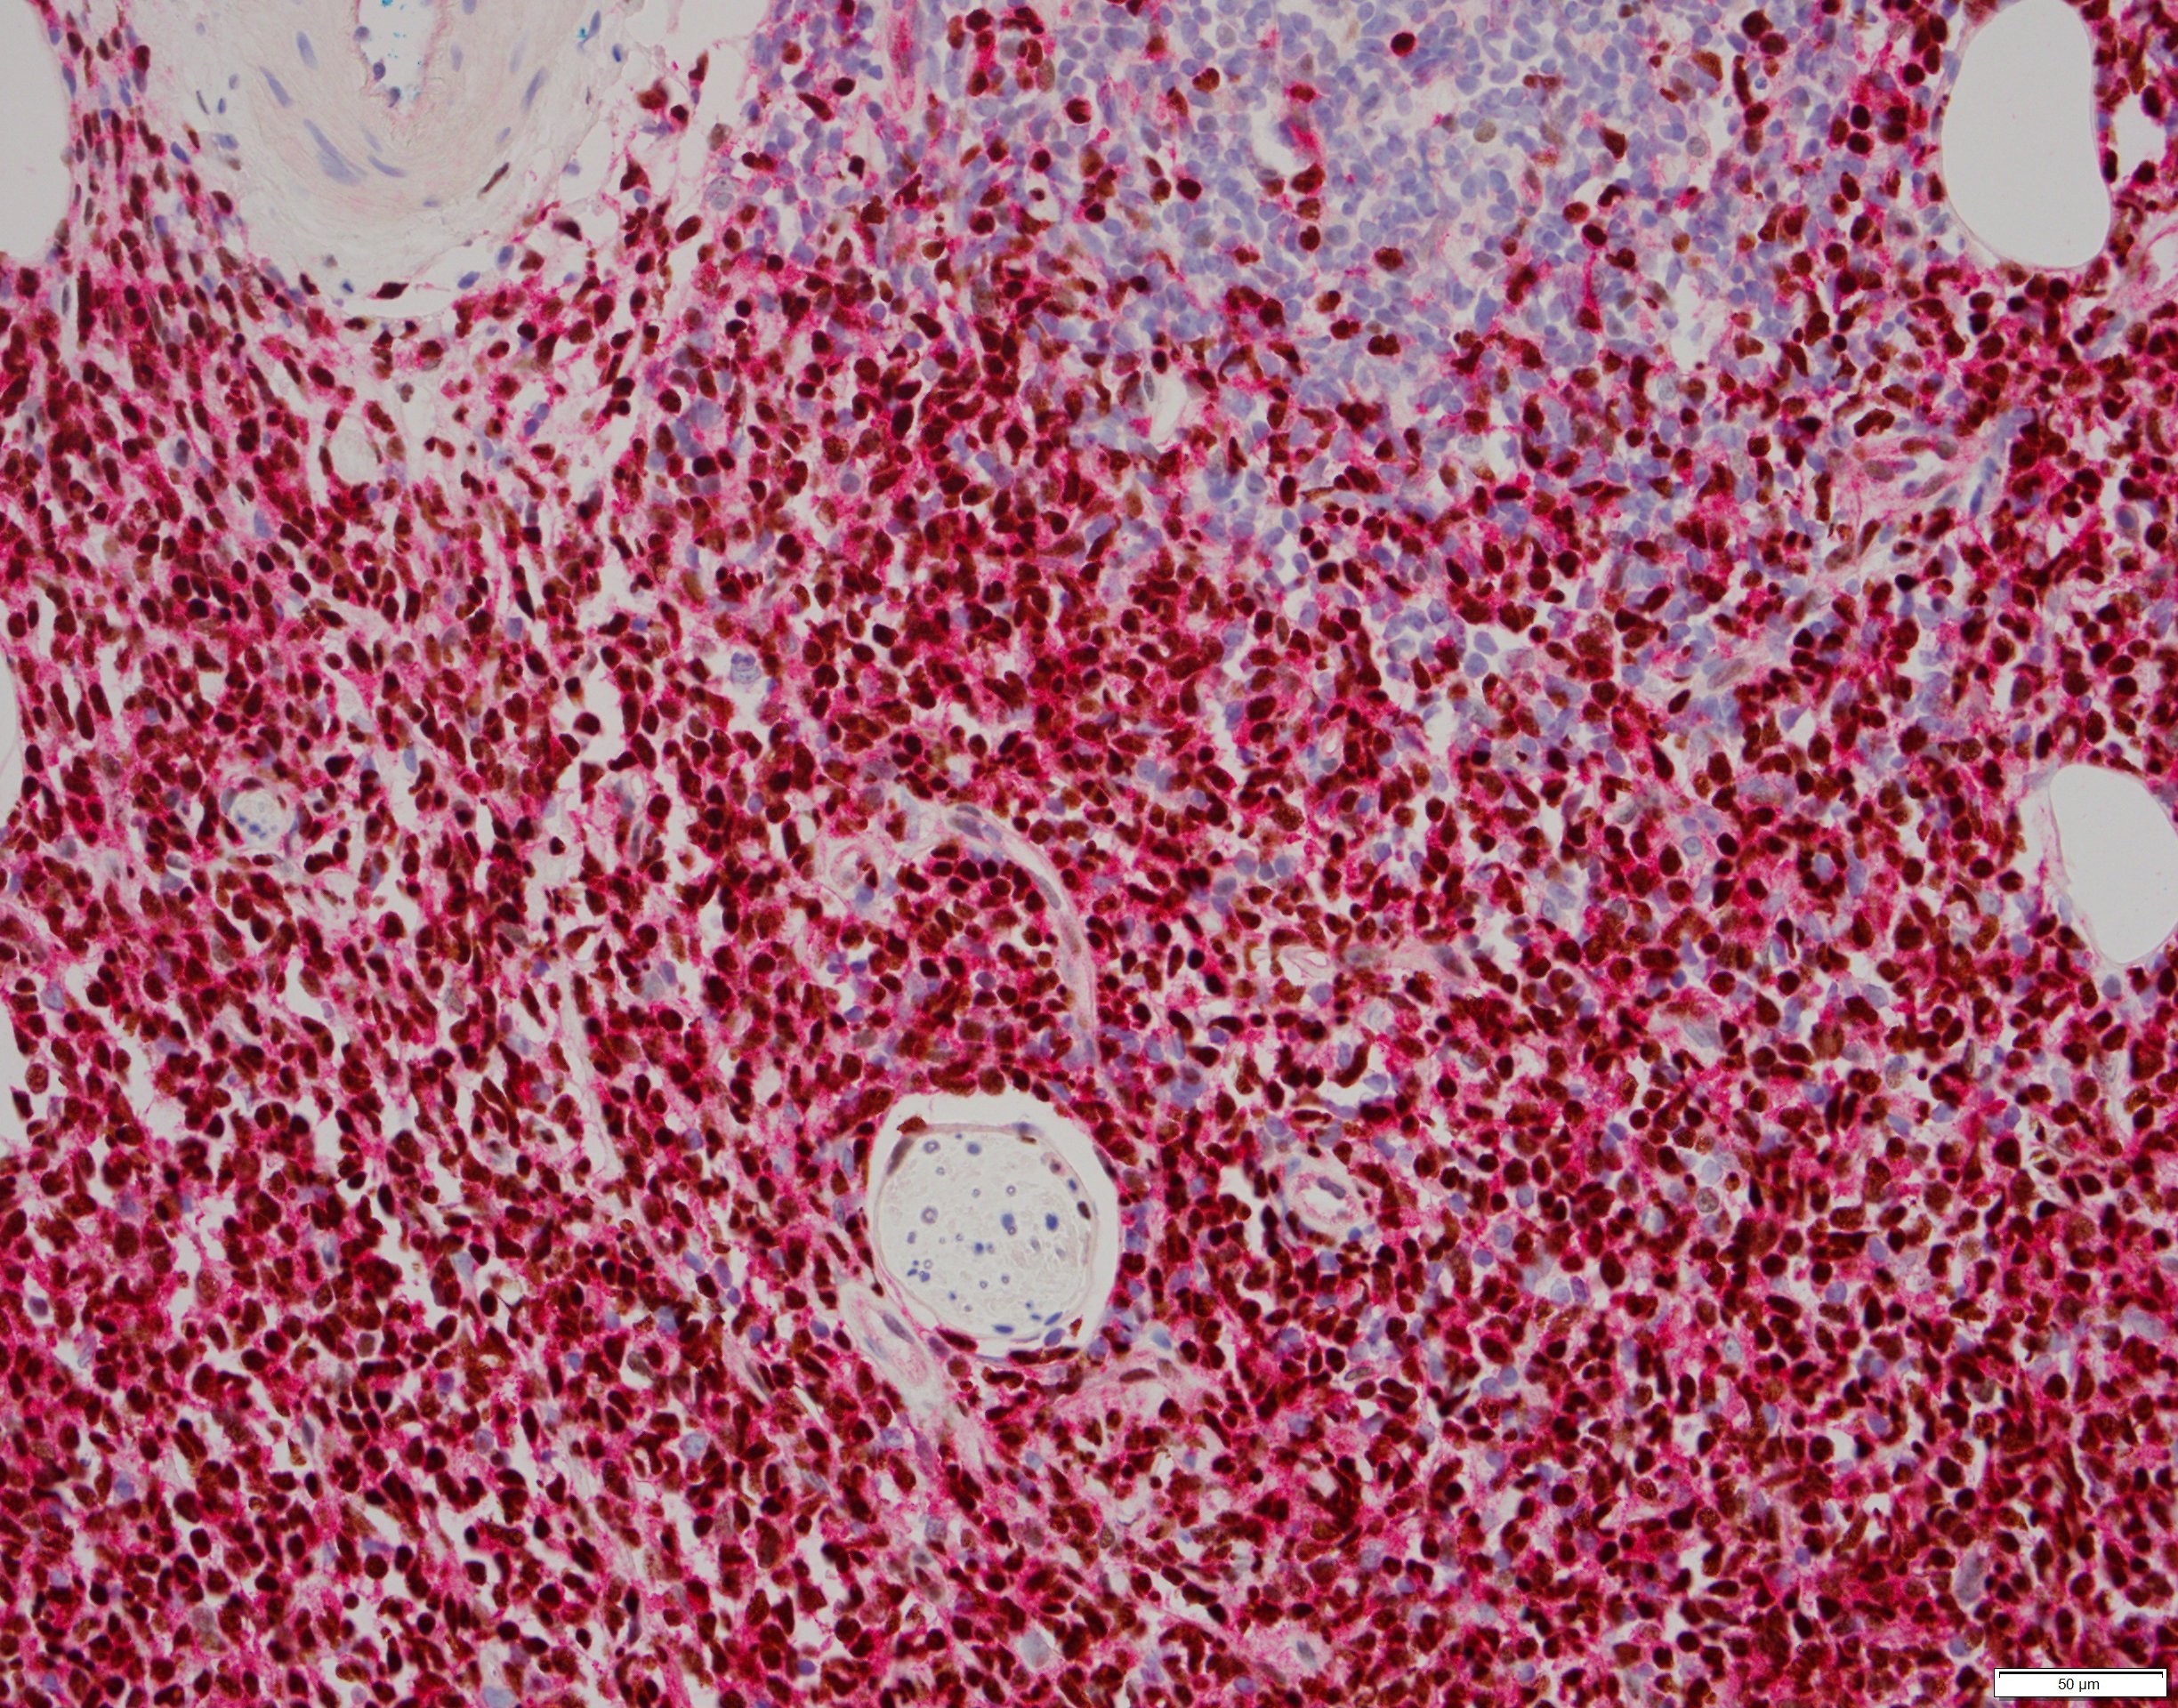
TCF4/CD123 dual color stain in skin
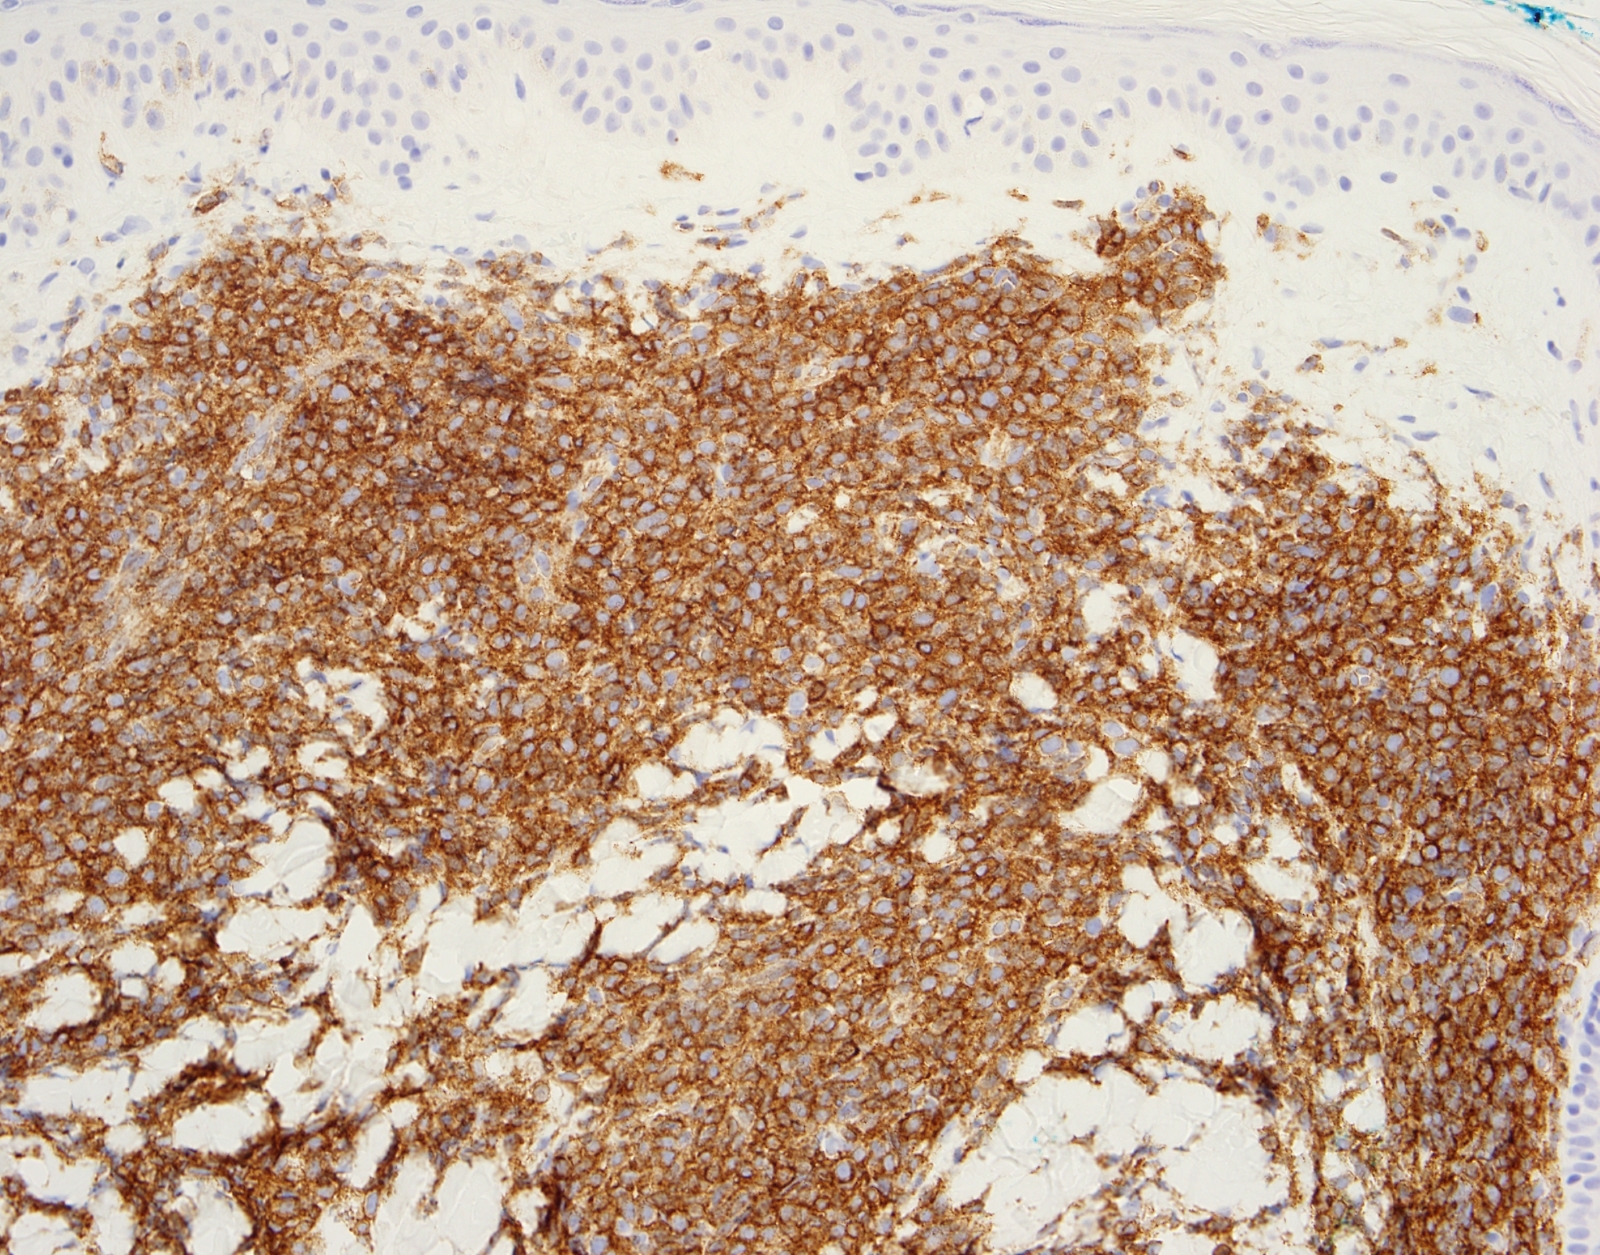
CD123
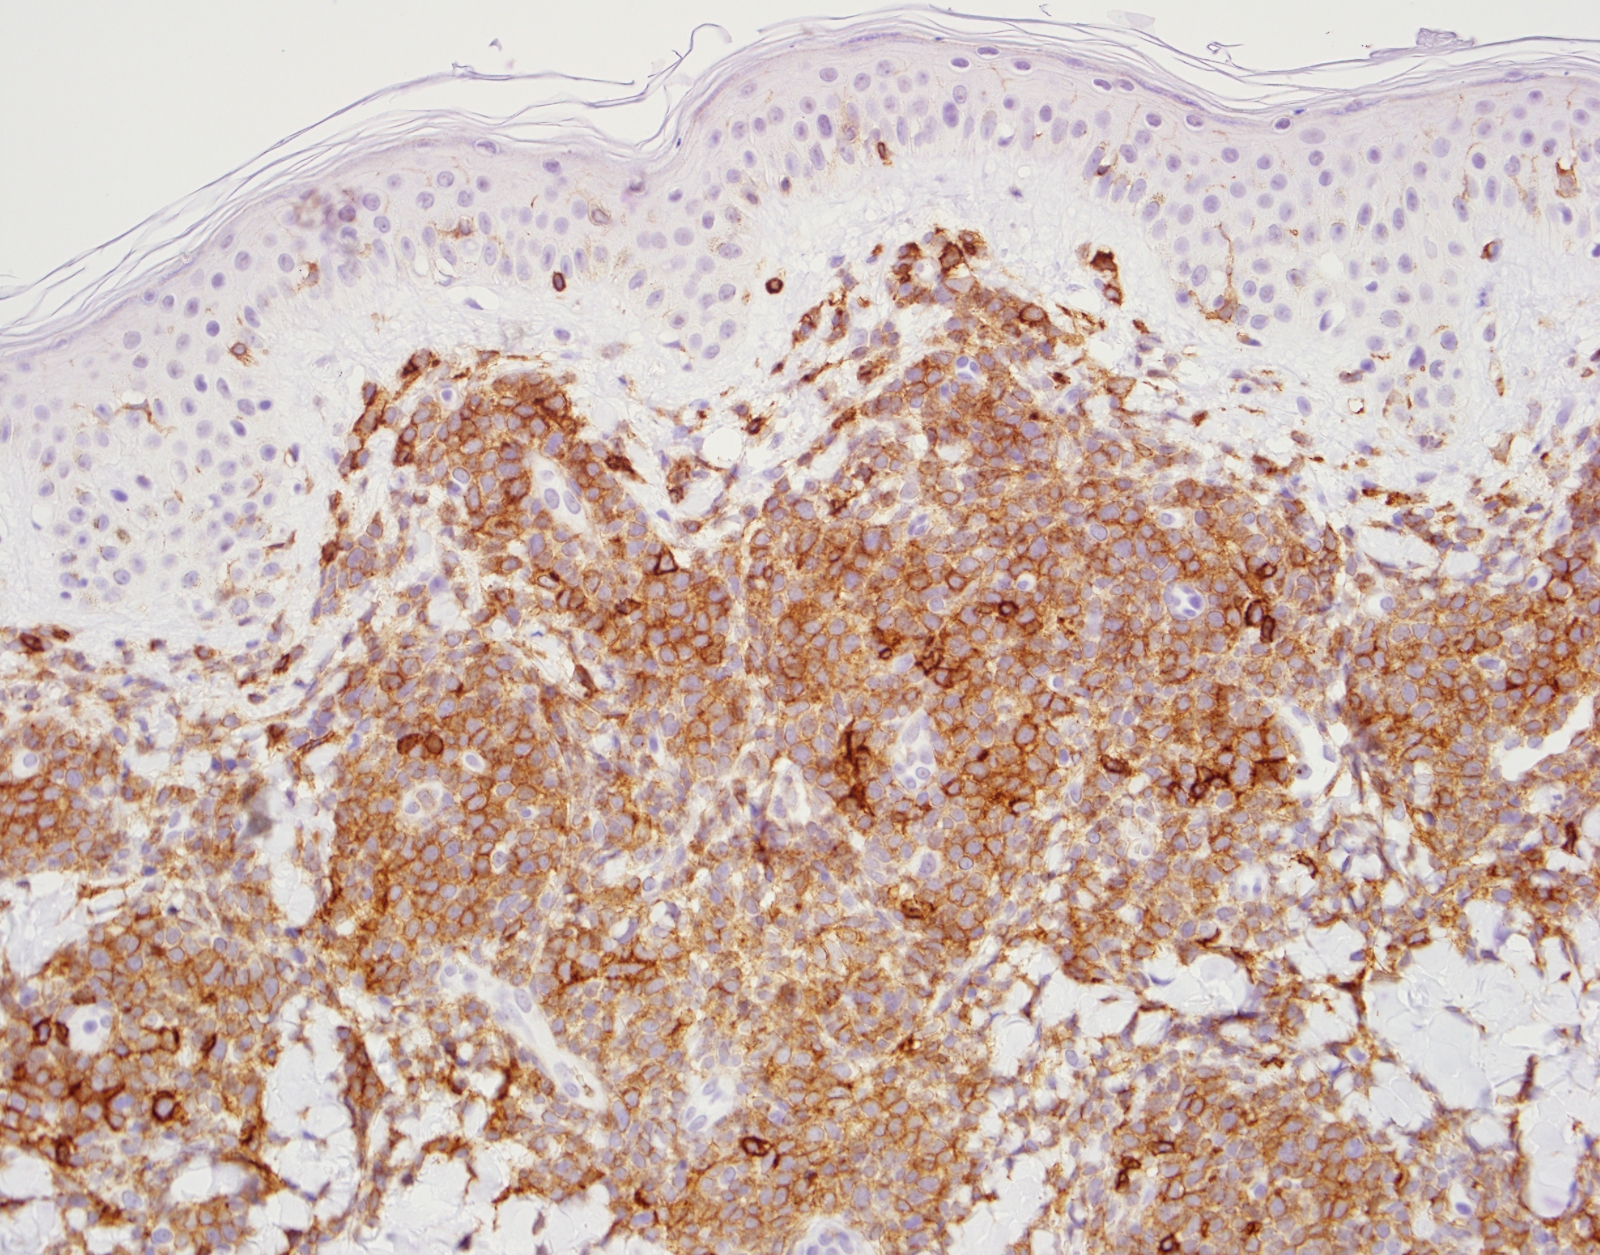
CD4

CD56
Contributed by Joseph Khoury, M.D.
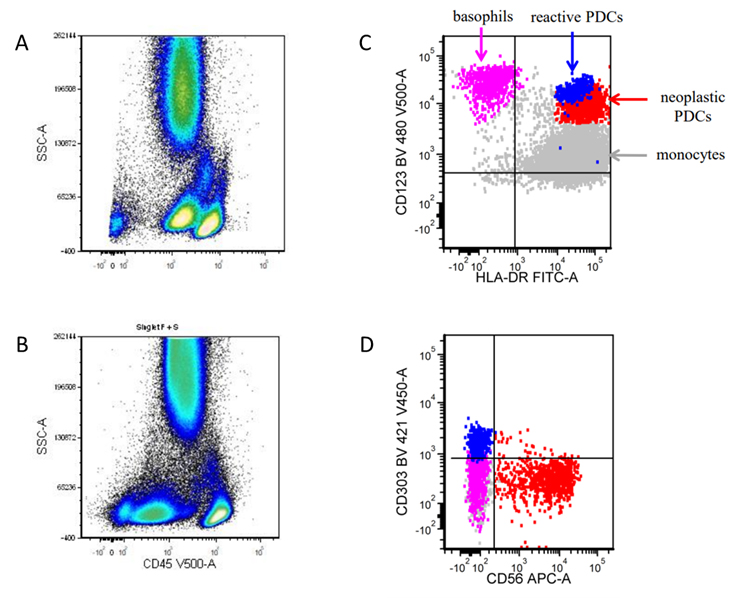
Flow cytometry findings in BPDCN
Contributed by Lynh Nguyen, M.D. and AFIP

Numerous eosinophilic precursors
Myeloid preponderance

Marked hypercellularity
Granulocytic hyperplasia
Reticulin fibrosis
Markedly fibrotic marrow

Markedly hypercellular
Contributed by Lynh Nguyen, M.D.
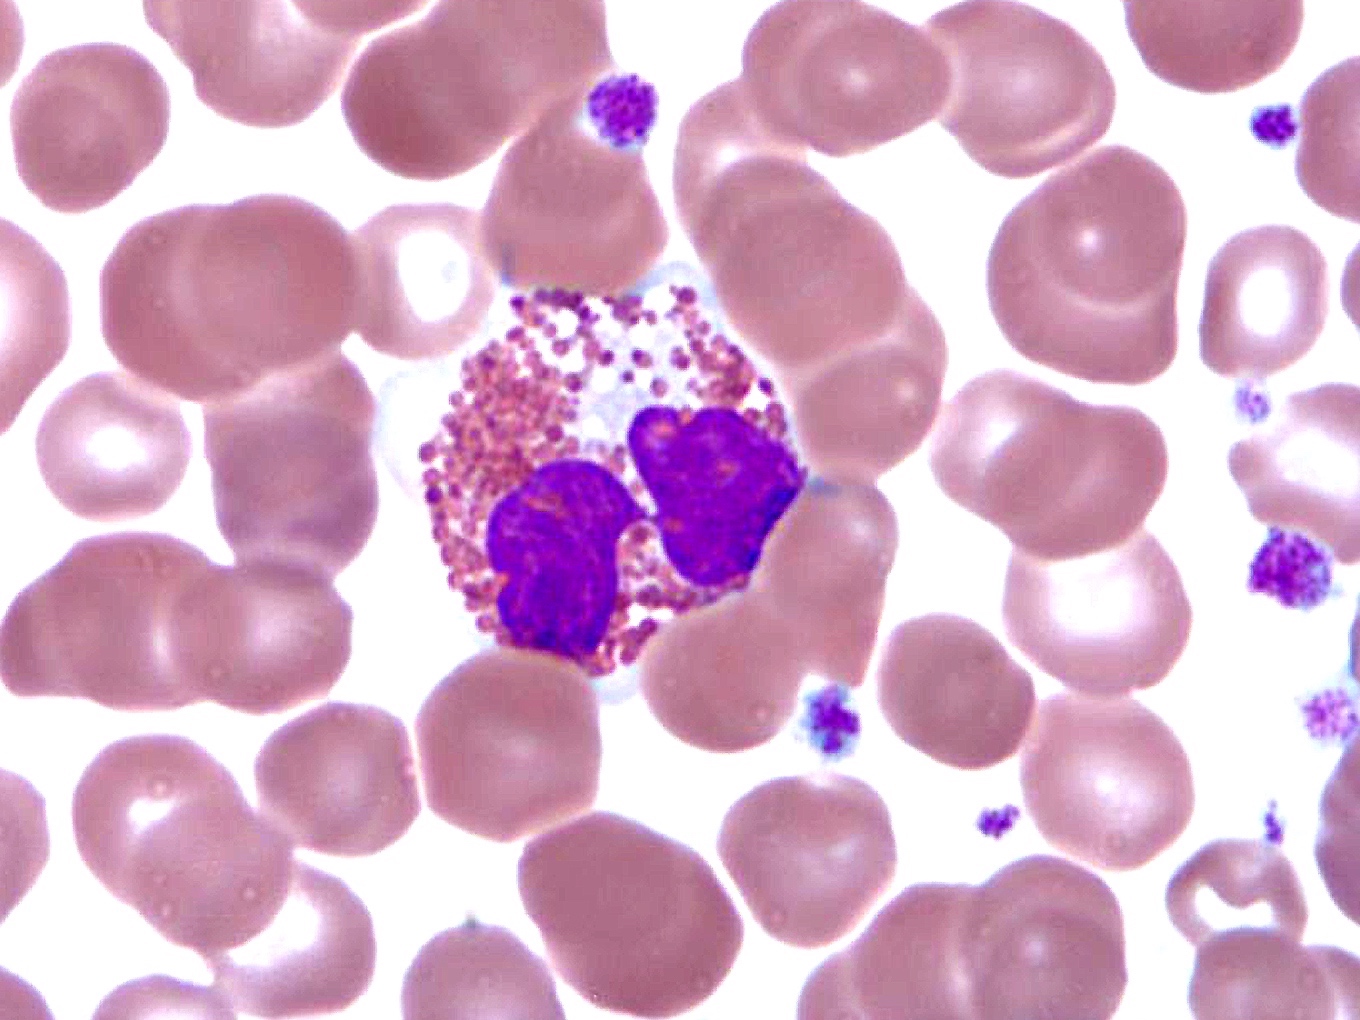
Moderately degranulated eosinophils
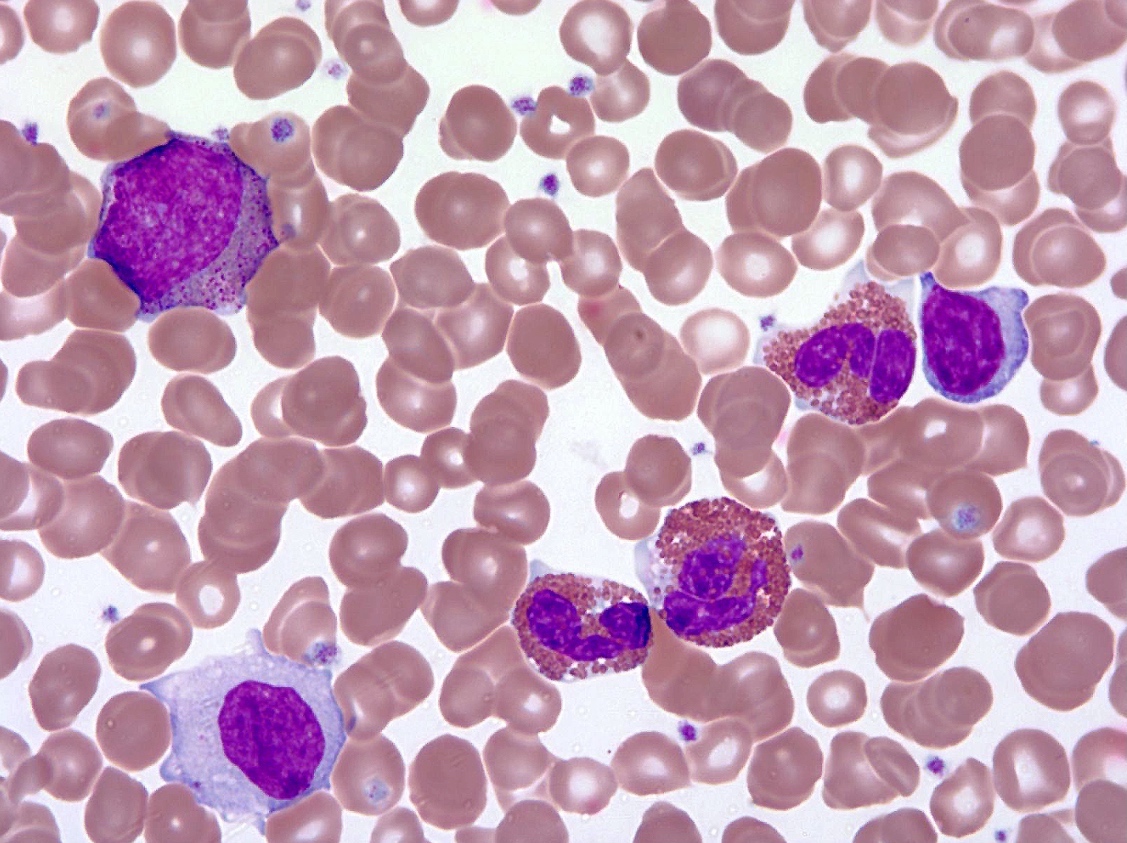
Patient with longstanding hypereosinophilia
Circulating abnormal eosinophils
Markedly increased eosinophils
AFIP images
Abnormal eosinophil with decreased granules
Contributed by Yang Shi, M.D., Ph.D.
Splenomegaly
Contributed by Yang Shi, M.D., Ph.D.
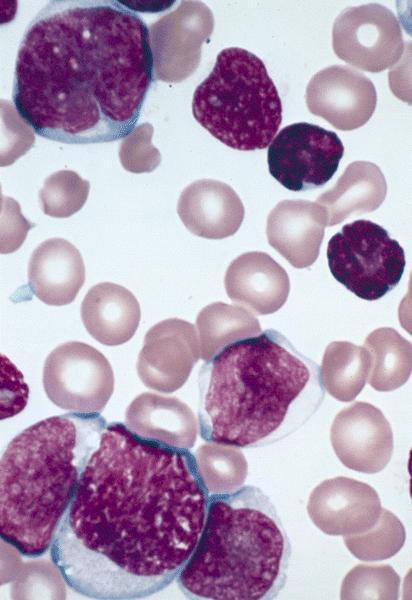
Chronic phase marrow
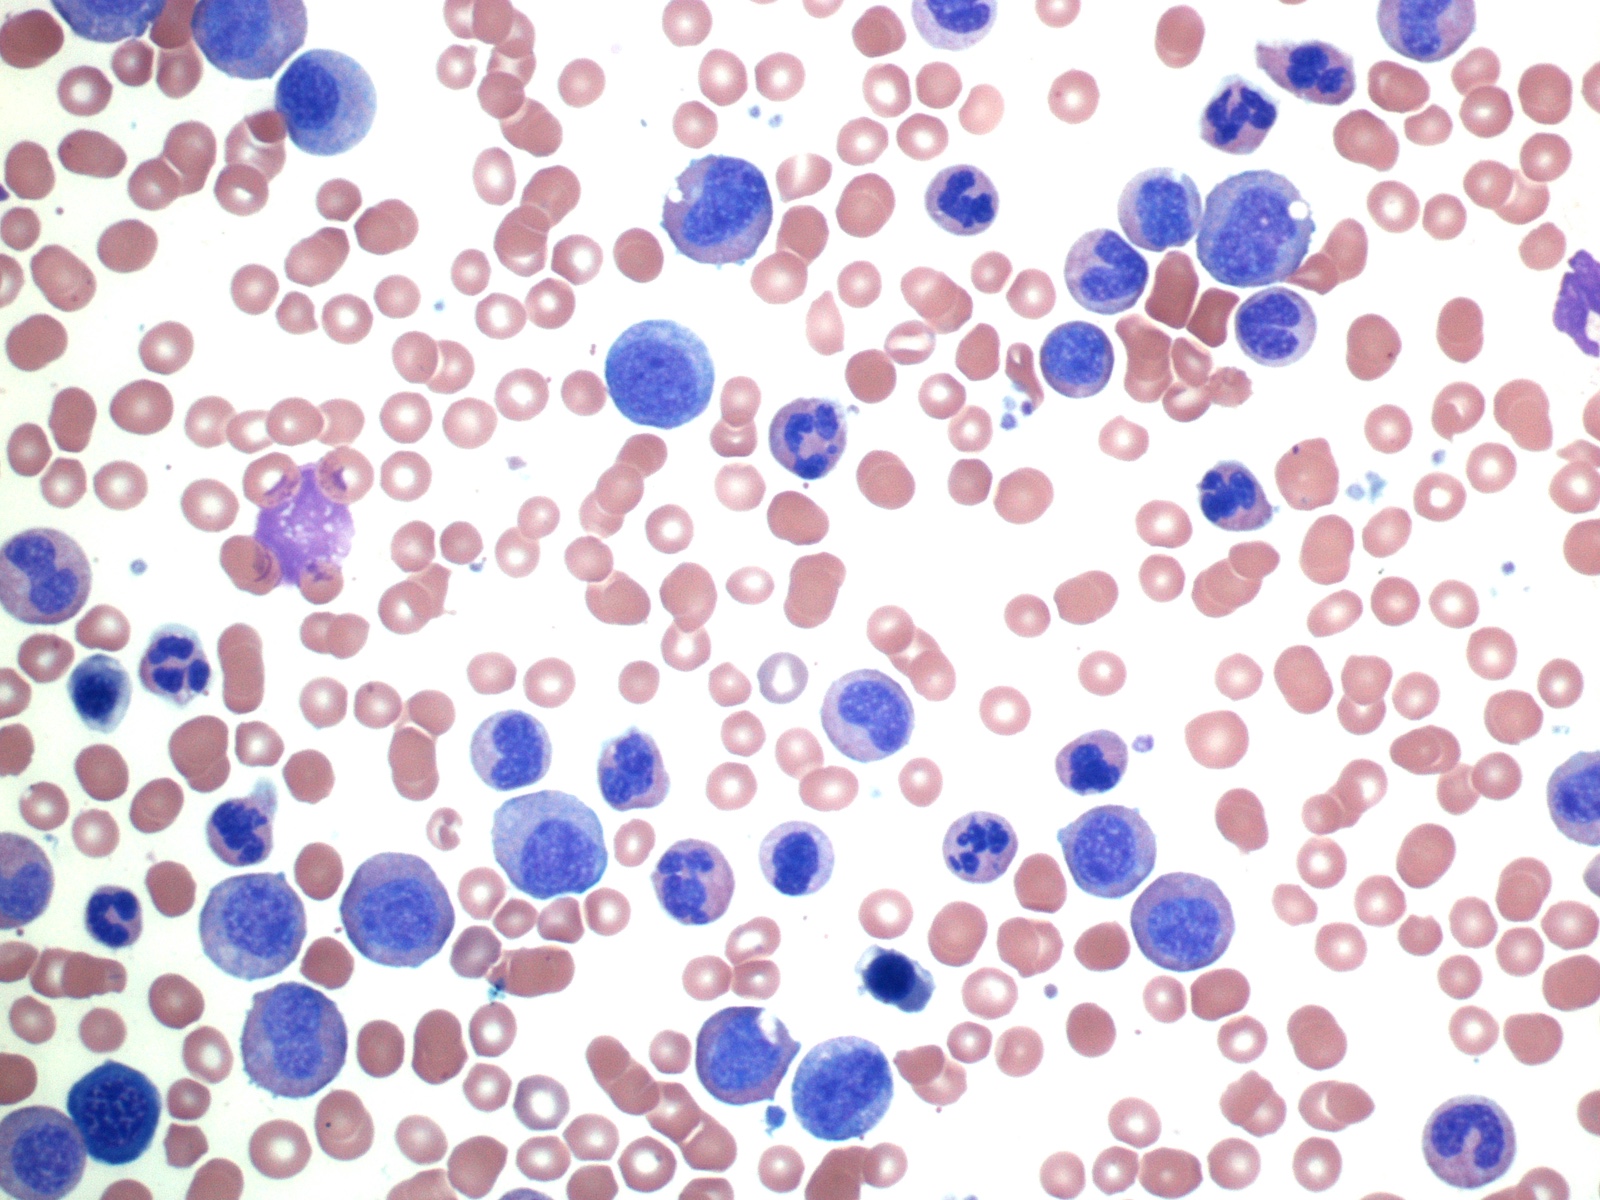
Chronic phase marrow smear

Accelerated phase marrow

Blast phase B-ALL
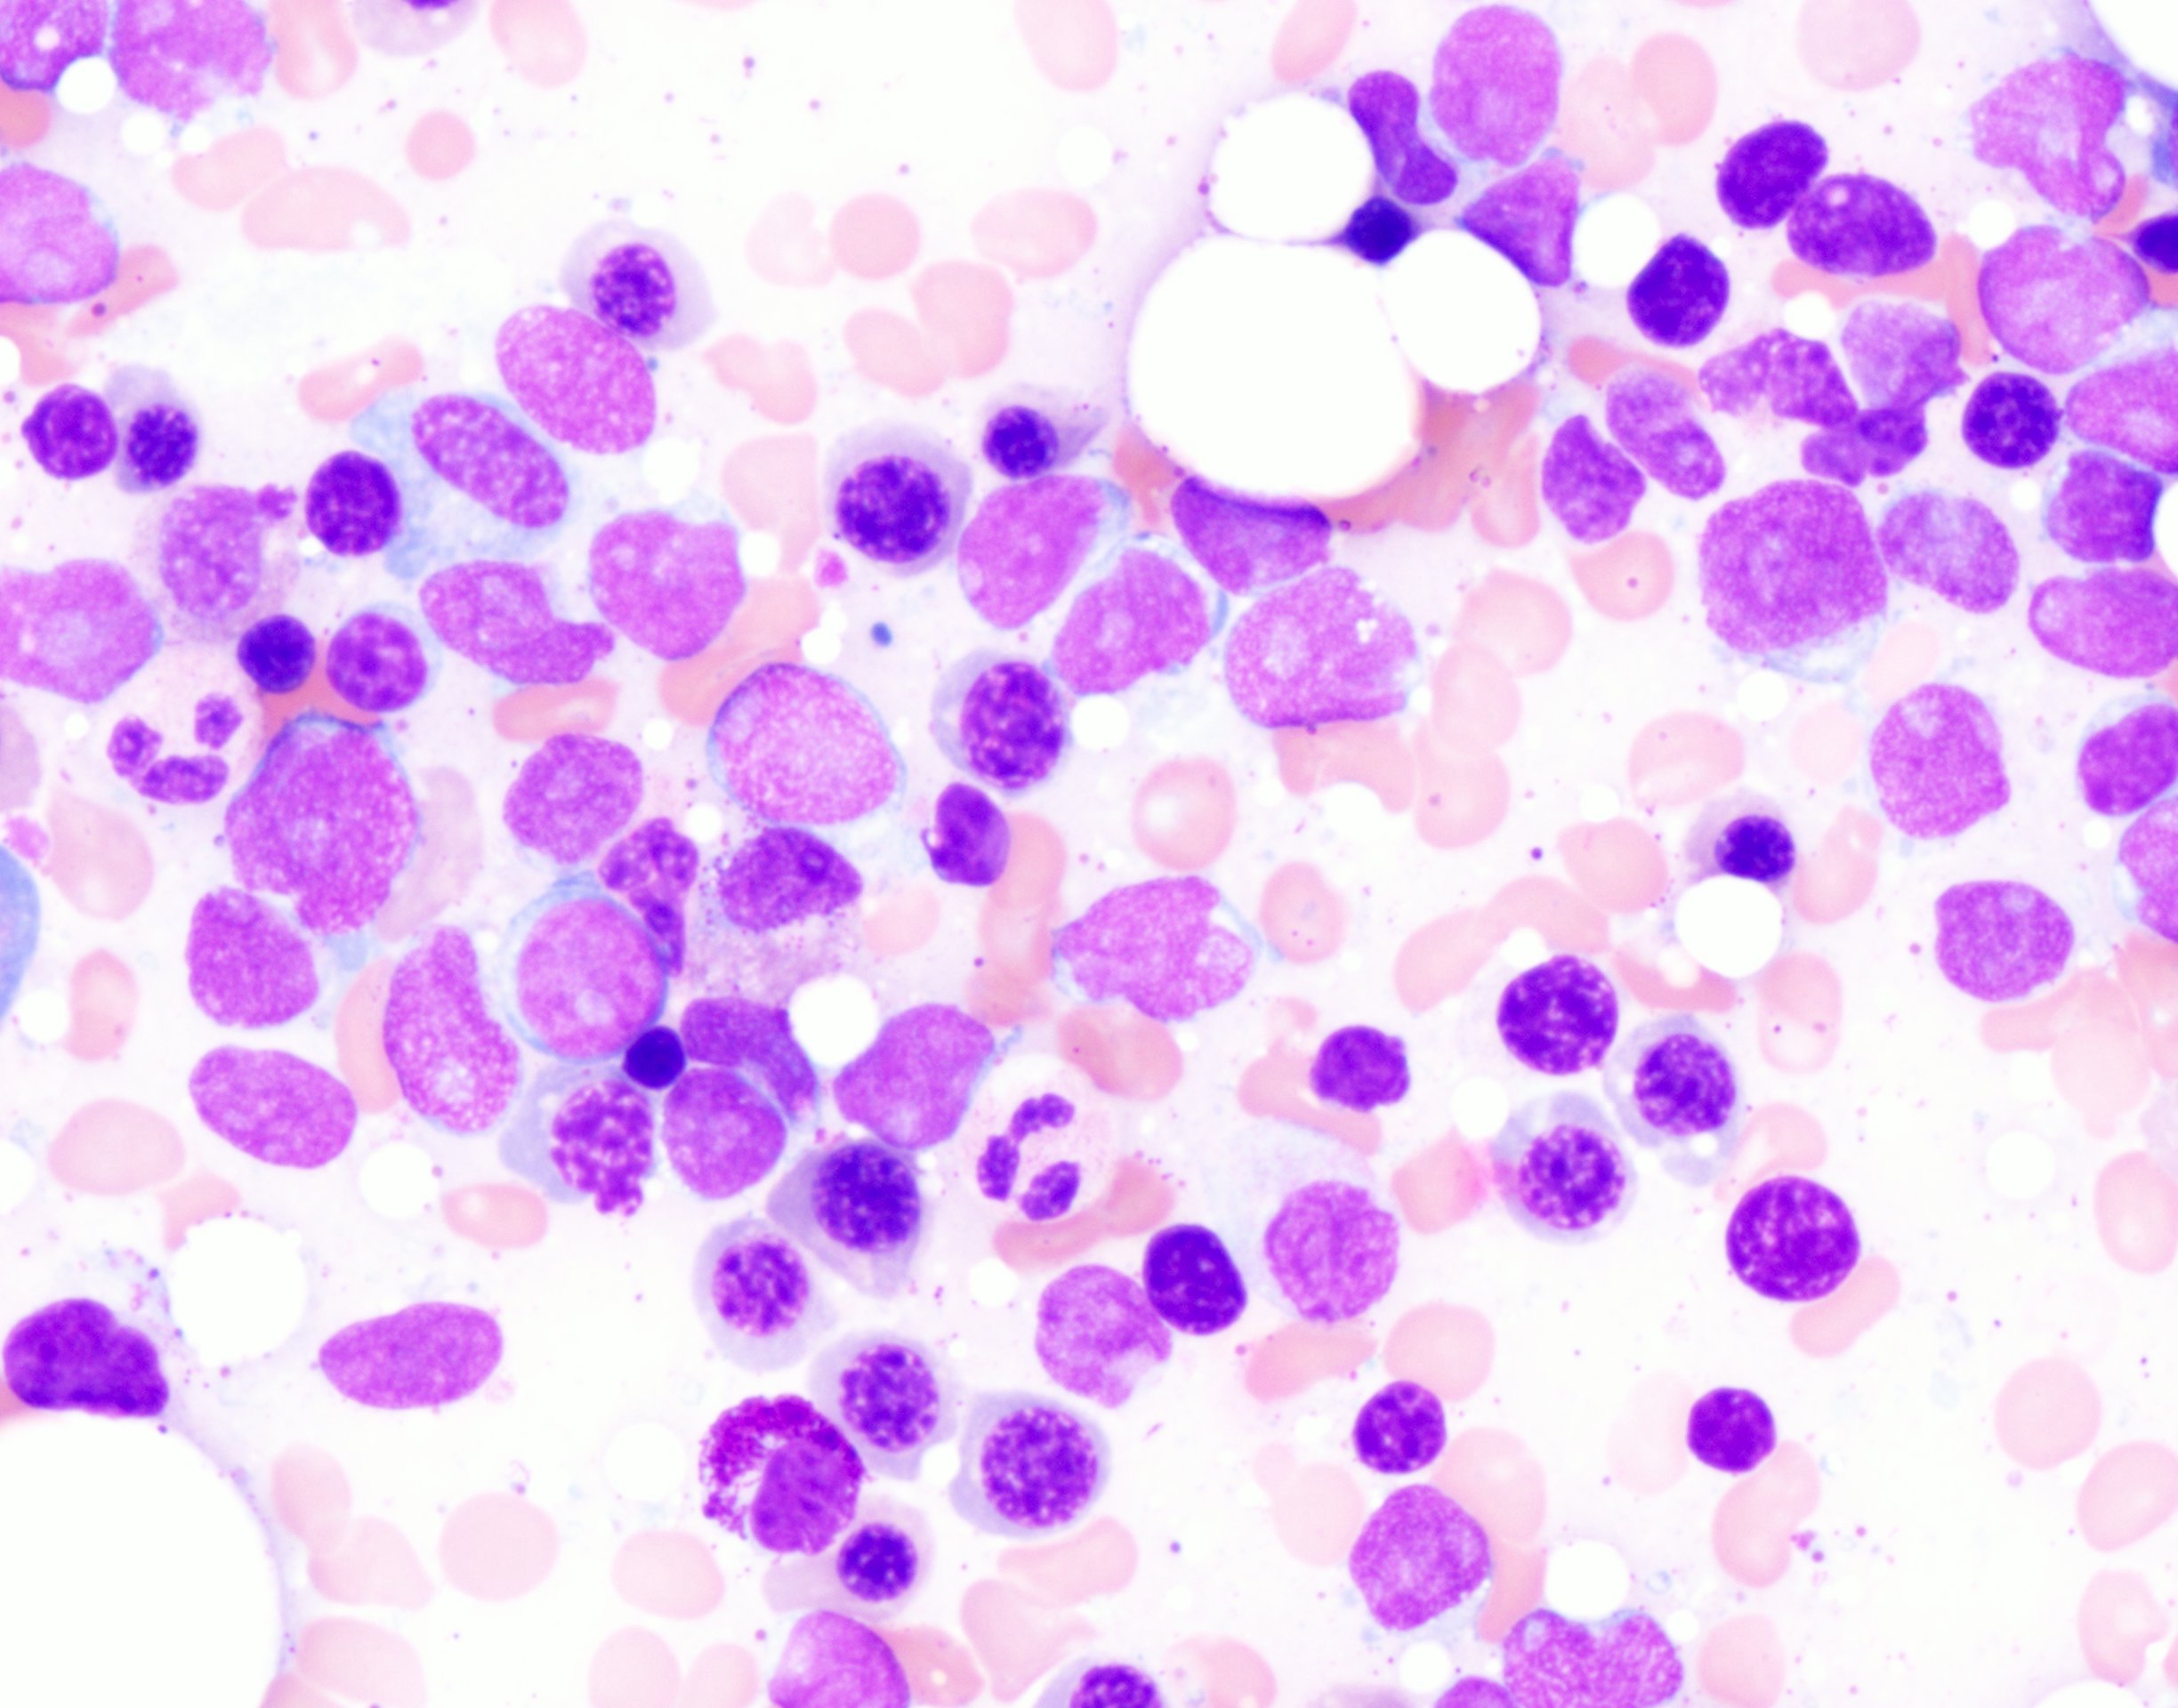
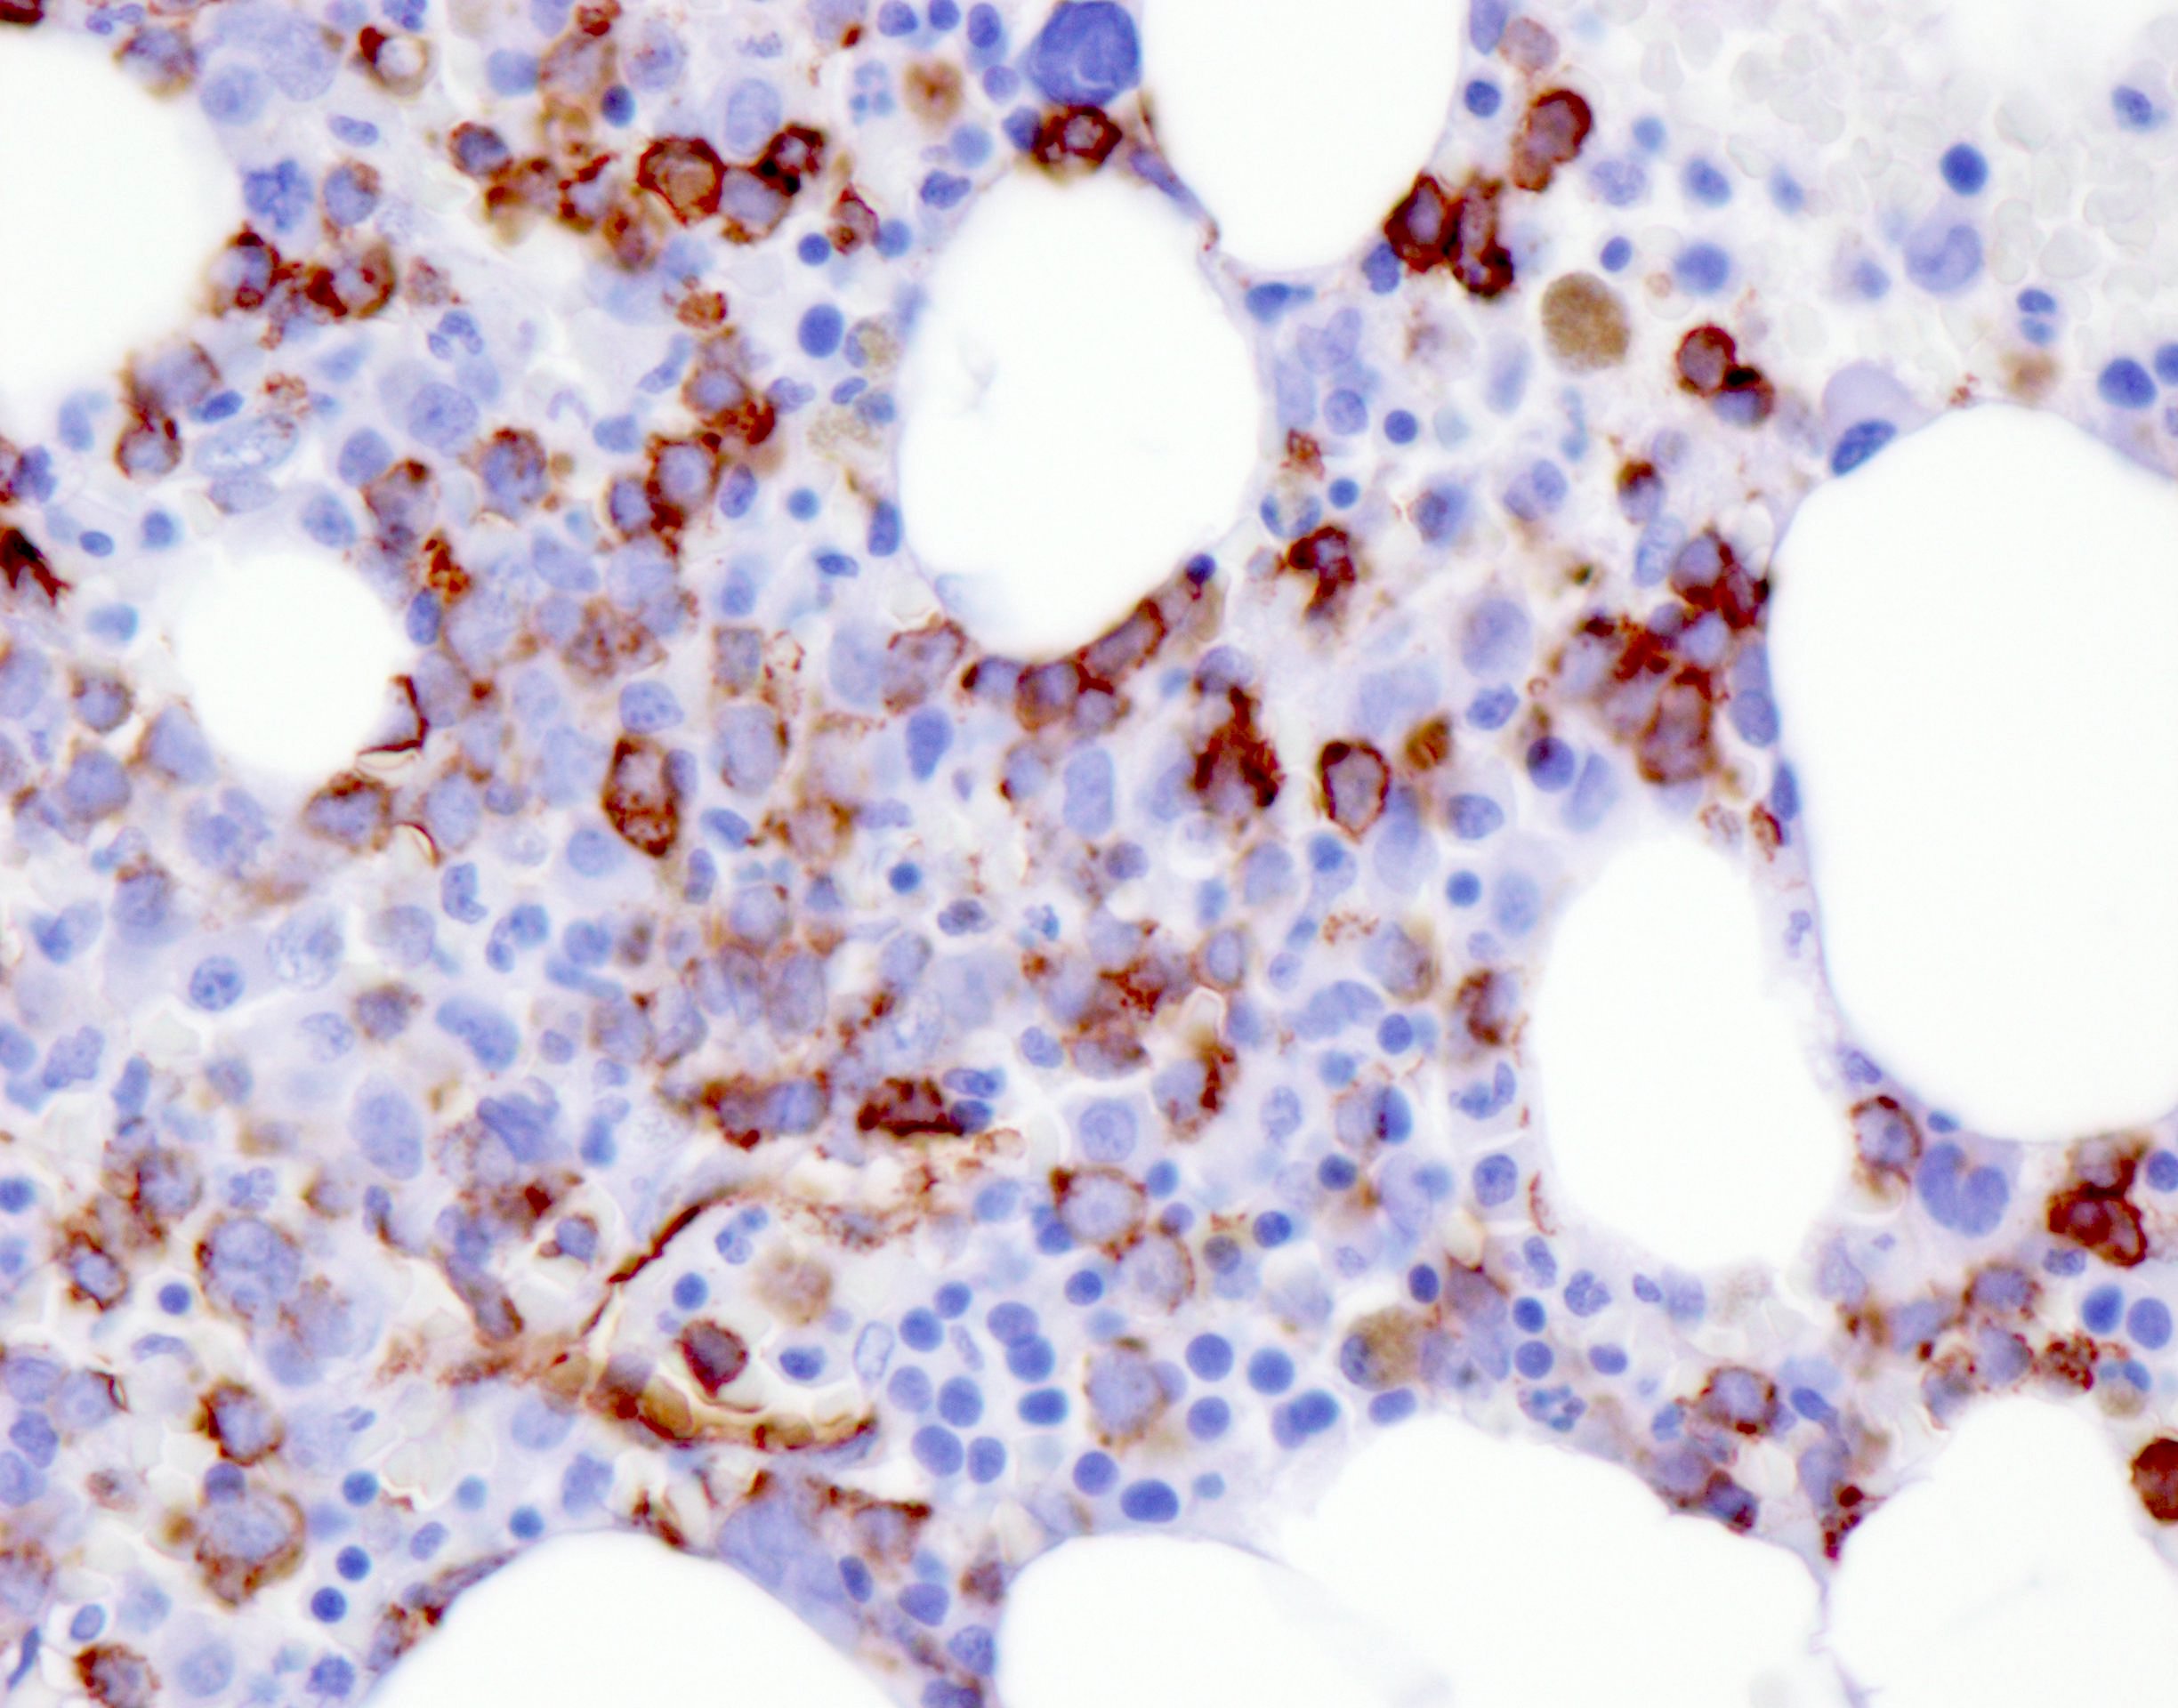
Bone marrow biopsy
Bone marrow aspirate smear
Contributed by Yang Shi, M.D., Ph.D.
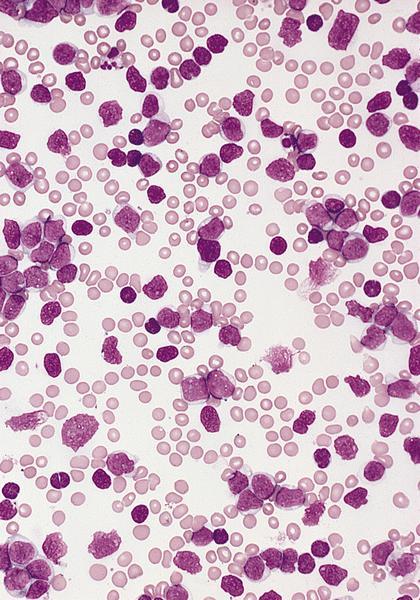
Chronic phase blood smear
Contributed by Yang Shi, M.D., Ph.D.
Peripheral blood chronic phase
Contributed by K.H. Ramesh, Ph.D.
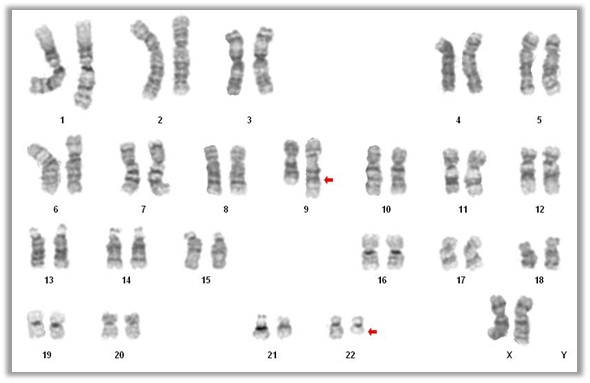
Conventional cytogenetics chronic myeloid leukemia
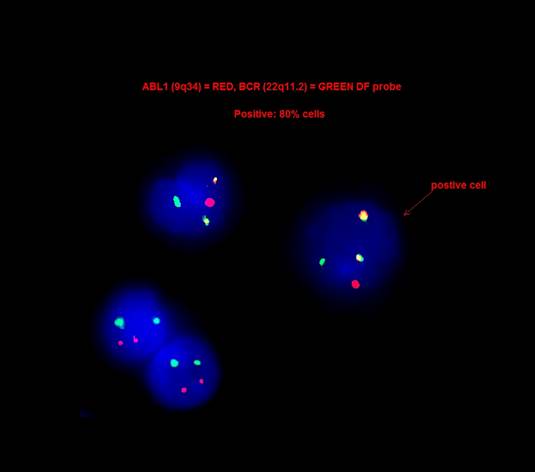
BCR-ABL+ chronic myeloid leukemia FISH
Brief introduction of chronic myeloid leukemia
Chronic myeloid leukemia: pathogenesis, symptoms and treatment
Blast crisis in chronic myeloid leukemia
Chronic myeloid leukemia from Khan Academy
Treatment of chronic myeloid leukemia
Peripheral blood smear of chronic myeloid leukemia
Contributed by Sanam Loghavi, M.D.
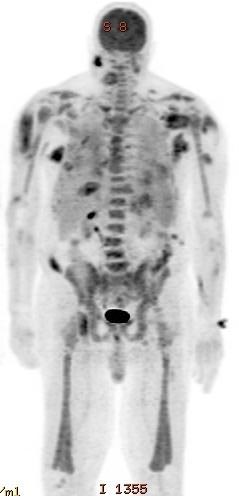
FDG PET / CT
Contributed by Michael Tetzlaff, M.D., Ph.D.
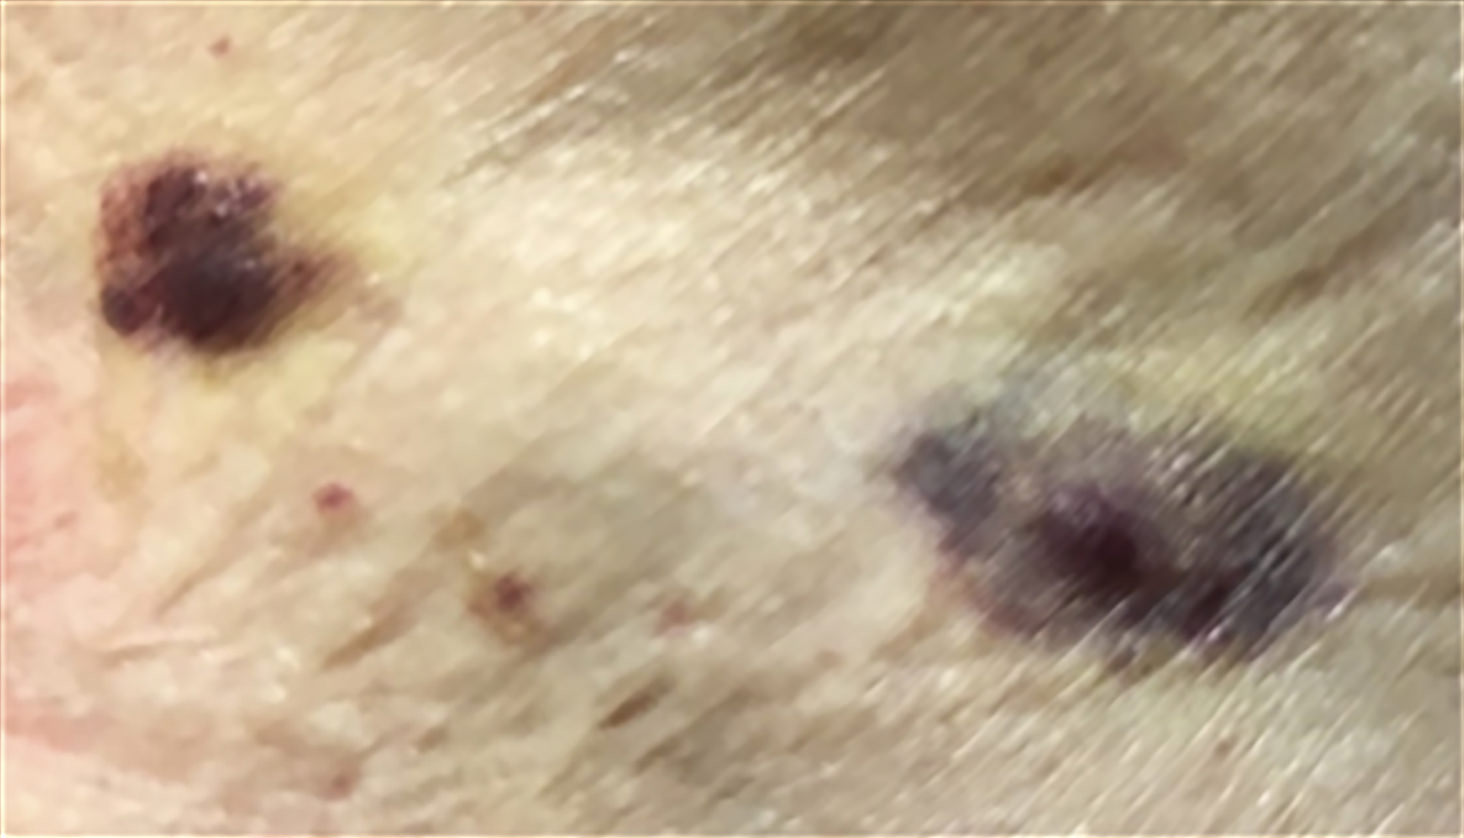
Hemorrhagic papules
Contributed by Sanam Loghavi, M.D.

Deep dermis
Bone marrow
Myelomonocytic hyperplasia in bone marrow

Monocytosis and morphologic dysplasia
Morphologic dysplasia
Contributed by Jingwei Li, M.D., Ph.D., Vignesh Shanmugam, M.D. and Roberto N. Miranda, M.D.

Hypercellular bone marrow with myeloid predominance
Increased neutrophilic granulocytes
Toxic granulation and Döhle bodies

Myeloid cells
Contributed by Jingwei Li, M.D., Ph.D., Vignesh Shanmugam, M.D. and Roberto N. Miranda, M.D.
Neutrophilic leukocytosis
Toxic granulation and Döhle bodies
Leukocytosis
Contributed by Maria M. Picken, M.D., Ph.D.
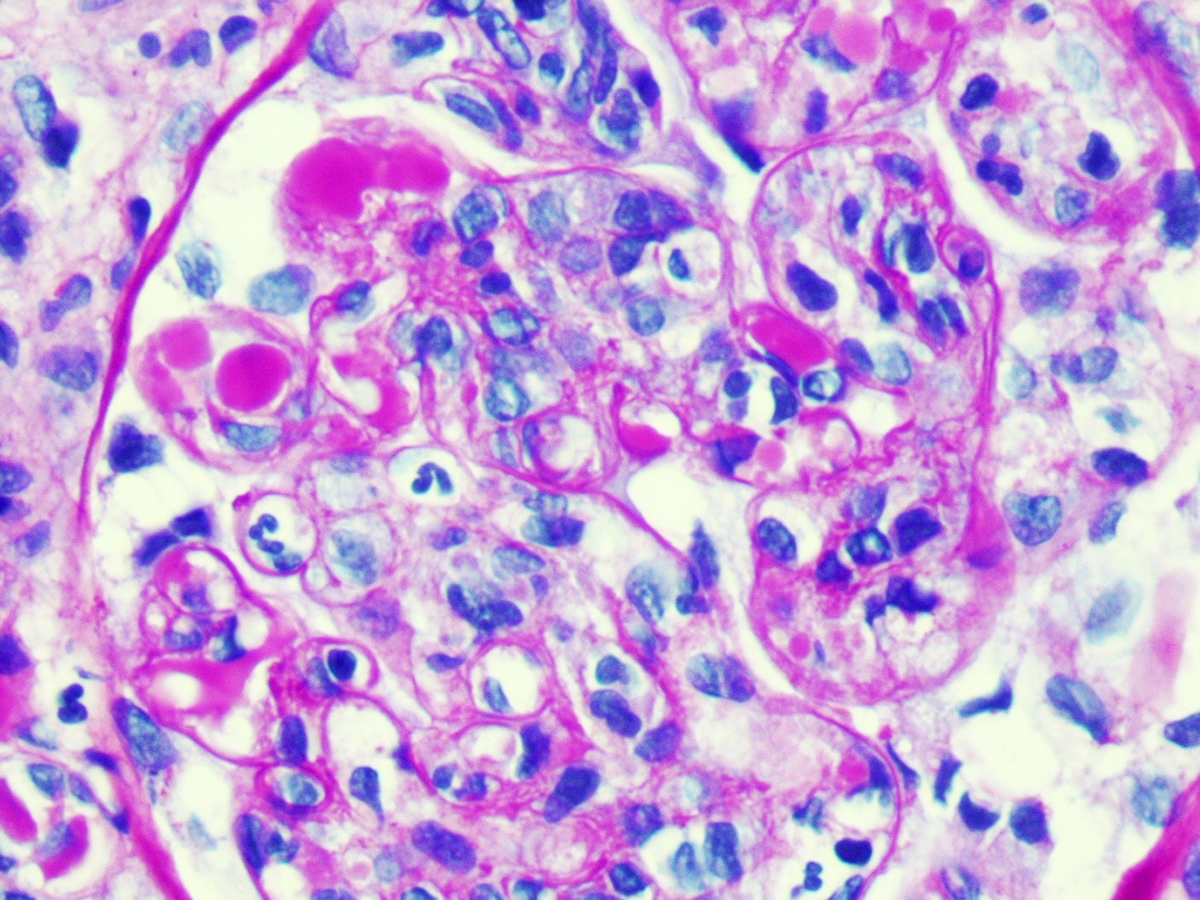
Cryoglobulinemic nephropathy
Contributed by Anas Nasir, M.Sc.

Circulating cryoglobulins
Managing HCV cryoglobulinemia
Cryoglobulinemia and vasculitis
Cryoglobulinemia, lymphoproliferation and hepatitis C
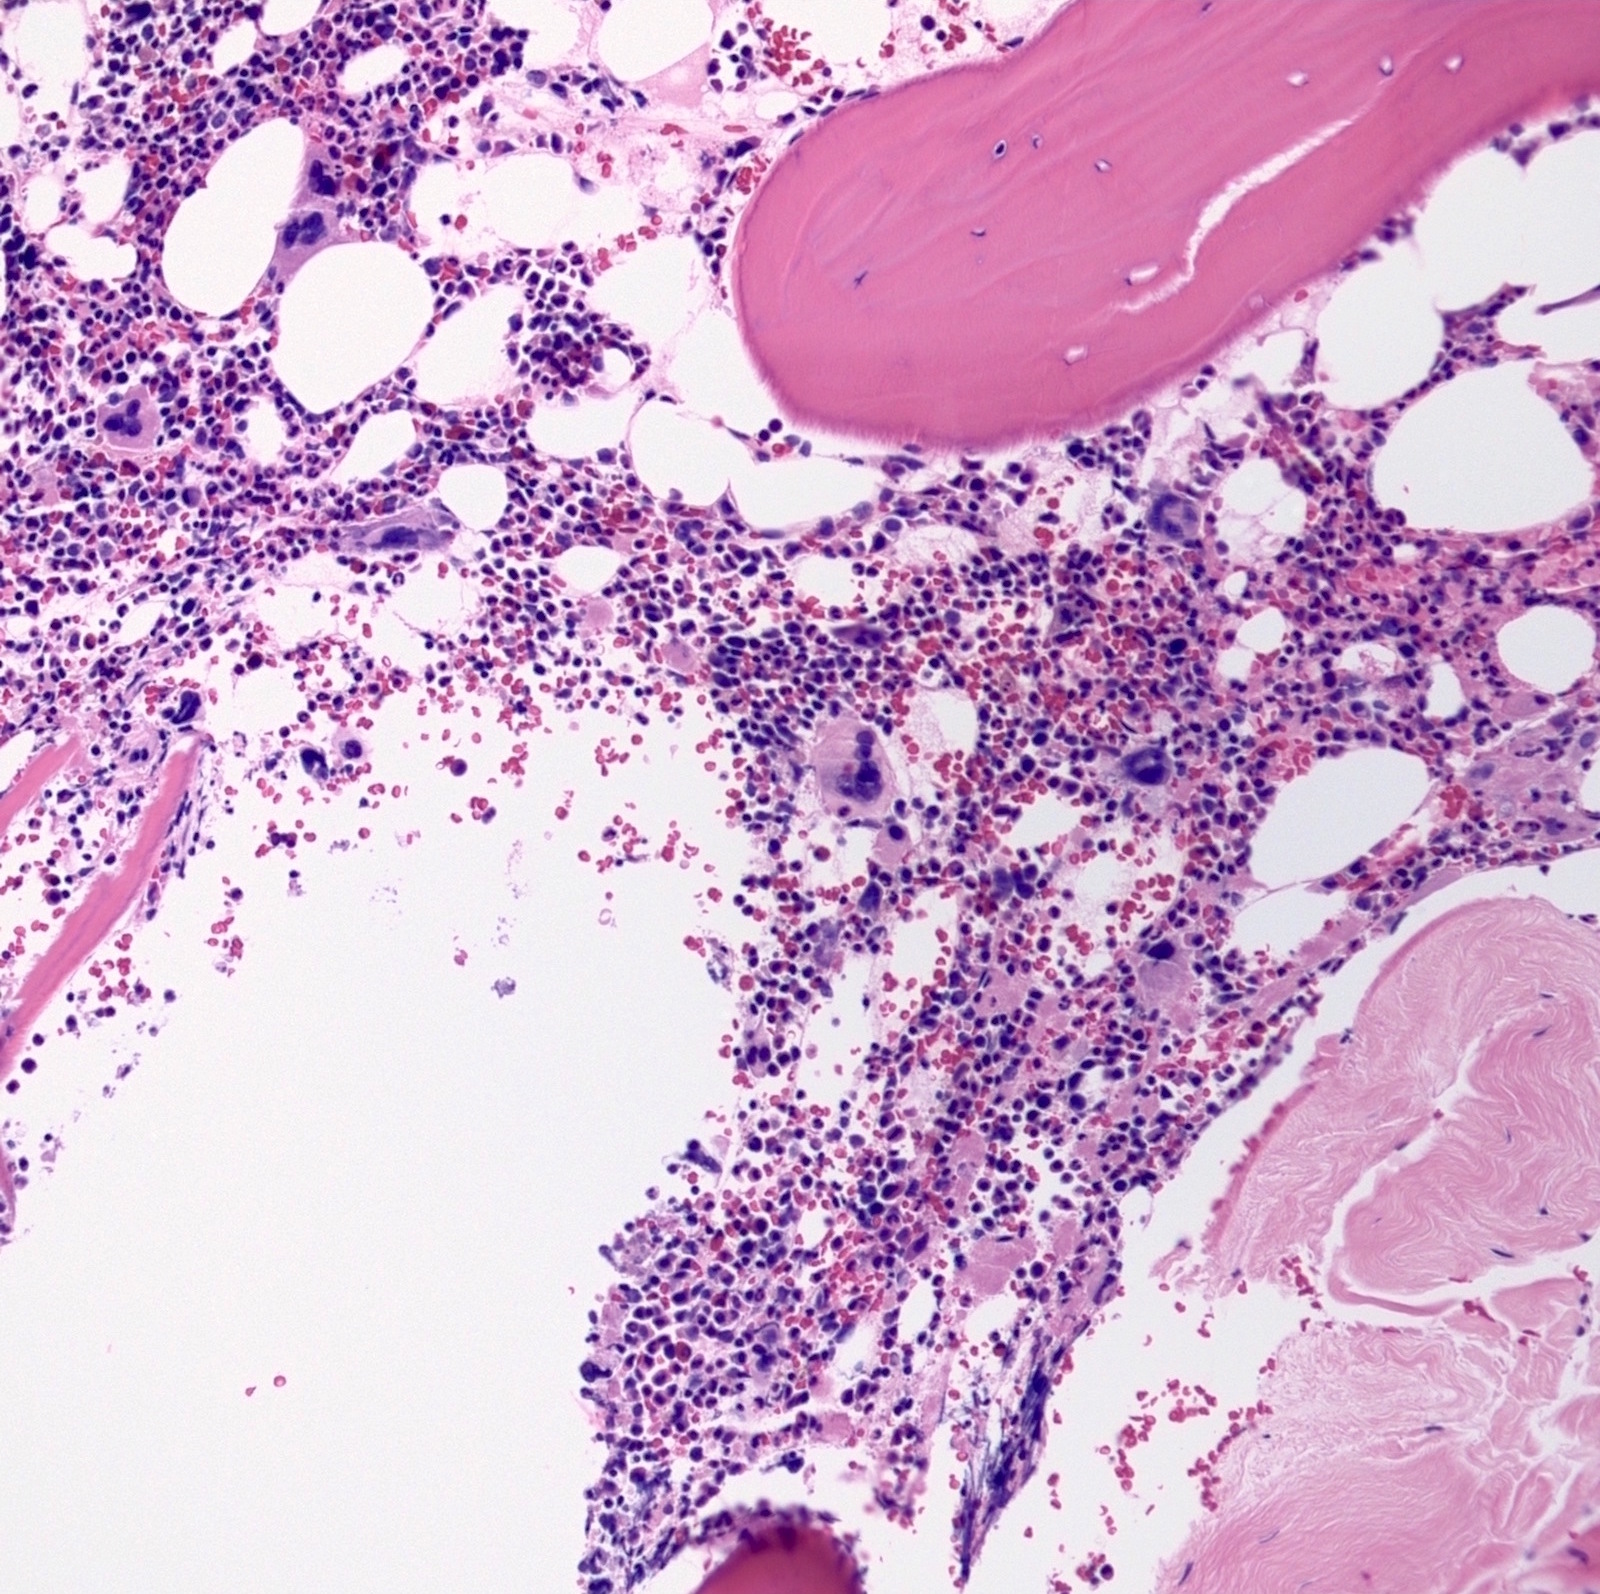
Contributed by Kamran M. Mirza, M.D., Ph.D. and Yazan Alhalaseh, M.D.
Hypercellular bone marrow core biopsy
Hypercellular bone marrow clot section
Hypercellular bone marrow
CD3 IHC
CD34 IHC
Contributed by Kamran M. Mirza, M.D., Ph.D. and Yazan Alhalaseh, M.D.
Atypical circulating blasts
Contributed by Kamran M. Mirza, M.D., Ph.D. and Yazan Alhalaseh, M.D.
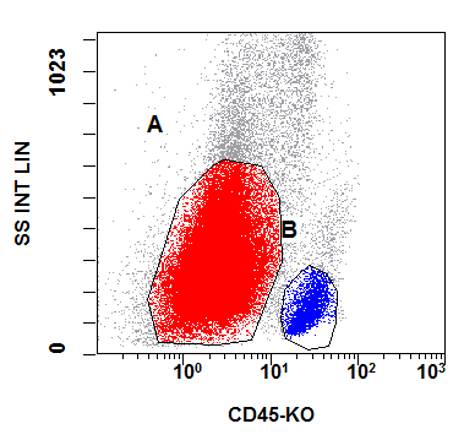
Side scatter versus CD45 panel
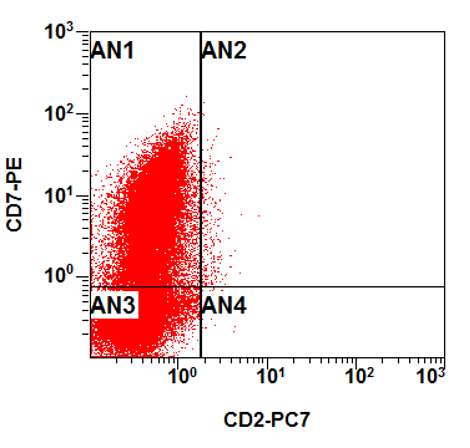
CD7 versus CD2 panel
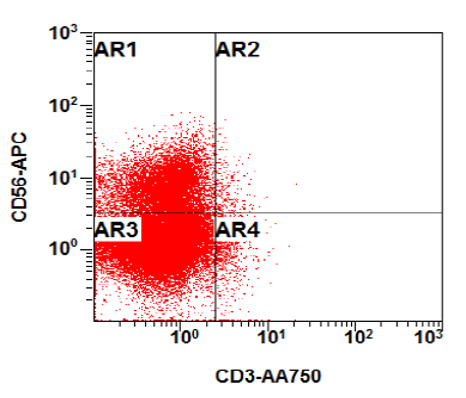
CD56 versus CD3 panel
ETP ALL case
Contributed by Hatem Kaseb, M.D., Ph.D., M.P.H.
Bone marrow biopsy with atypical megakaryocytes
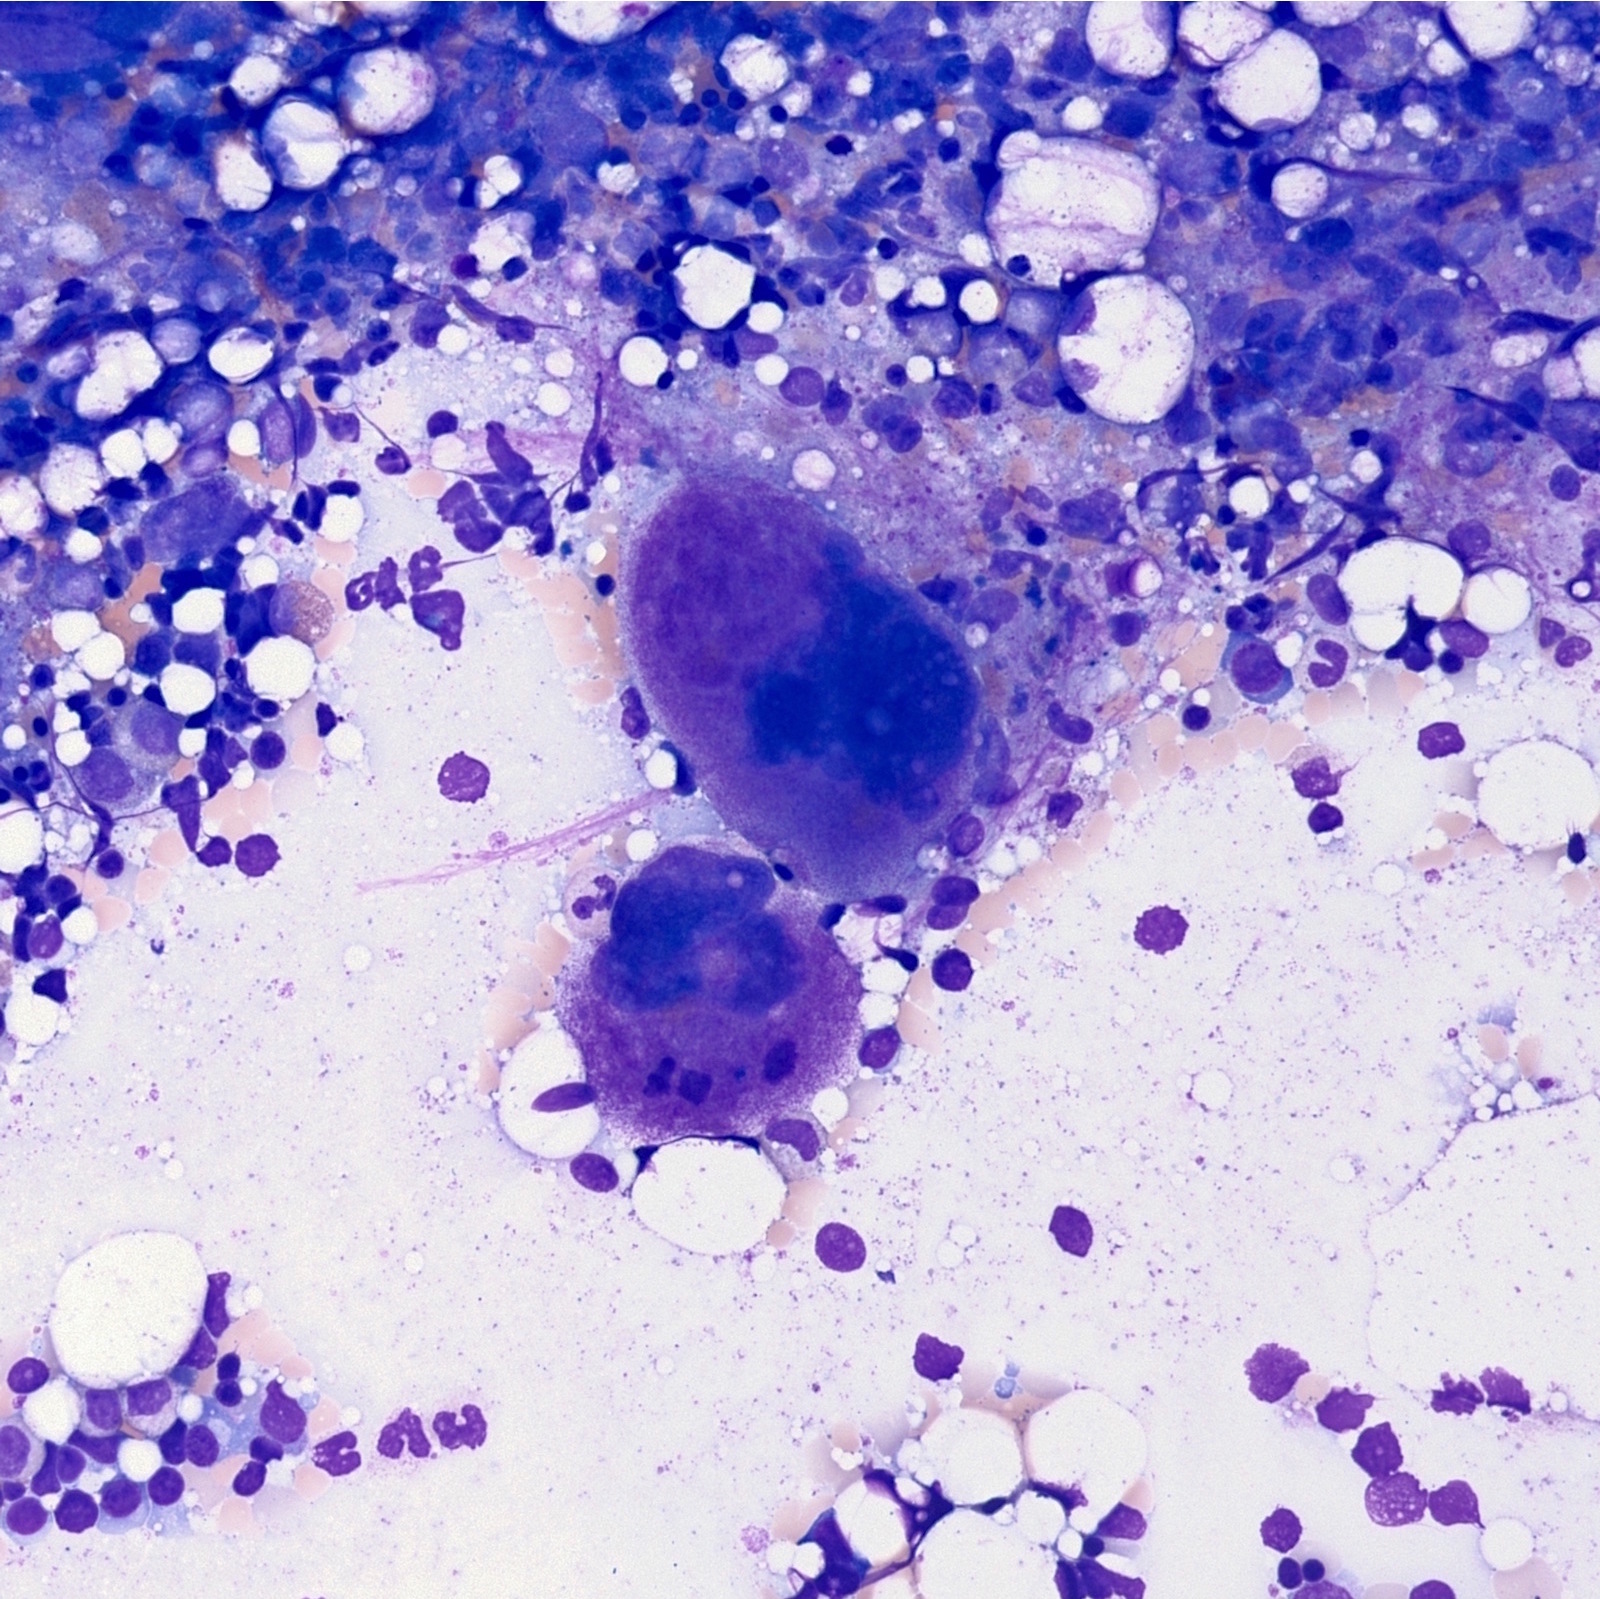
Bone marrow aspirate with atypical megakaryocytes
Contributed by Hatem Kaseb, M.D., Ph.D., M.P.H.
Anisocytosis and bizarre forms
Contributed by Hatem Kaseb, M.D., Ph.D., M.P.H.
No myelodysplasia
Cytogenetics and molecular genetics reported in myeloid / lymphoid neoplasms with FGFR1 rearrangement
| t(8;13)(p11.2;q12.1) | ZMYM2-FGFR1, previously ZNF198-FGFR1 |
| t(8;9)(p11.2;q33.2) | CNTRL-FGFR1, previously CEP110-FGFR1 |
| t(6;8)(q27;p11.2) | FGFR10P-FGFR1 |
| t(8;22)(p11.2;q11.2) | BCR-FGFR1 |
| t(7;8)(q33;p11.2) | TRIM24-FGFR1 |
| t(8;17)(p11.2;q11.2) | MY018A-FGFR1 |
| t(8;19)(p11.2;q13.3) | HERVK-FGFR1 |
| ins(12;8)(p11.2;p11.2;p22) | FGFR10P2-FGFR1 |
| t(1;8)(q31.1;p11.2) | TPR-FGFR1 |
| t(2;8)(q13;p11.2) | RANBP2-FGFR1 |
| t(2;8)(q37.3;p11.2) | LRRFIP1-FGFR1 |
| t(7;8)(q22.1;p11.2) | CUX1-FGFR1 |
| t(8;12)(p11.2;q15) | CPSF6-FGFR1 |
- FGFR1 rearrangement has also been found in association with t(8;12)(p11.2;q15) and t(8;17)(p11.2;q25) but suspected involvement of FGFR1 in t(8;11)(p11.1-p11.2;p15) was not confirmed
- Additional cytogenetic abnormalities have been reported, of which trisomy 21 is the most common secondary chromosomal abnormality
Contributed by Ling Zhang, M.D.

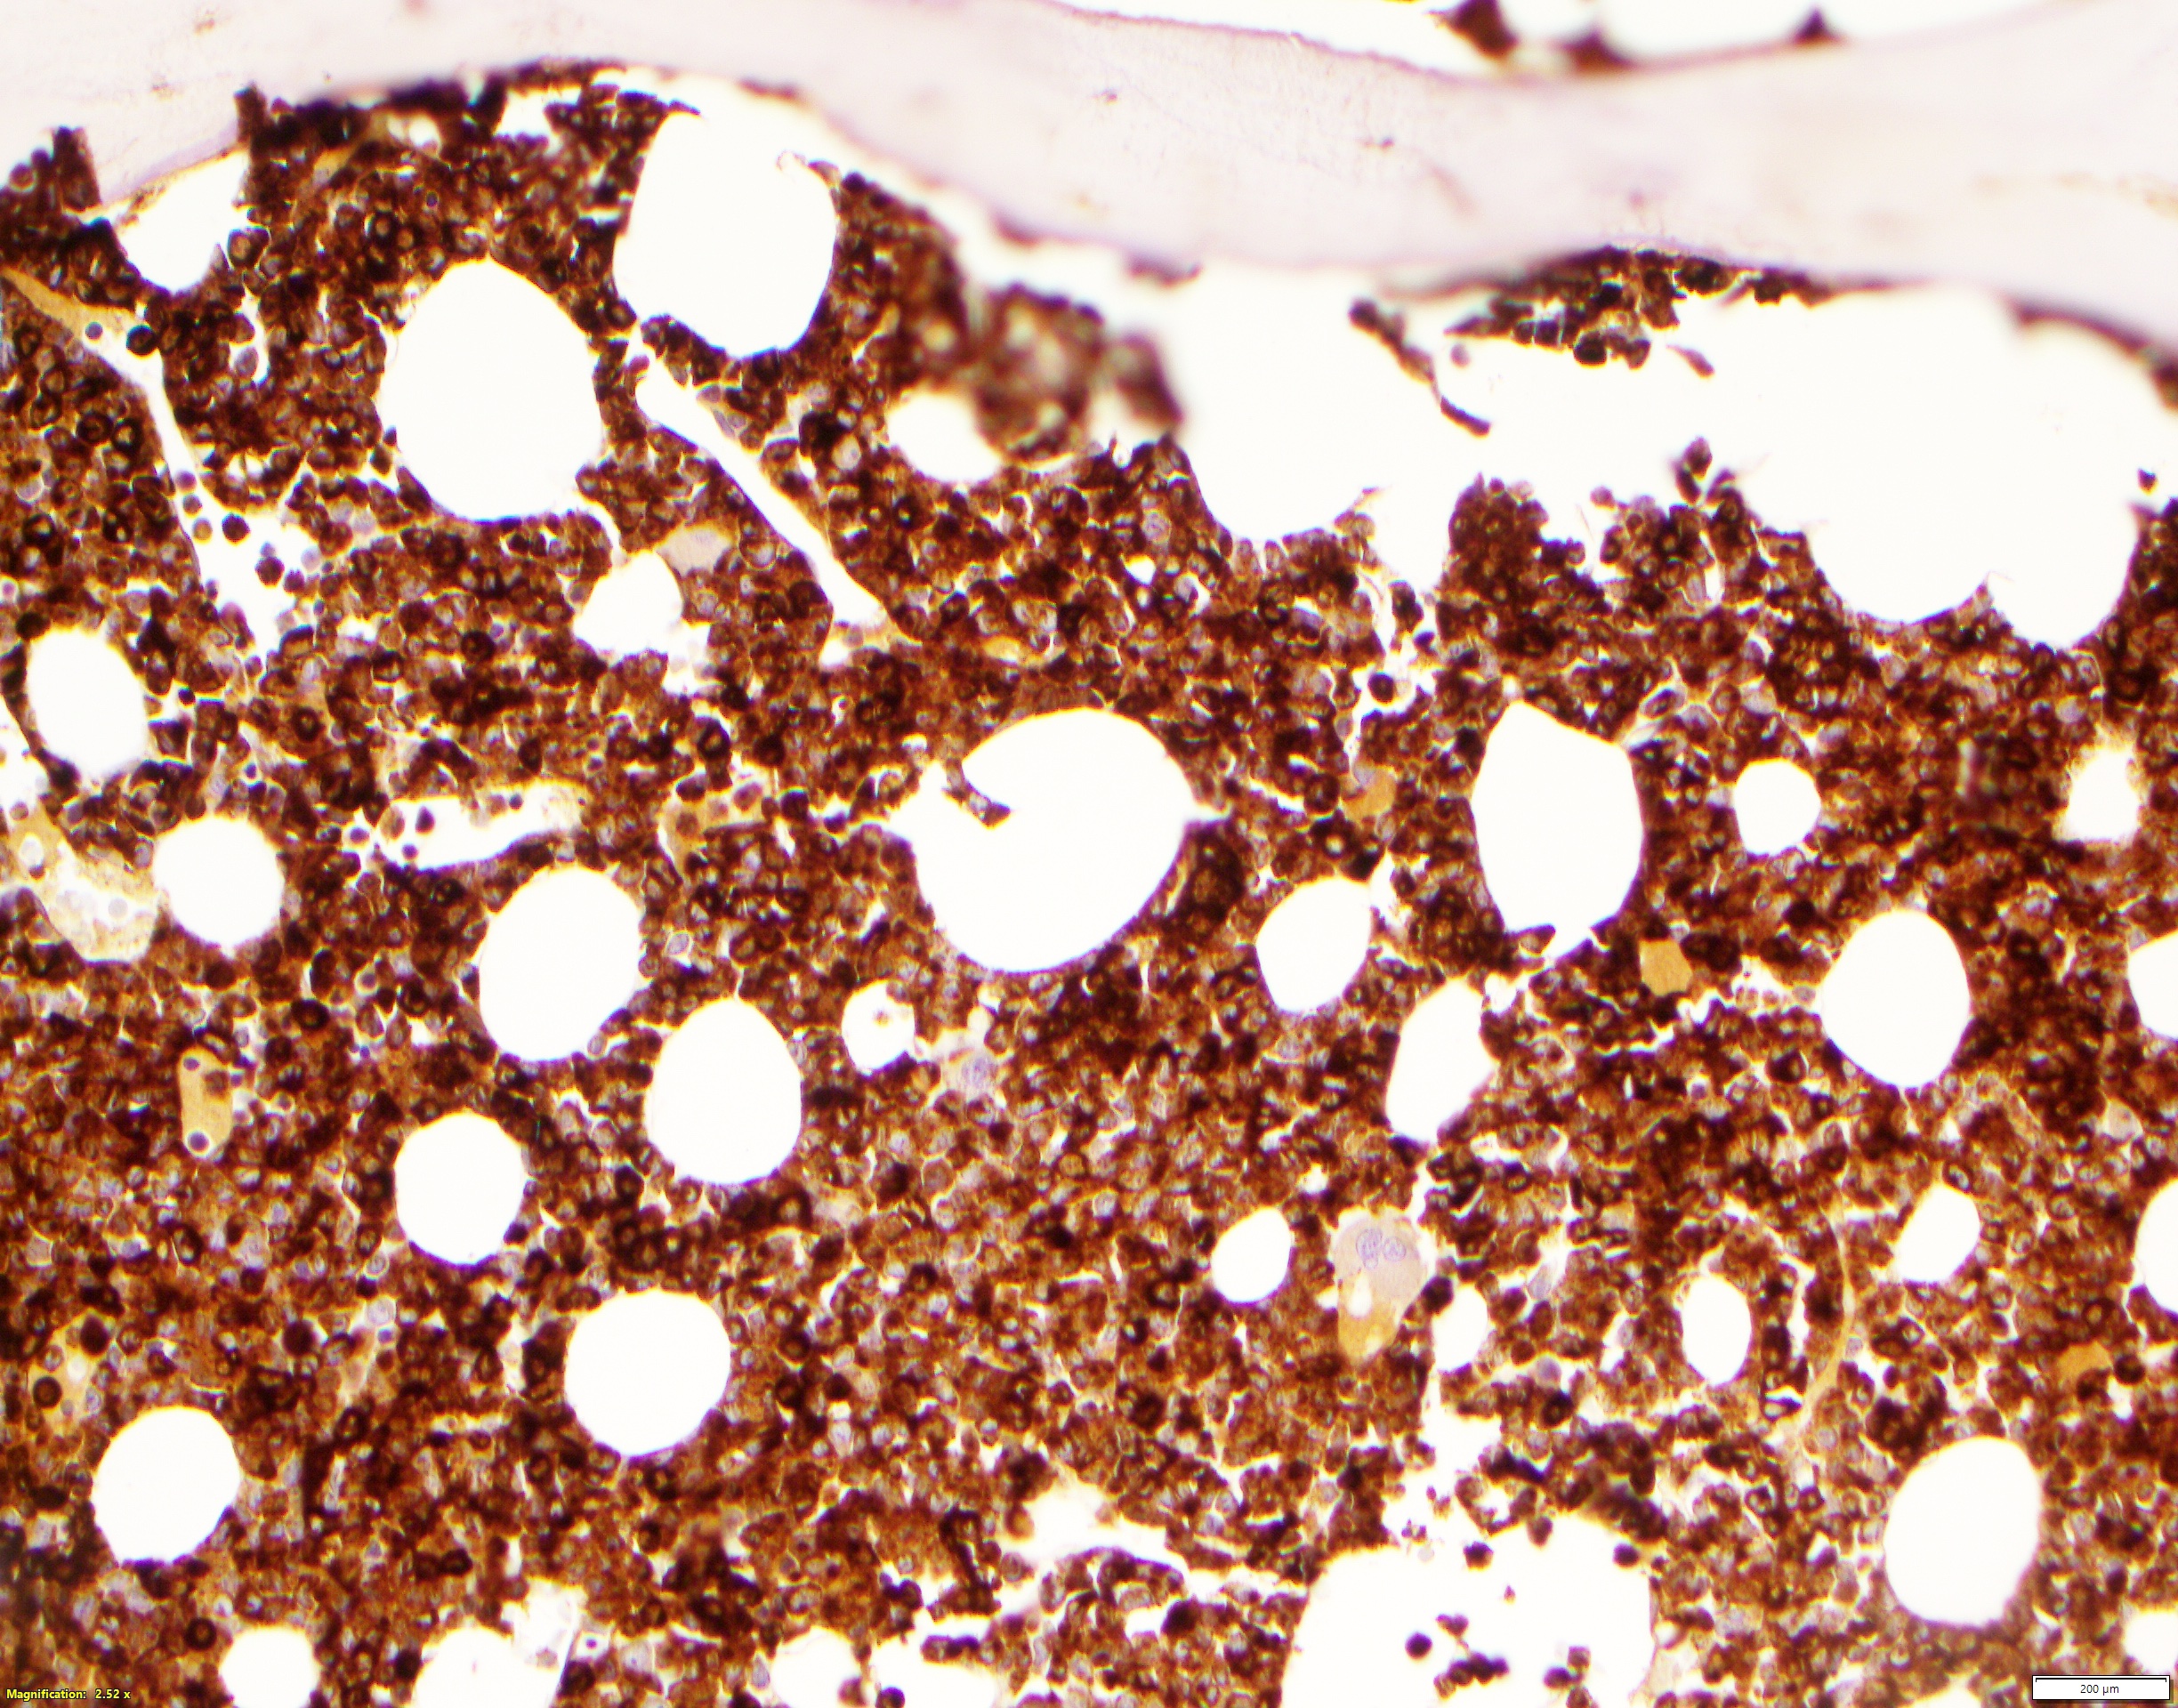
AML with FGFR1 rearrangement
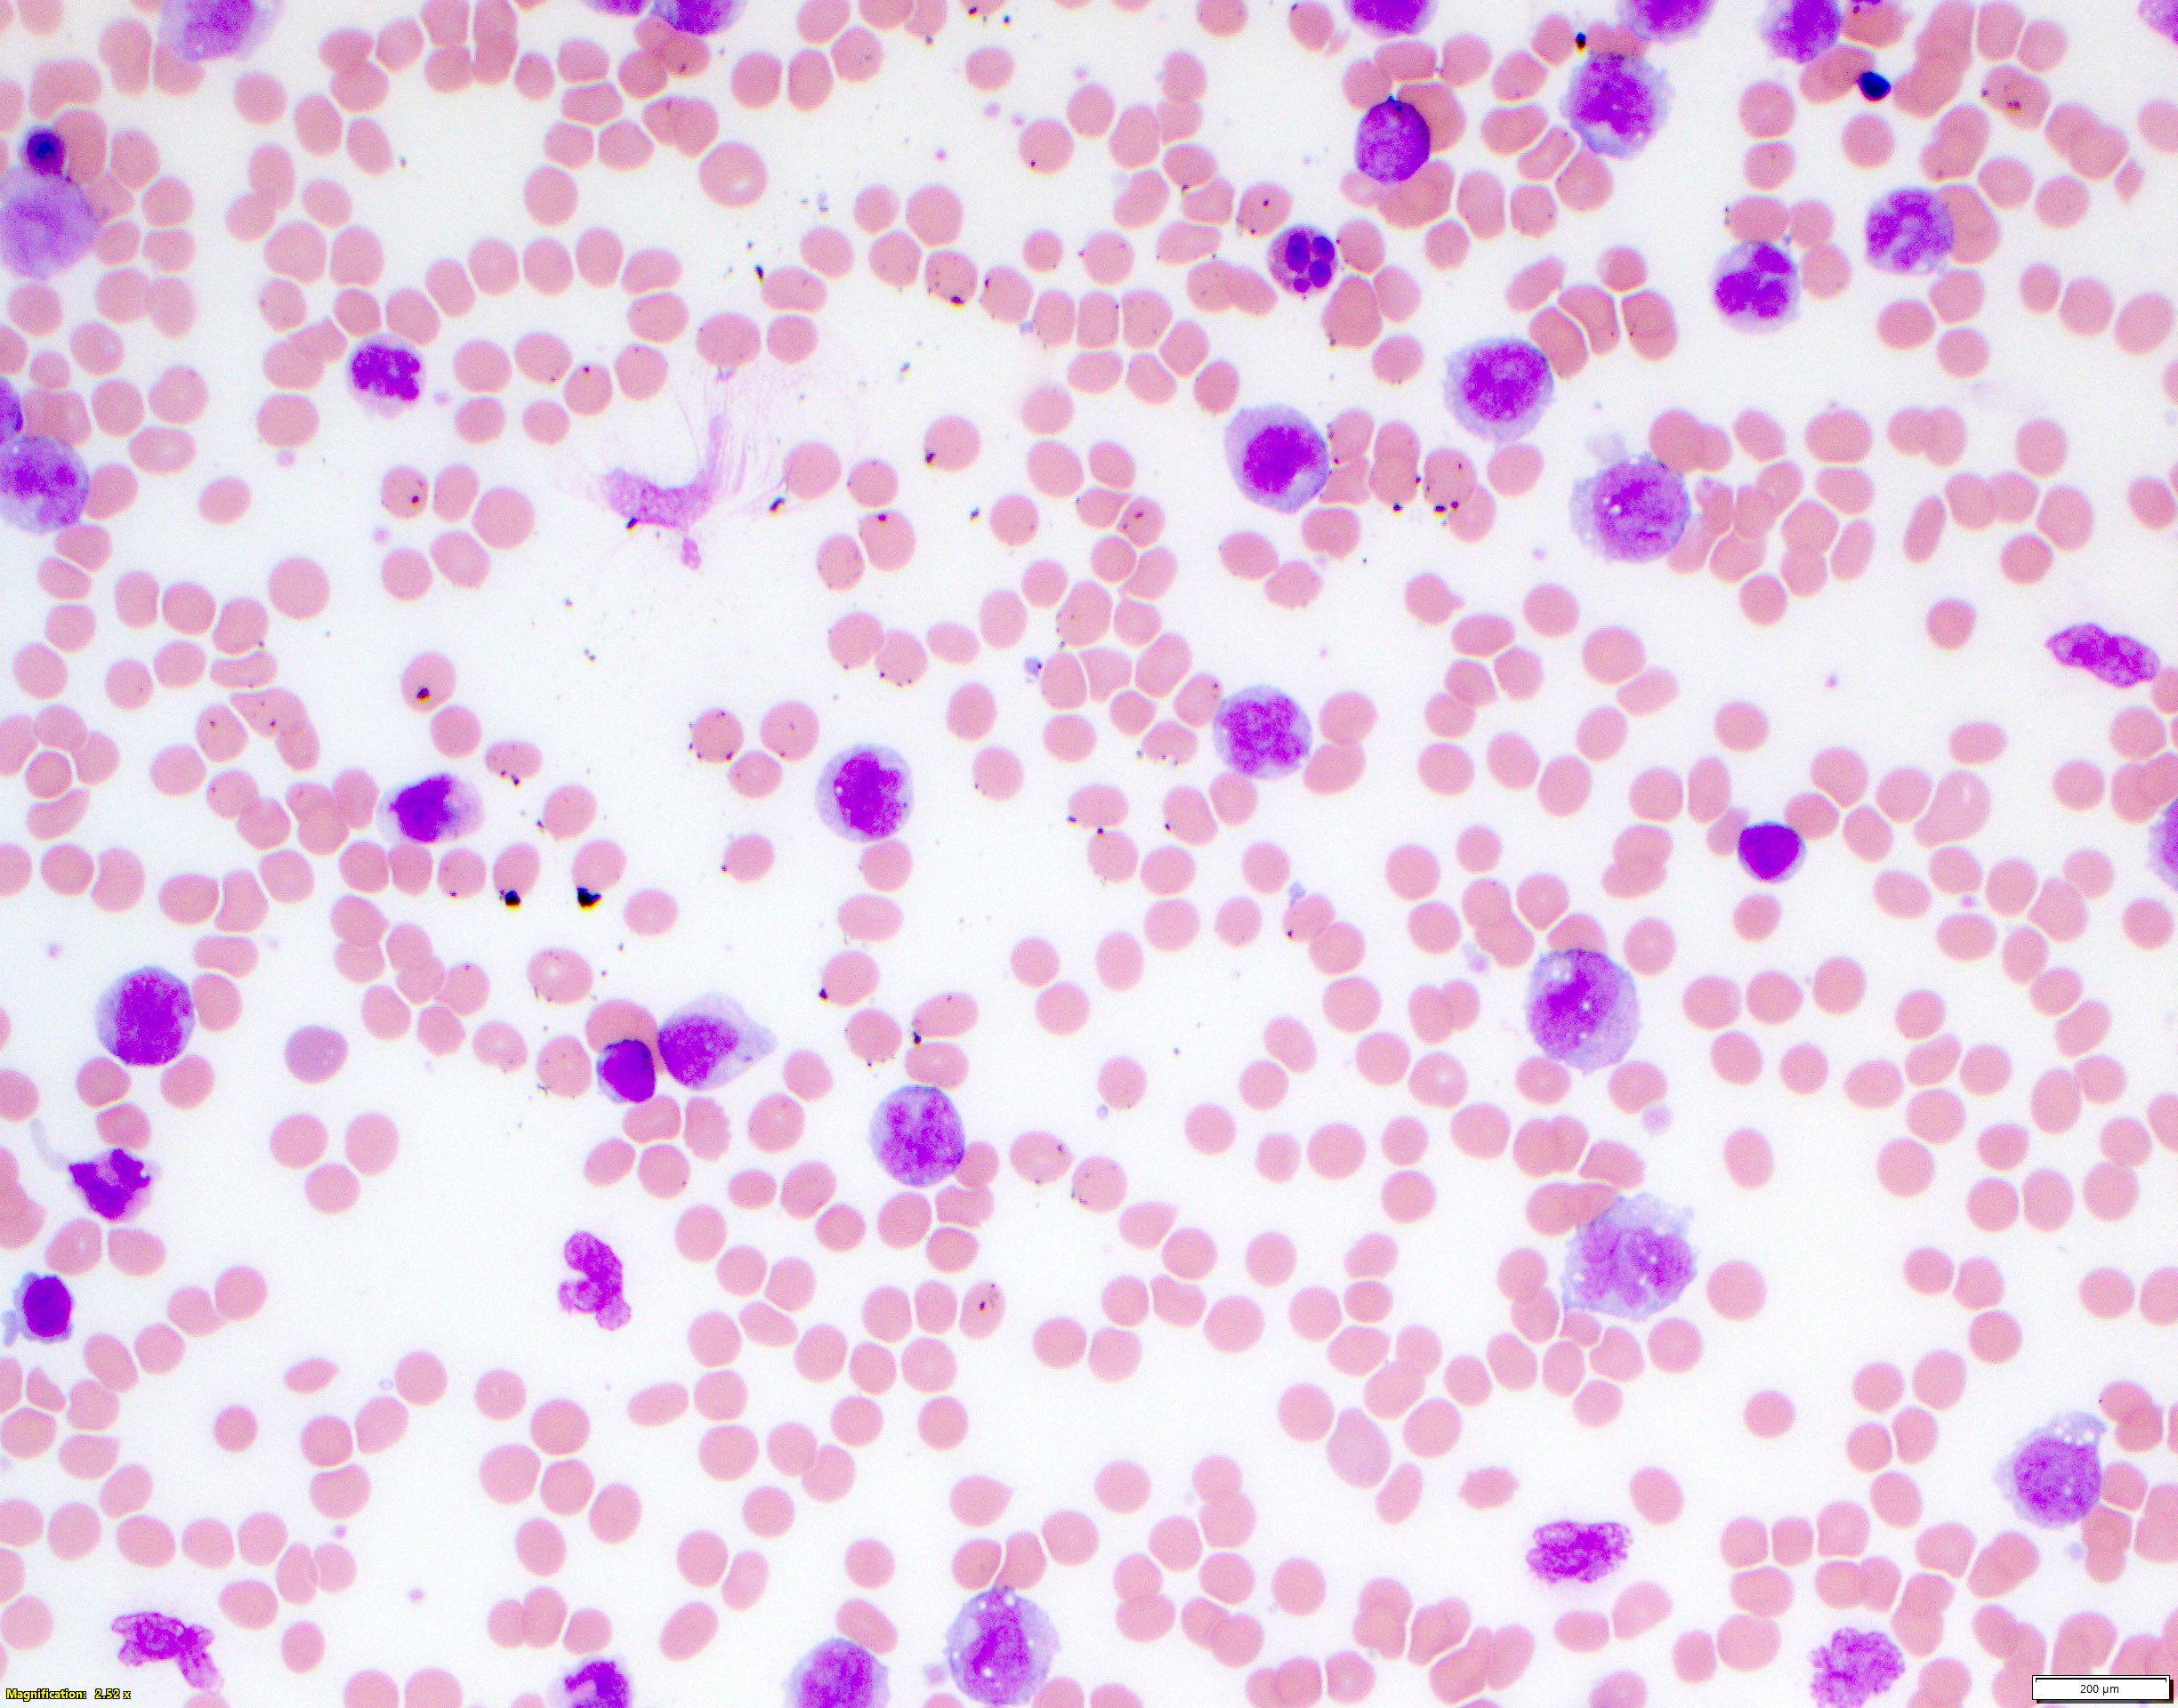
B-ALL with FGFR1 rearrangement

AML with FGFR1 rearrangement
B-ALL with FGFR1 rearrangement
Reticulin stain
TdT positive stain
CD34 positive stain
Contributed by Ling Zhang, M.D.
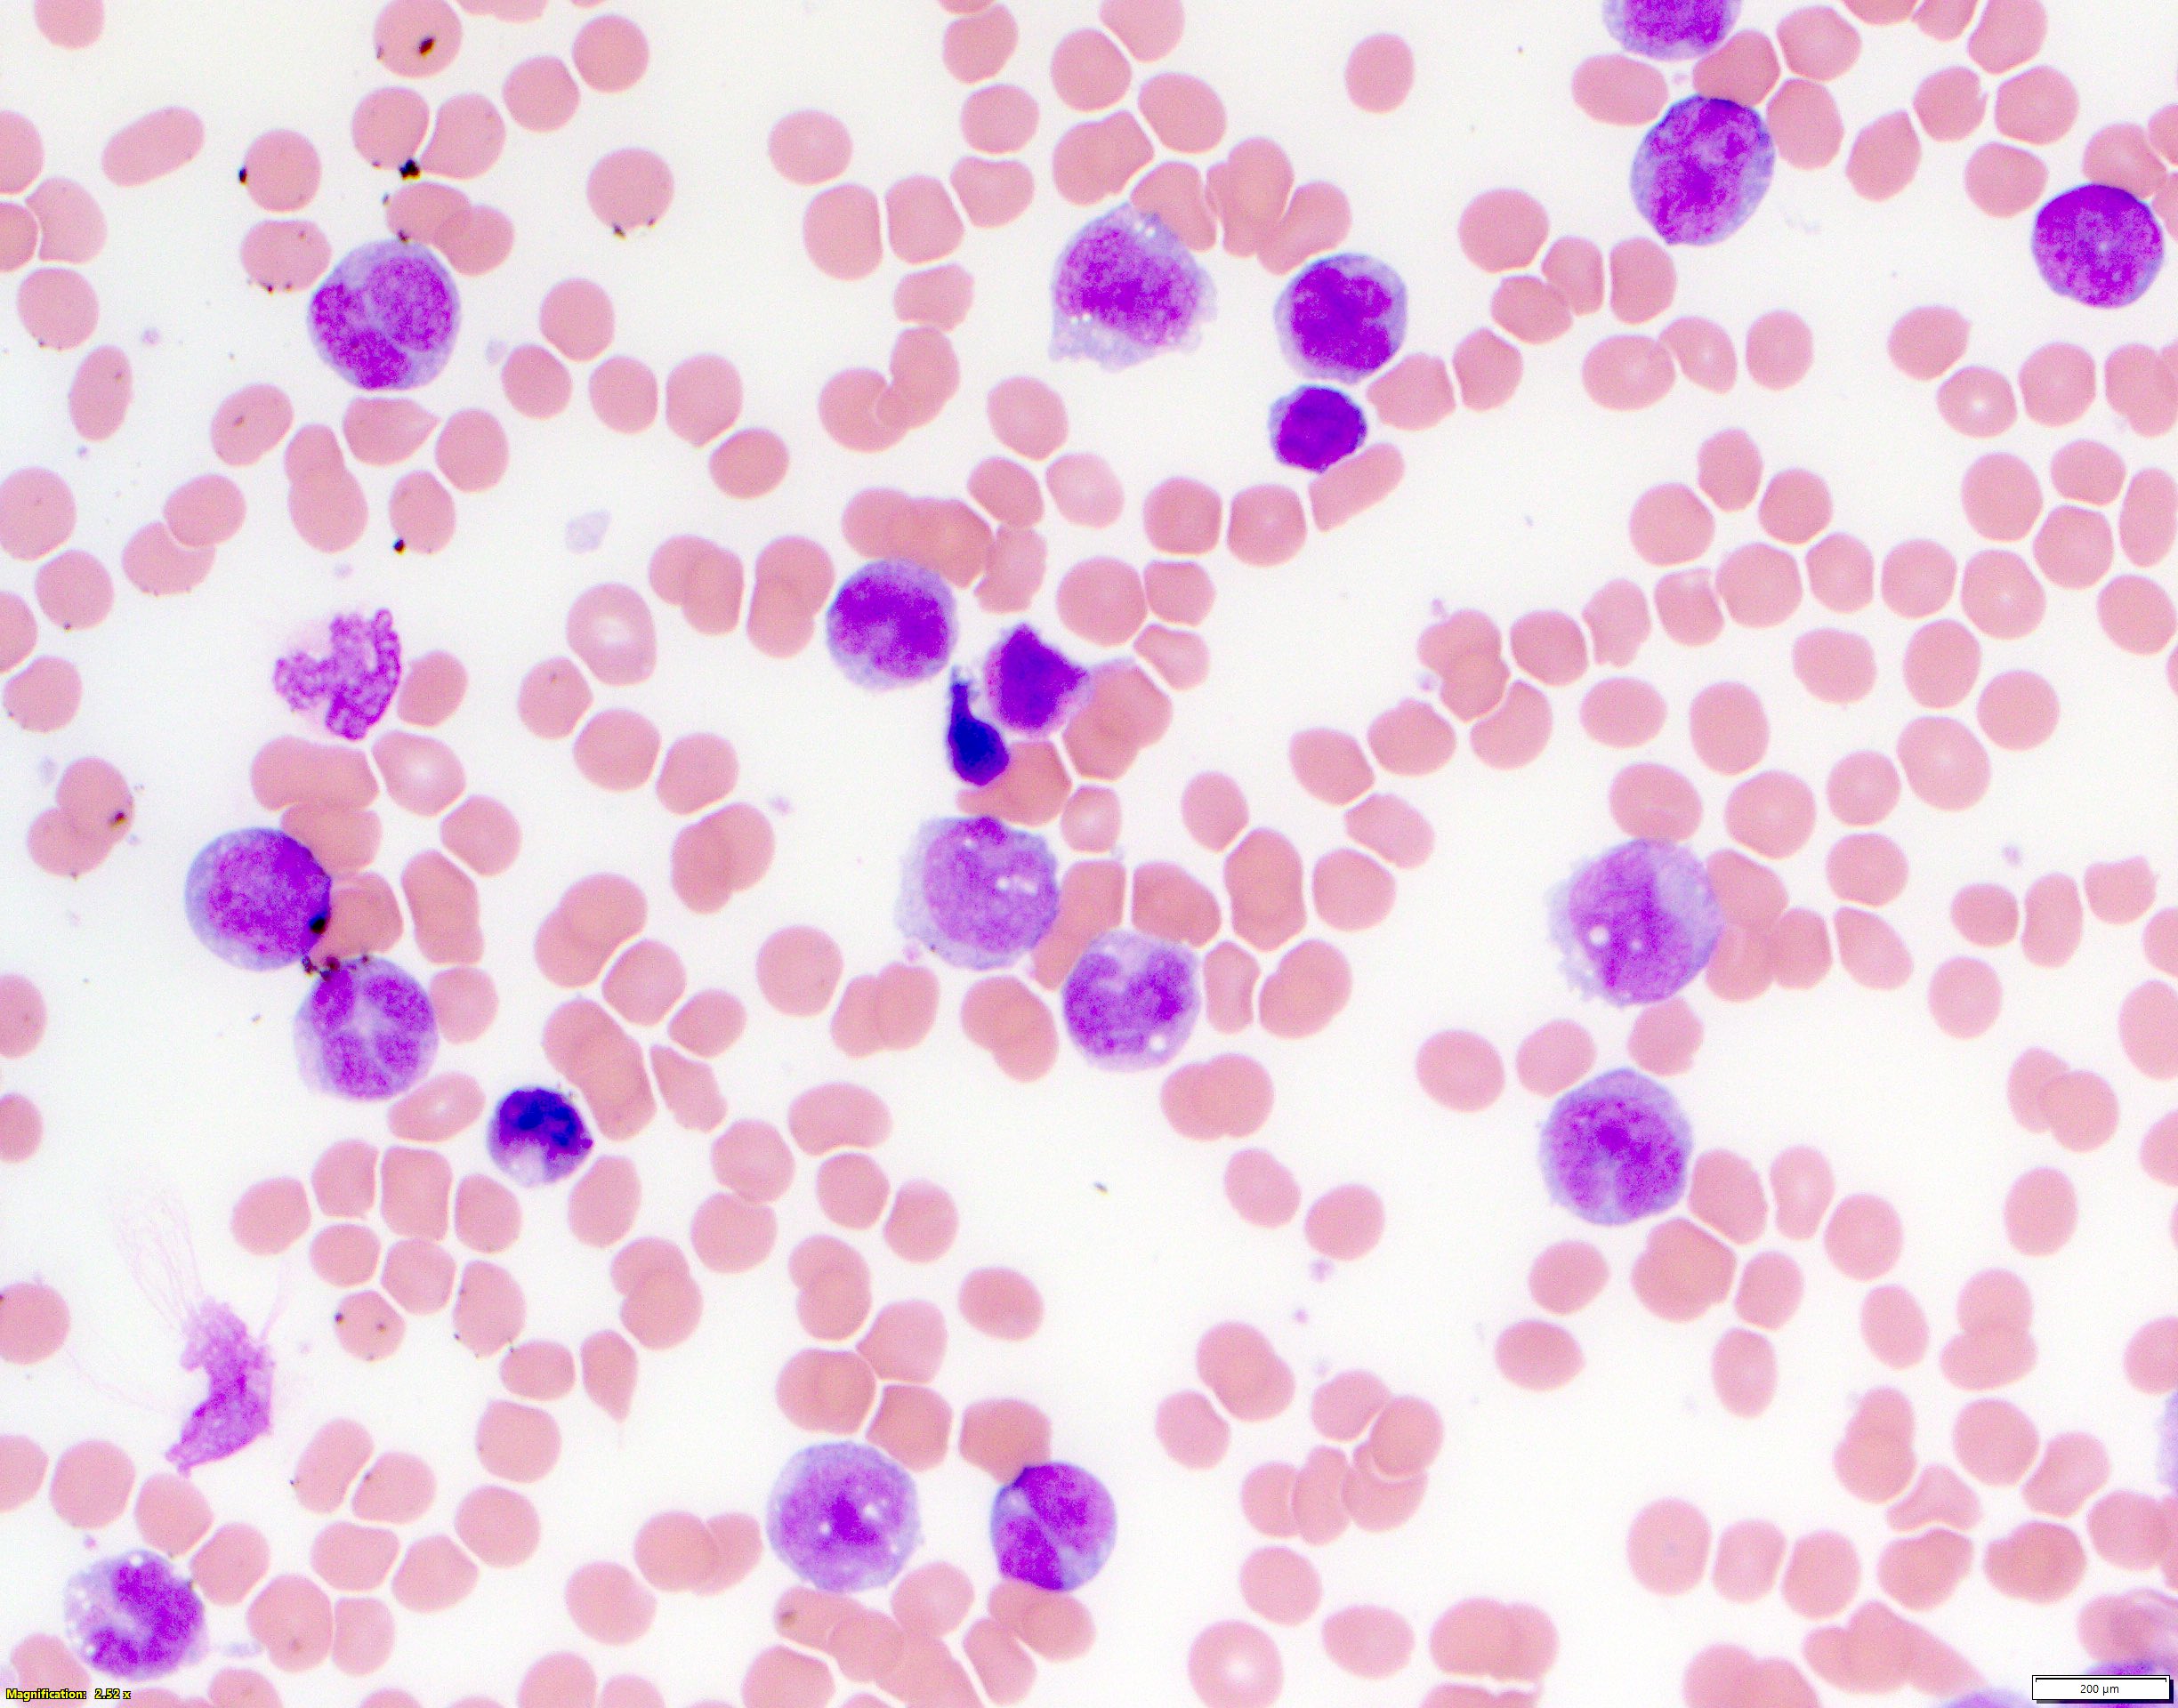
Myeloblast with eosinophils
Contributed by Ling Zhang, M.D.

FISH for FGFR1 rearrangement
Images hosted on other servers:

FISH assay of FIM (also called ZNF198) and FGFR1
Images hosted on other servers:

Summary of reported cases
Contributed by Ling Zhang, M.D.

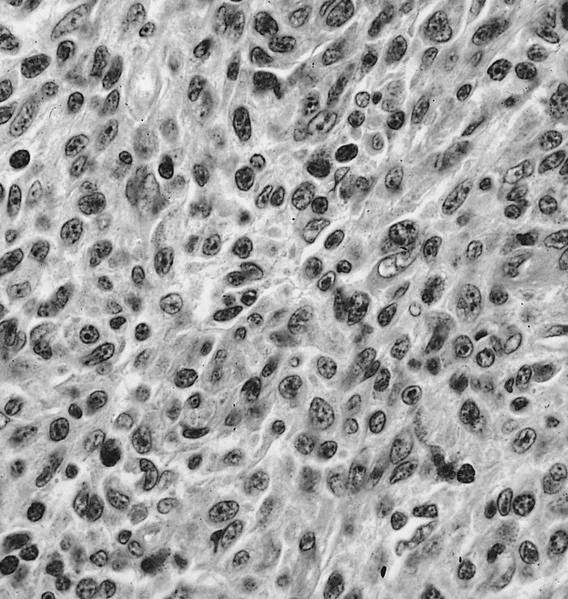
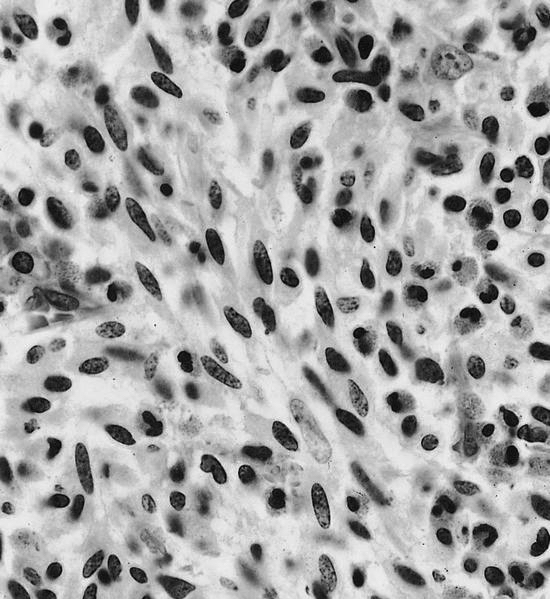
T lymphoblastic lymphoma: lymphoblasts

T lymphoblastic lymphoma: lymphoblasts and eosinophils

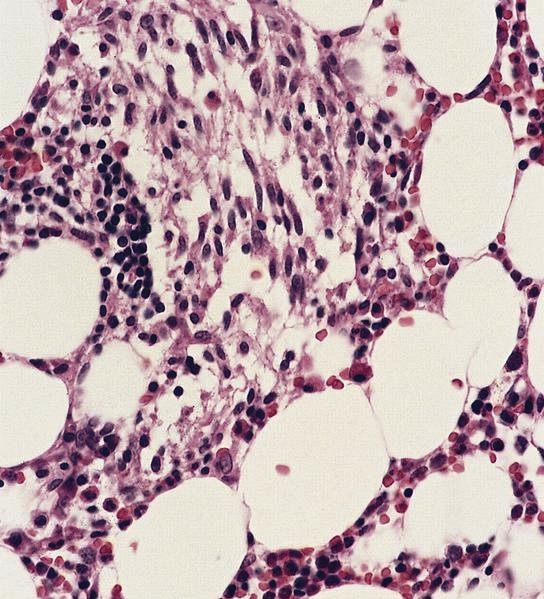
T lymphoblastic
leukemia / lymphoma:
hypercellular
bone marrow

Myeloid hyperplasia in bone marrow

T lymphoblastic lymphoma: CD3

T lymphoblastic lymphoma: TdT

T lymphoblastic lymphoma: Ki67
Contributed by Ling Zhang, M.D.

T lymphoblastic leukemia / lymphoma
Contributed by Ling Zhang, M.D. and Sara Niyazi, D.O.

T ALL with FLT3 rearrangement
Contributed by Ling Zhang, M.D.

FISH analysis
Images hosted on other servers:

ETV6::FLT3 fusion RT-PCR

t(13;14)(q12;q32) TRIP11::FLT3 fusion

Chromosomal translocations / FISH analysis
Images hosted on other servers:

Glucosylceramide metabolic pathway
Images hosted on other servers:

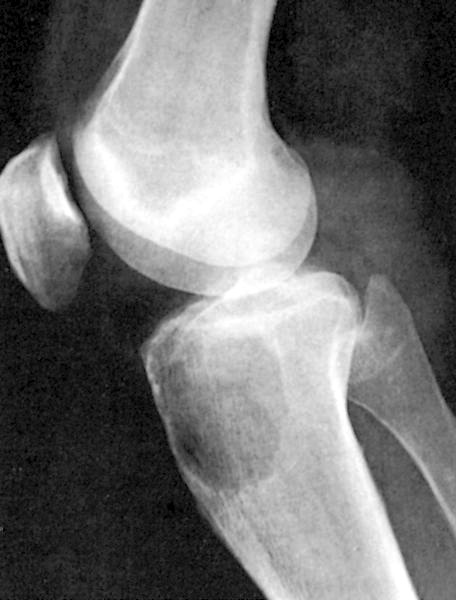
Gaucher lytic lesions

Erlenmeyer flask deformity
Images hosted on other servers:

Perinatal collodion Gaucher (type 2)
Images hosted on other servers:

Splenomegaly in Gaucher disease
Contributed by Patricia Tsang, M.D. and Mowafak Hamodat, M.B.Ch.B., M.Sc. (Case #164)

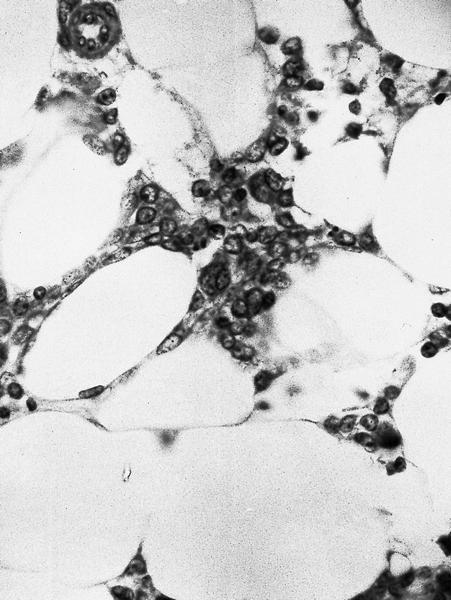
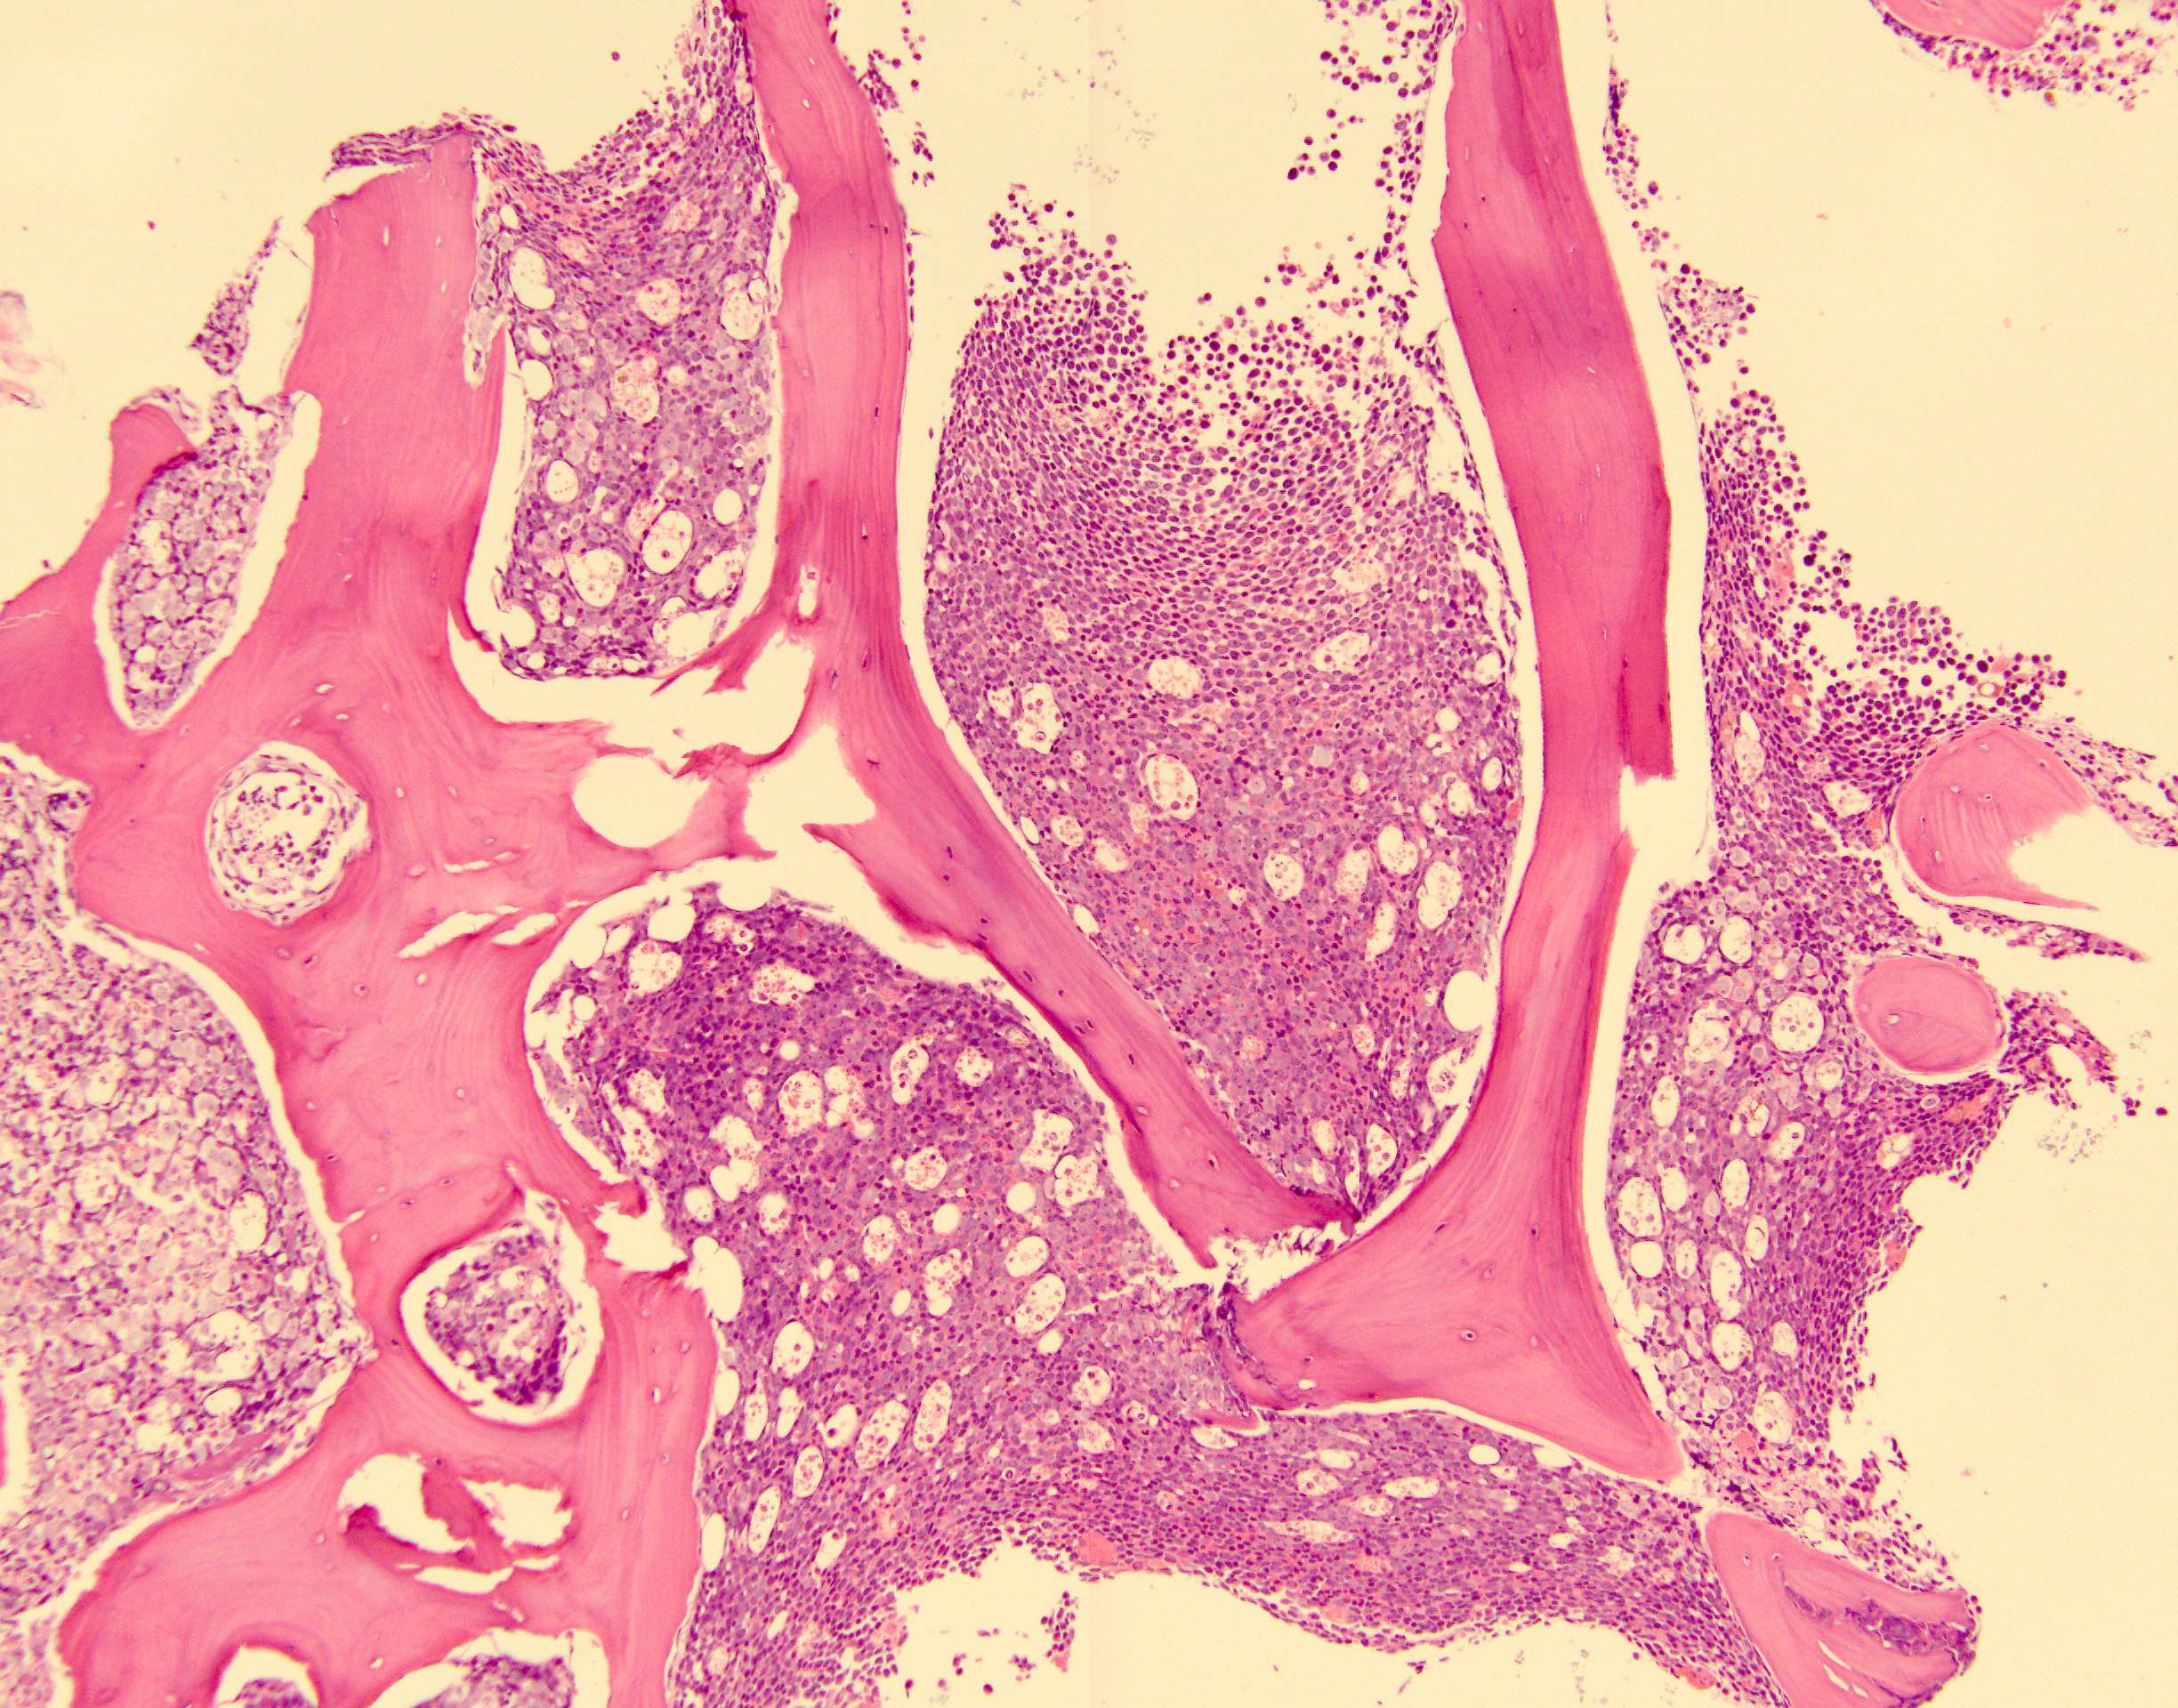
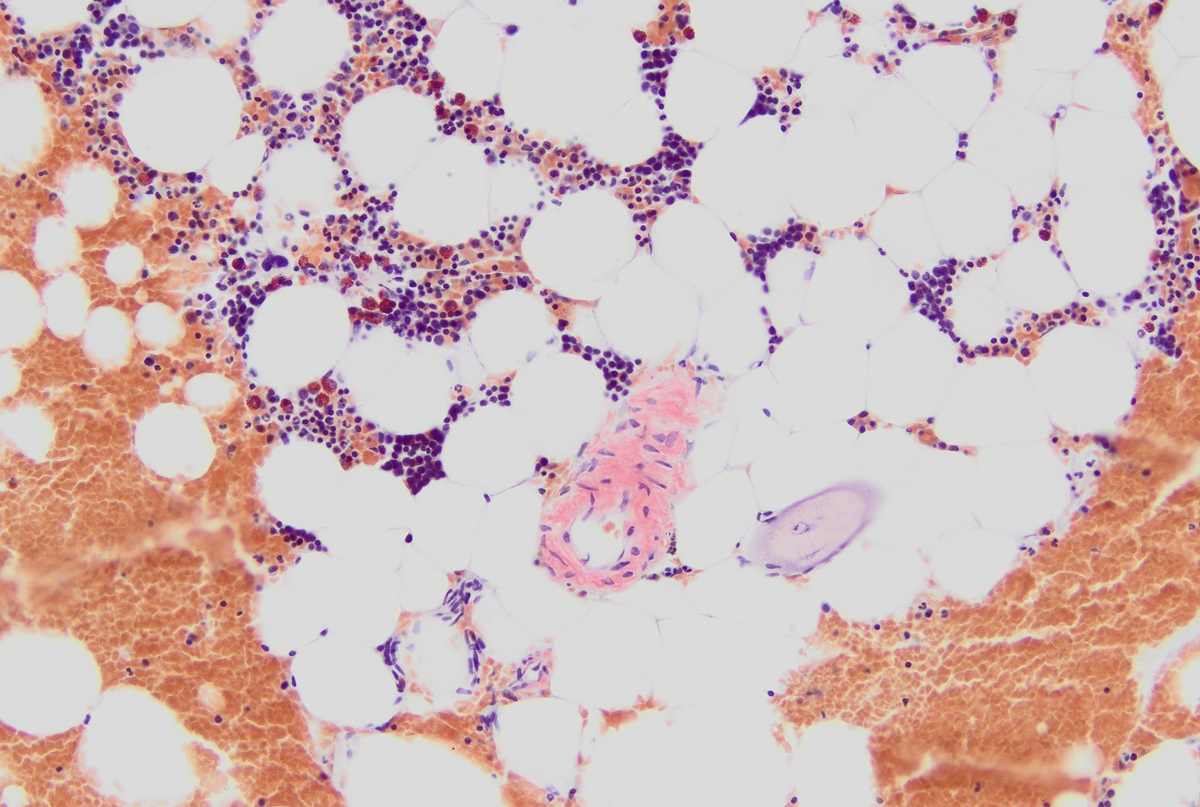
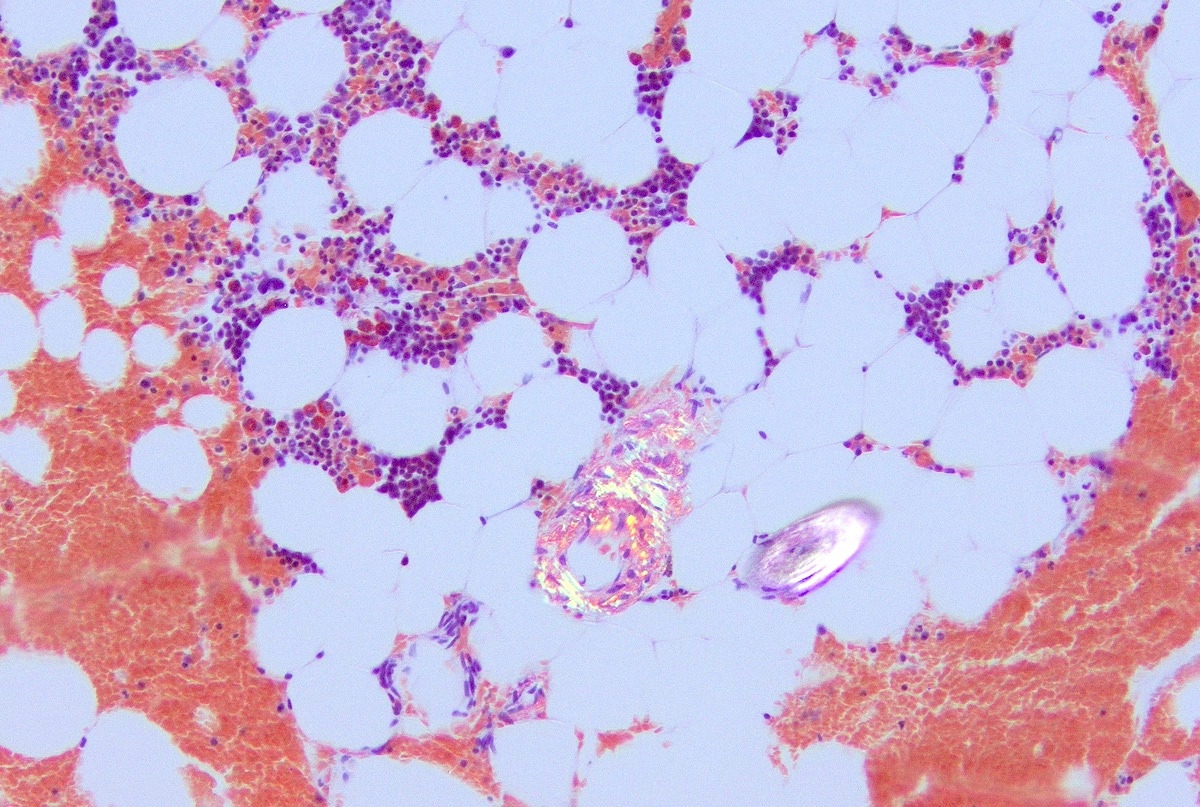
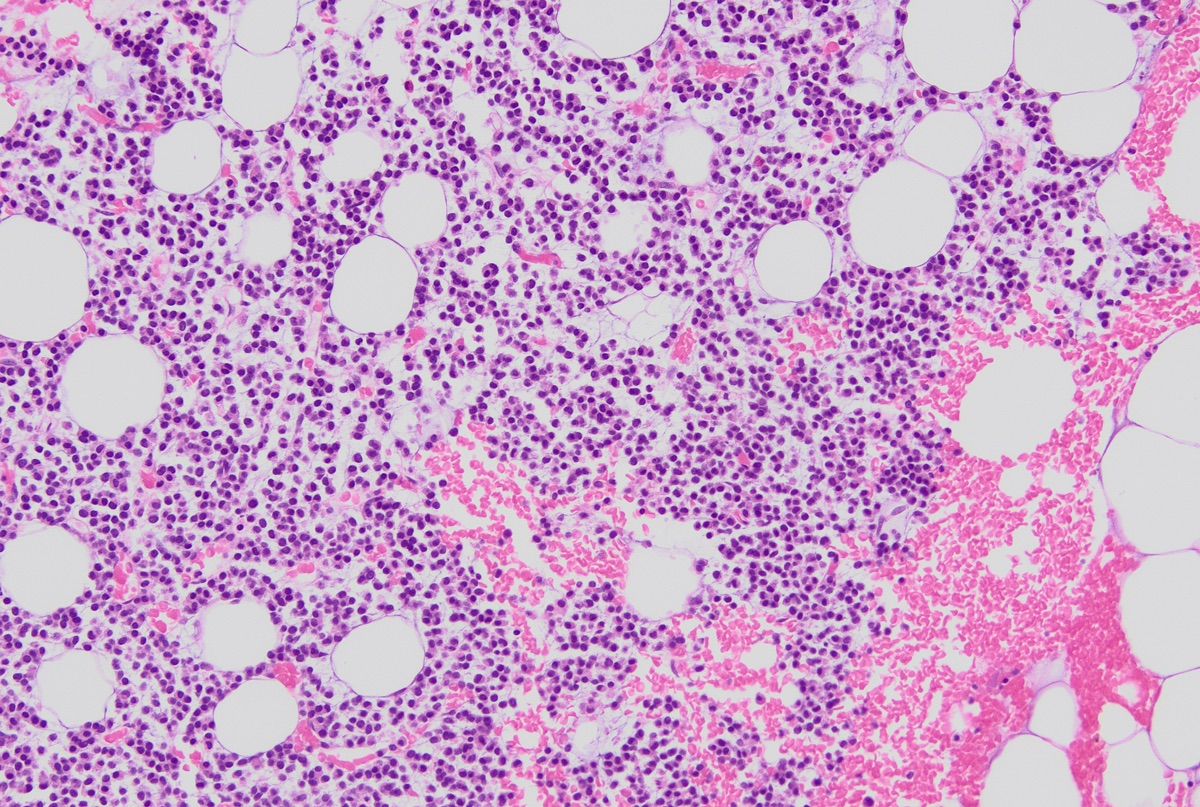
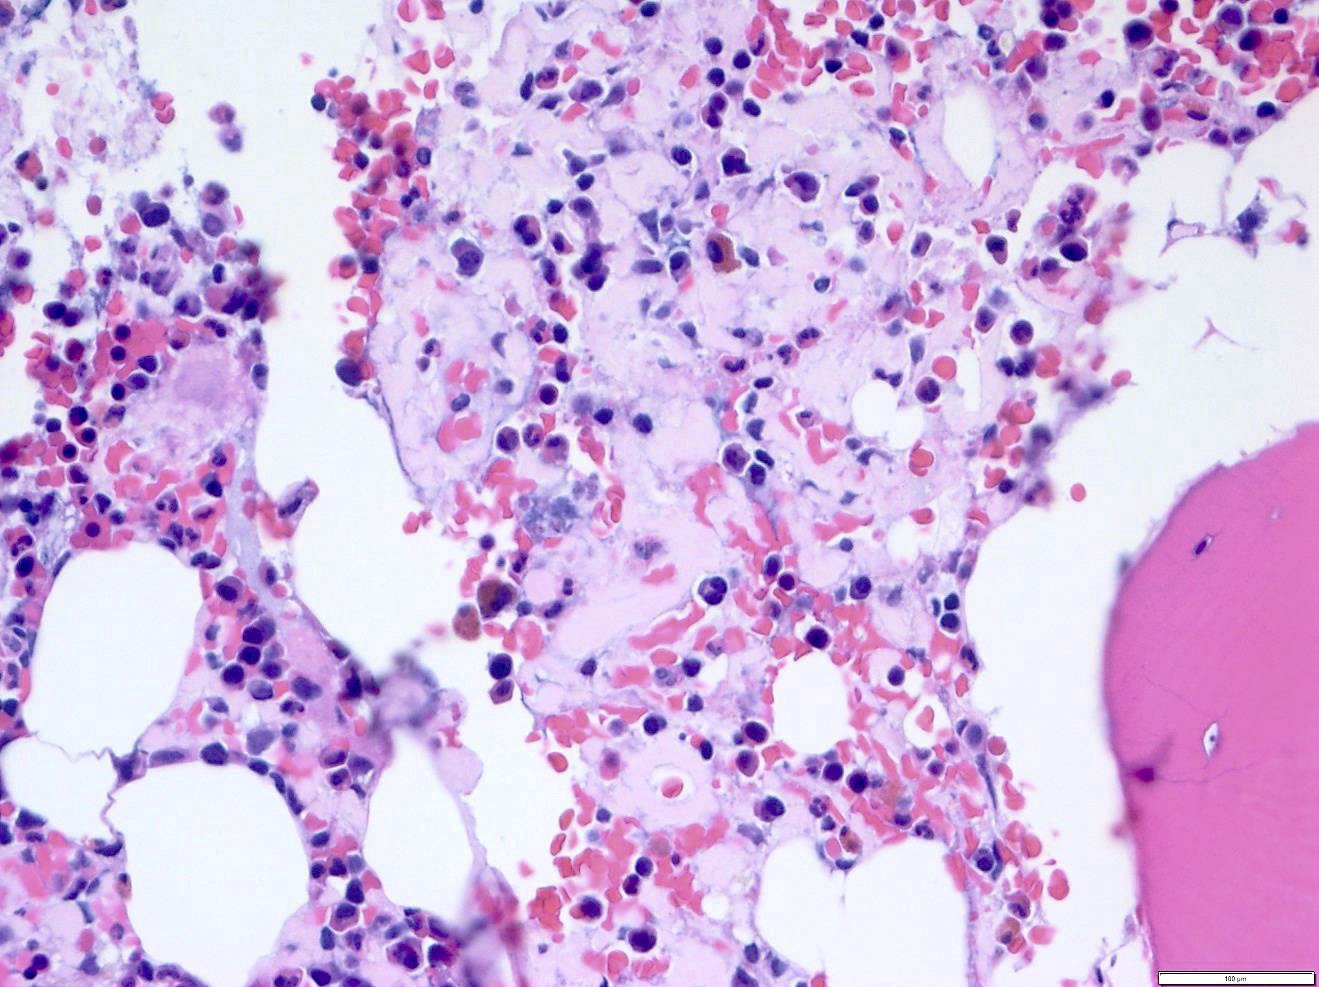
Gaucher in marrow biopsy
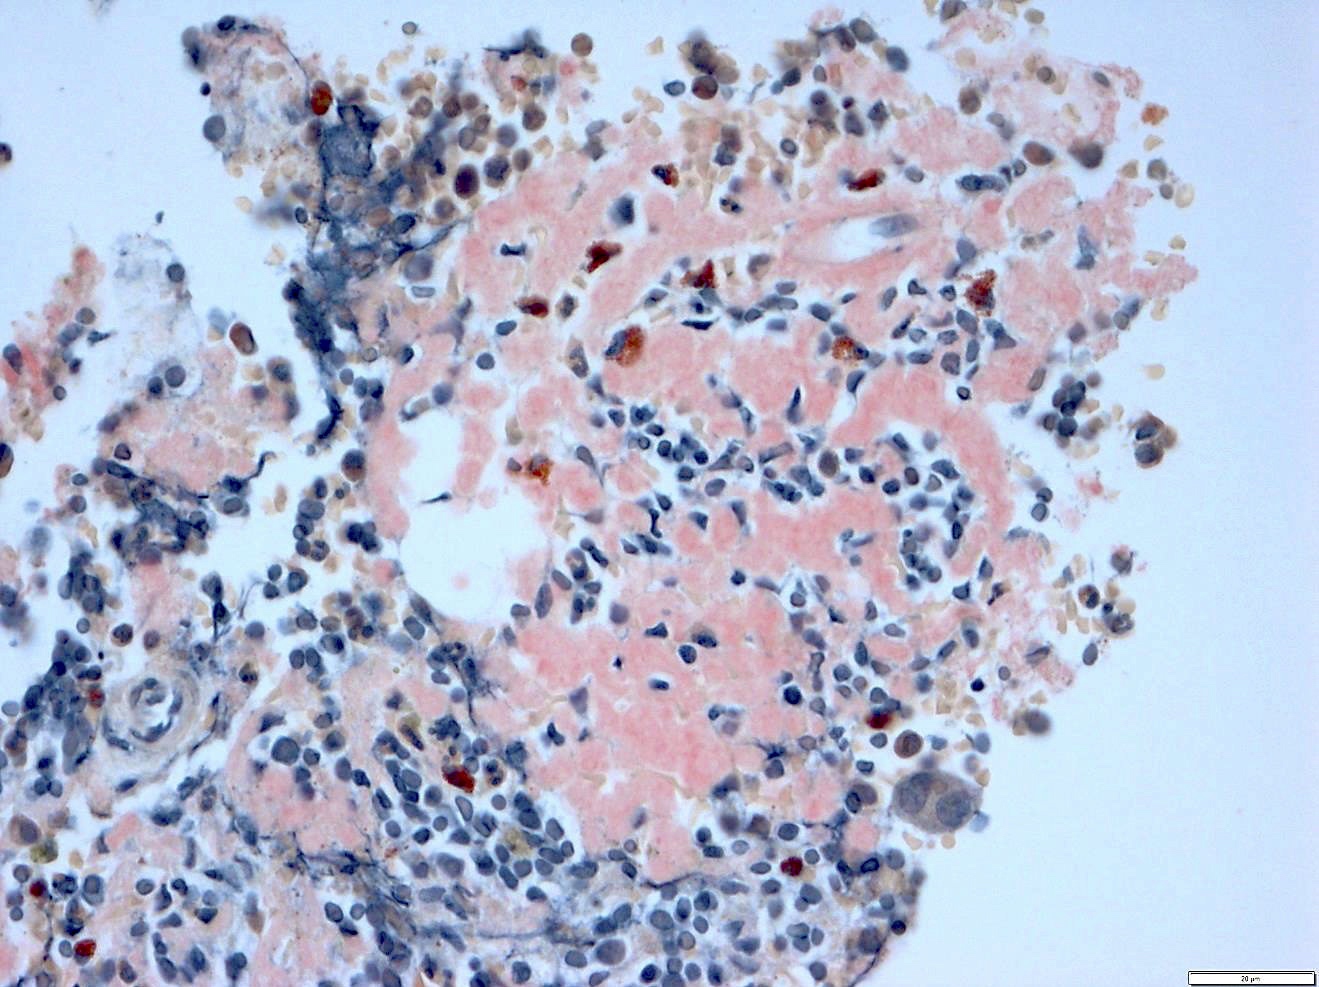
Fibrillary Gaucher cell cytoplasm

Gaucher cells marrow clot
Liver biopsy

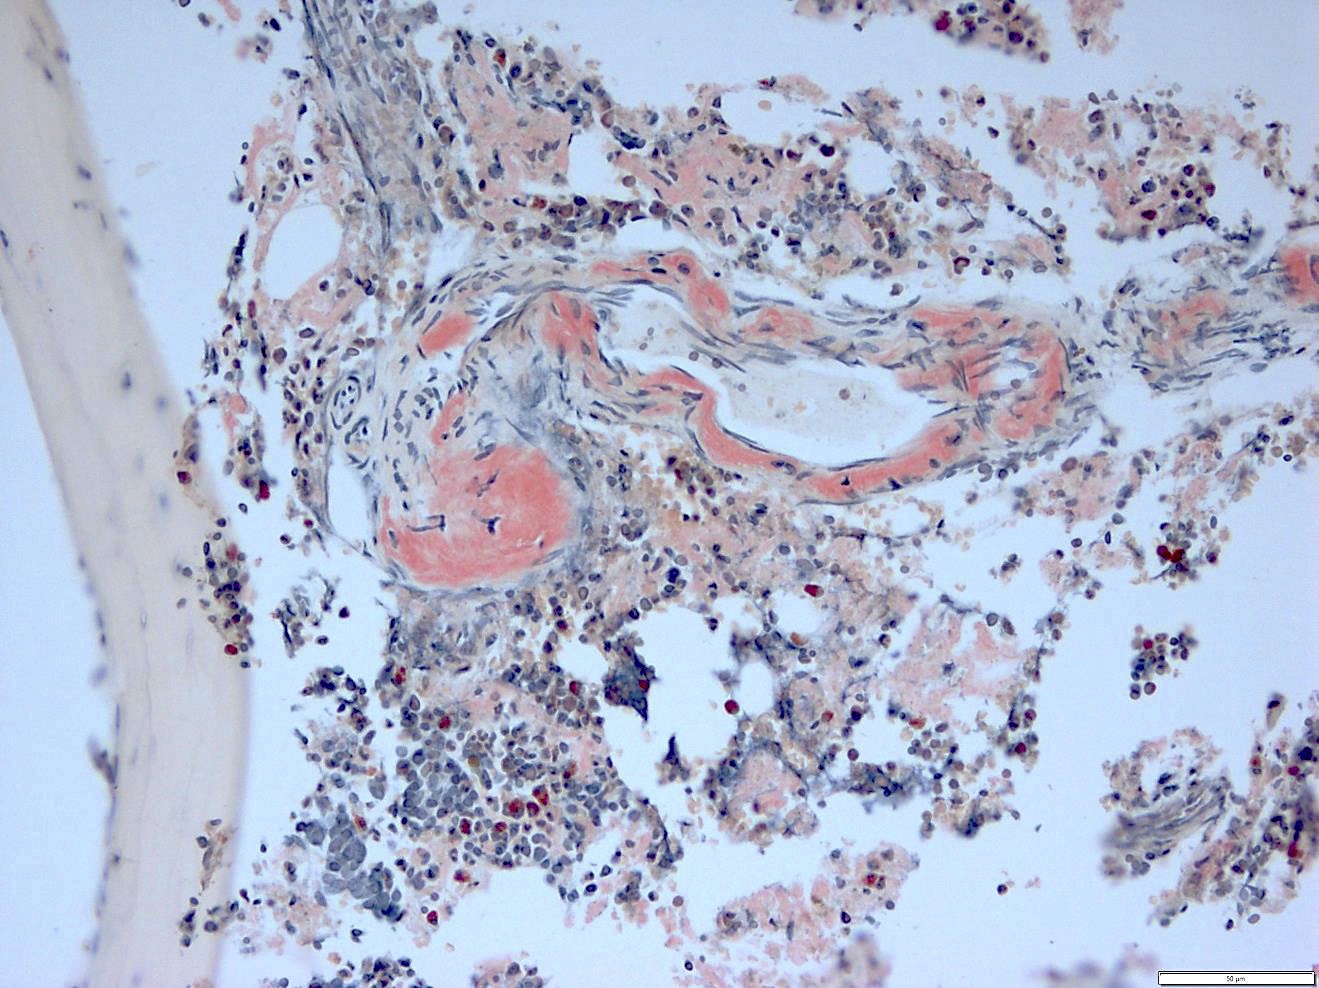
PASD positive Gaucher cells
Marrow aspirate
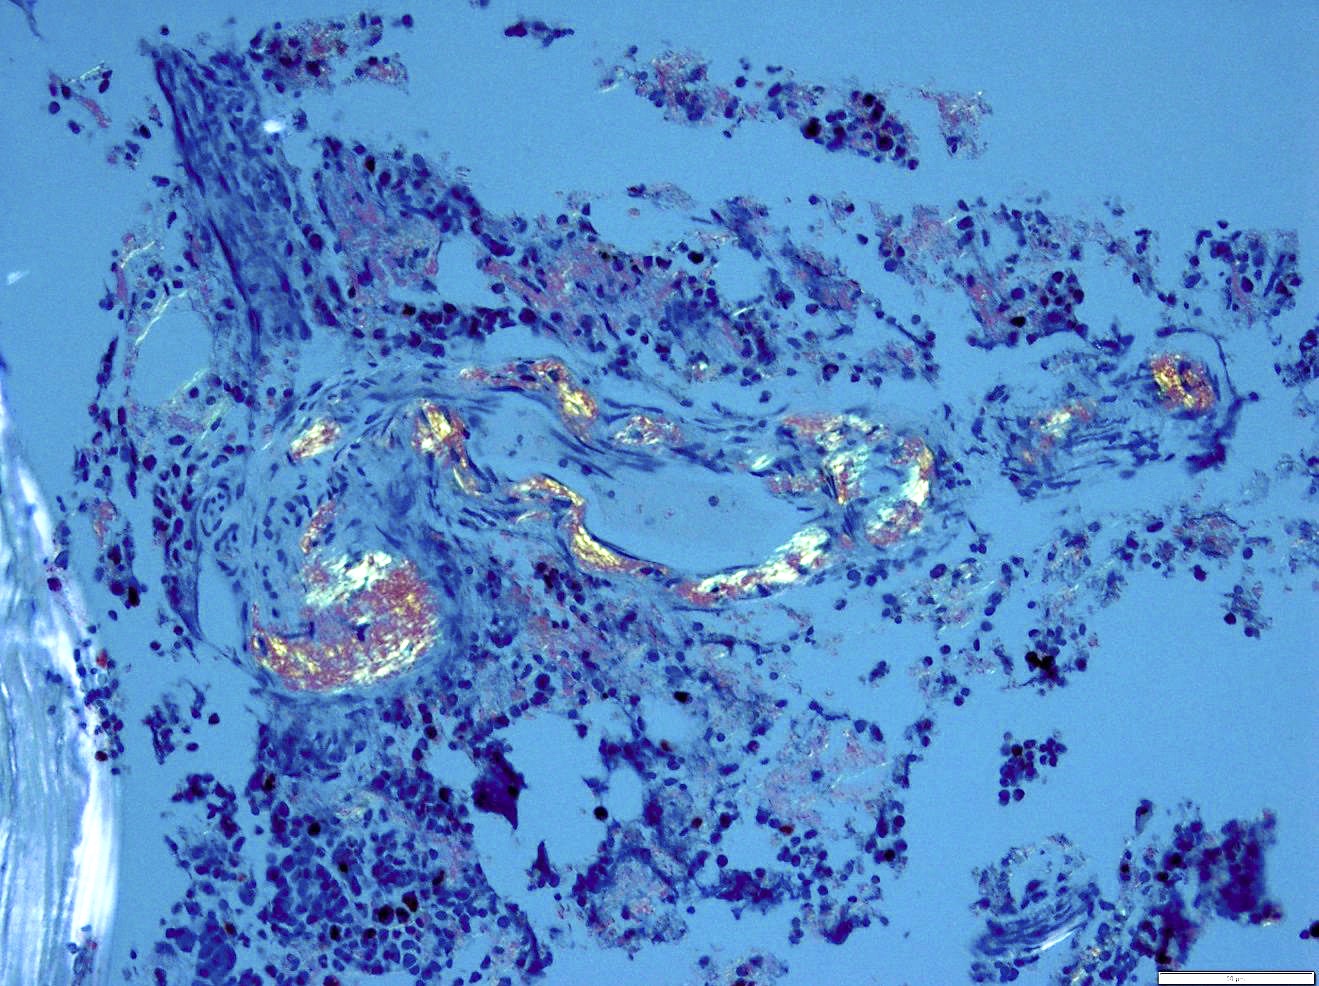
Images hosted on other servers:

Gaucher cell cytoplasmic fibrils
Gaucher disease involving bone
Contributed by Genevieve M. Crane, M.D., Ph.D.
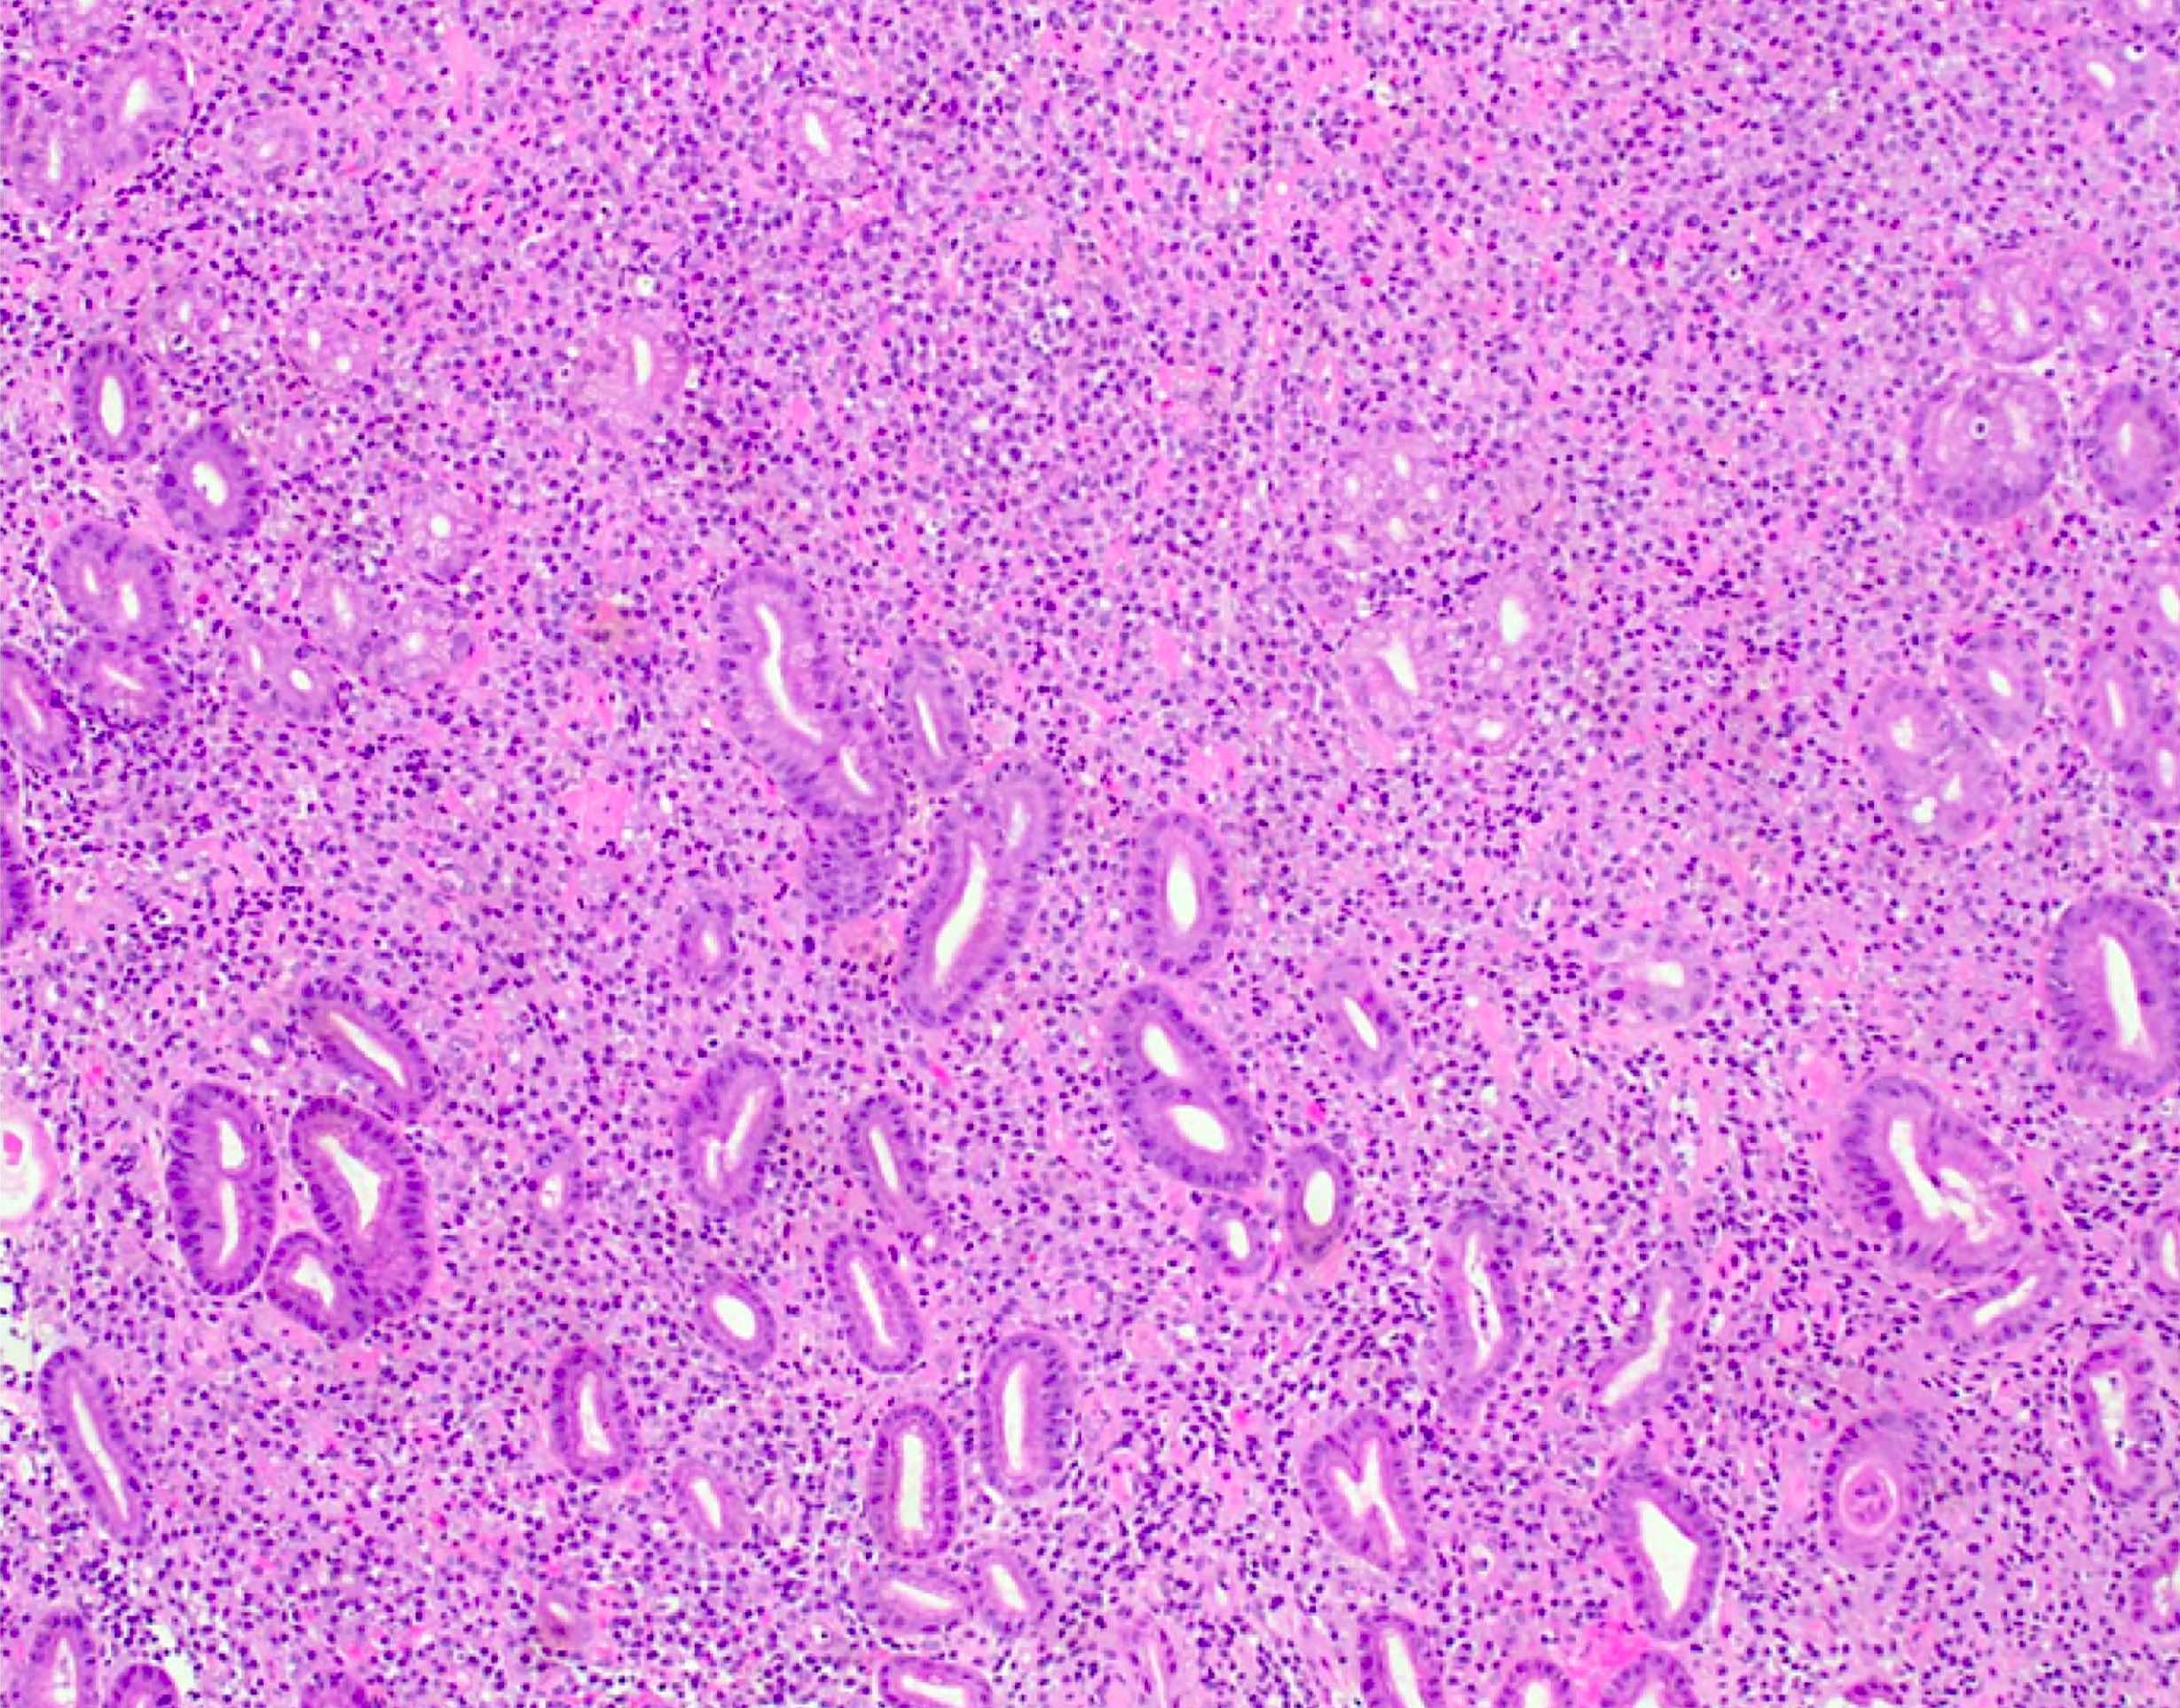

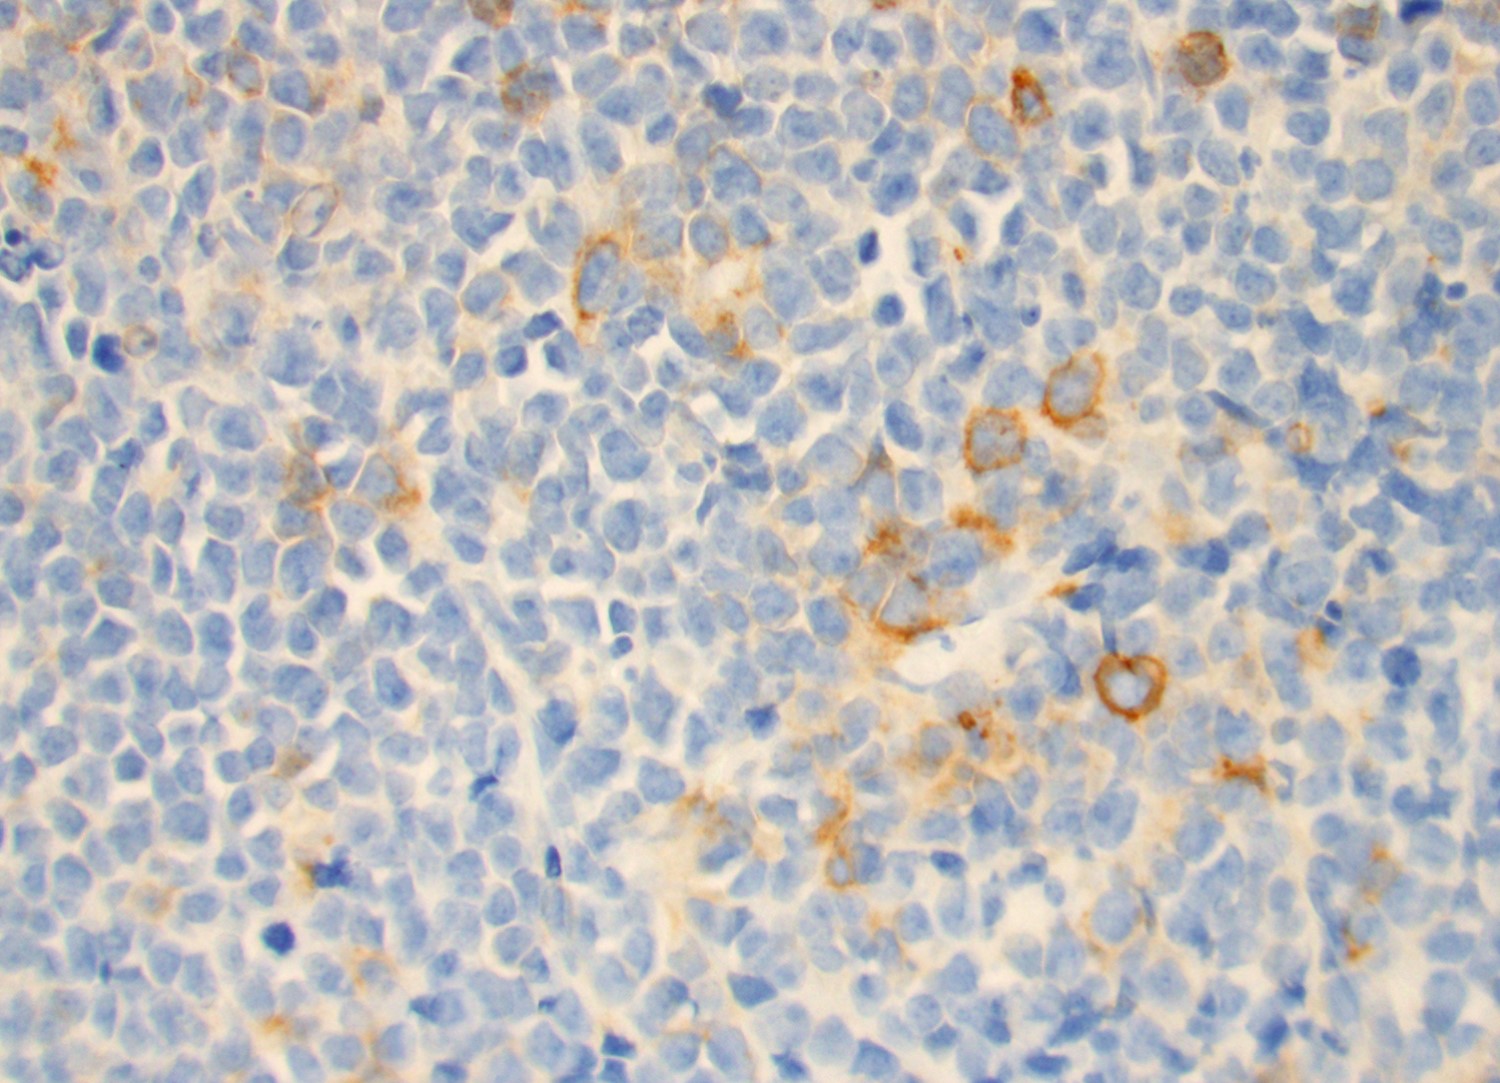
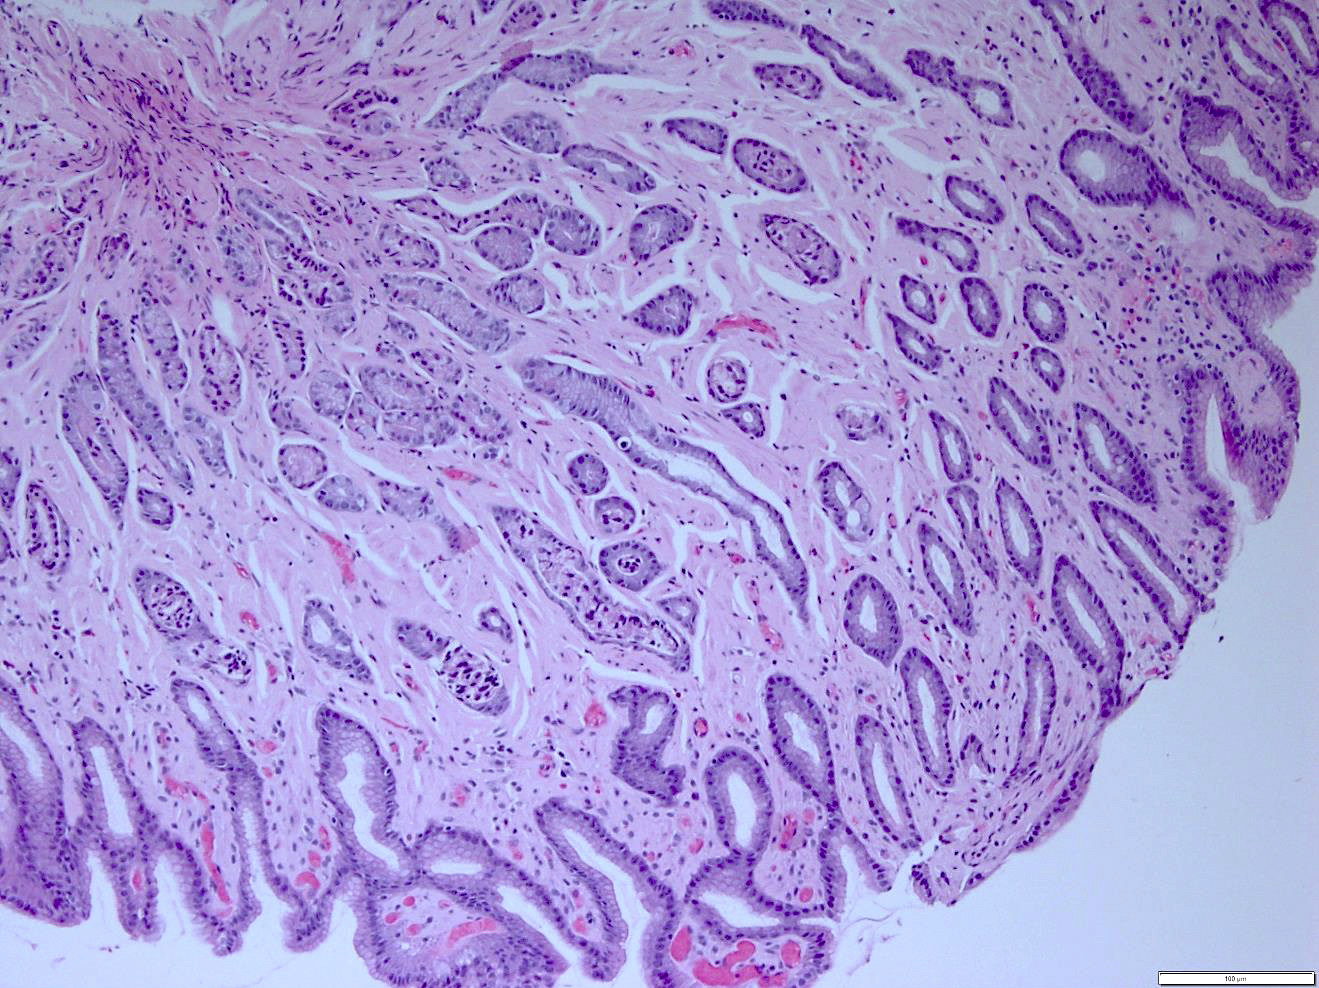
Lamina propria is diffusely expanded by a plasma cell rich infiltrate
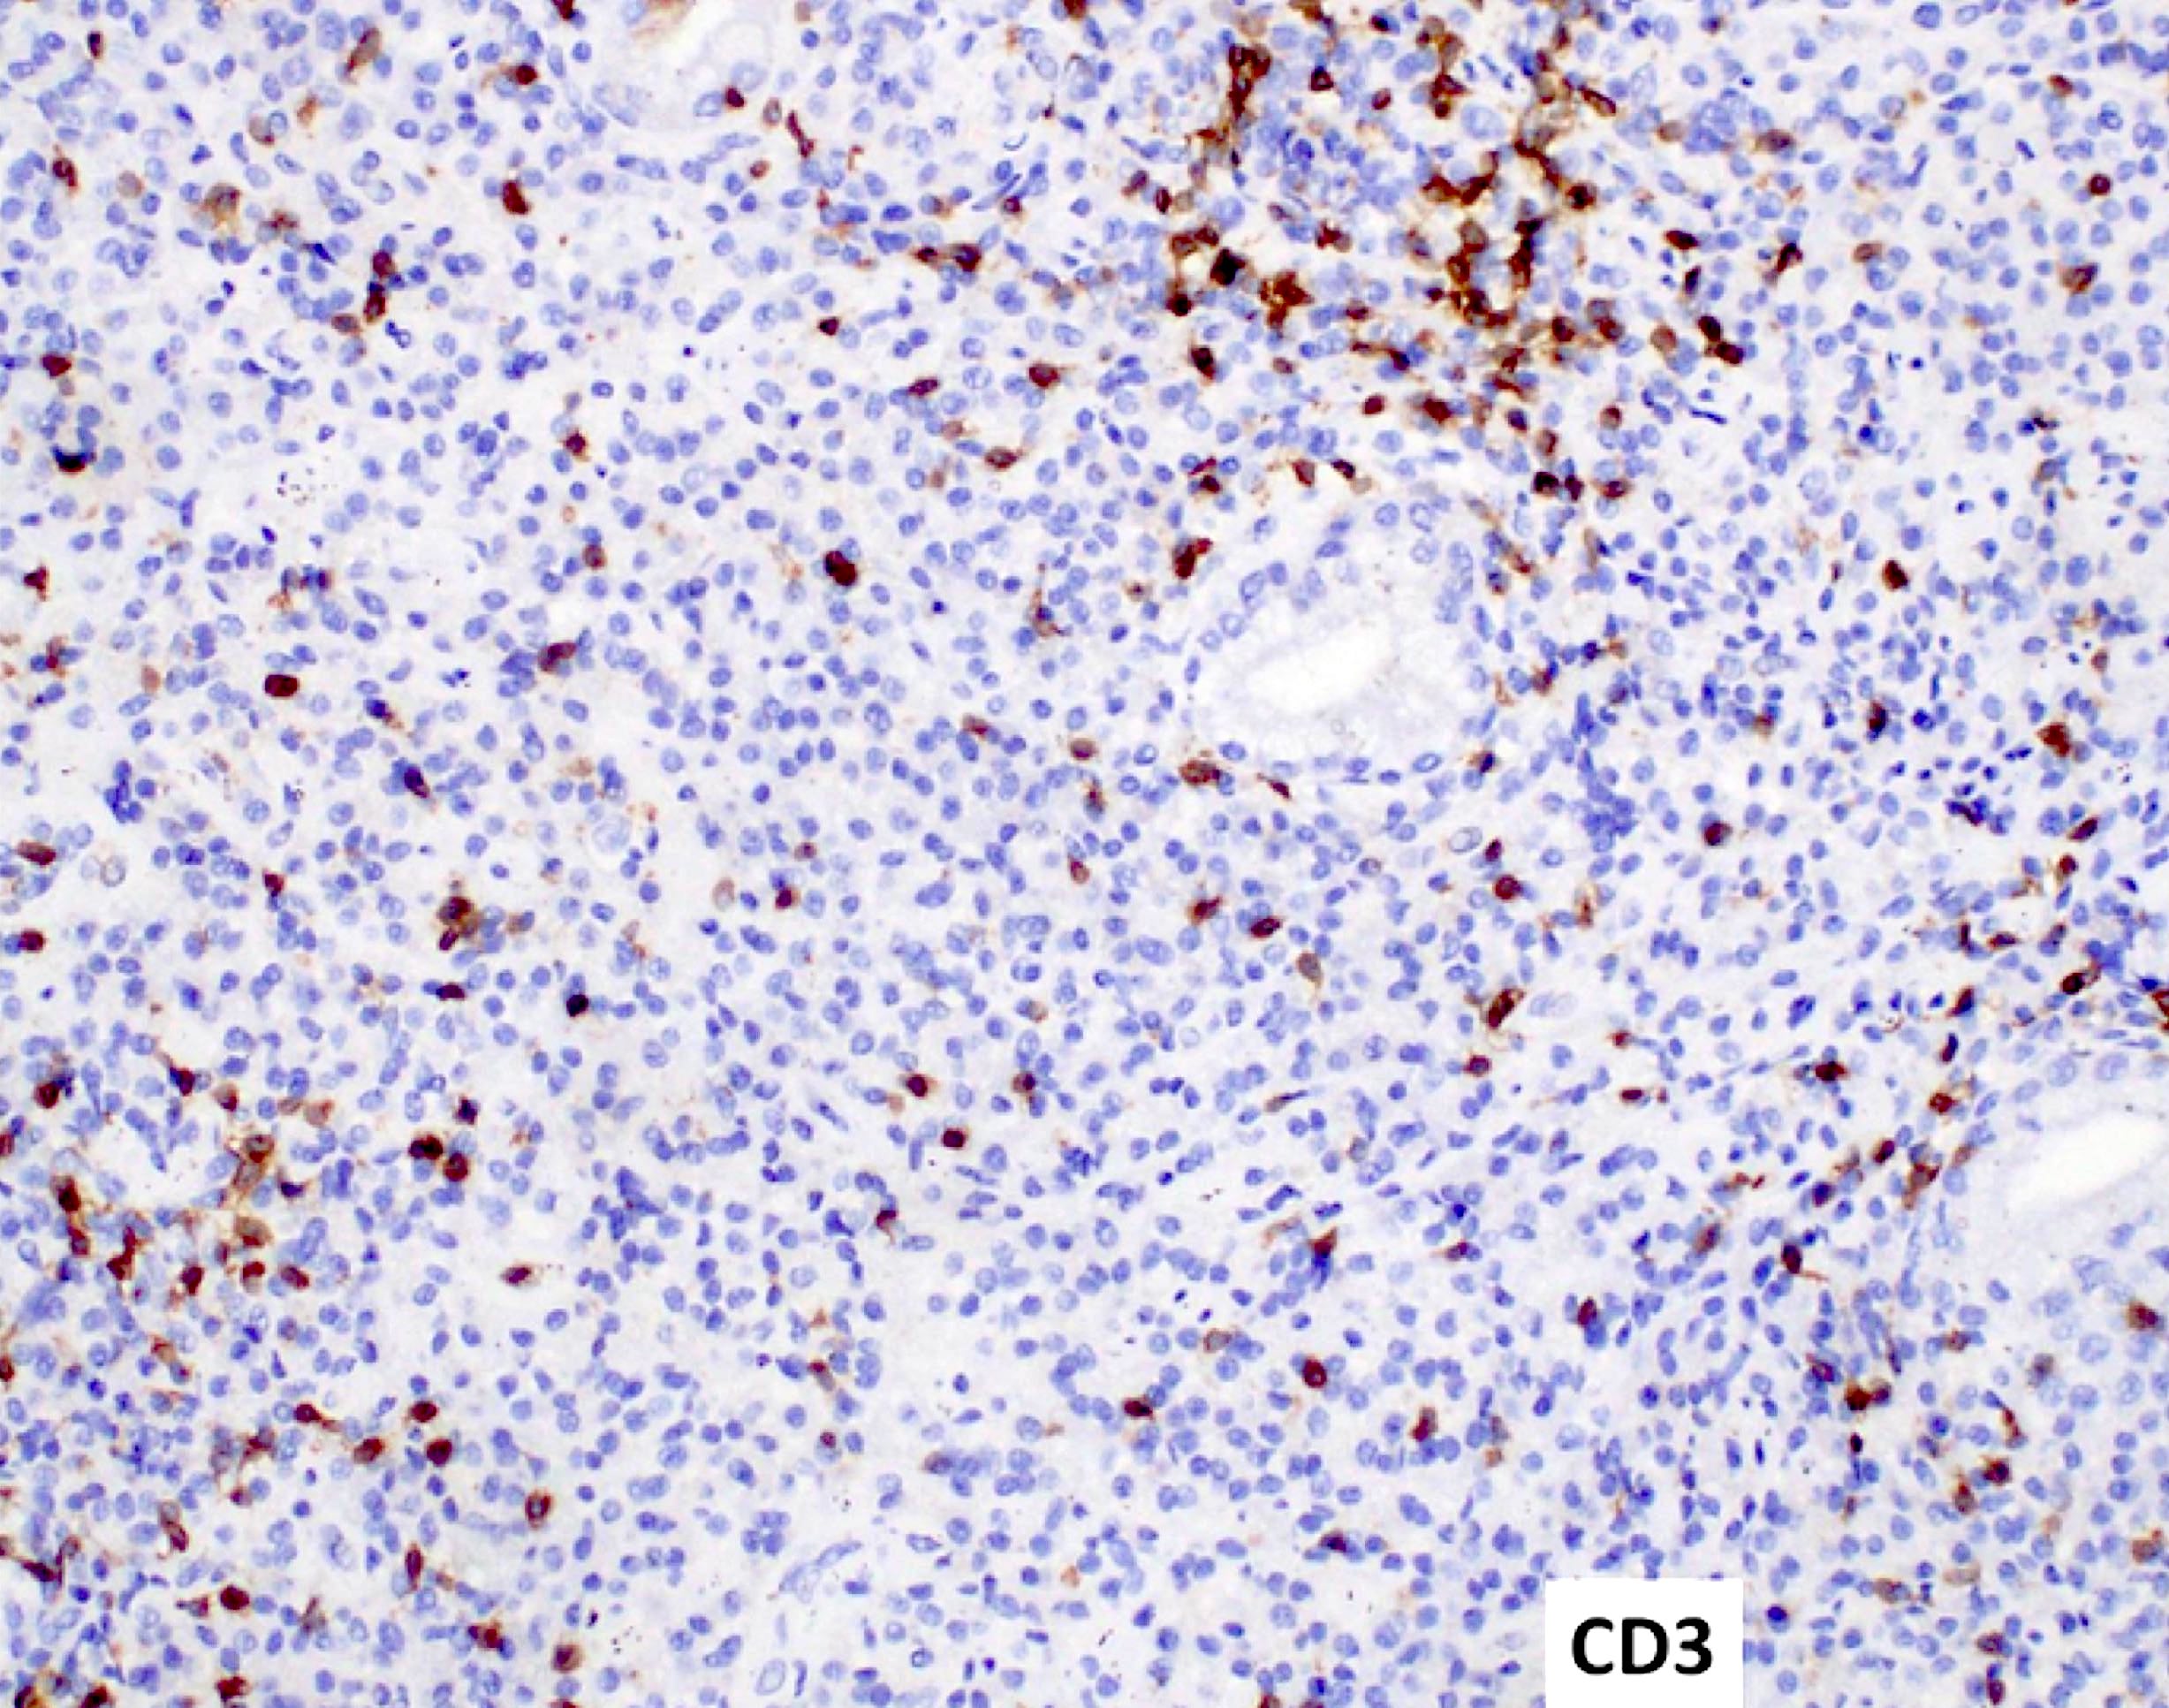
CD3 highlights scattered infiltrating T cells
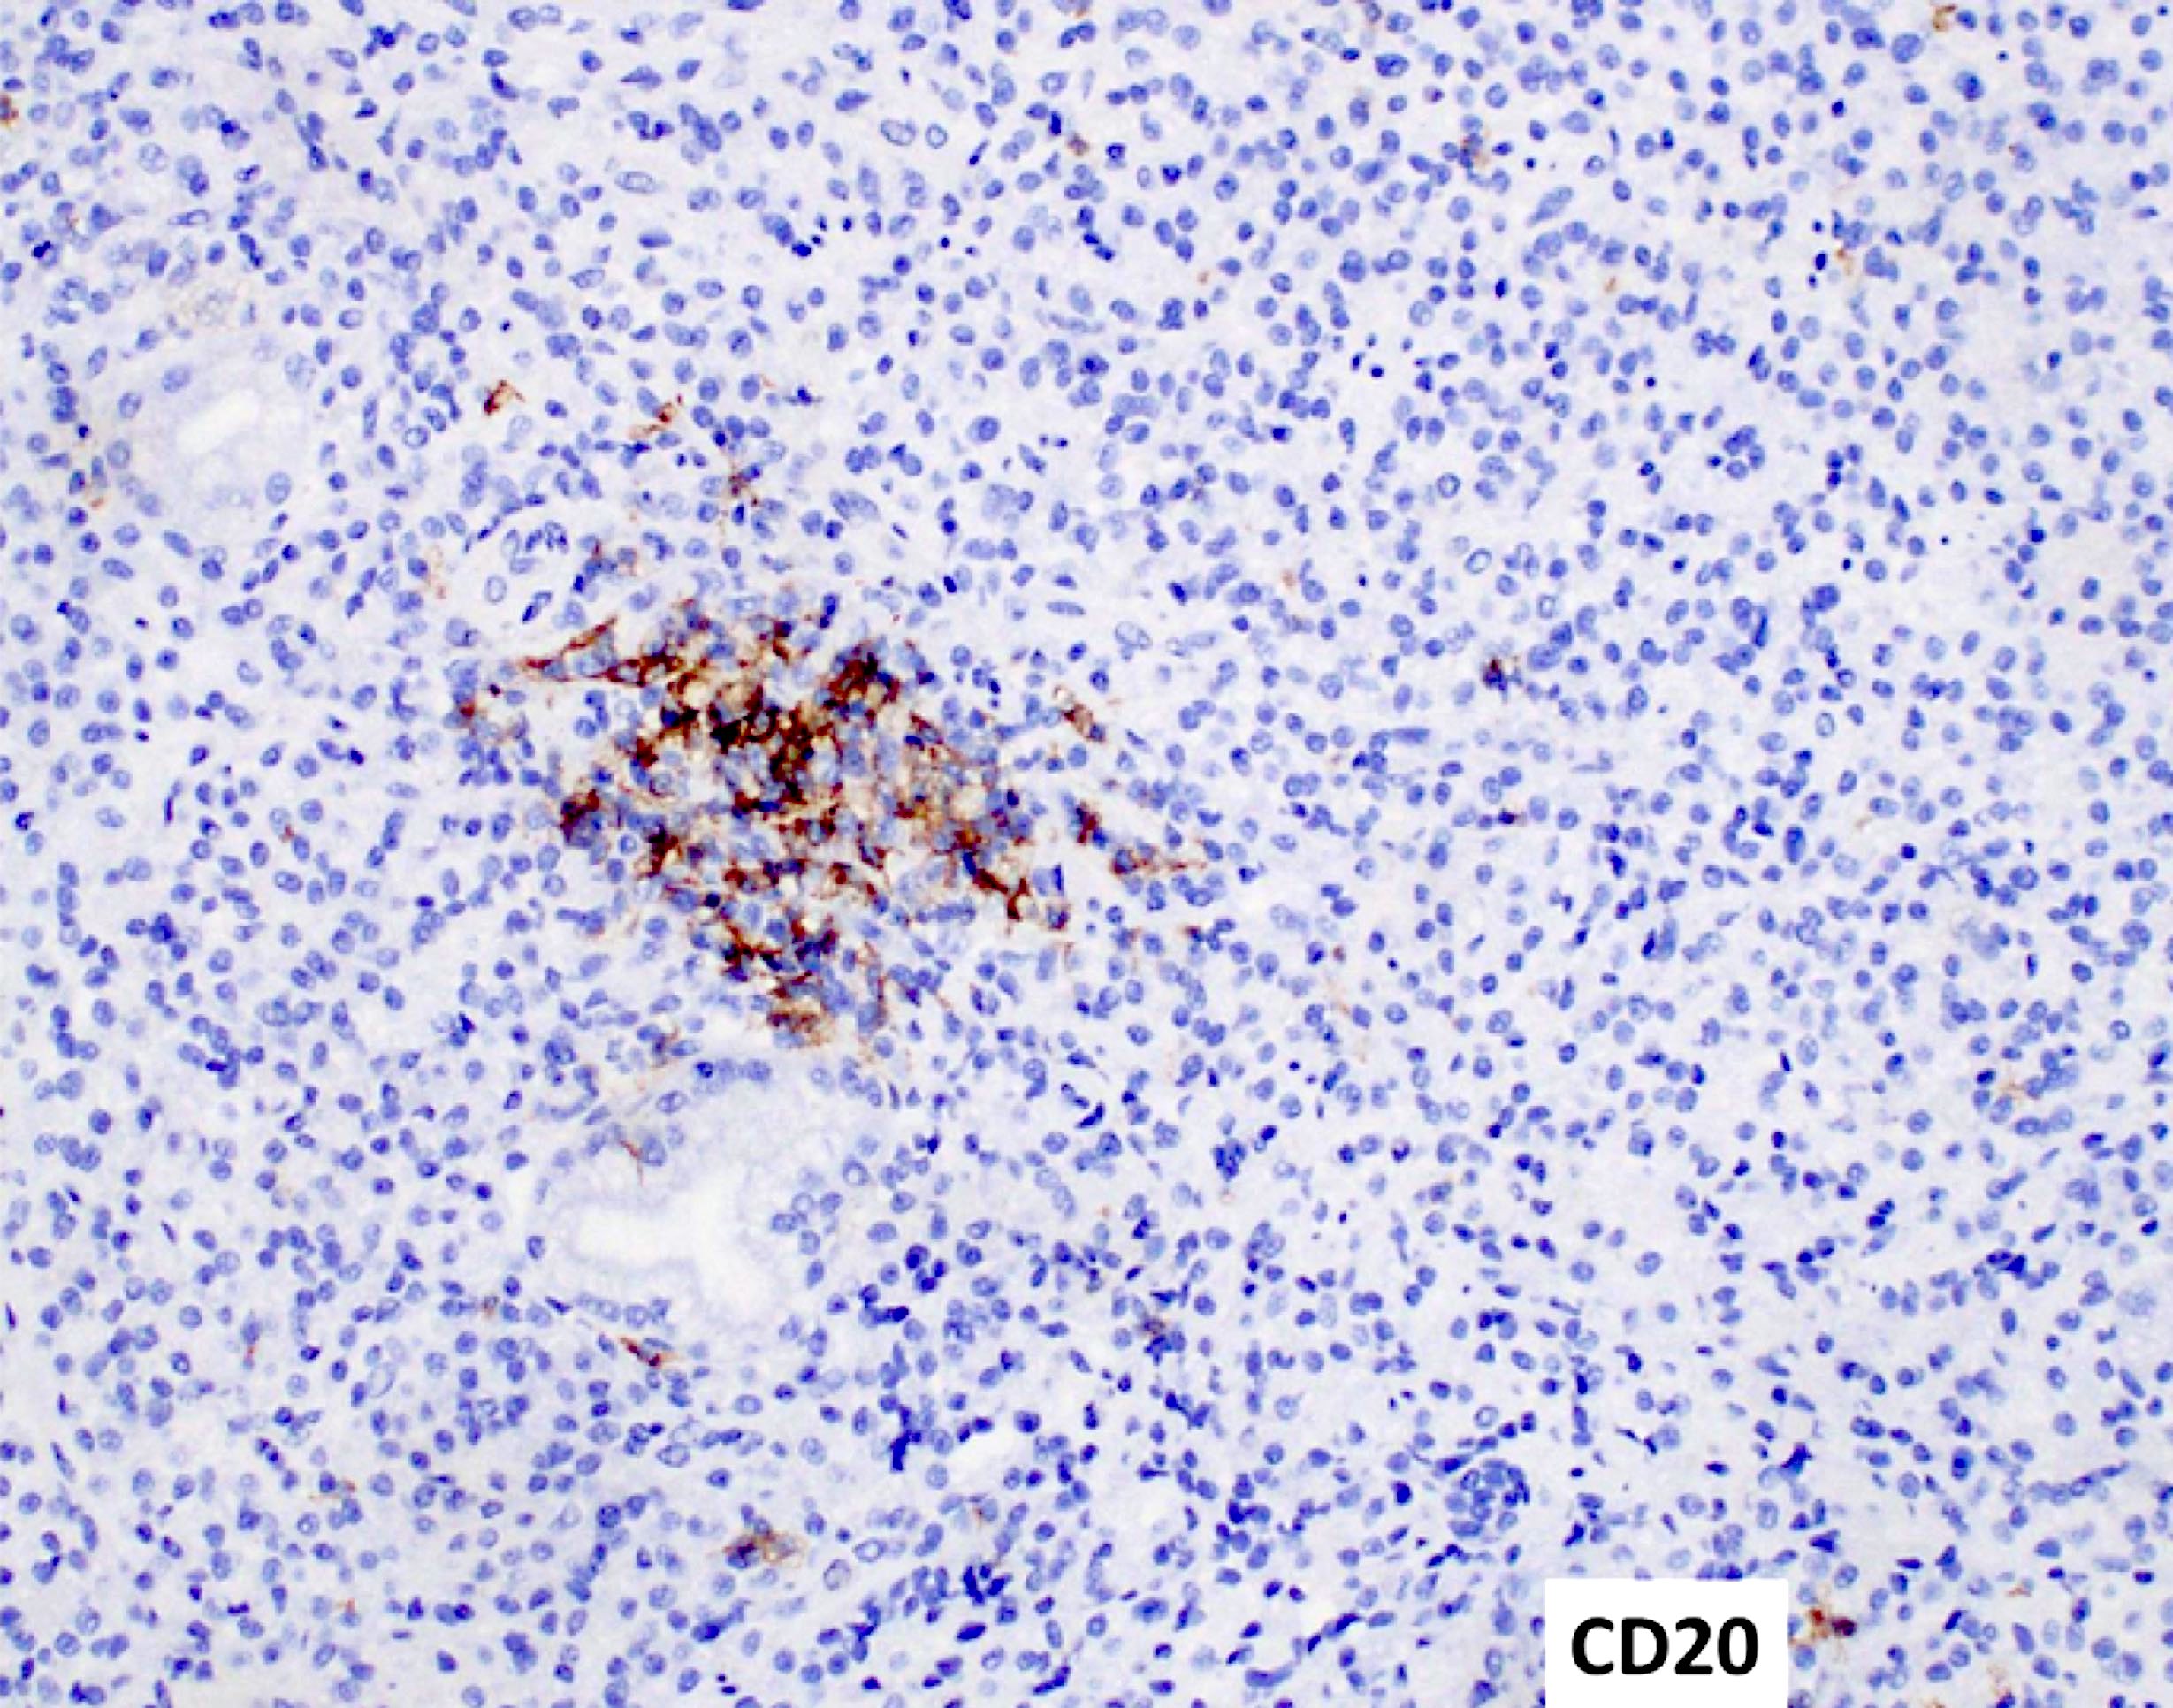
CD20 highlights rare B cell nodules

CD79a stains the majority of the infiltrate

CD138 highlights plasma cells and epithelium
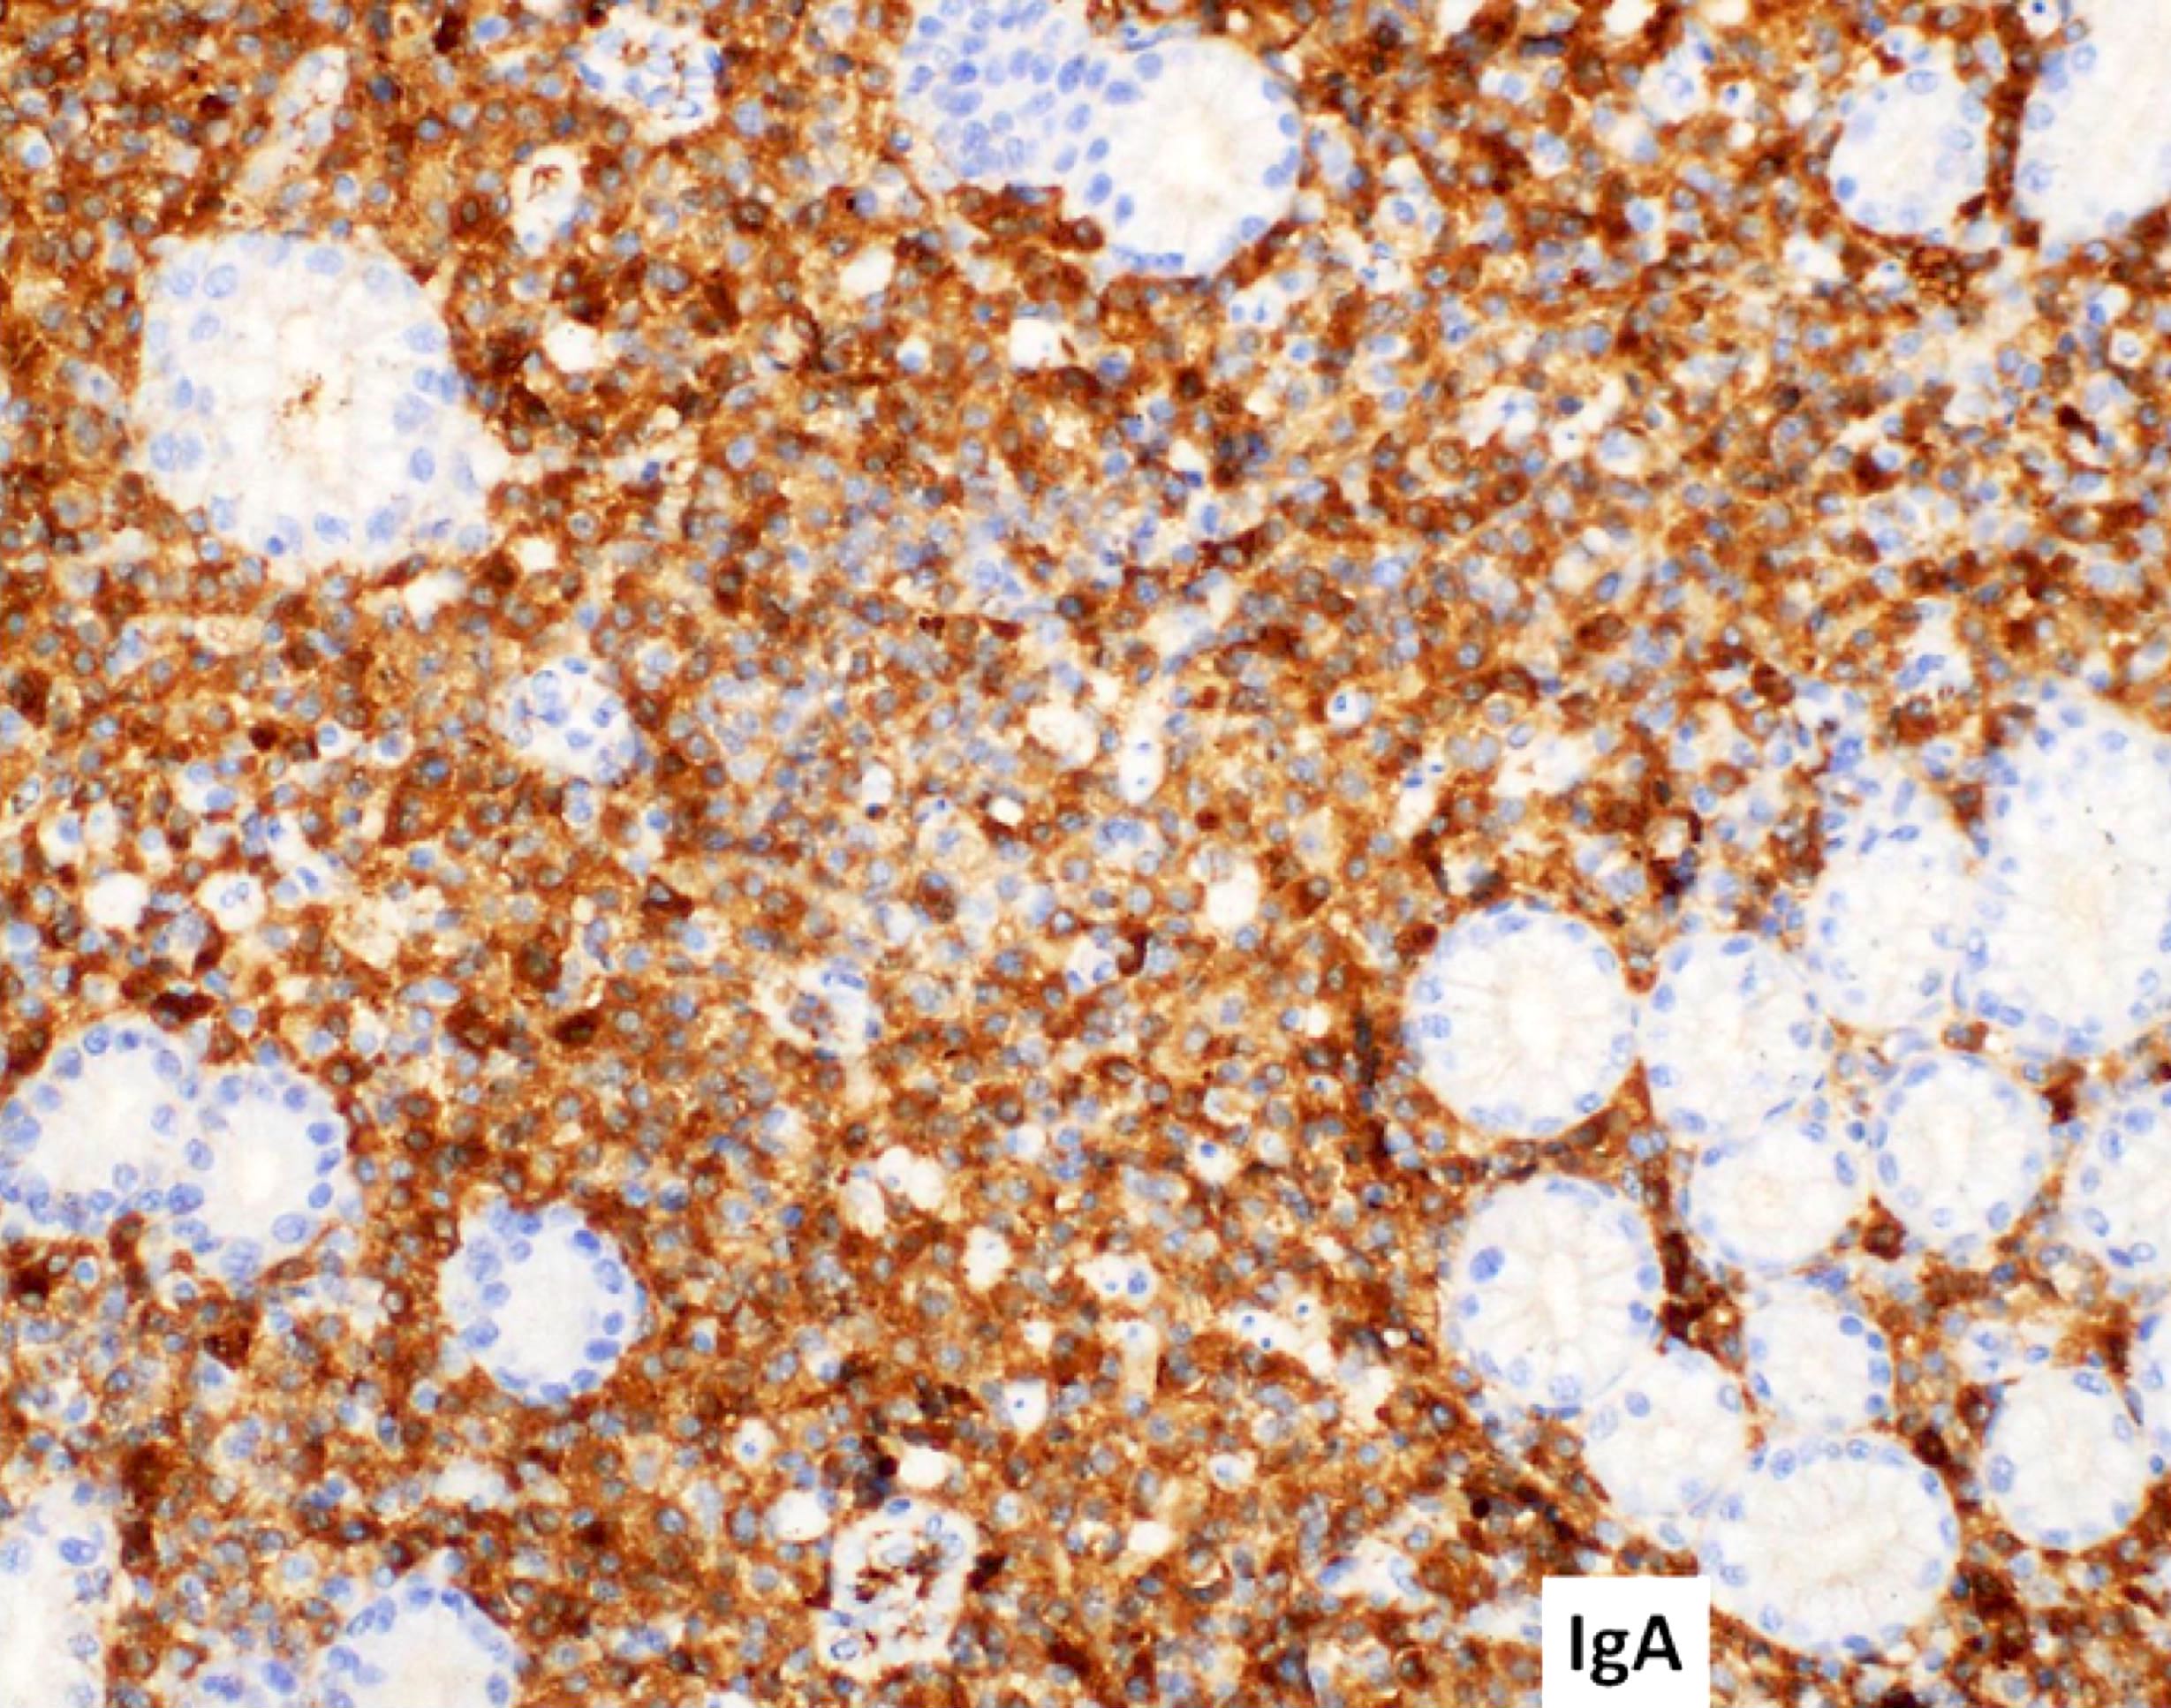
Plasma cells are predominantly positive for cytoplasmic IgA
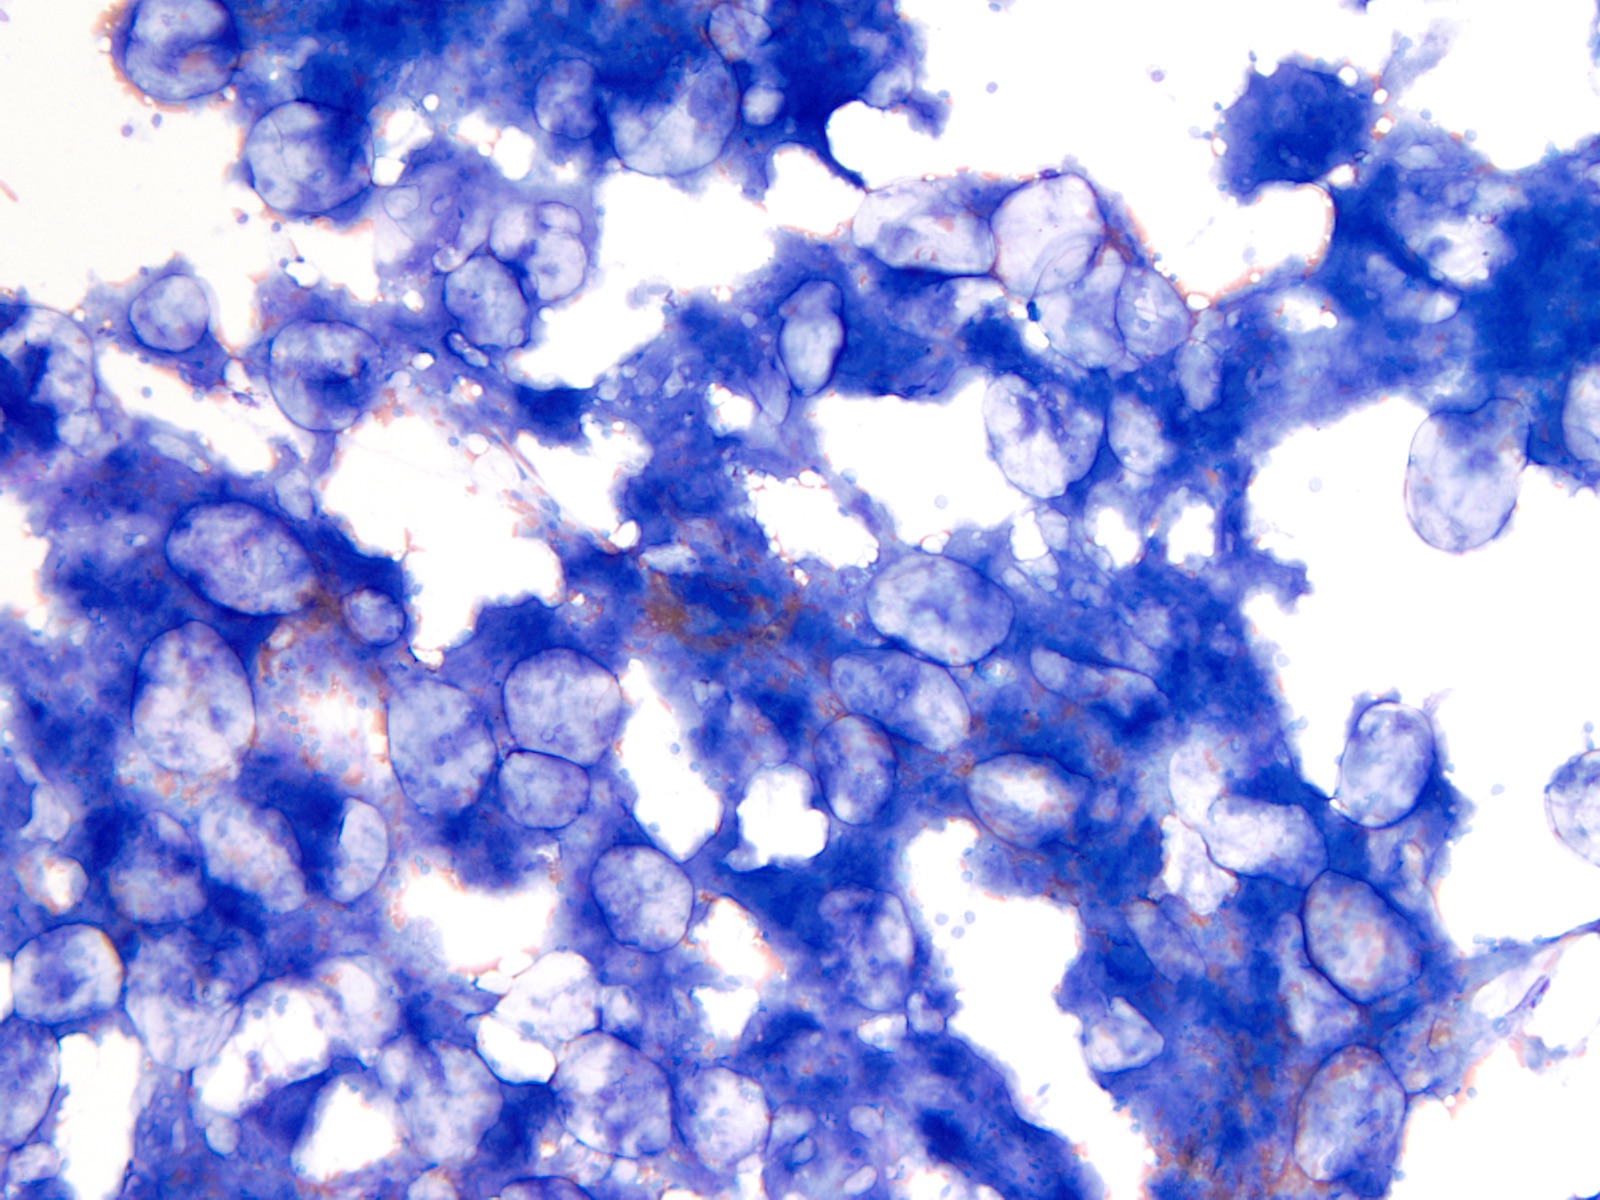
Images hosted on other servers:

Characteristic
intracytoplasmic
vacuoles
AFIP images
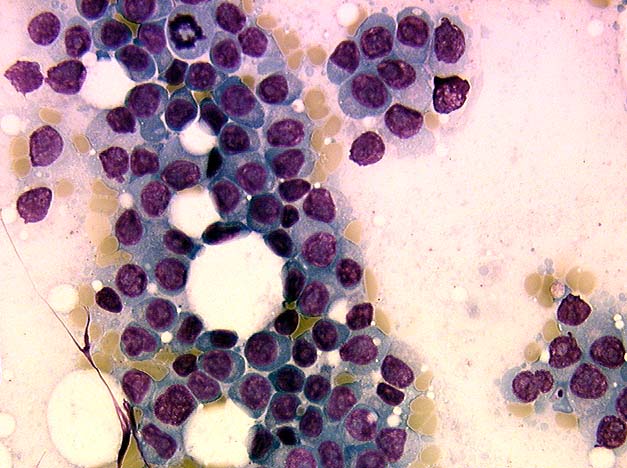
Bone marrow aspirate
AFIP images
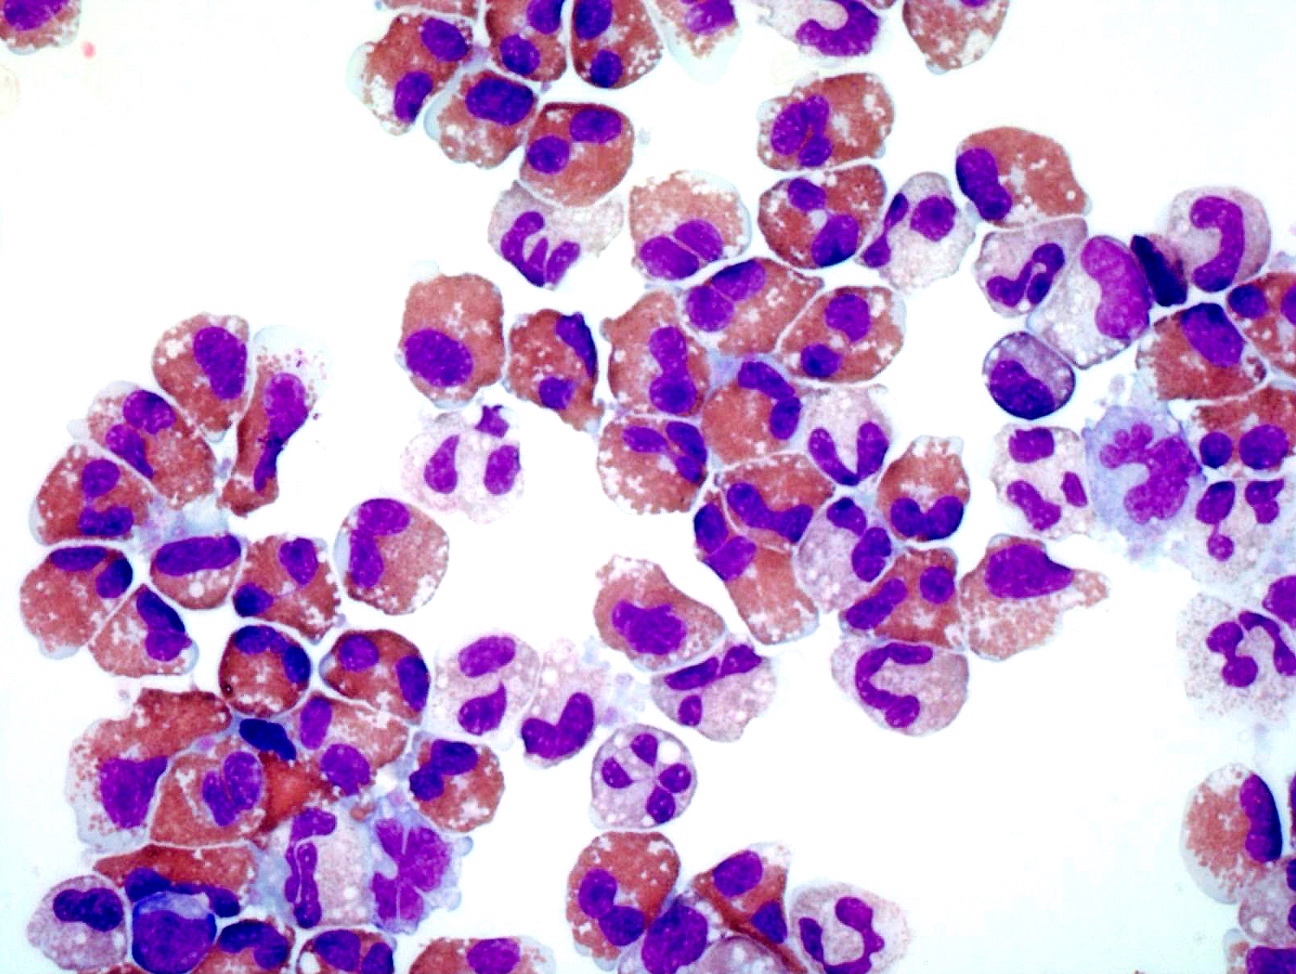
40% eosinophils with normal morphology
Images hosted on other servers:

Structure of PCM1-JAK2 translocation
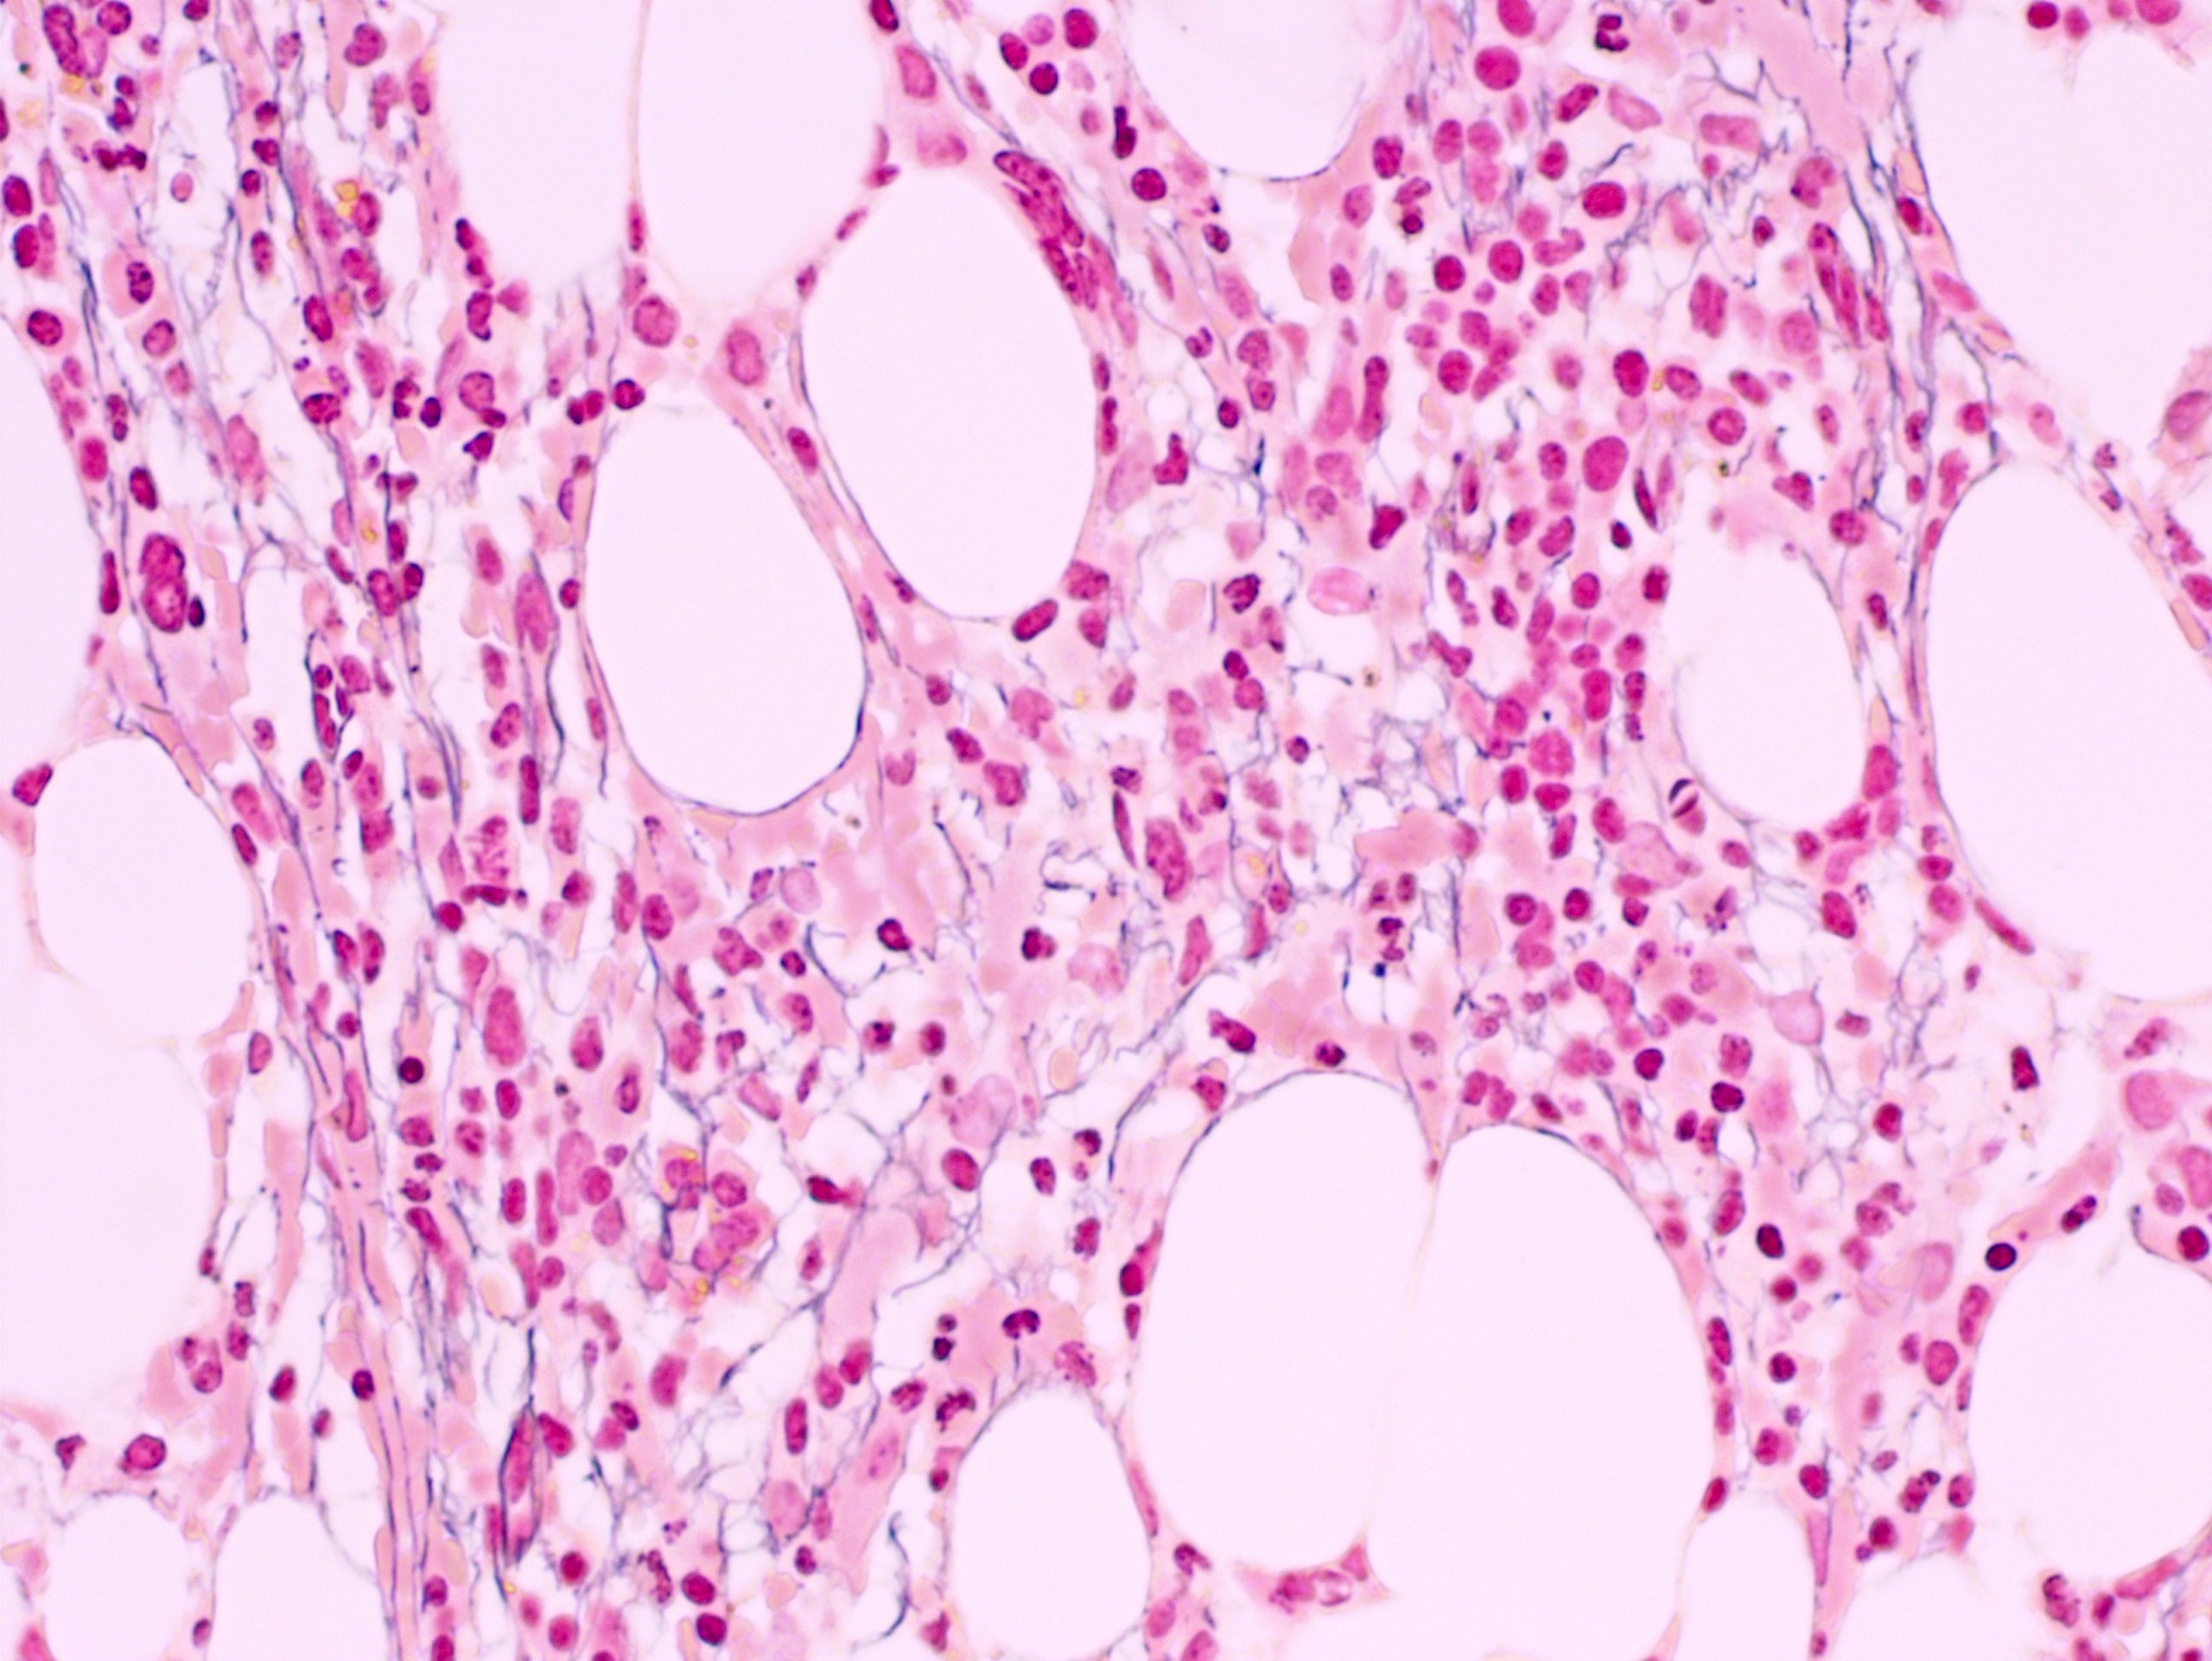
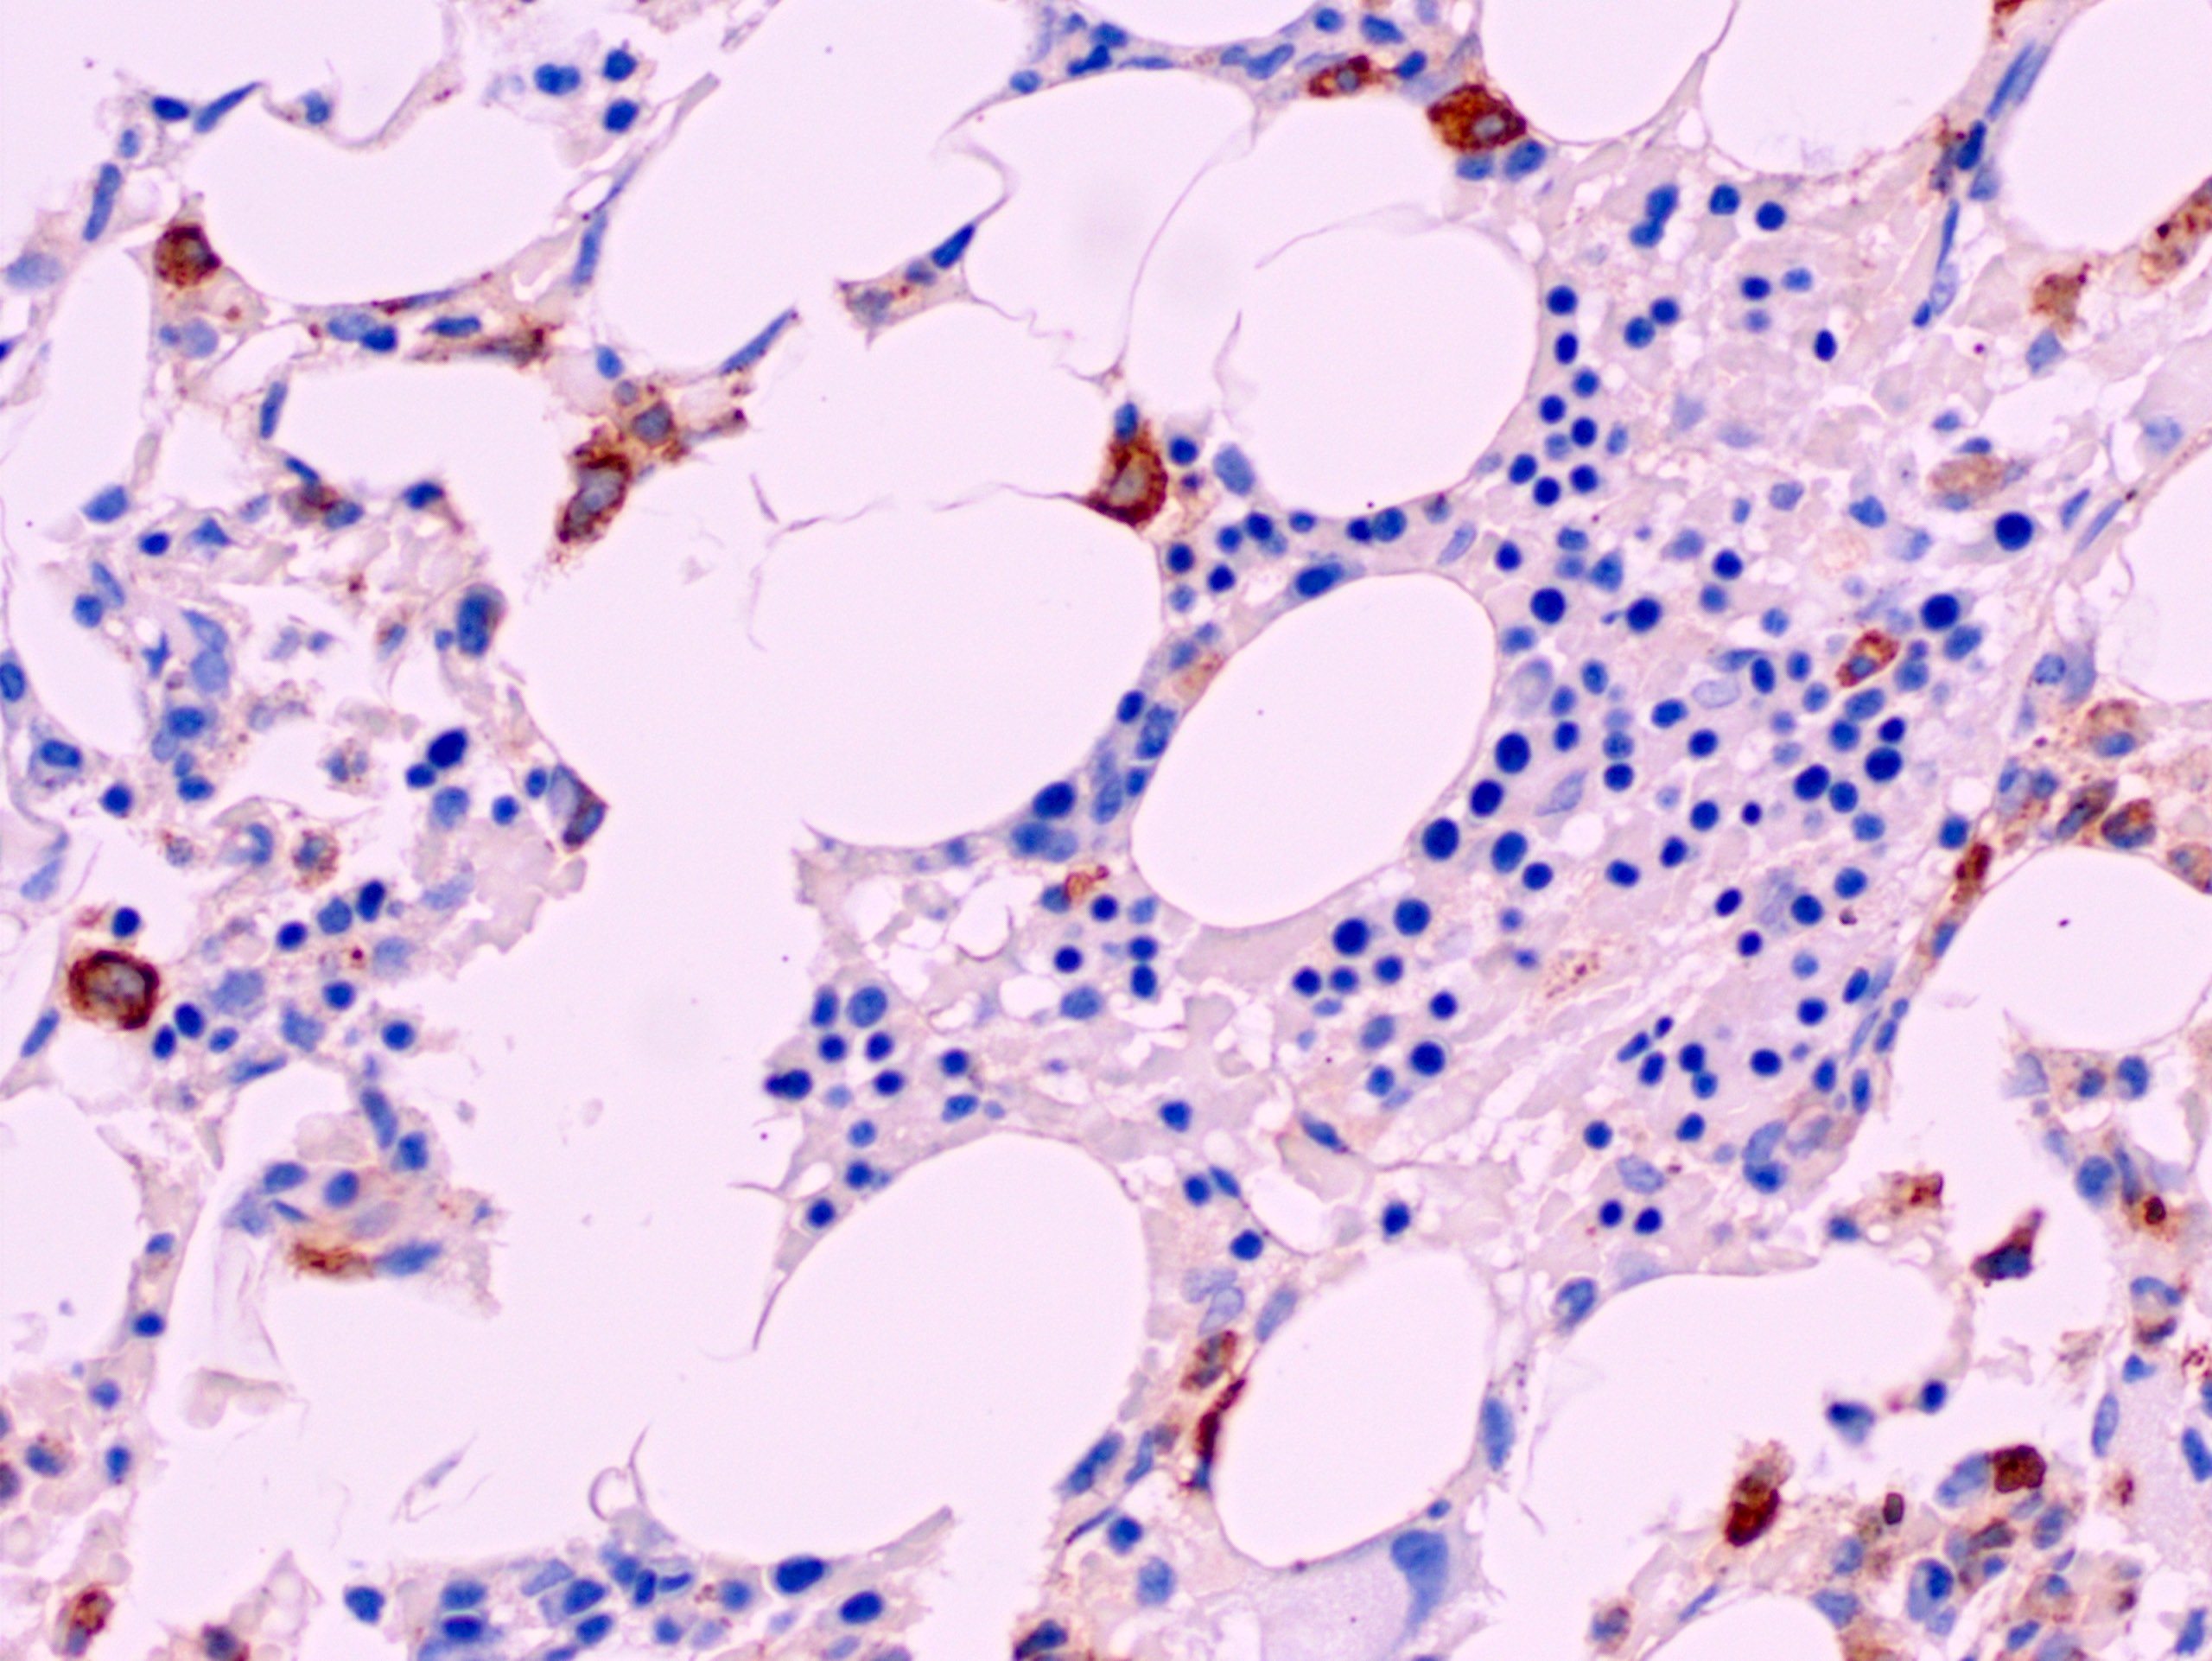
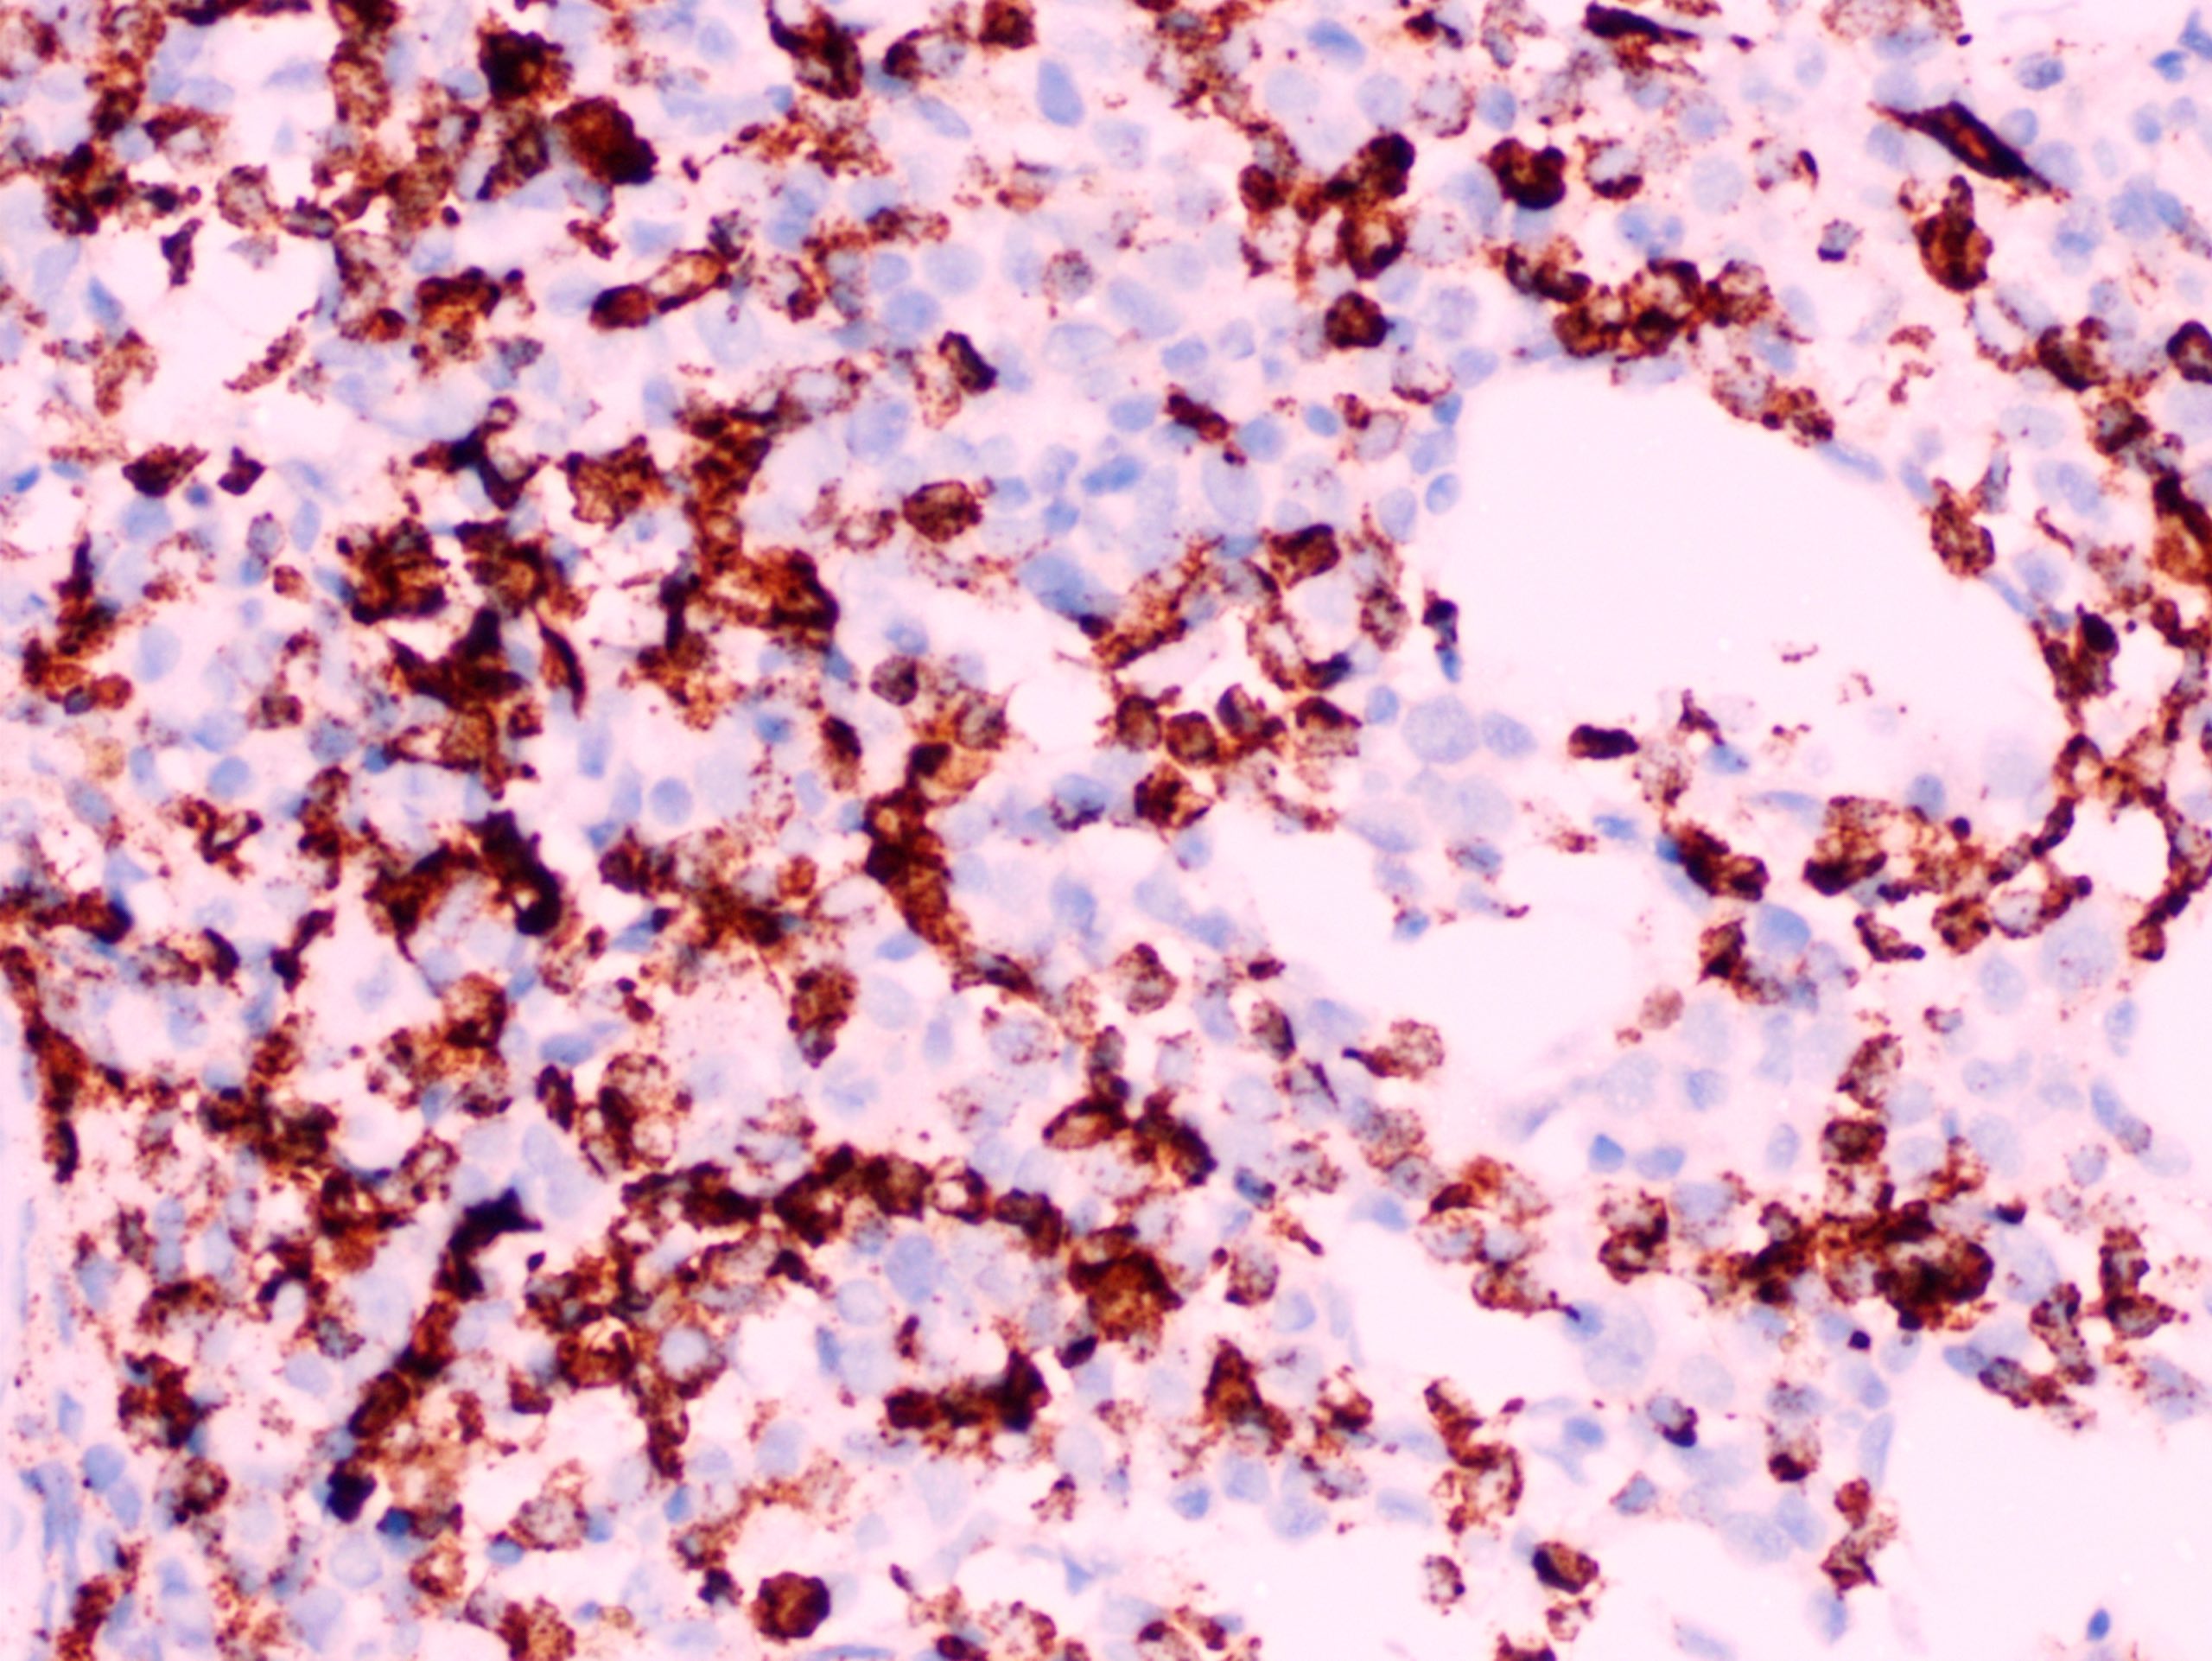
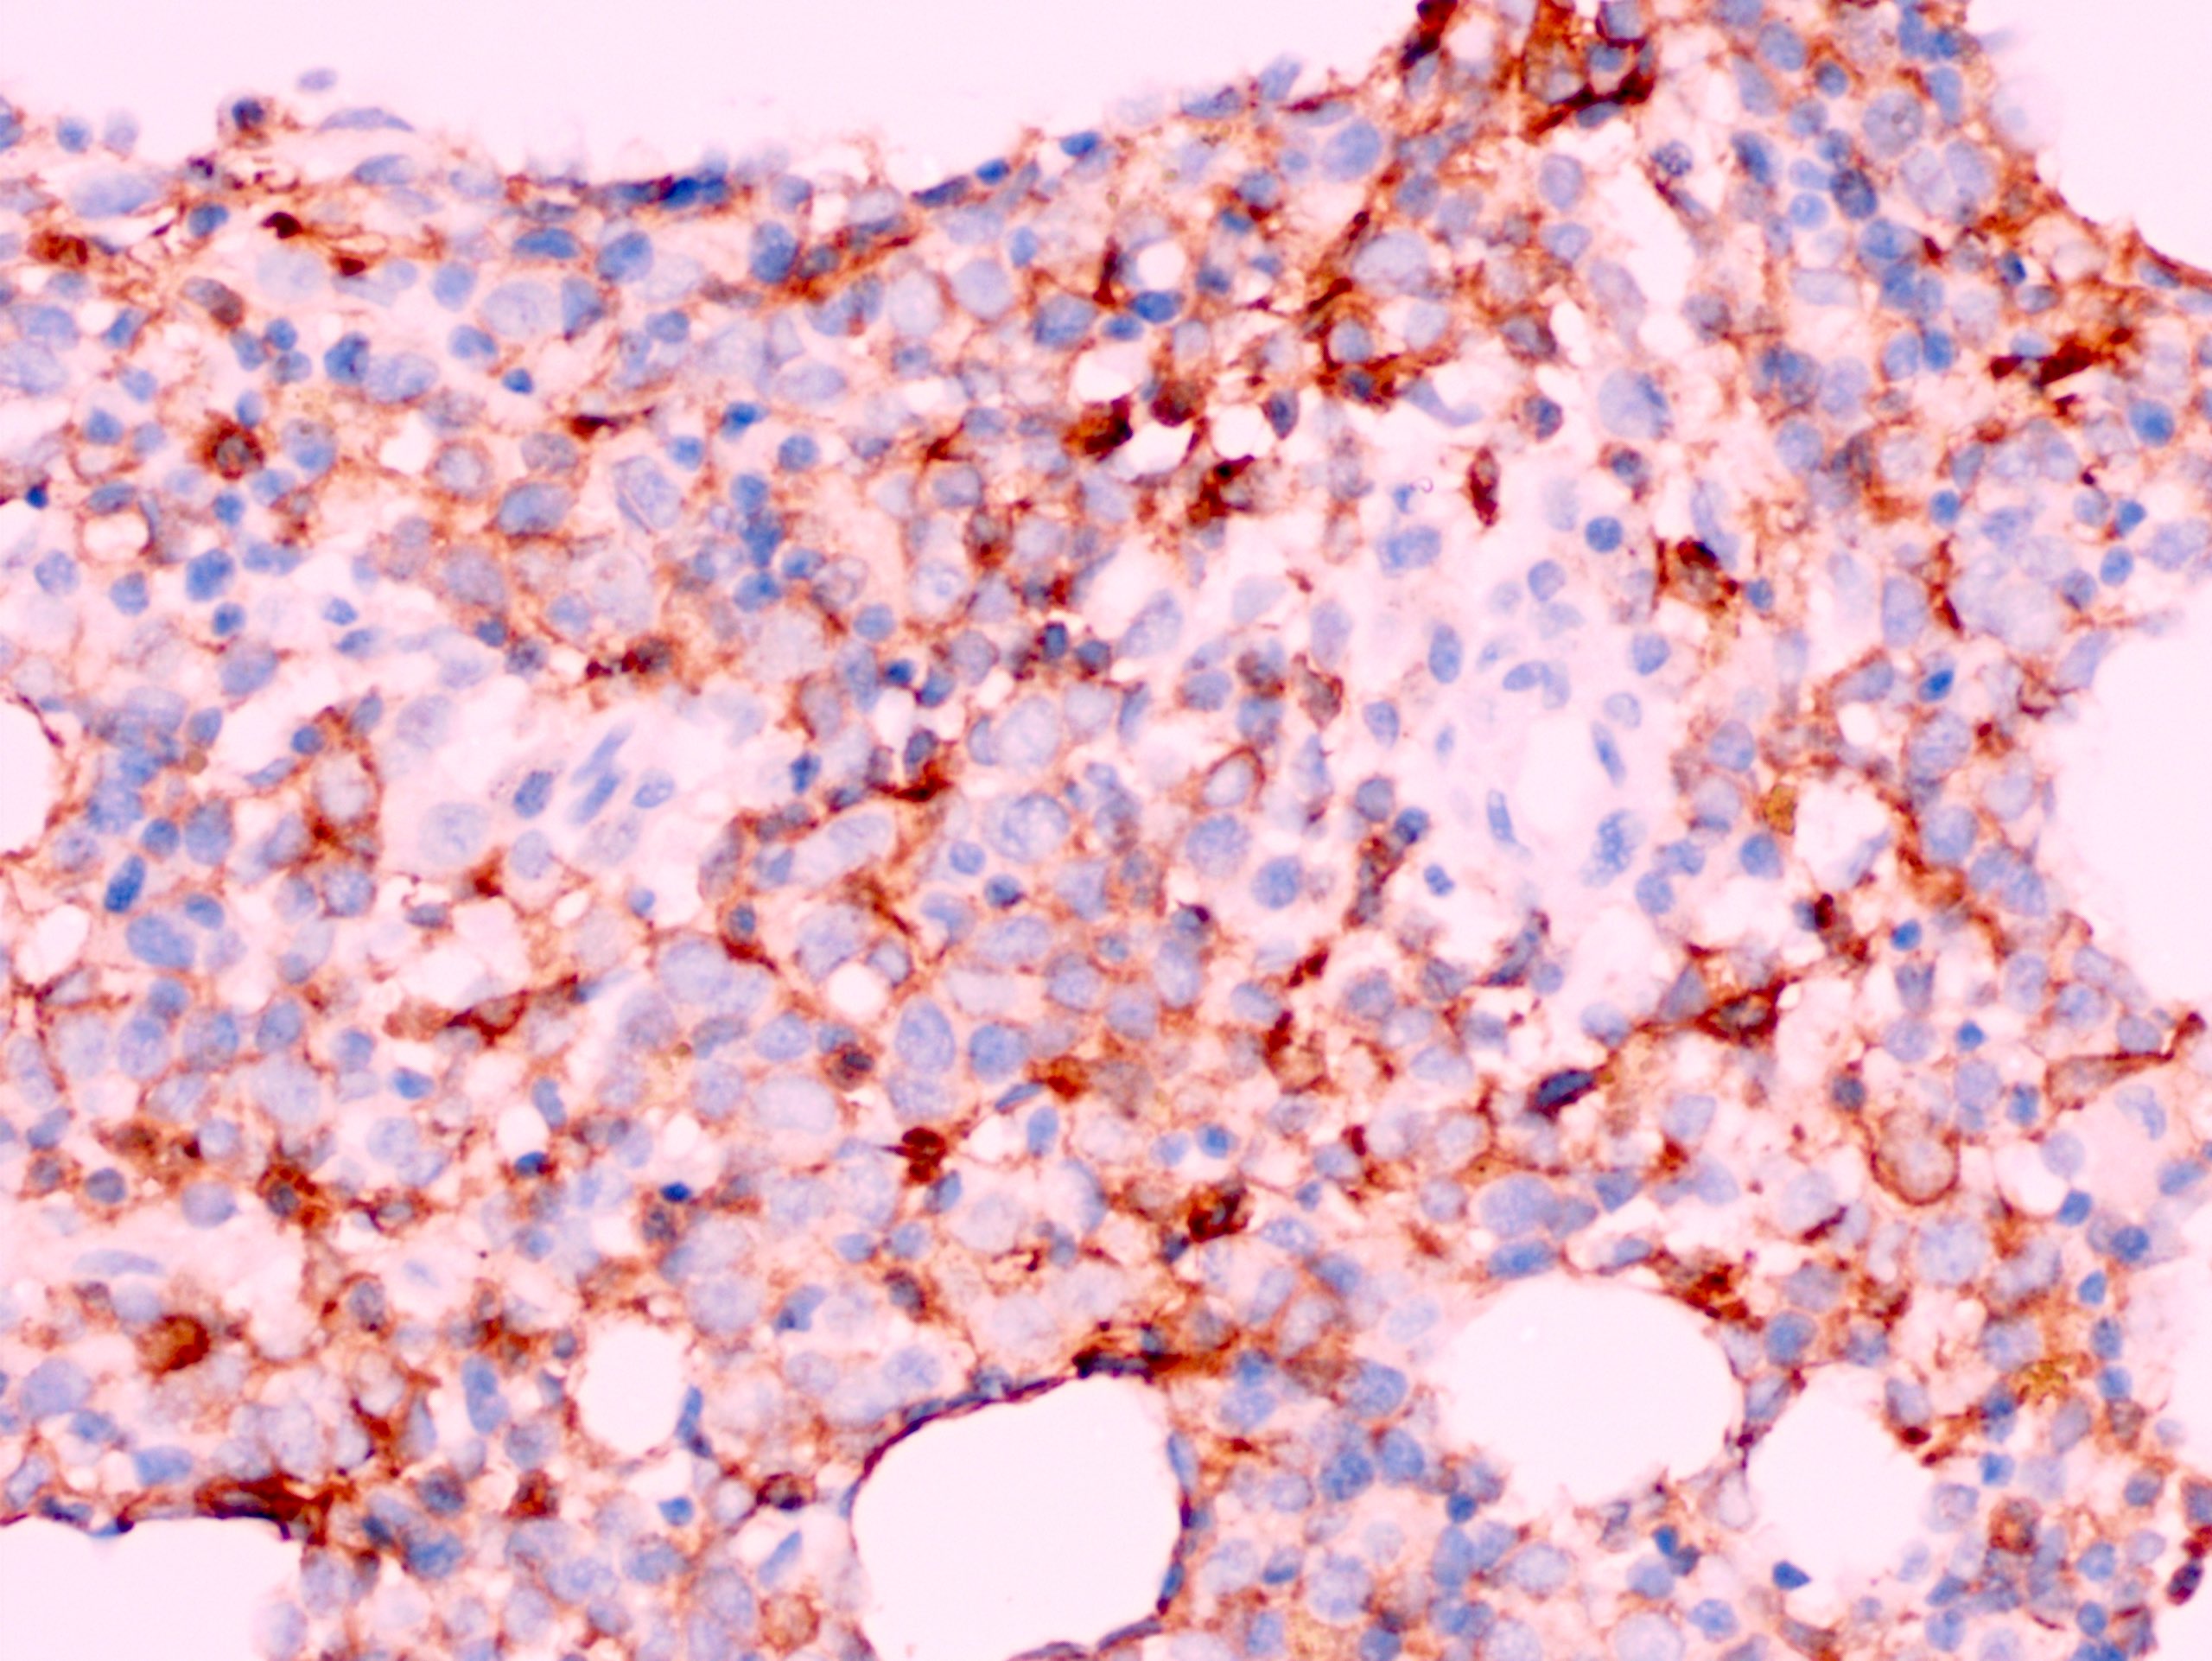
Contributed by Zeba N. Singh, M.B.B.S., M.D.

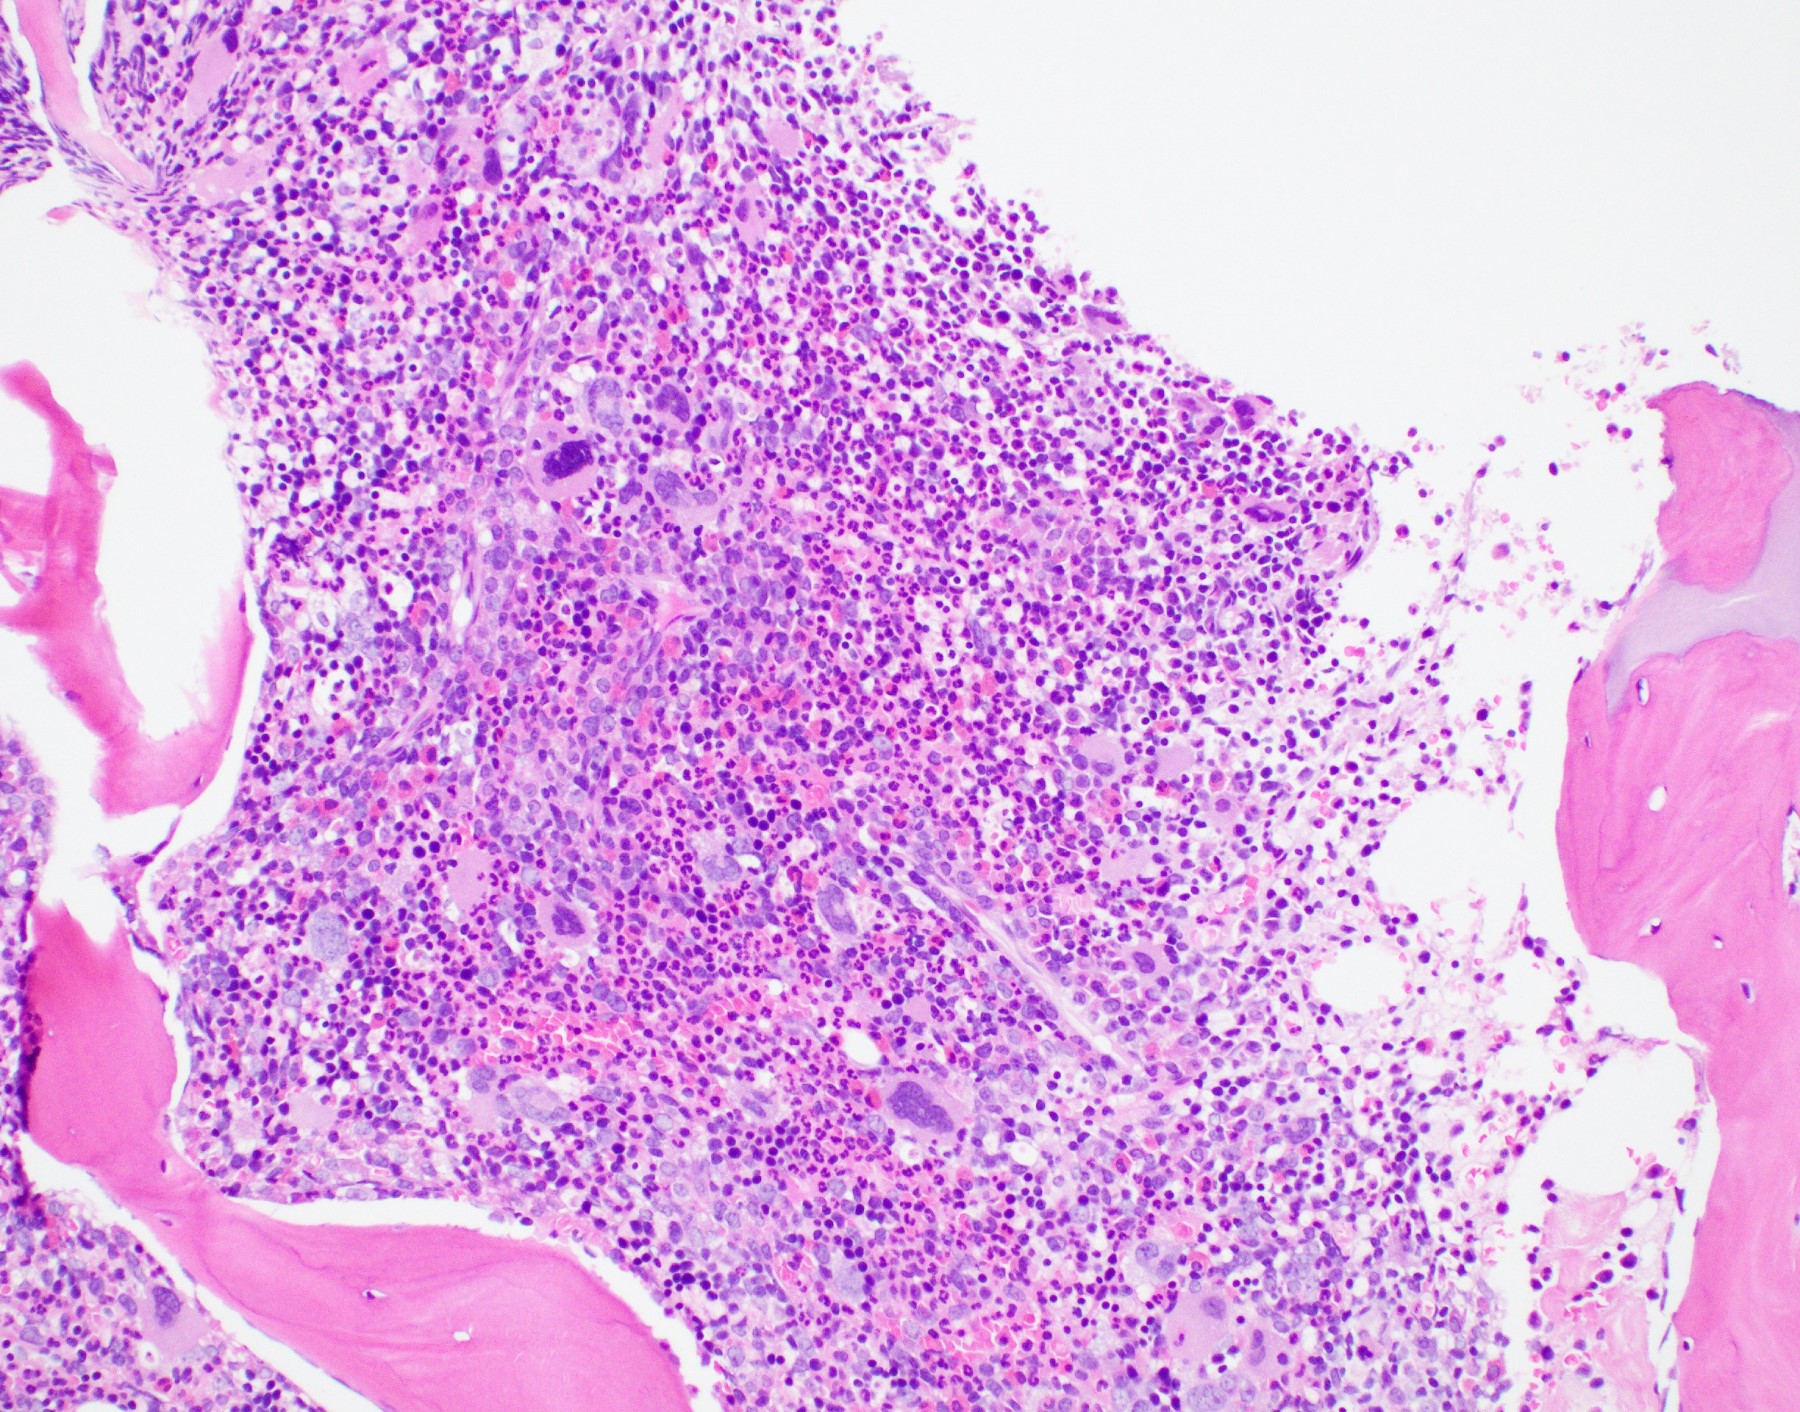
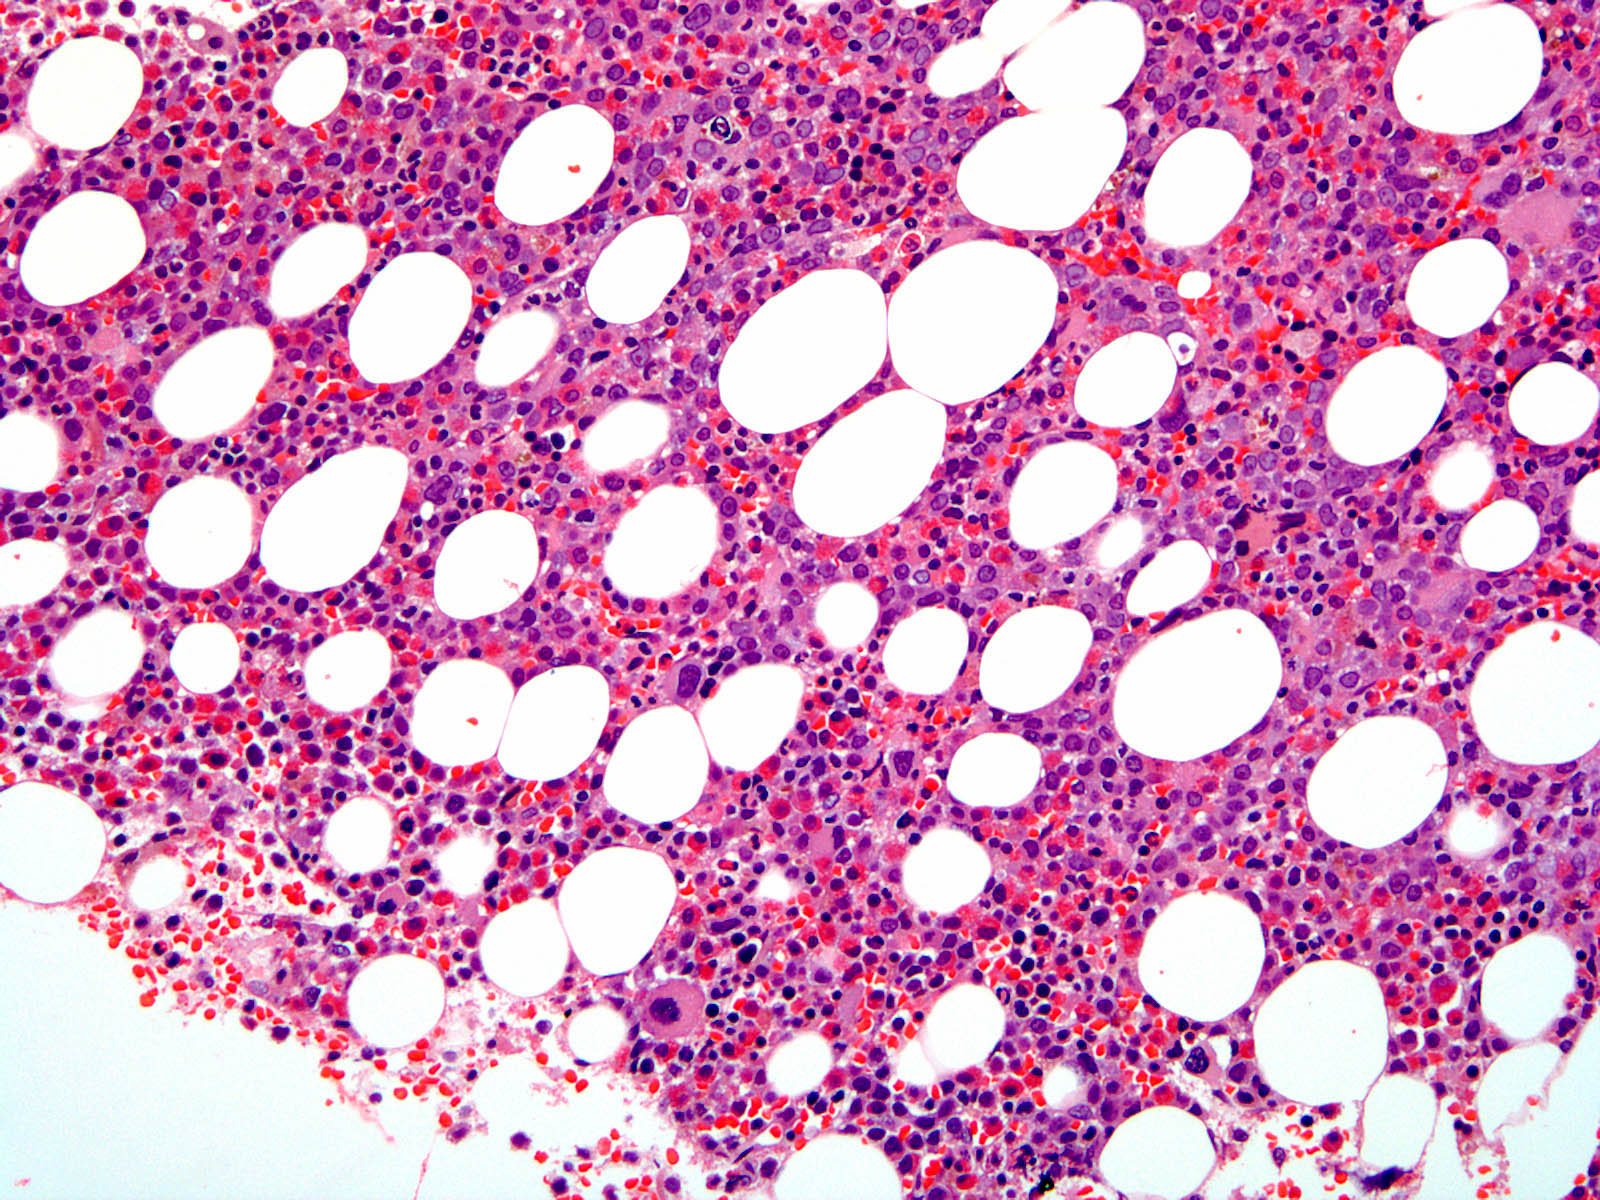
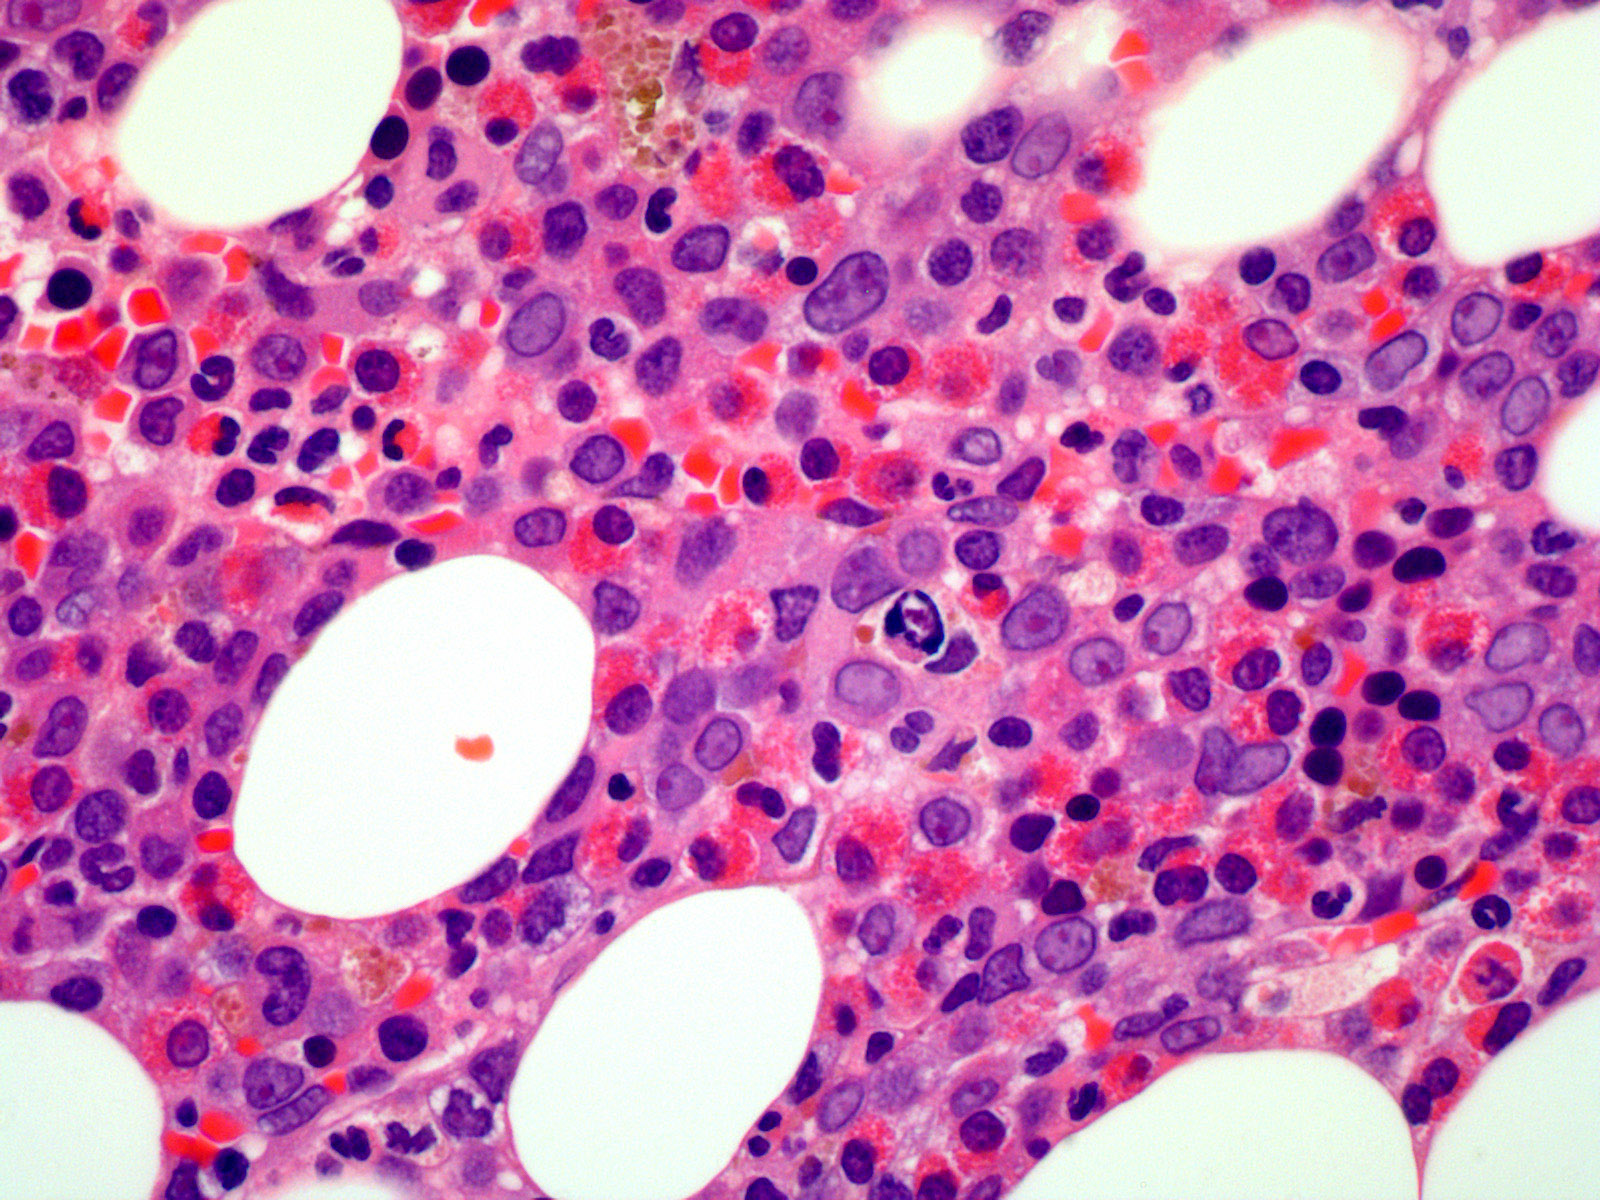
Markedly hypercellular bone marrow

Megakaryocytic atypia
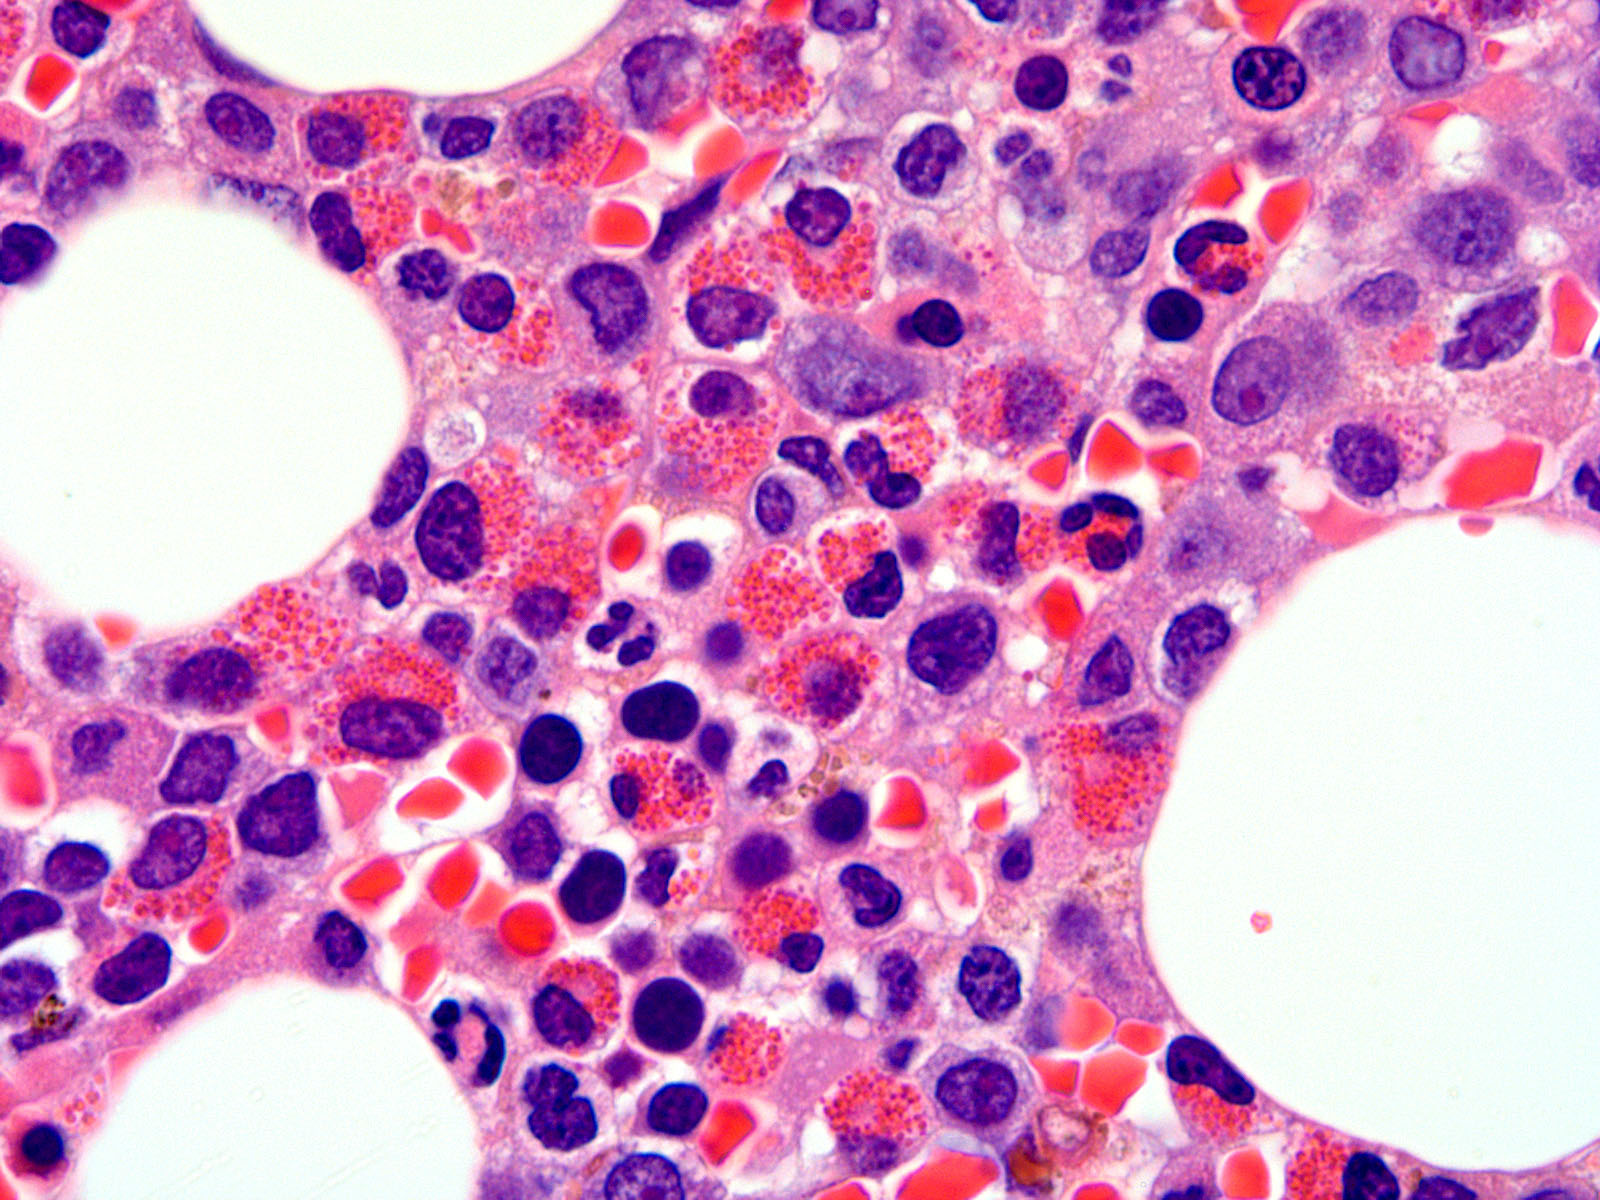
Bone marrow eosinophilia
Large aggregate of early erythroid precursors
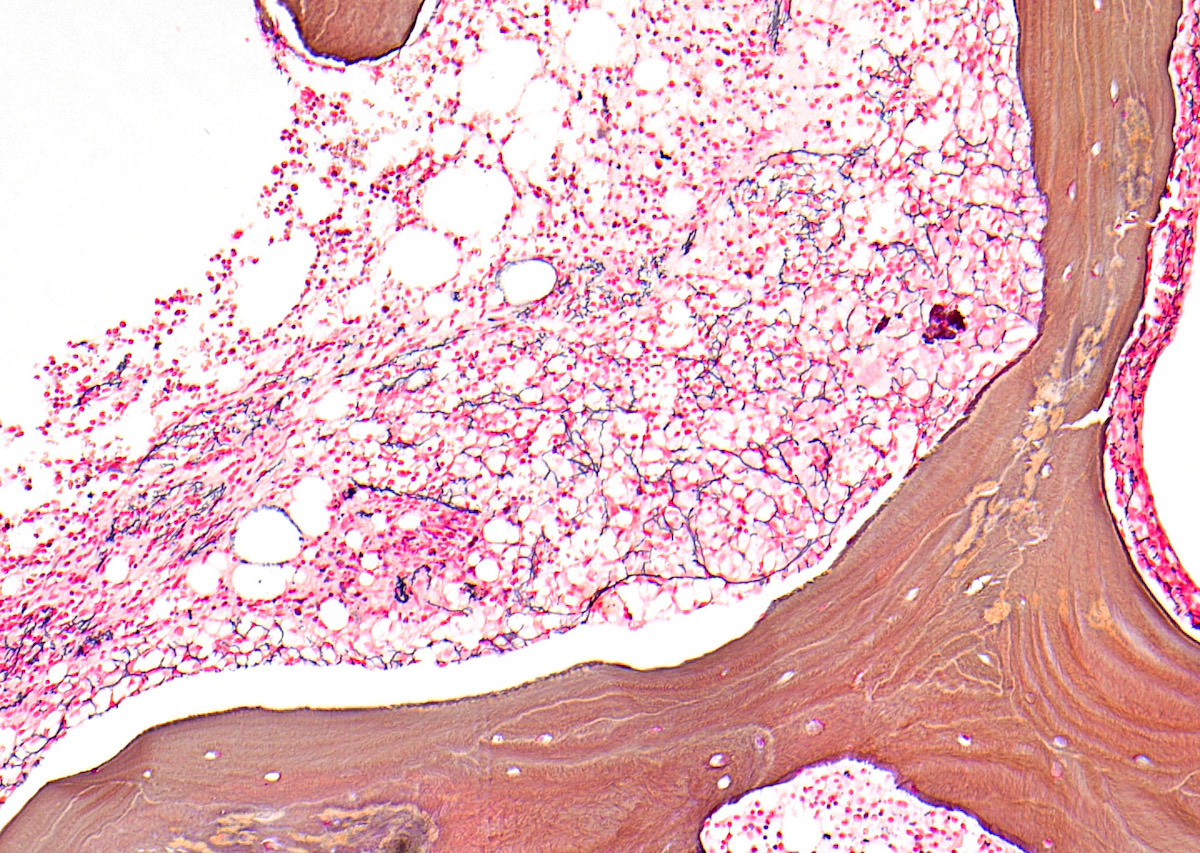
Reticulin fibrosis

CD34 immunostain
Contributed by Zeba N. Singh, M.B.B.S., M.D.
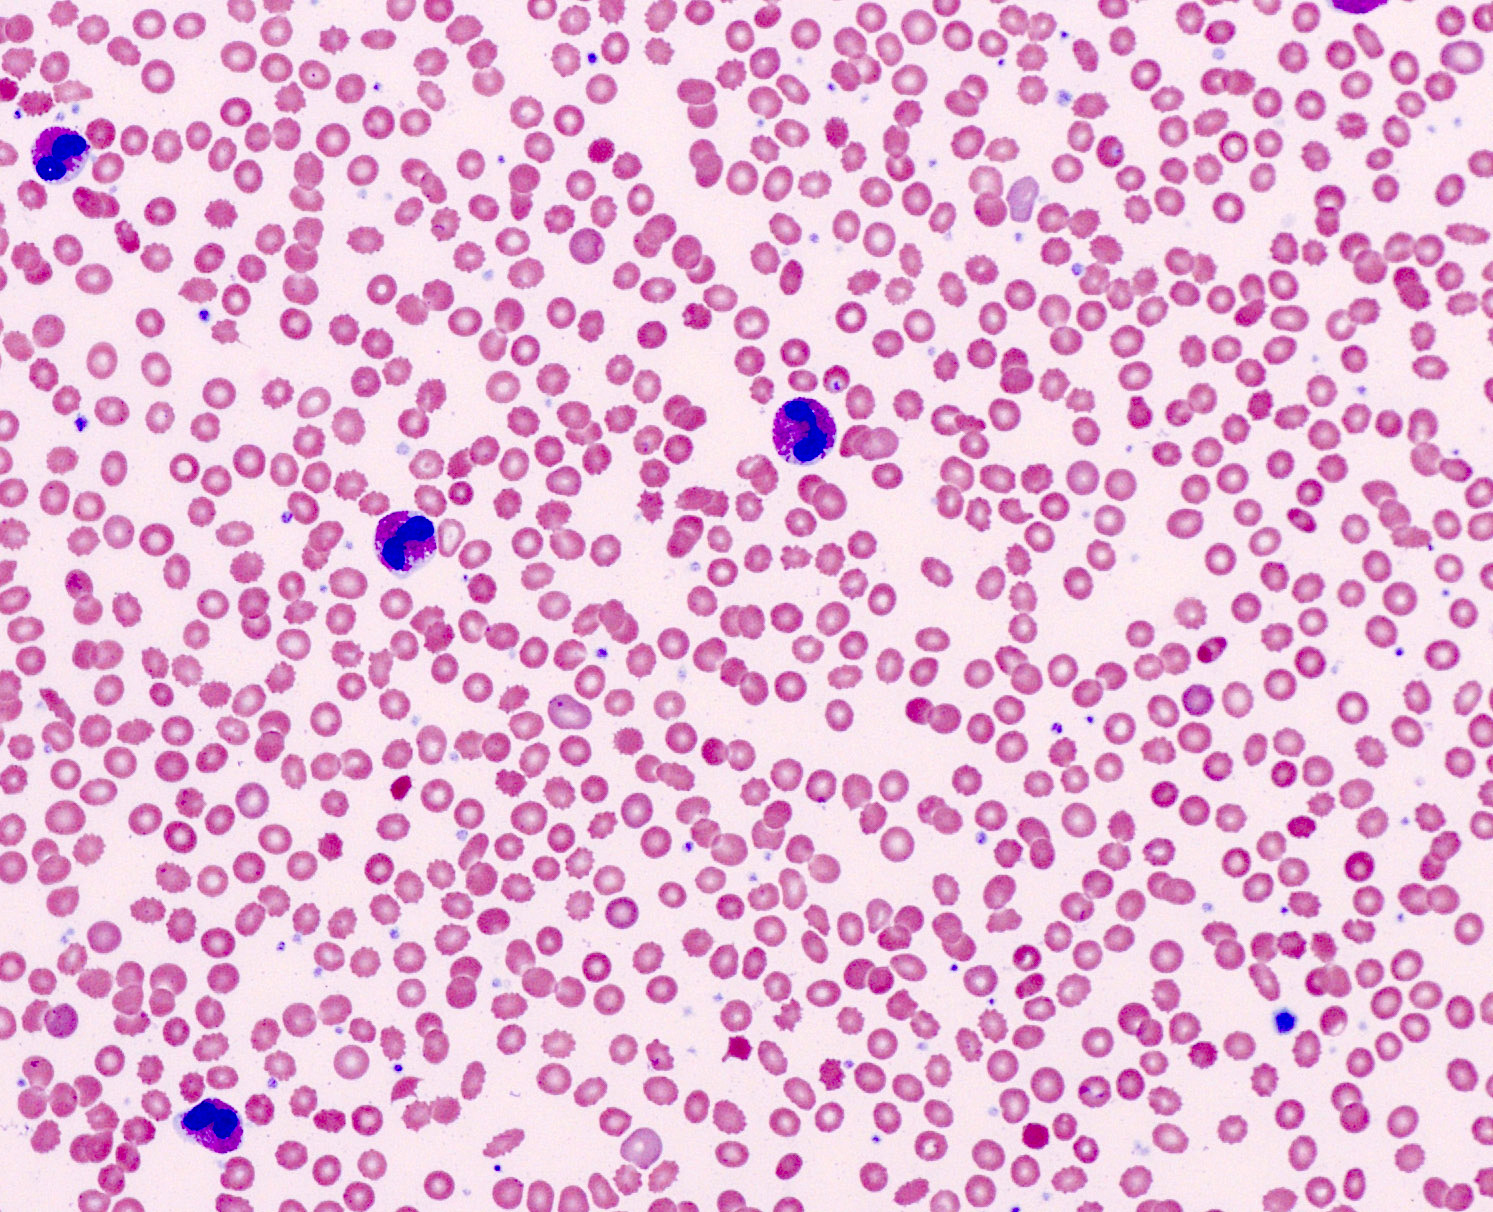
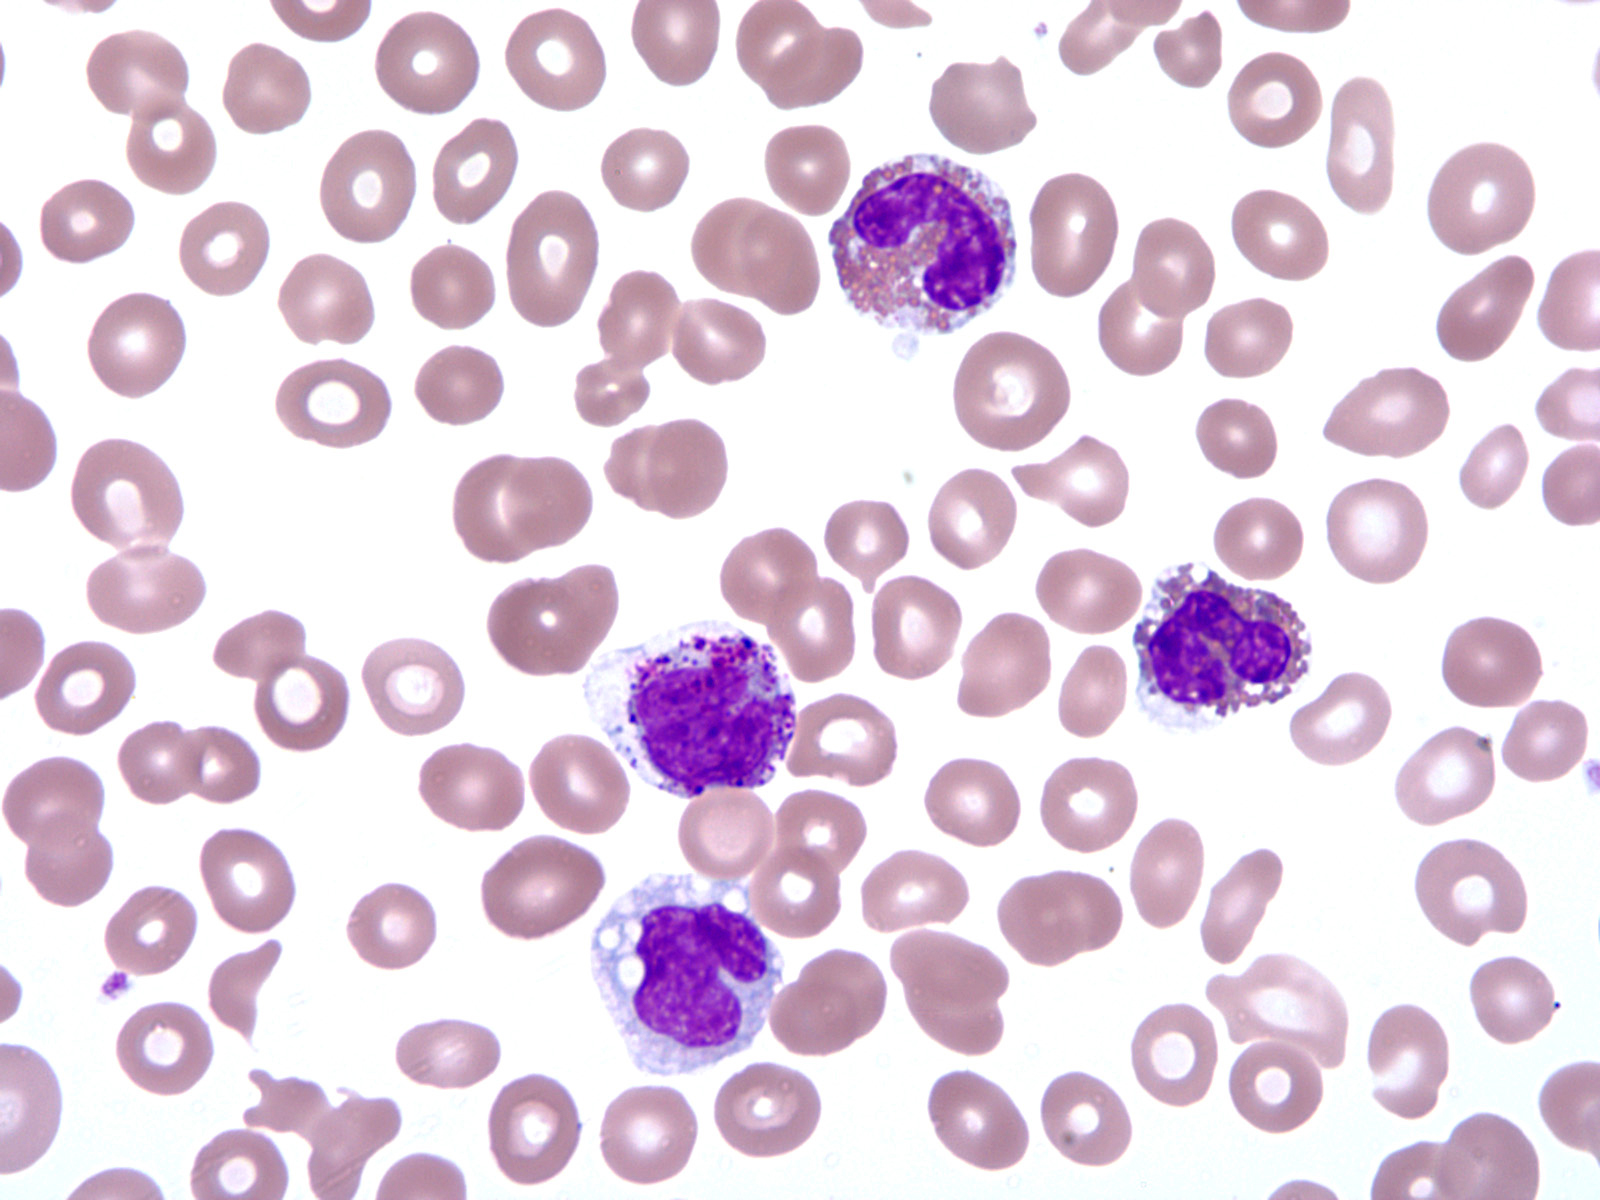
Peripheral blood eosinophilia
Images hosted on other servers:
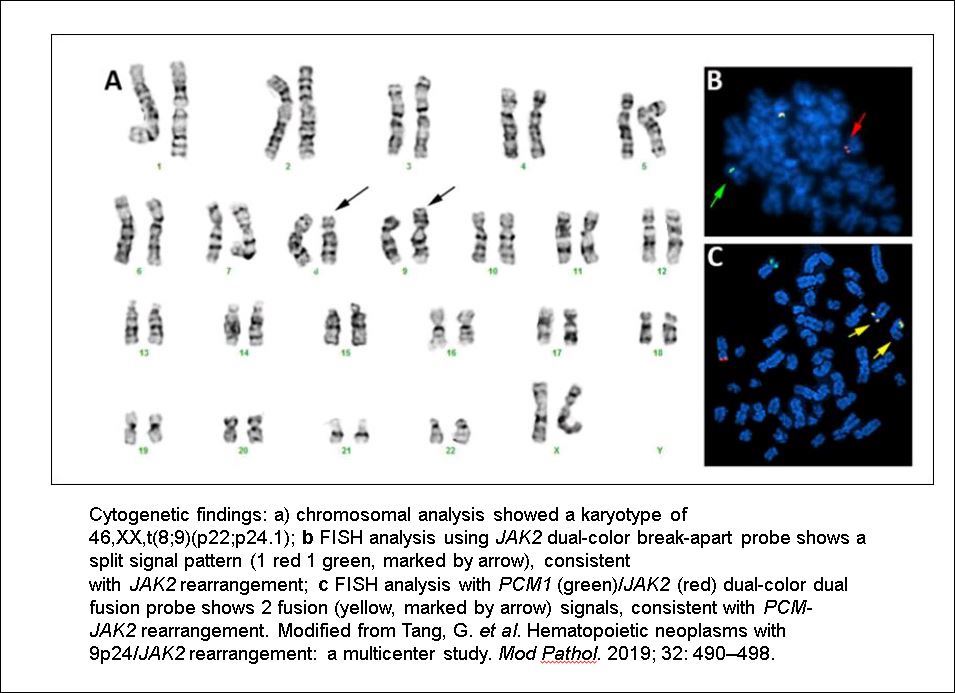
Karyogram and FISH analysis
Contributed by Alexa J. Siddon, M.D. and AFIP
Hypercellular marrow
Myeloid predominant marrow
Aspirate with monocytes and promonocytes
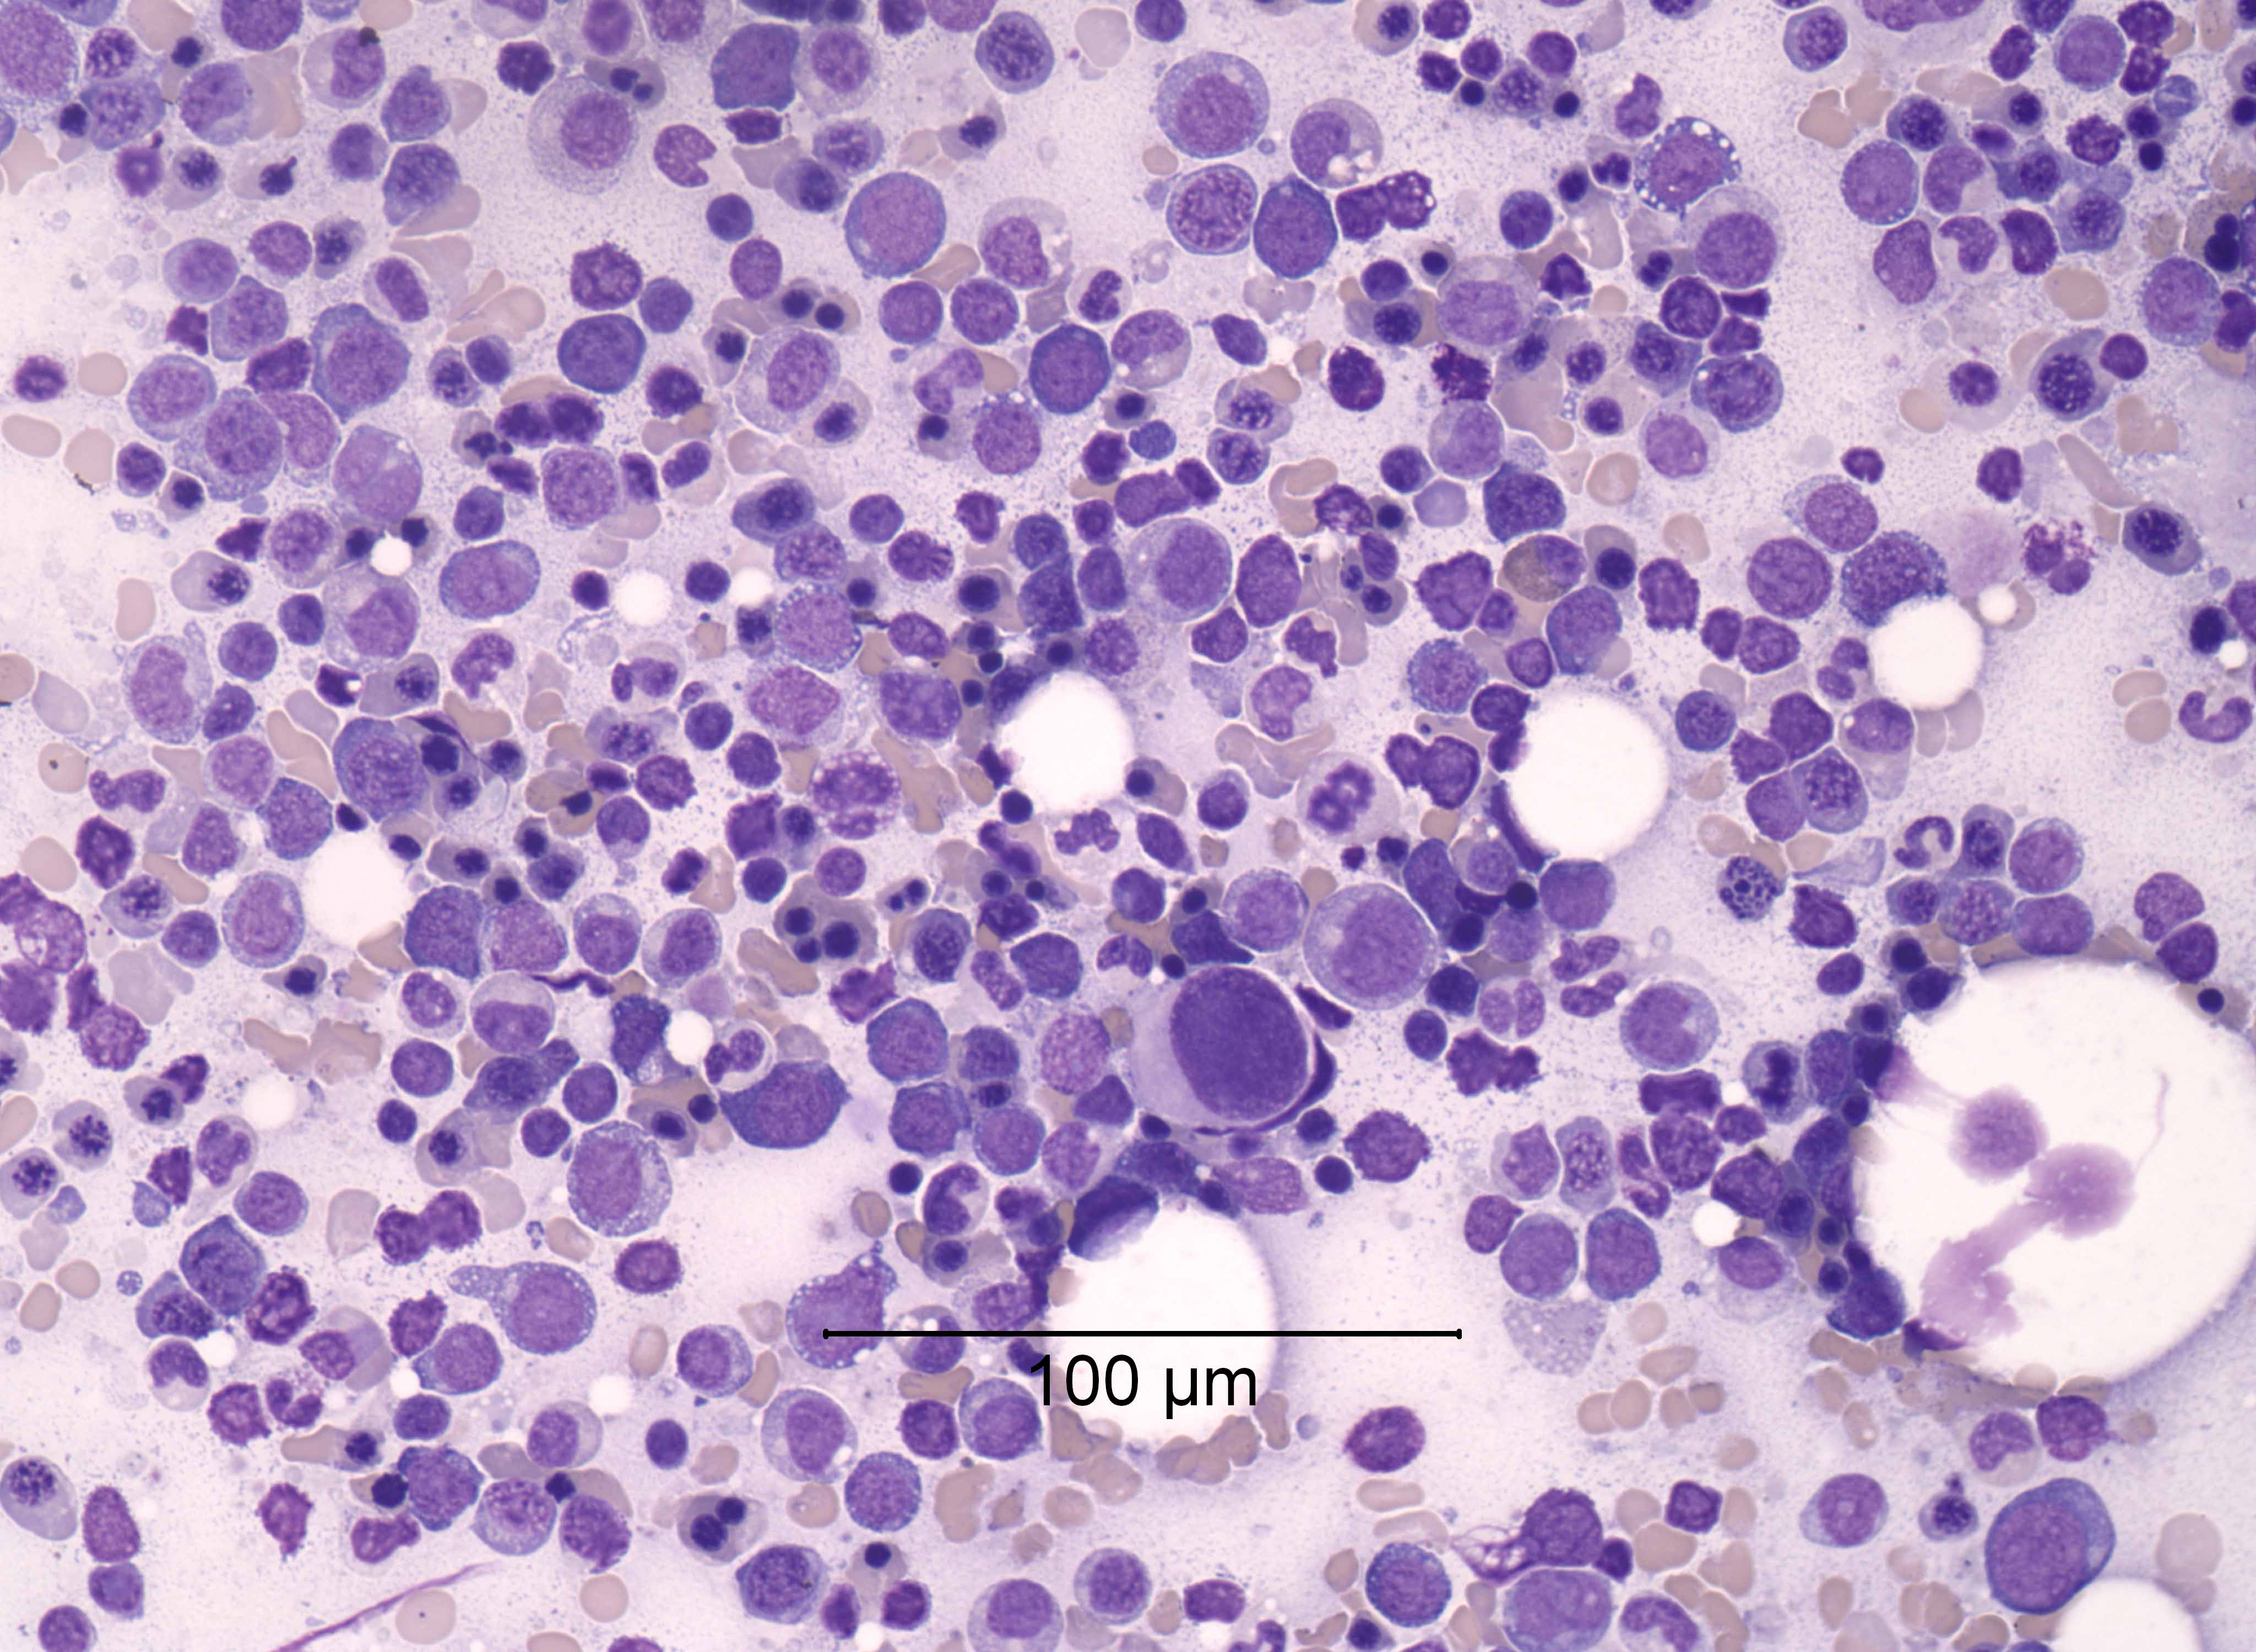
AFIP images
Blood shows mature monocytes and neutrophils
AFIP images

Abundant cytoplasm with azurophilic granules
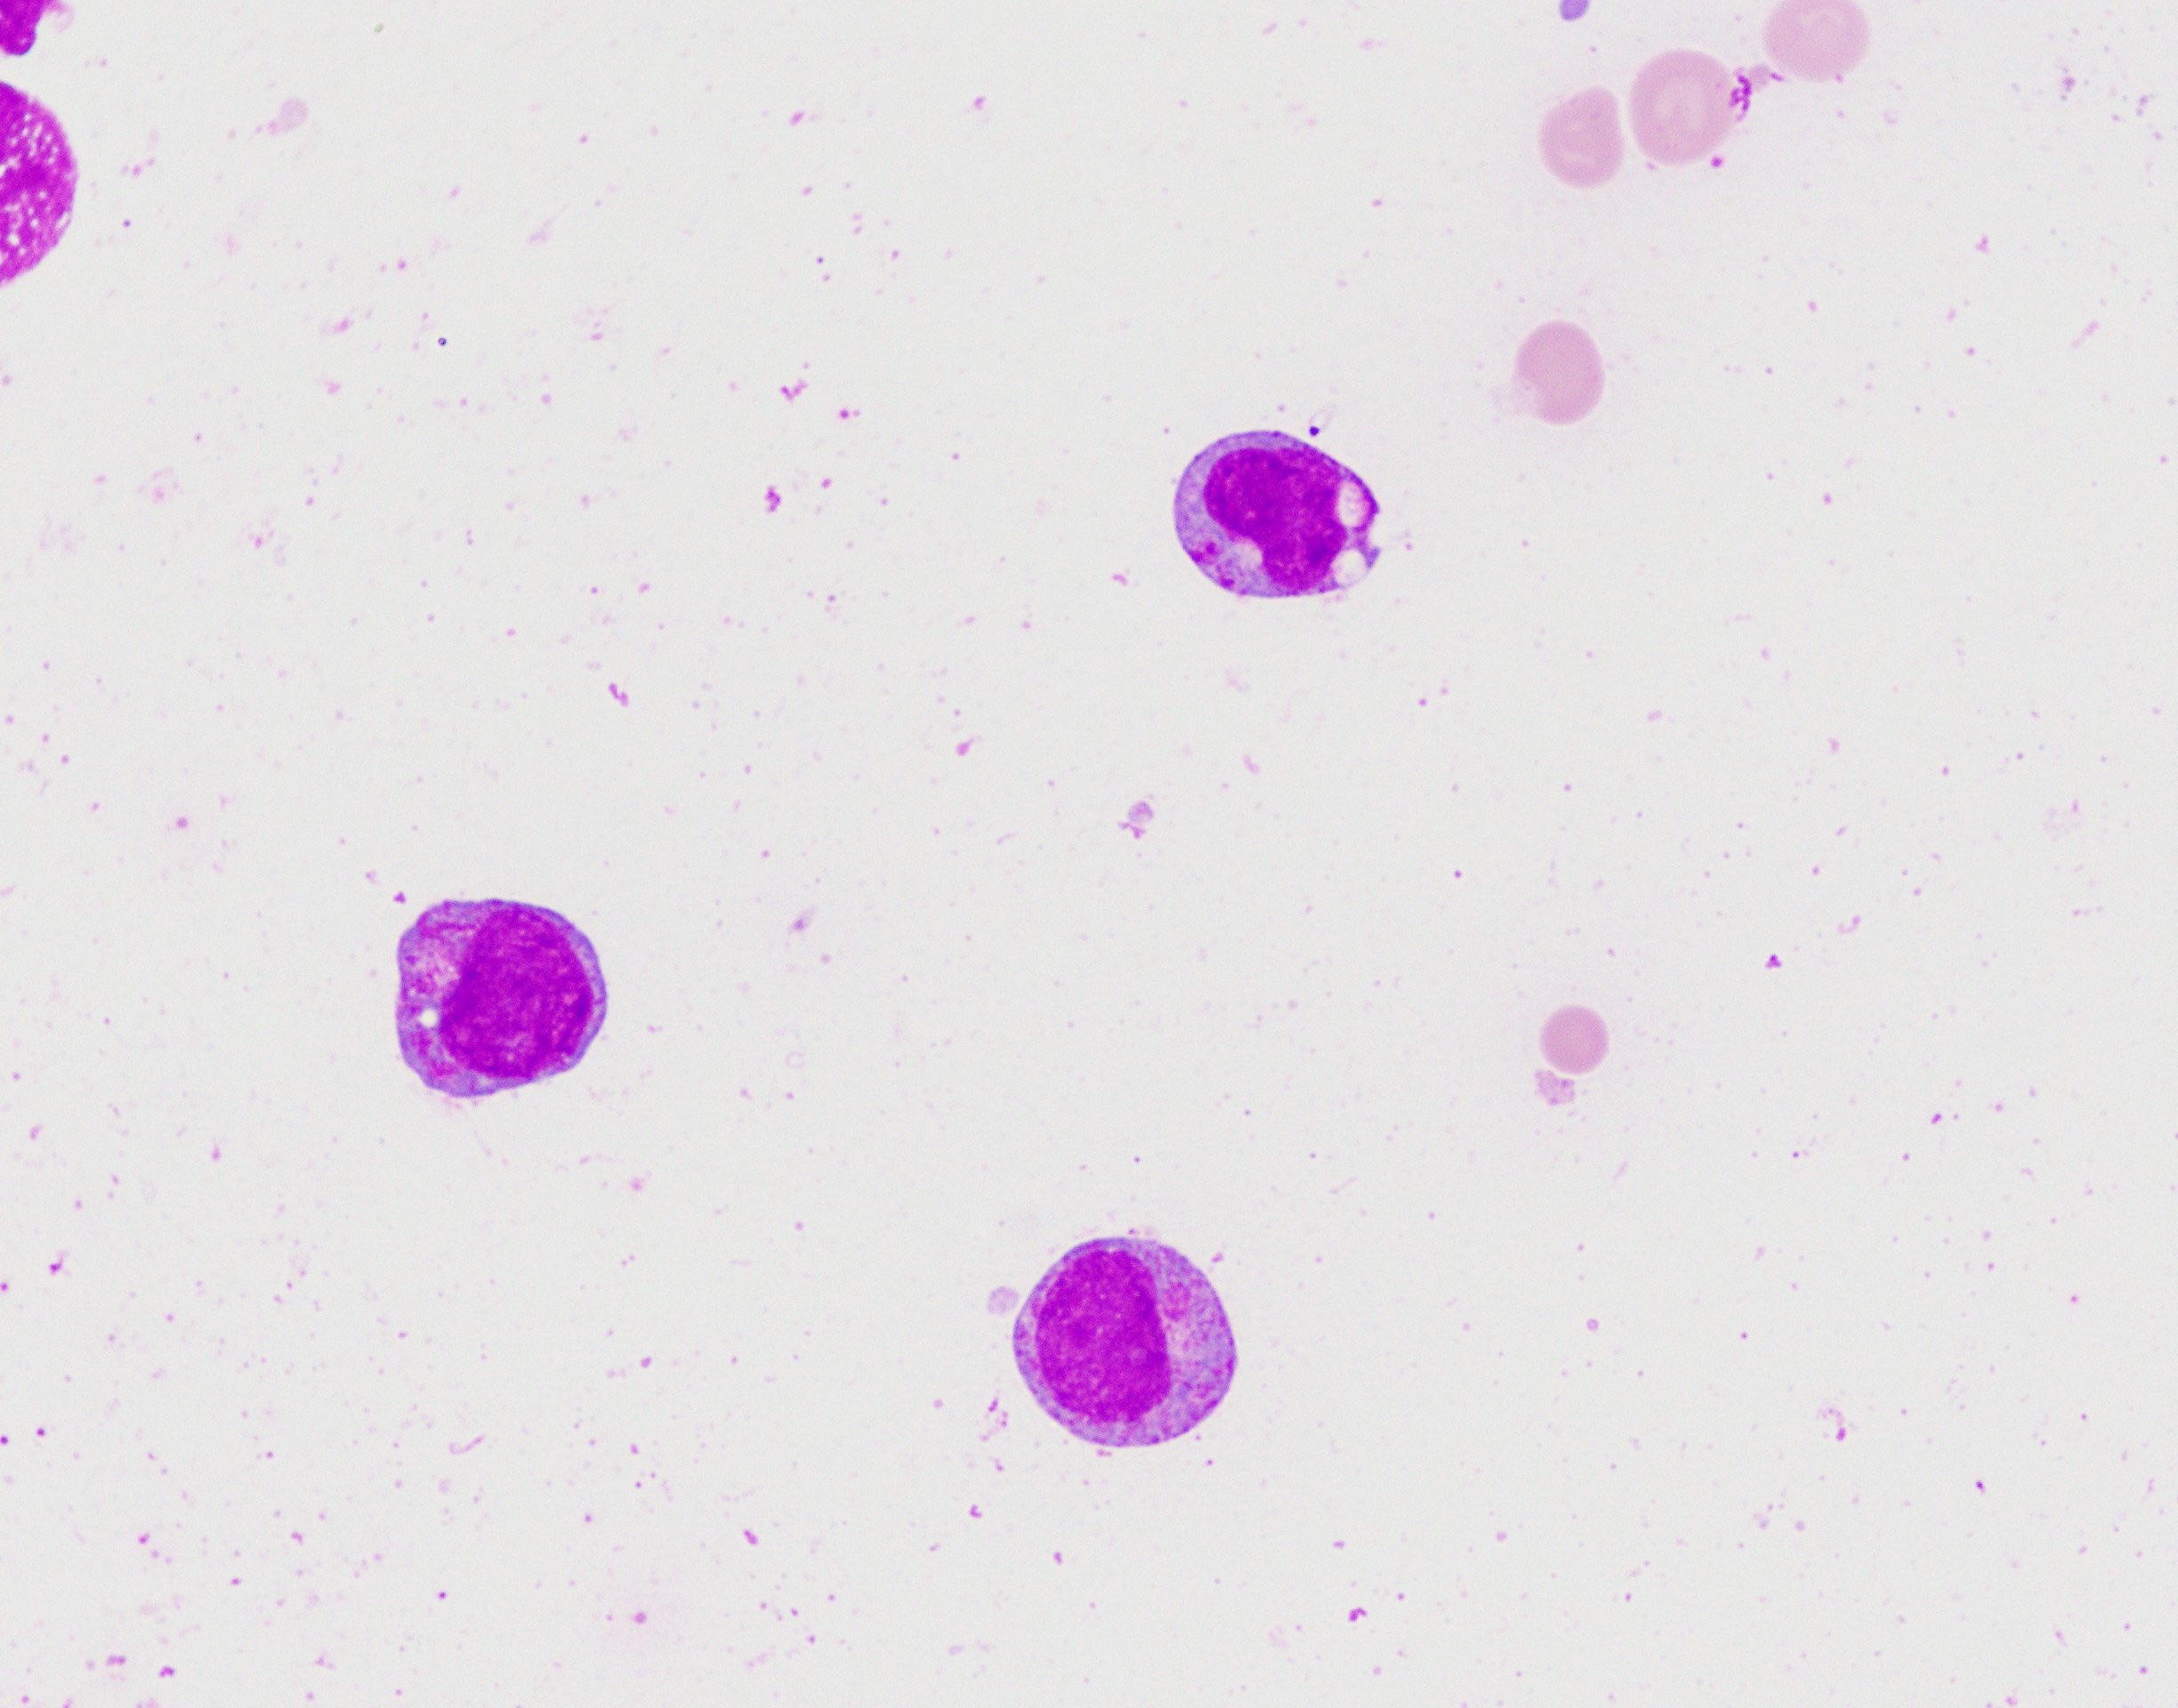
Monoblasts are large with abundant cytoplasm
Some monoblasts also show pseudopods
Monoblasts have variable cytoplasm
Monoblasts and promonocytes
Marrow completely replaced by monoblasts
Monoblasts are large with abundant pale cytoplasm
Large monoblasts with abundant cytoplasm
Nonspecific esterase positive
CD68 #1 (KP-1) positive
PAS positive
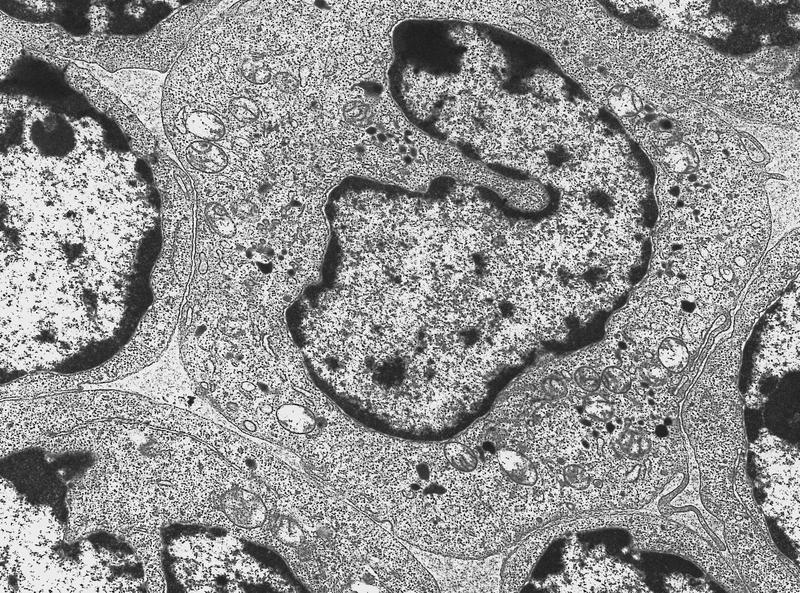
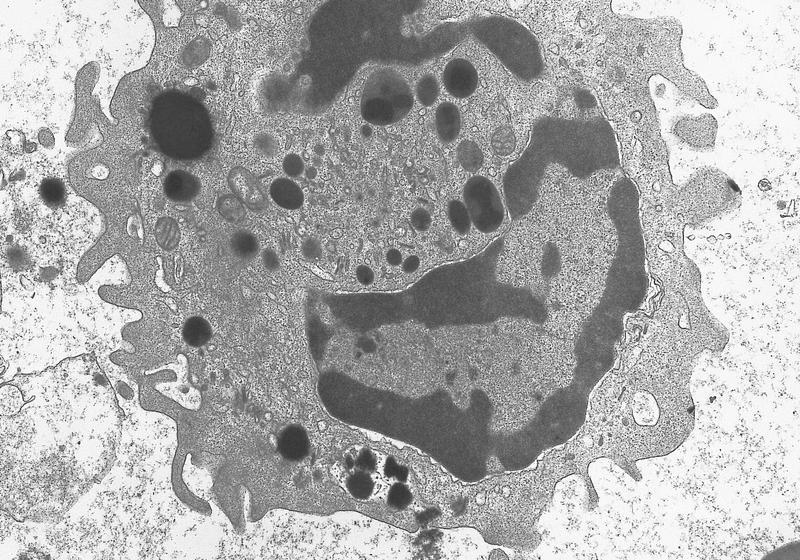
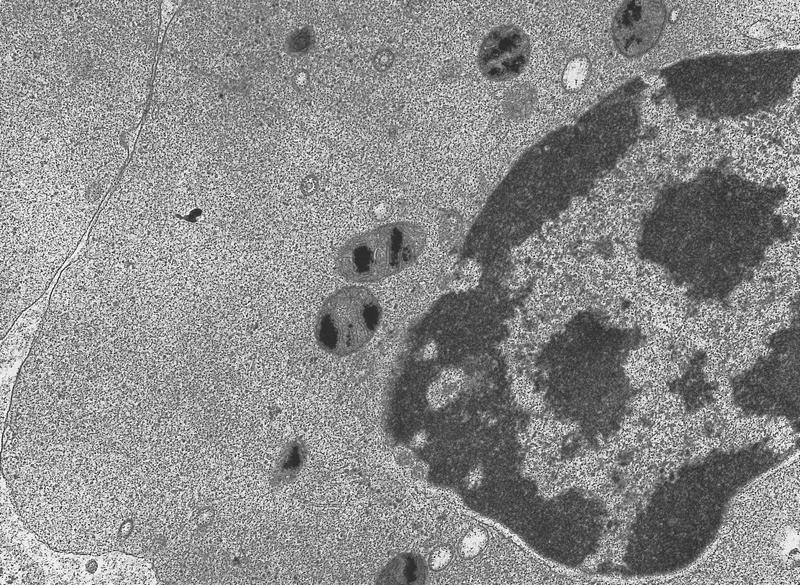
AFIP images
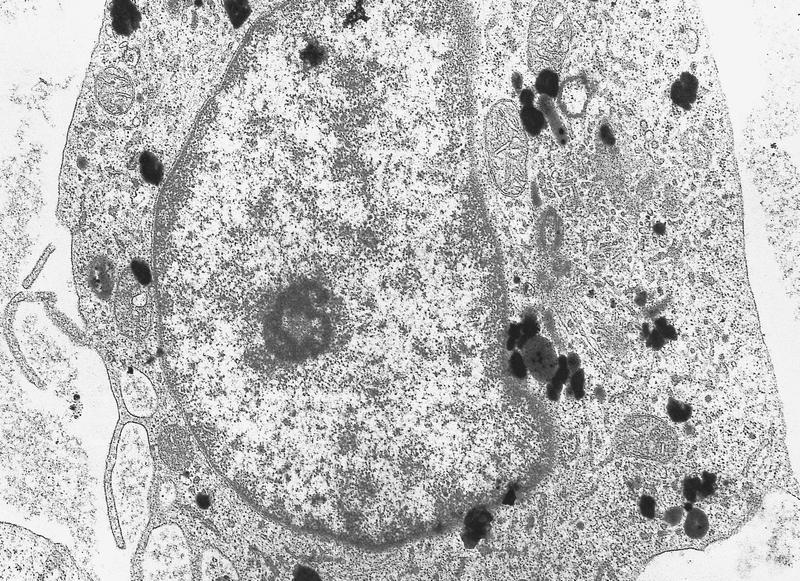
Scattered electron dense deposits
Cytoplasm contains focal area of glycogen deposition
AFIP images
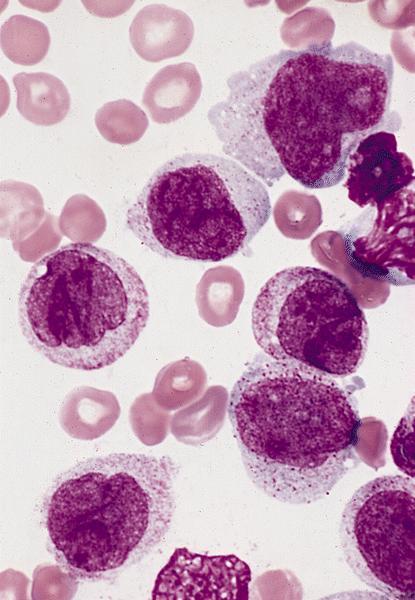
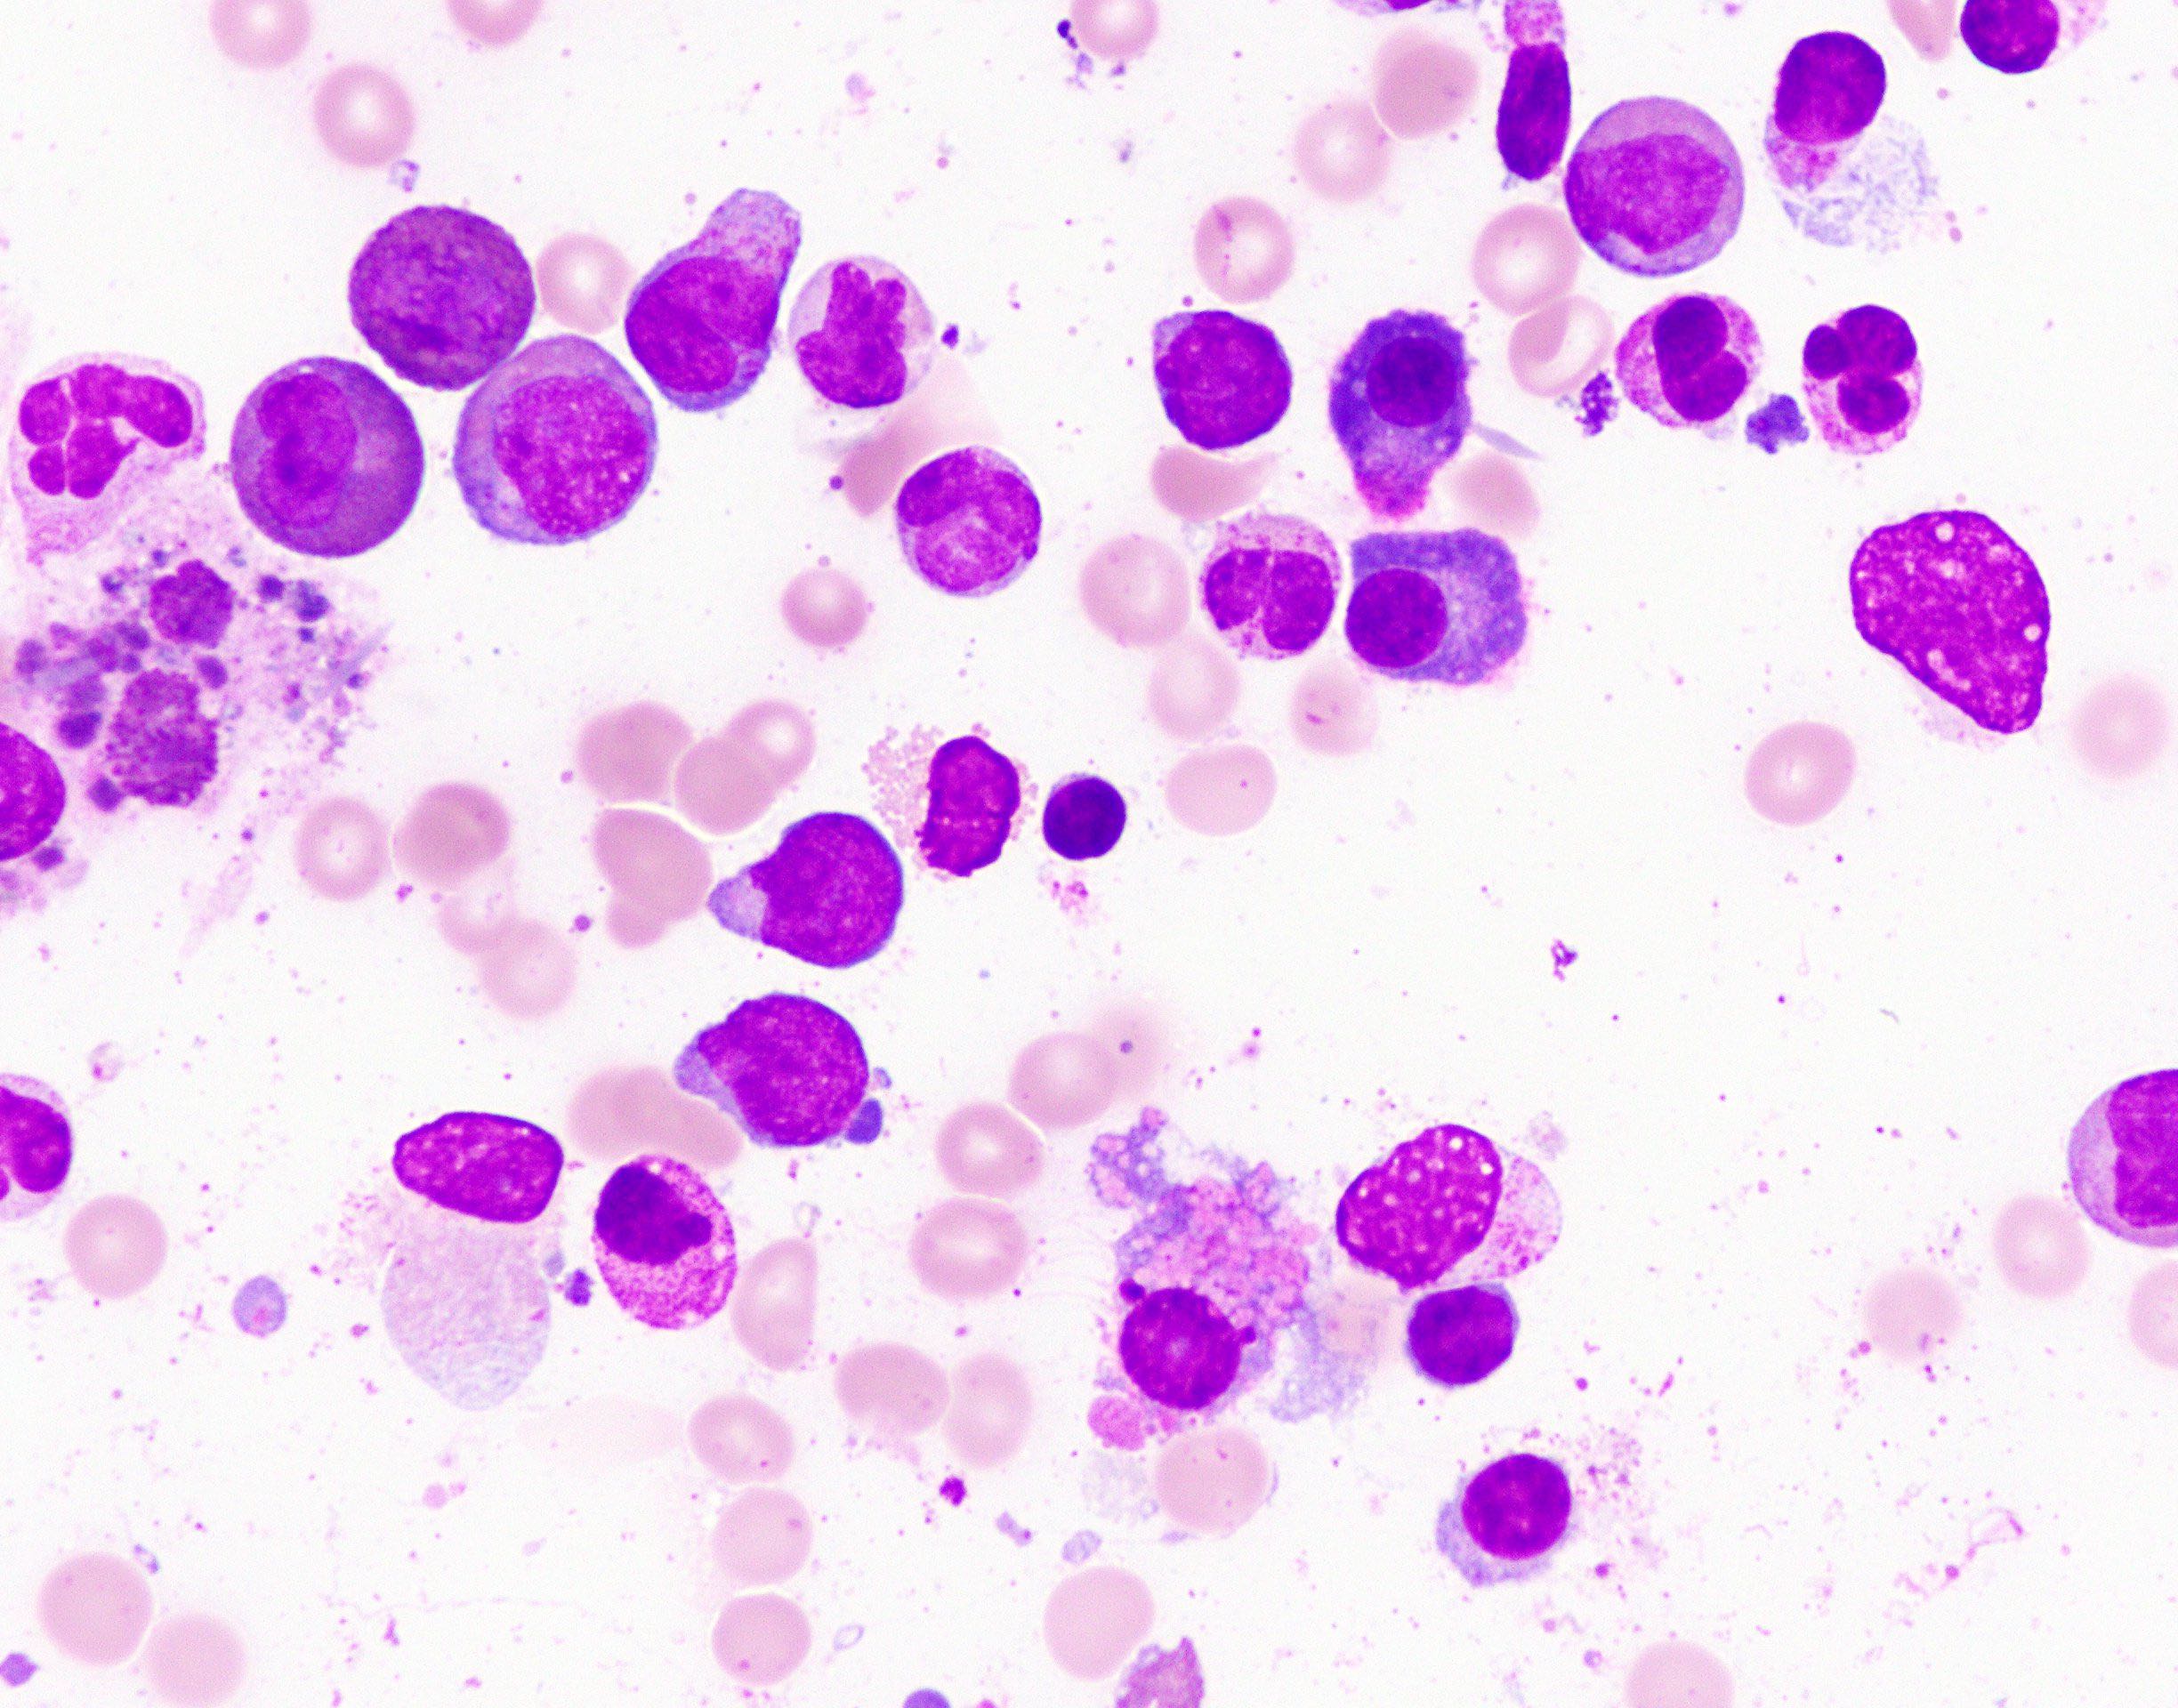
Monocytic cells have range of differentiation
2 myeloblasts and 3 promonocytes
Moderate granular cytoplasm
Nonspecific esterase positive
AFIP images
Promonocytes have abundant cytoplasm
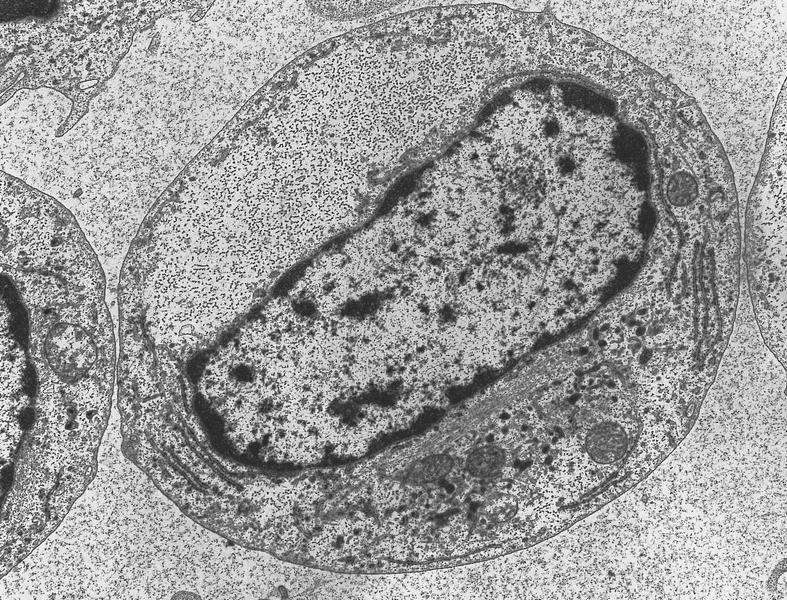
AFIP images
Promonocyte has cytoplasm with numerous small cisterna
Contributed by Patricia Tsang, M.D., M.B.A.
Hypercellular marrow
Megakaryocyte proliferation

Iron stain with ring sideroblast

Dyserythropoiesis
Normoblast with megaloblastic change
Contributed by Patricia Tsang, M.D., M.B.A.
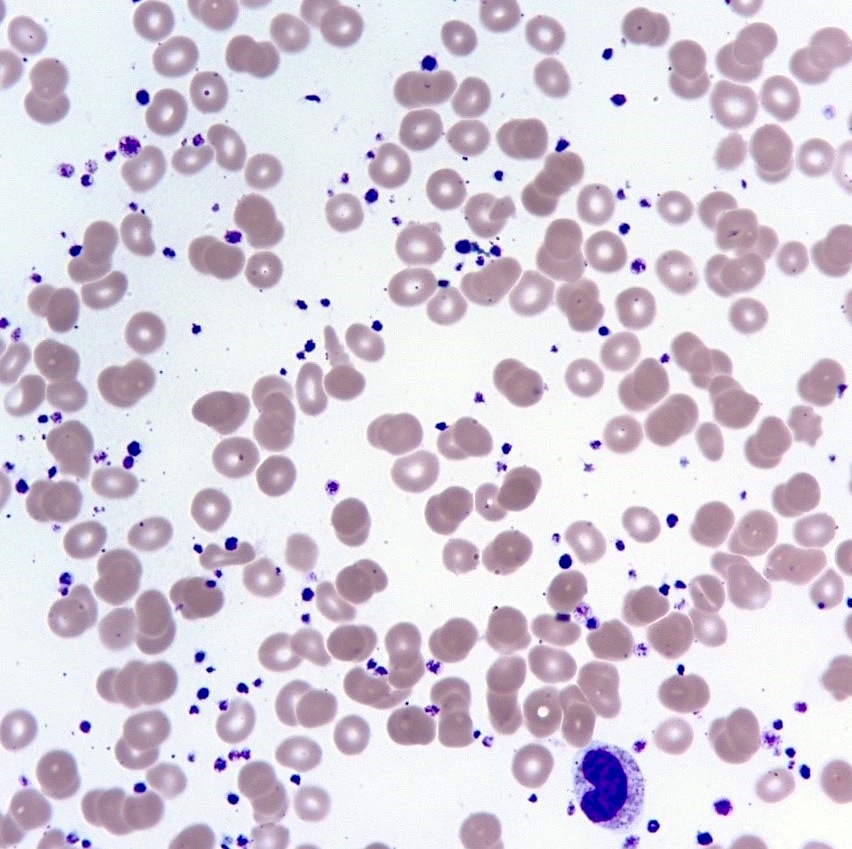
Thrombocytosis

Contributed by Brenda Mai, M.D.
Hypercellular marrow for age

Osteosclerosis
Micromegakaryocyte

Paratrabecular megakaryocyte
Grade 1 reticulin fibrosis
Grade 2 reticulin fibrosis
Increased blasts
Irregular erythroids

Erythroid binucleation
Erythroid budding and multinucleation

Erythroid karyorrhexis and budding / binucleation

Erythroid vacuolization

Megaloblastoid change

Hypolobated megakaryocyte
Trichrome fibrosis
CD34 with increased blasts
CD61 with micro-
megakaryocytes
Contributed by Brenda Mai, M.D.

Hyposegmented neutrophil
Hypersegmented neutrophil

Hypogranular neutrophil
Hypogranular and hyposegmented neutrophil
Neutrophil that is larger in size
Contributed by Brenda Mai, M.D.
Decreased side scatter
Increased blasts
Contributed by Brenda Mai, M.D.

Complex karyotype

Karyotype with deletion 5q
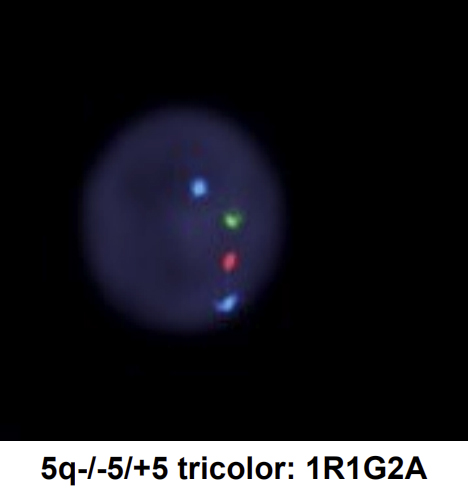
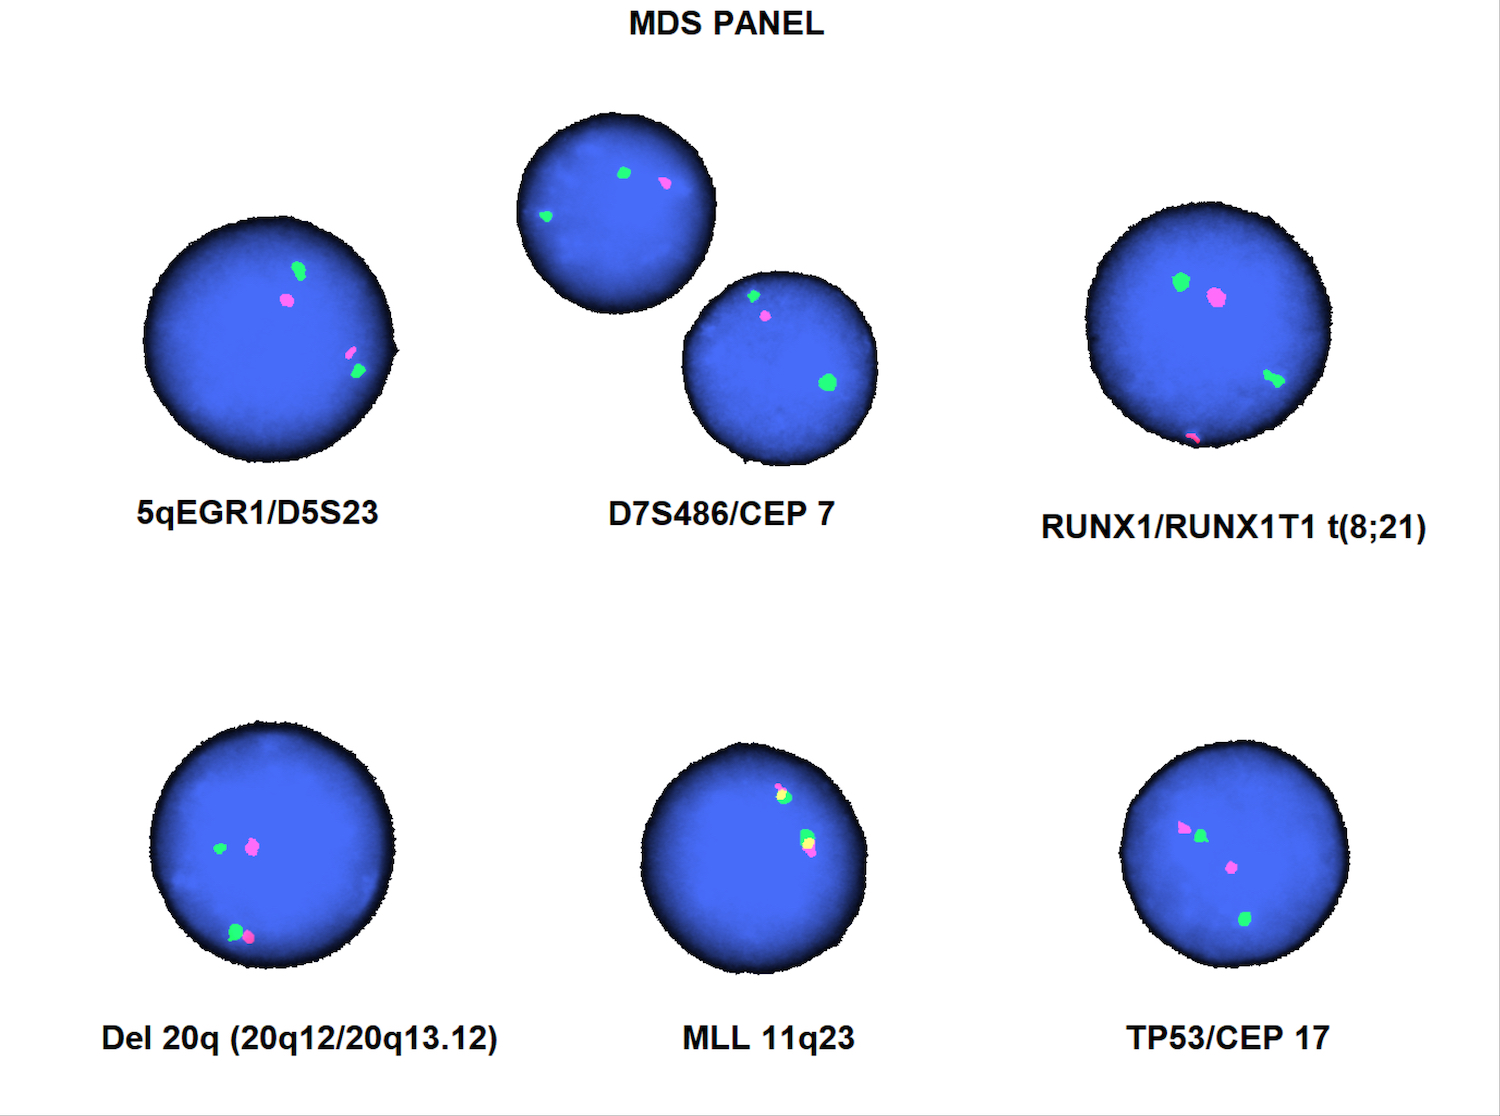
FISH with deletion 5q
Updates in myelodysplastic syndromes
AFIP images
Pancytopenia, abnormally bilobed nuclei in granulocytes

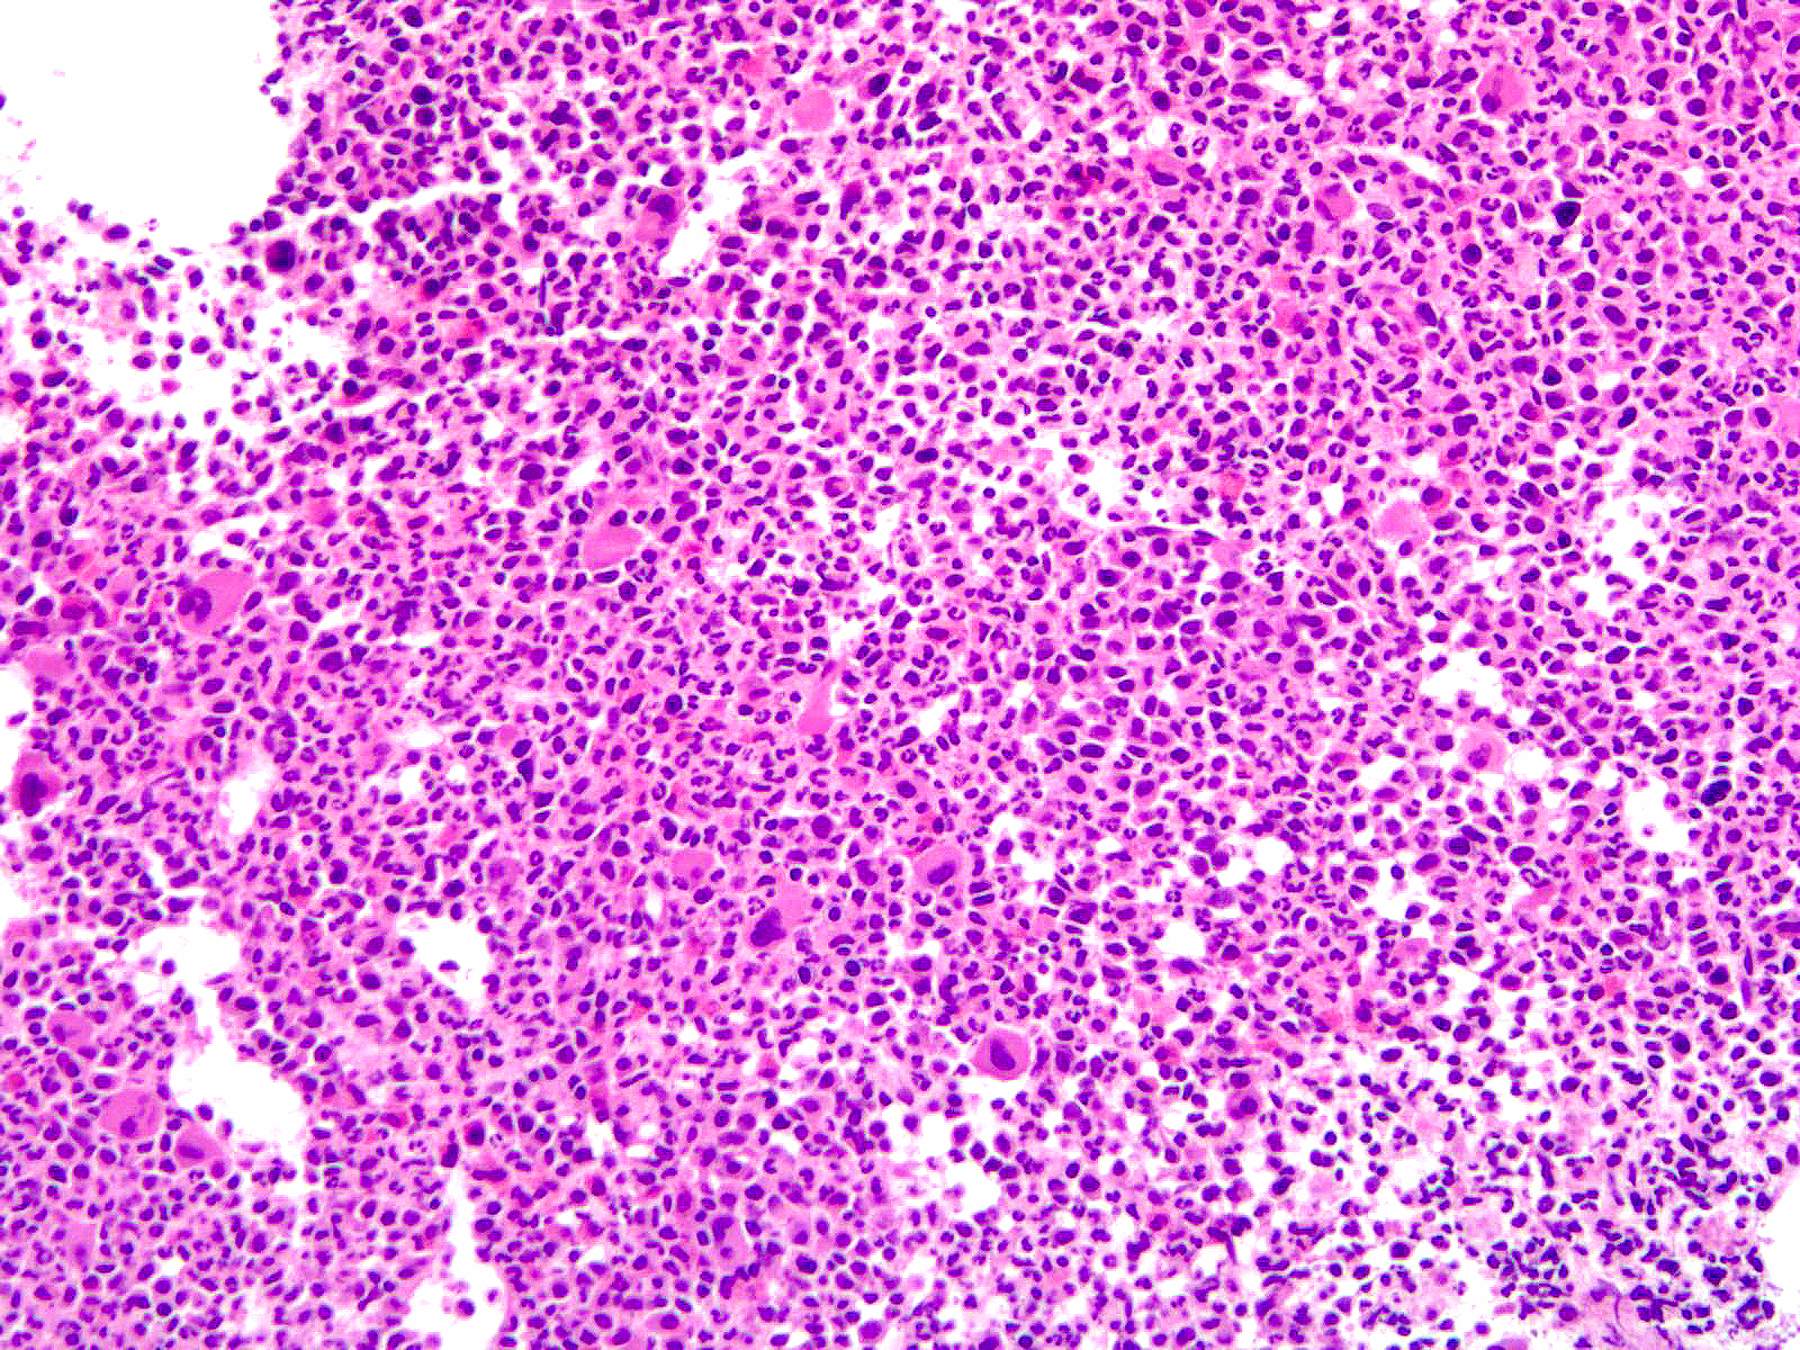
Marked increase in megakaryocytes
Erythroid hyperplasia
Large erythroid precursors
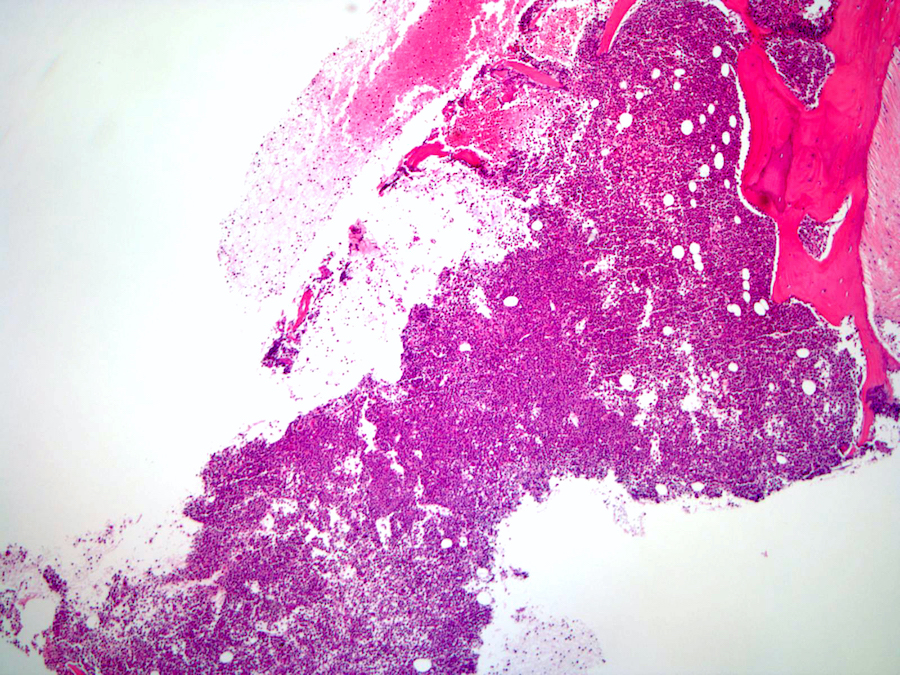
Hypercellular marrow with marked fibrosis
Cluster of large megakaryocytes
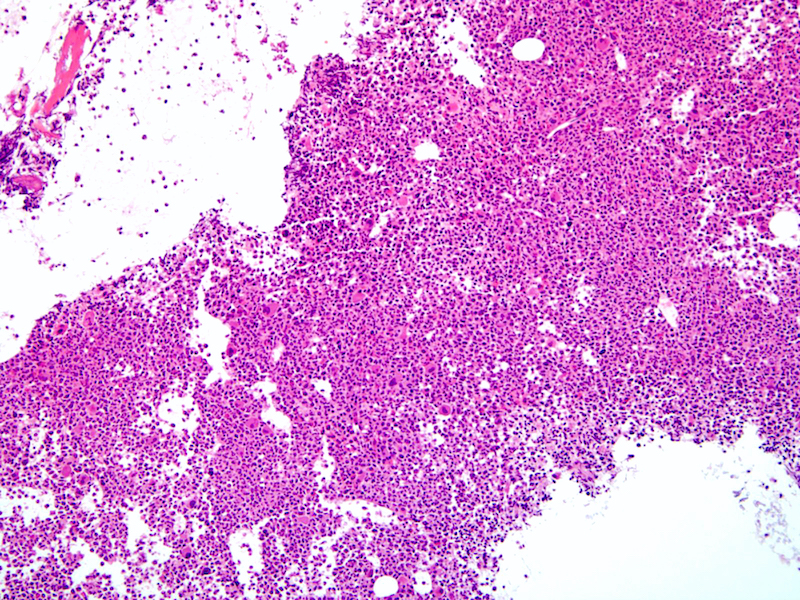
Marked reduction in megakaryocytes
Recurrence with increased marrow cellularity
Images hosted on other servers:

Megakaryocyte clustering and hyperlobulated forms (figs 2 / 3)
| WHO 4R | WHO 5th | ICC classification |
|
|
|
| ICC classification of MDS with mutated TP53 | |
| MDS with mutated TP53 | AML / MDS with mutated TP53 |
|
|
| WHO 5th edition, 2022 | ICC 2022 | |
| Morphologically defined | ||
| Lineage | Subclassification using dysplastic lineages removed, replaced with MDS LB (MDS with low blasts) | MDS, NOS SLD MDS, NOS MLD |
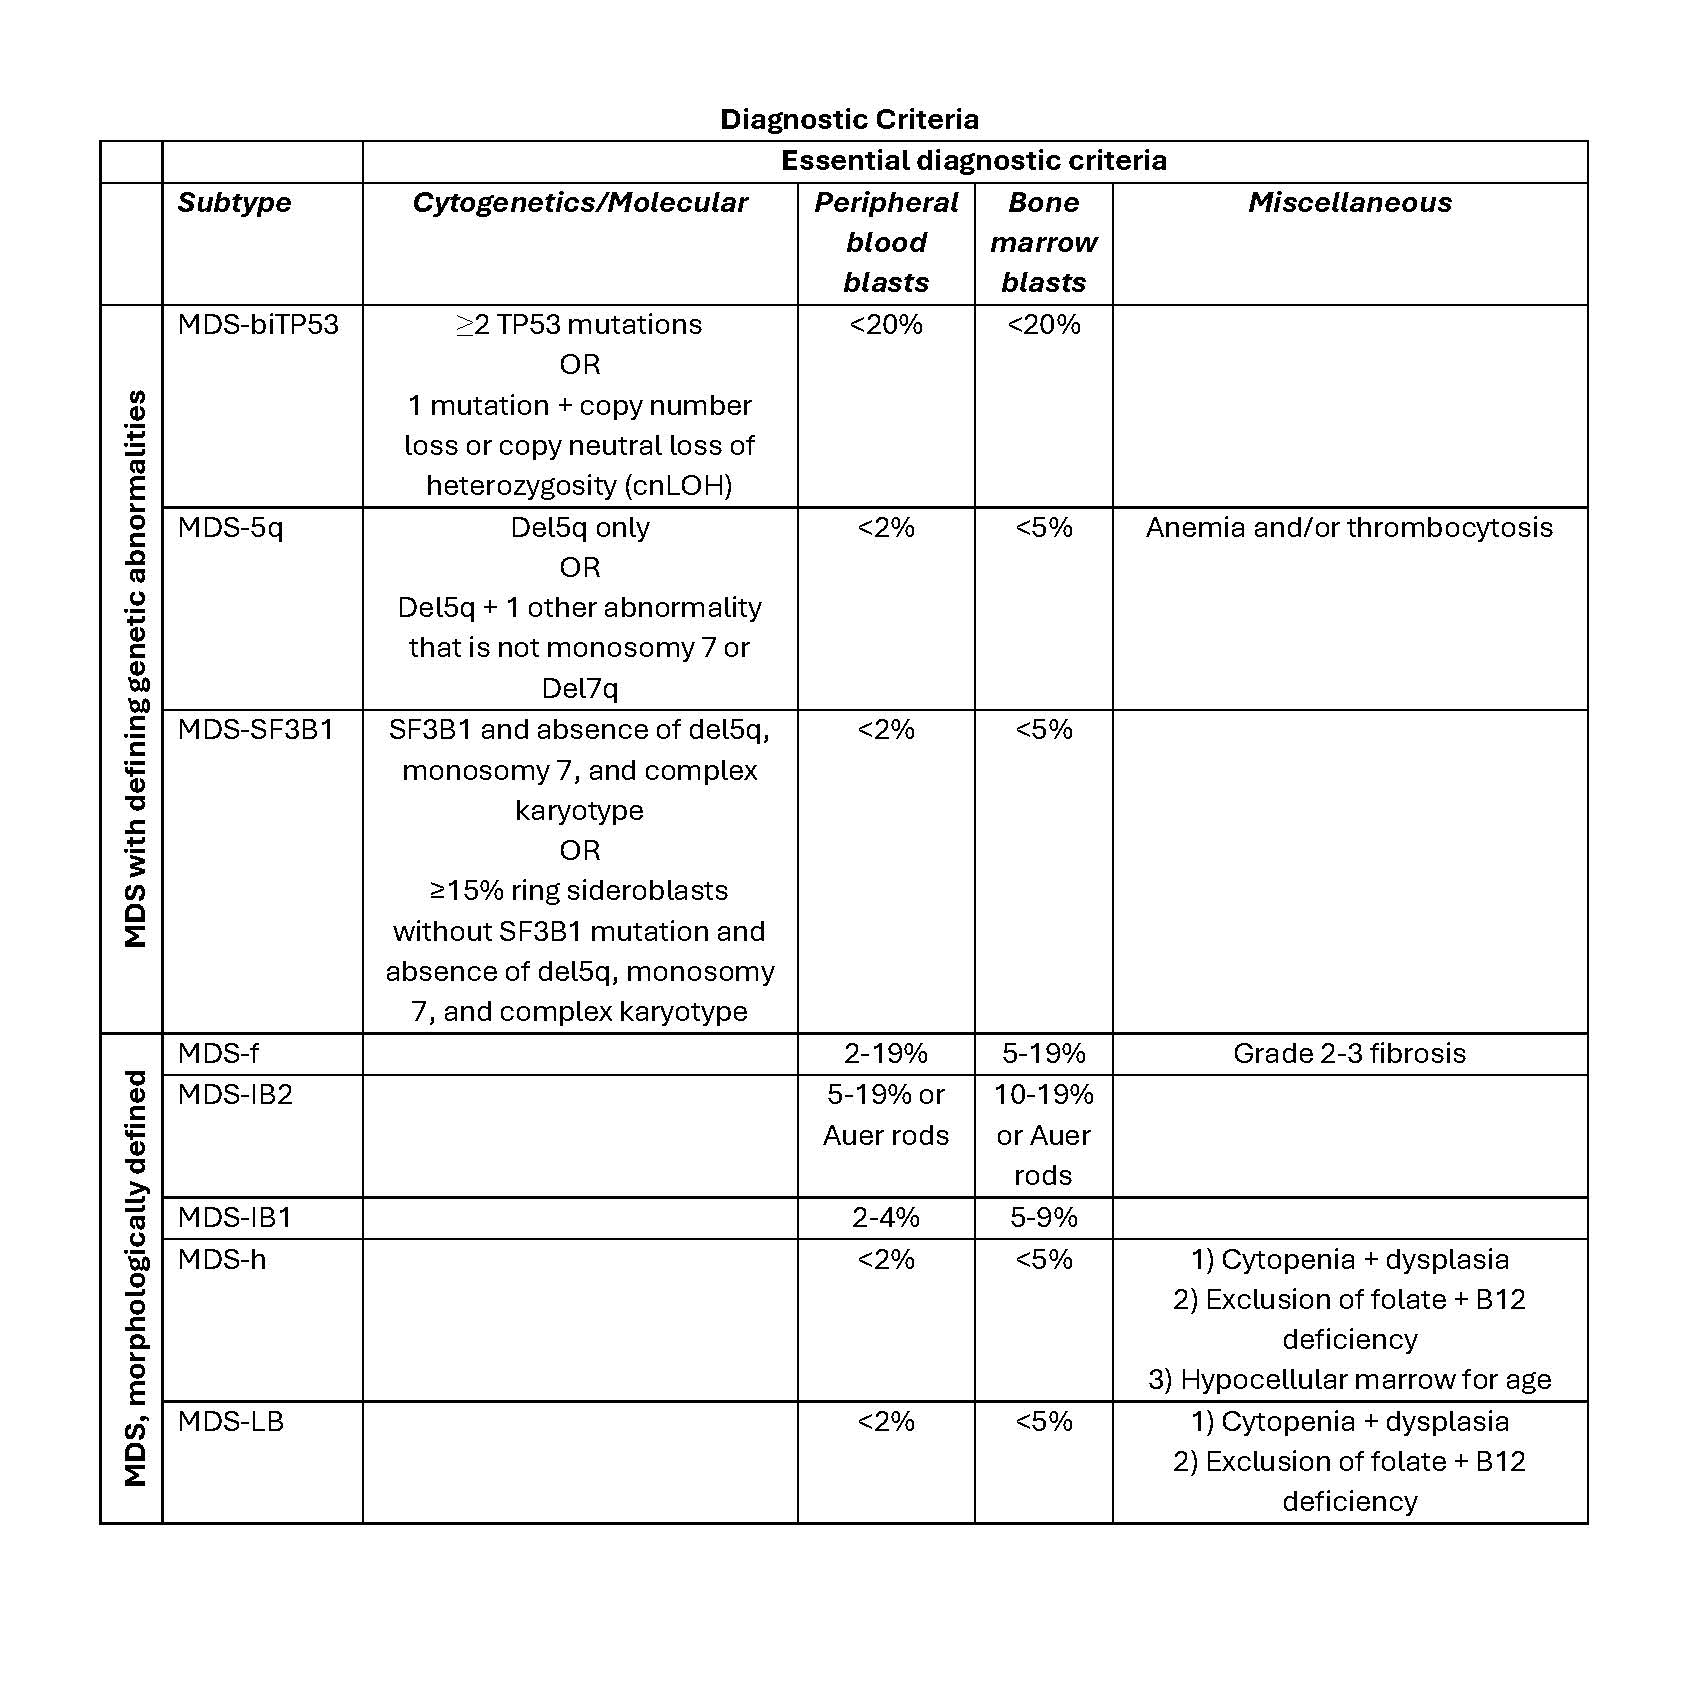
| Excessive blast counts in bone marrow (5 - 9%) or in peripheral blood (2 - 4%) | MDS IB1 | MDS EB (blast count 5 - 9% in bone marrow, 2 - 4% in peripheral blood) |
| Excessive blast counts in bone marrow (10 - 19%) or in peripheral blood (5 - 19%) | MDS IB2 | MDS AML (blast count 10 - 19% in bone marrow and 2 - 4% in peripheral blood) |
| Others | cMDS (MDS of childhood) MDS-h (hypoplastic MDS) MDS-f (MDS with fibrosis, blasts 5 - 19% in bone marrow, 2 - 19% in peripheral blood) | MDS, NOS (without dysplasia) |
| Defining genetic abnormalities | ||
| SF3B1 mutation | MDS SF3B1 (MDS with low blasts and SF3B1 mutation or MDS with ring sideroblasts if SF3B1 wild type) | MDS SF3B1 (MDS with mutated SF3B1) or MDS, NOS (with ring sideroblasts and SF3B1 wild type) |
| del(5q) | MDS 5q (MDS with low blasts and 5q deletion) [5q deletion alone or with 1 other genetic aberration other than del(7q) / -7] | MDS with del(5q) [del(5q) is isolated or with up 1 genetic aberration except del(7q) / -7 or multihit TP53] |
| TP53 | MDS biTP53 (MDS with biallelic TP53 inactivation) | MDS with mutated TP53 Multihit TP53 Includes MDS, MDS / AML, AML |
Contributed by Hatem Kaseb, M.D., Ph.D., M.P.H.
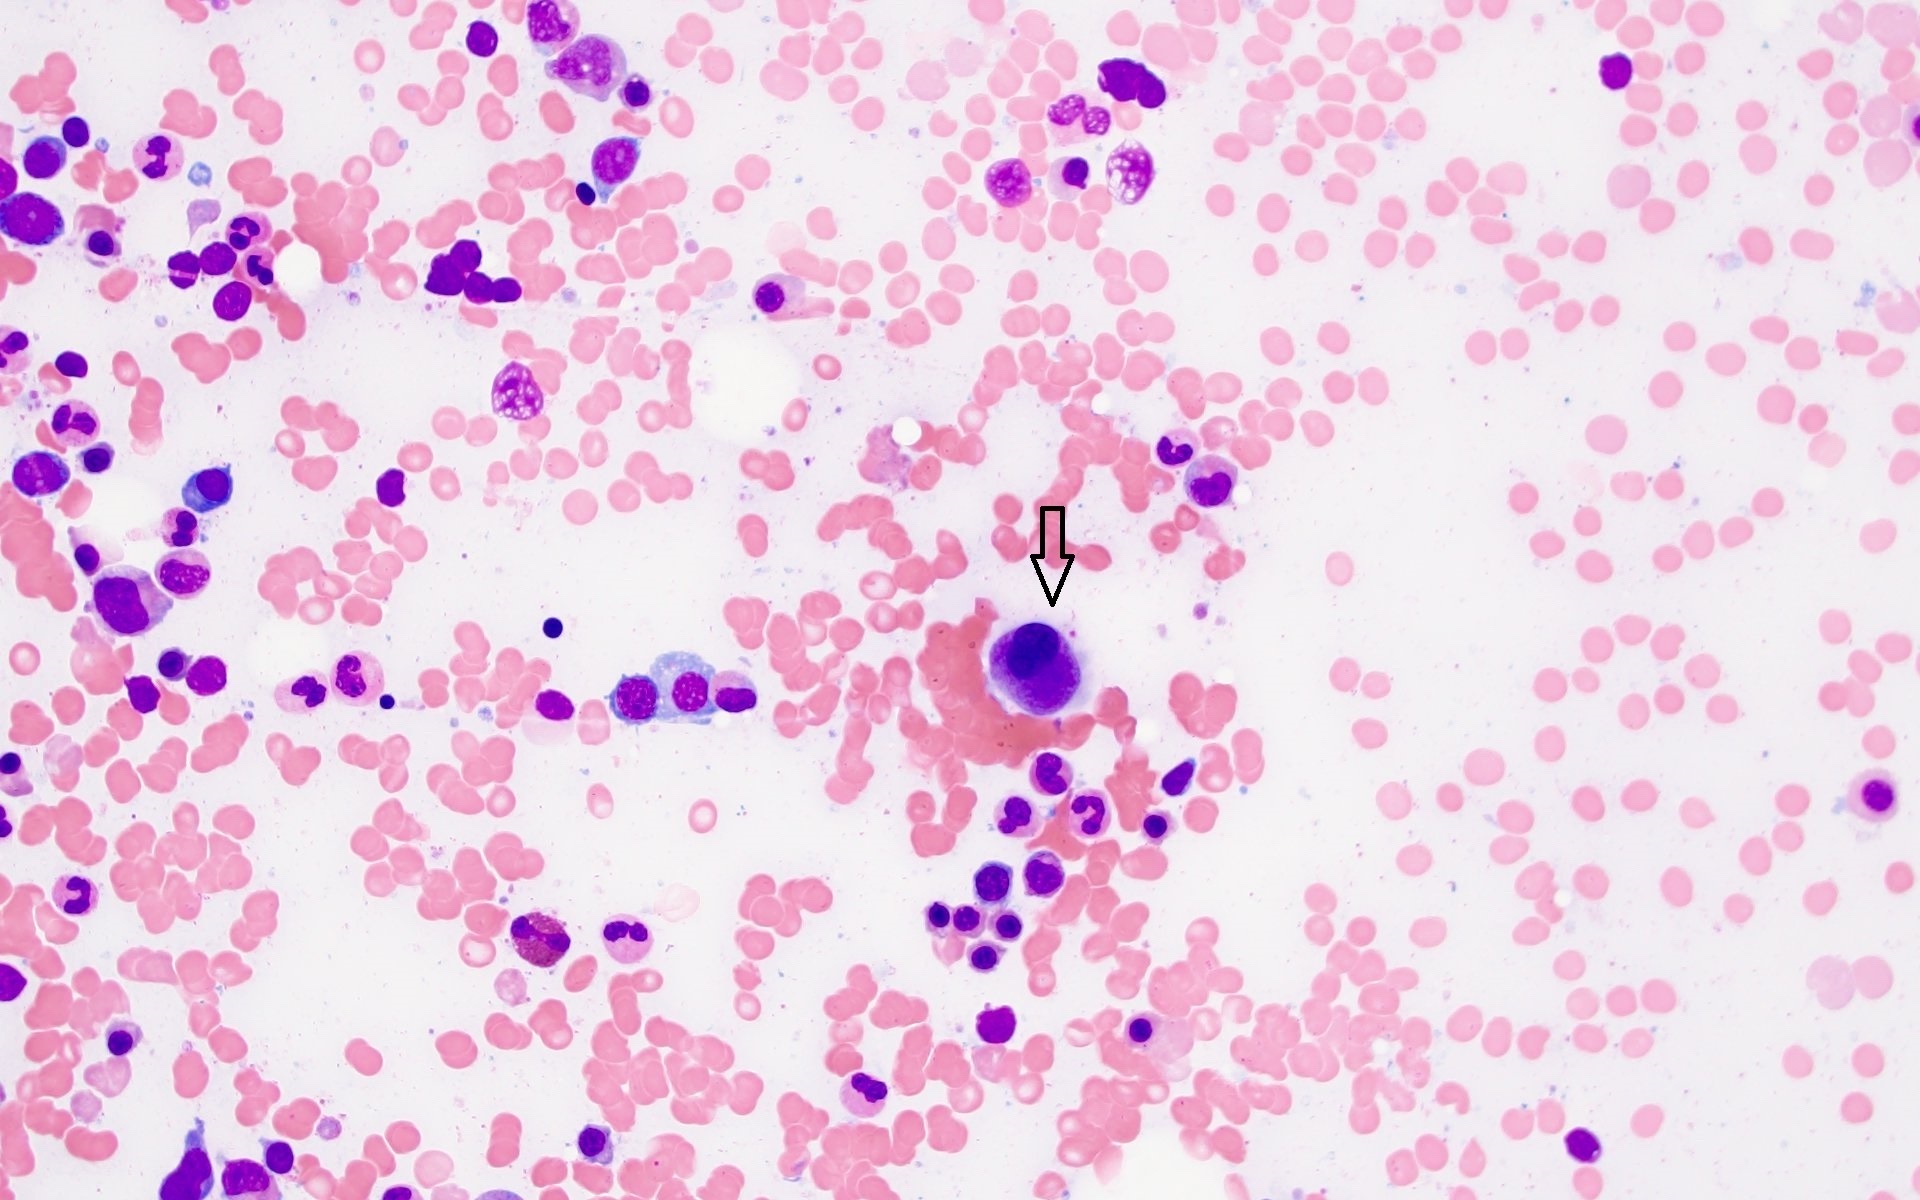
Blast

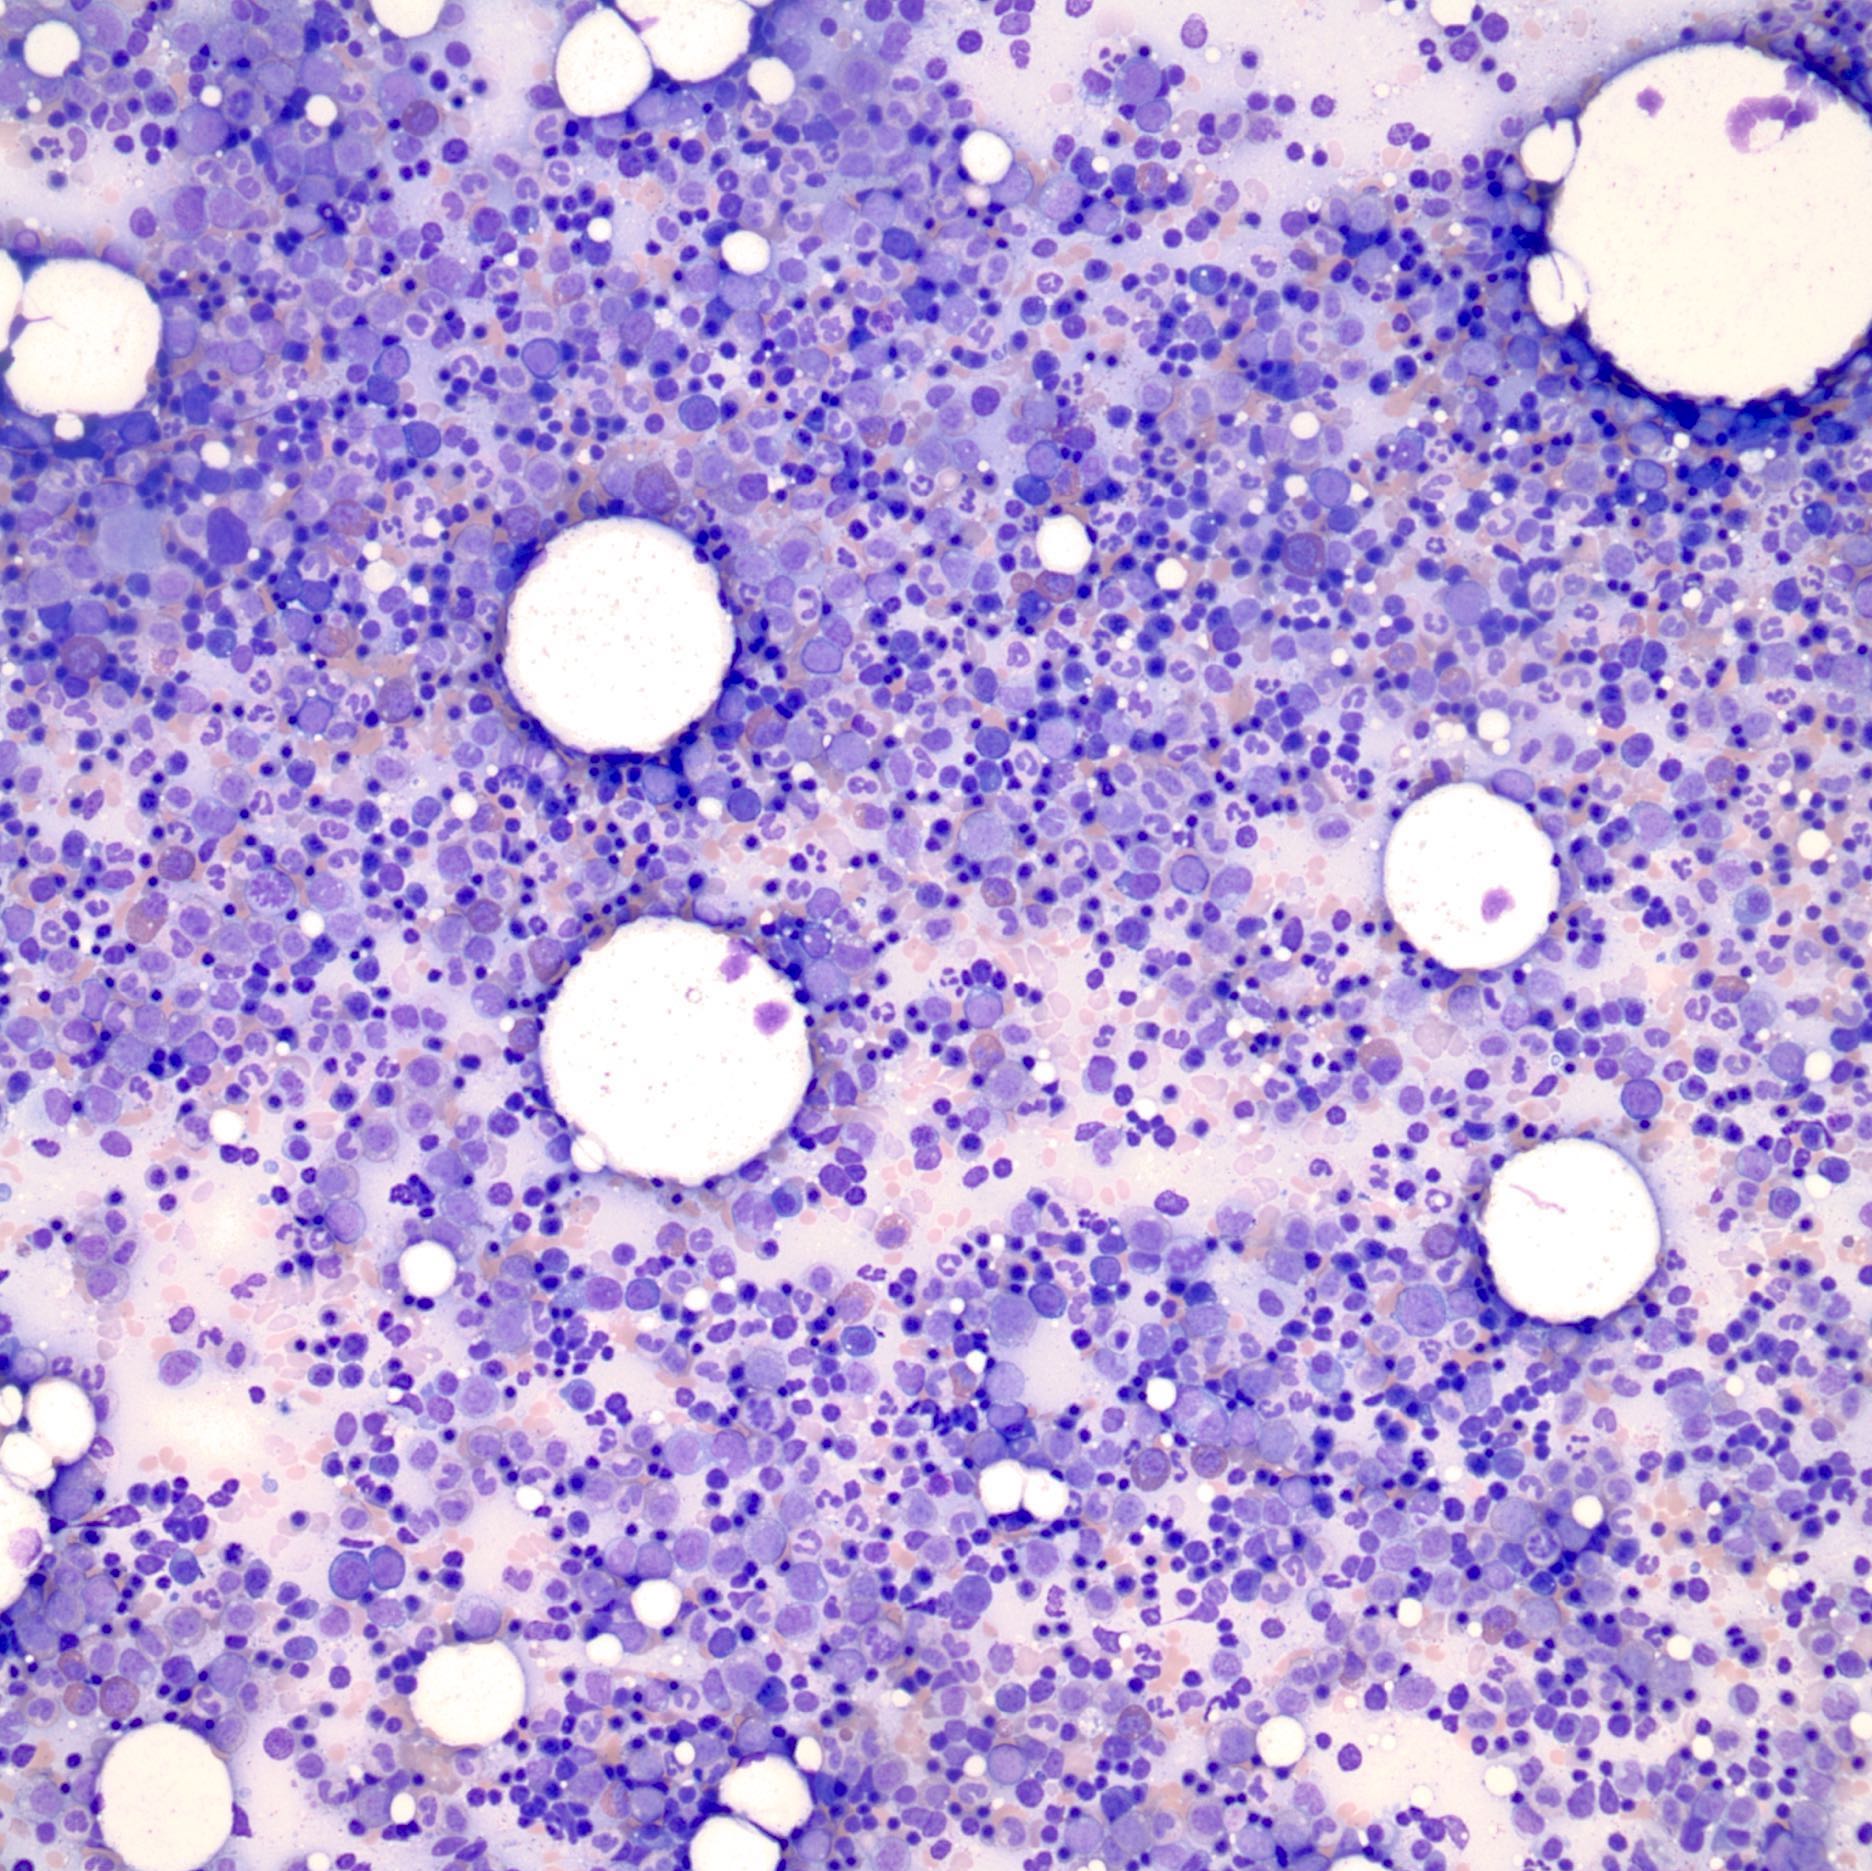
Bone marrow with increased blasts

Dyserythropoiesis
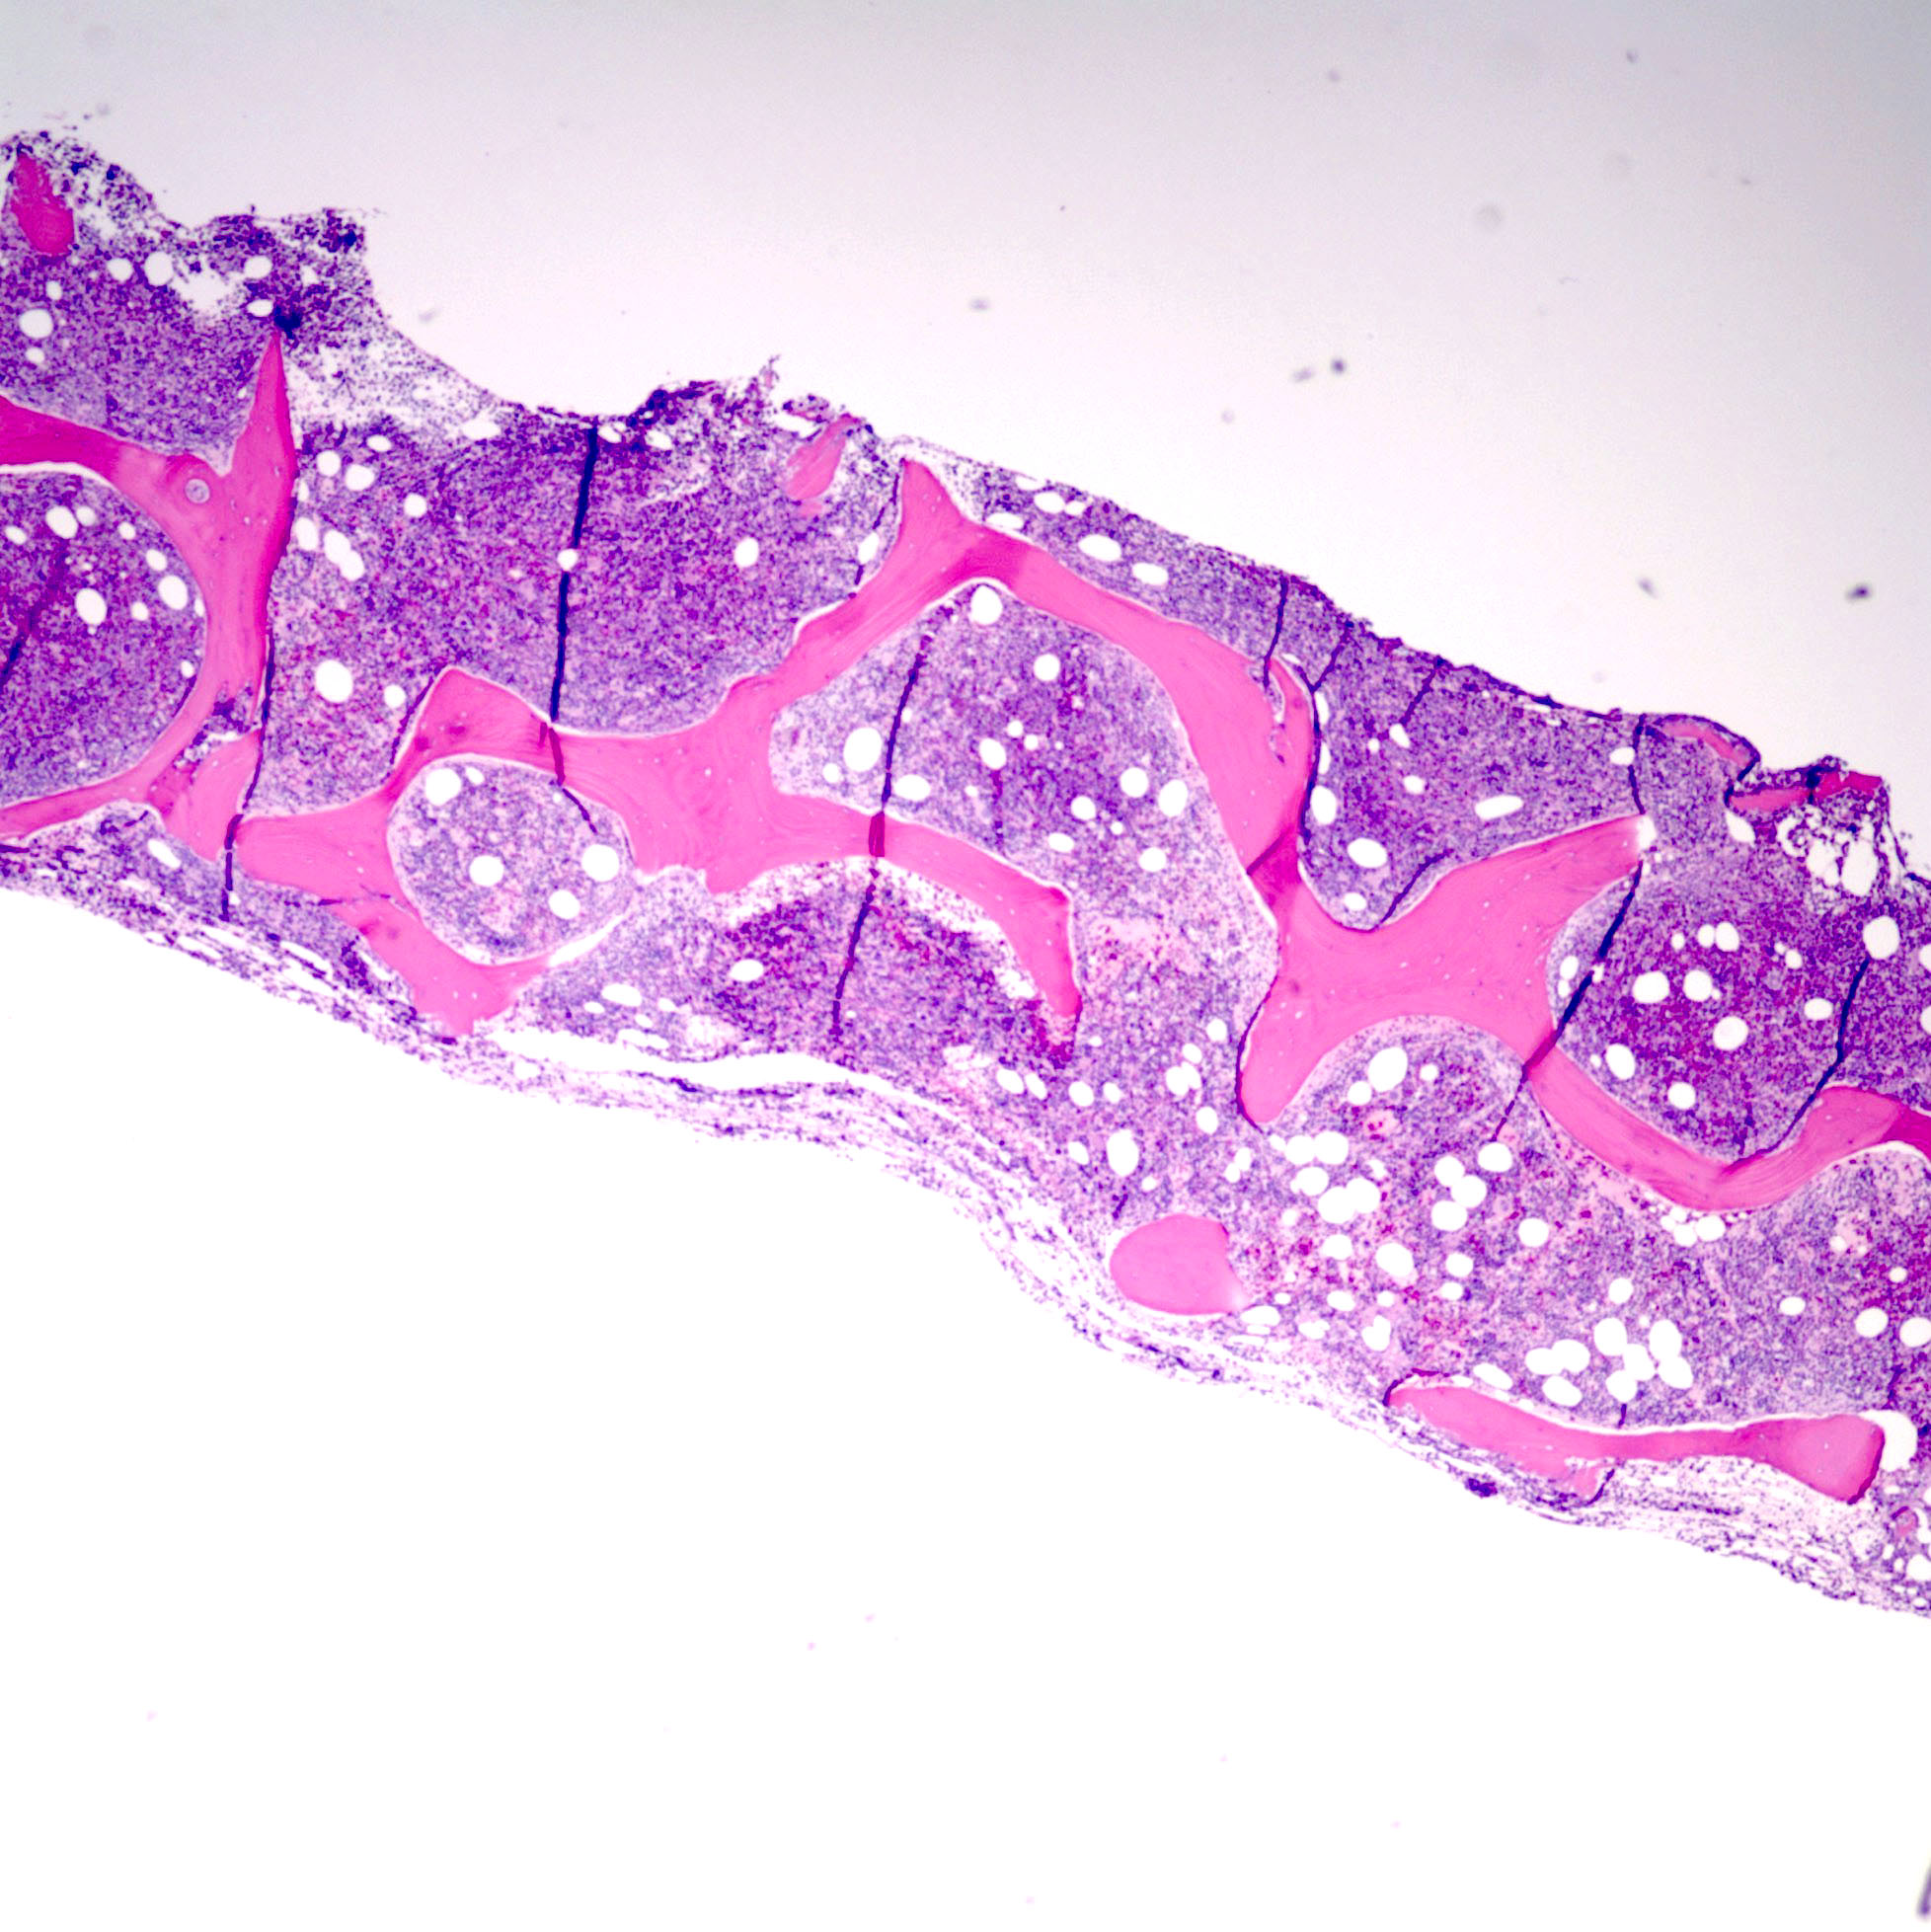
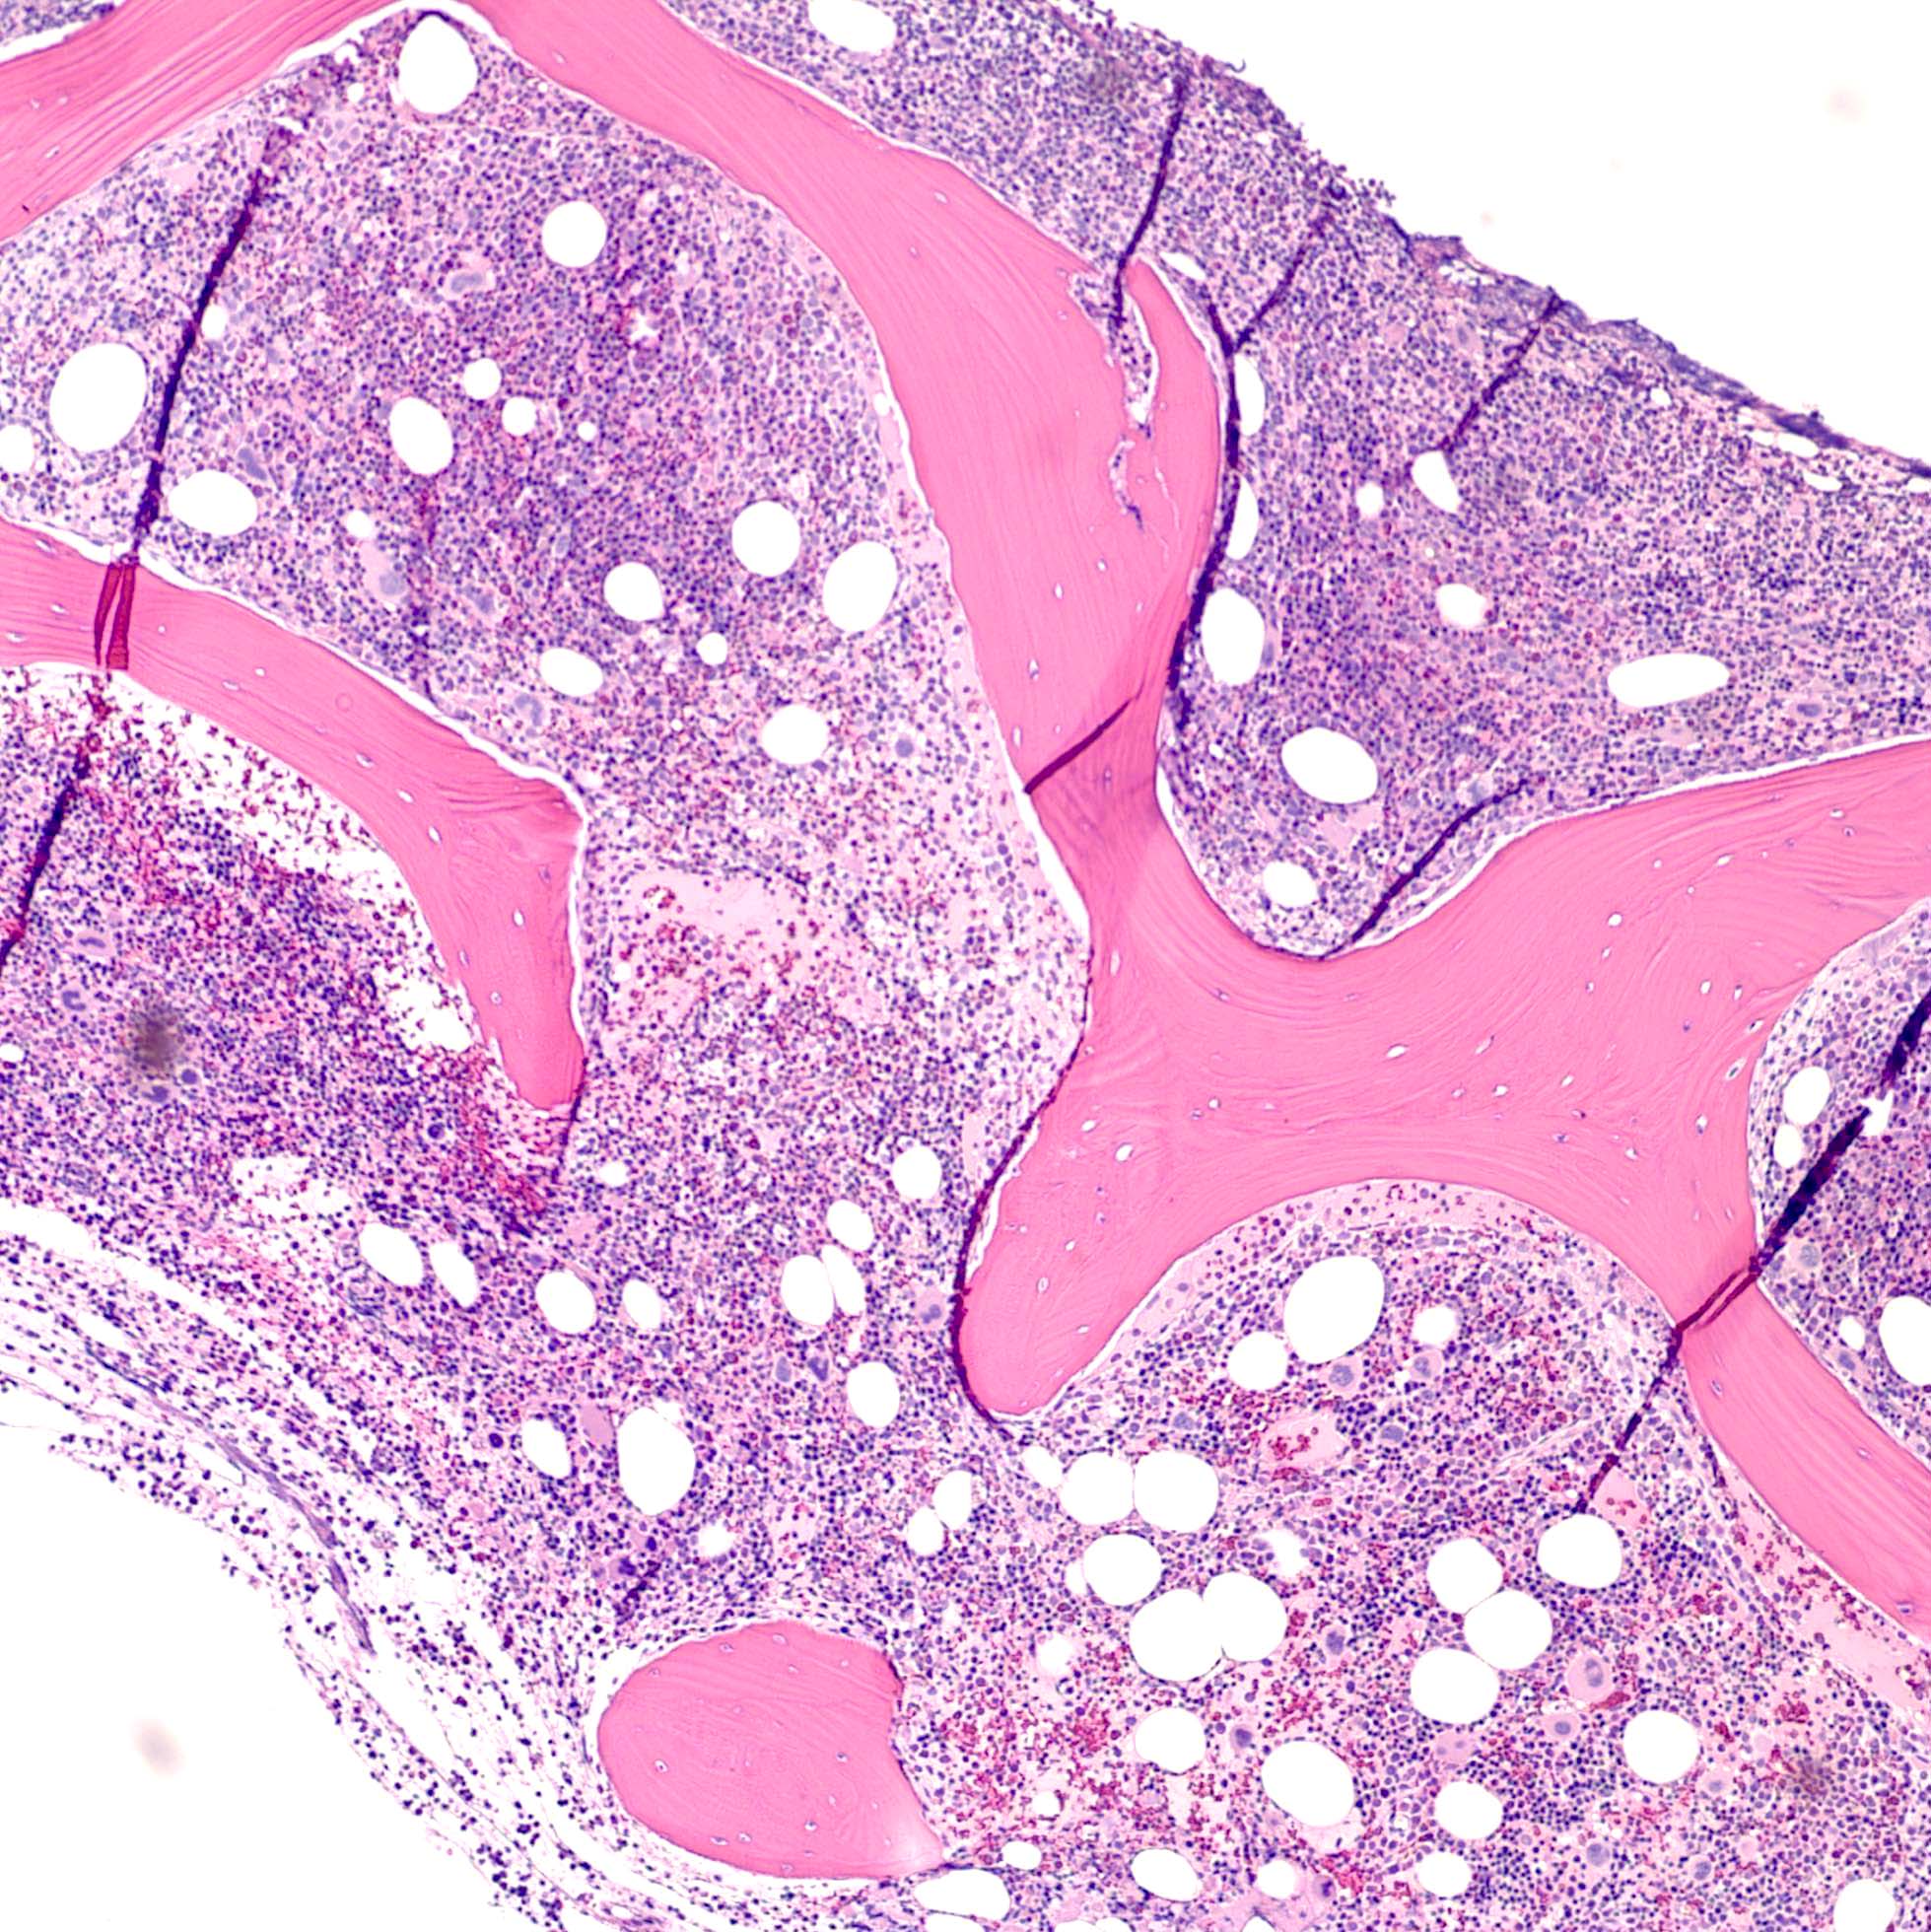
Hypercellular bone marrow with dysplasia

Hypercellular bone marrow with dysplasia

Increased blasts in bone marrow
TP53 IHC
AFIP images

Blast in center with adjacent neutrophils
Promyelocytes and myelocytes
Markedly hypogranular cytoplasm

Auer rod present in blast; neutrophils show nuclear hypolobulation
Bone marrow aspirate

Normocellular biopsy
Normal erythroid precursors
Slightly more cellular marrow
More immature granulocytes

Marked fibrosis with streaming effect
Images hosted on other servers:

RAEB-1
AFIP images

Neutrophil has hypogranular cytoplasm

Hypogranular cytoplasm
Images hosted on other servers:

RAEB-1

RAEB-2: blood, marrow and myocardial infiltration
Images hosted on other servers:

Pathogenesis of myelodyspastic syndromes
Contributed by Julia T. Geyer, M.D. and Shajo Kunnath-Velayudhan, M.B.B.S., M.M.S.T.

Hypercellular bone marrow
Dysplastic megakaryocytes
Dysmegakaryopoiesis
Dysgranulopoiesis
Dyserythropoiesis
Contributed by Genevieve M. Crane, M.D., Ph.D.
Dysplastic neutrophils
What is multilineage dysplasia?
Contributed by Cecilia C.S. Yeung, M.D.
Erythroid predominance
Erythroid hyperplasia and dyserythropoiesis
Multilineage dysplasia
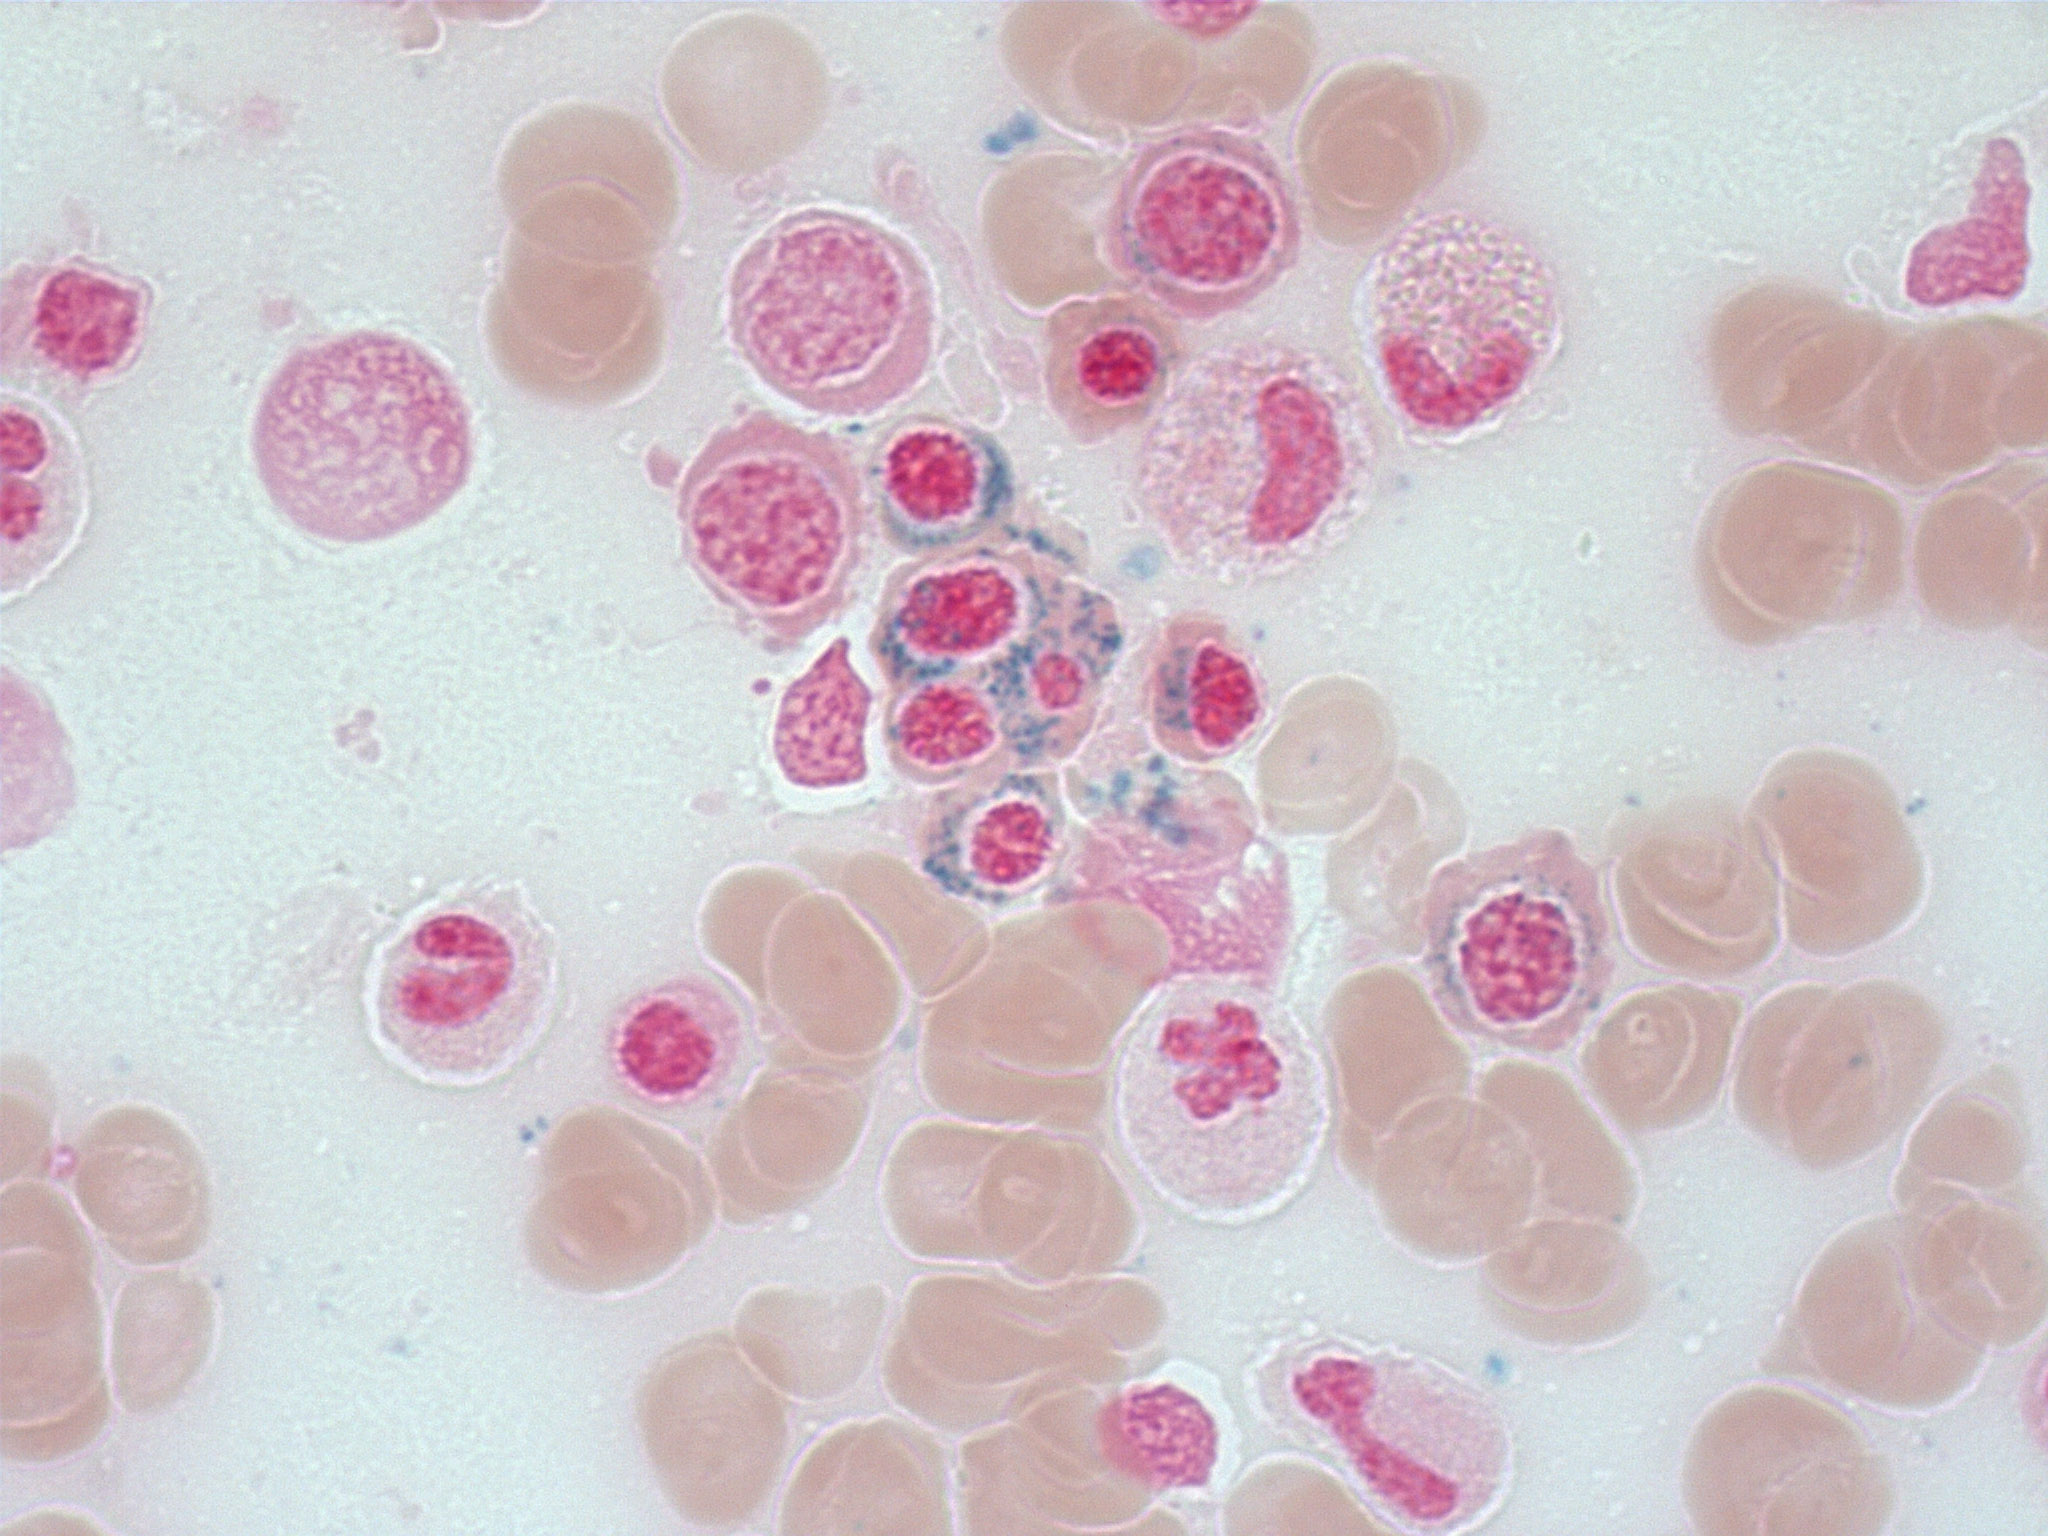
Ring sideroblasts
AFIP images
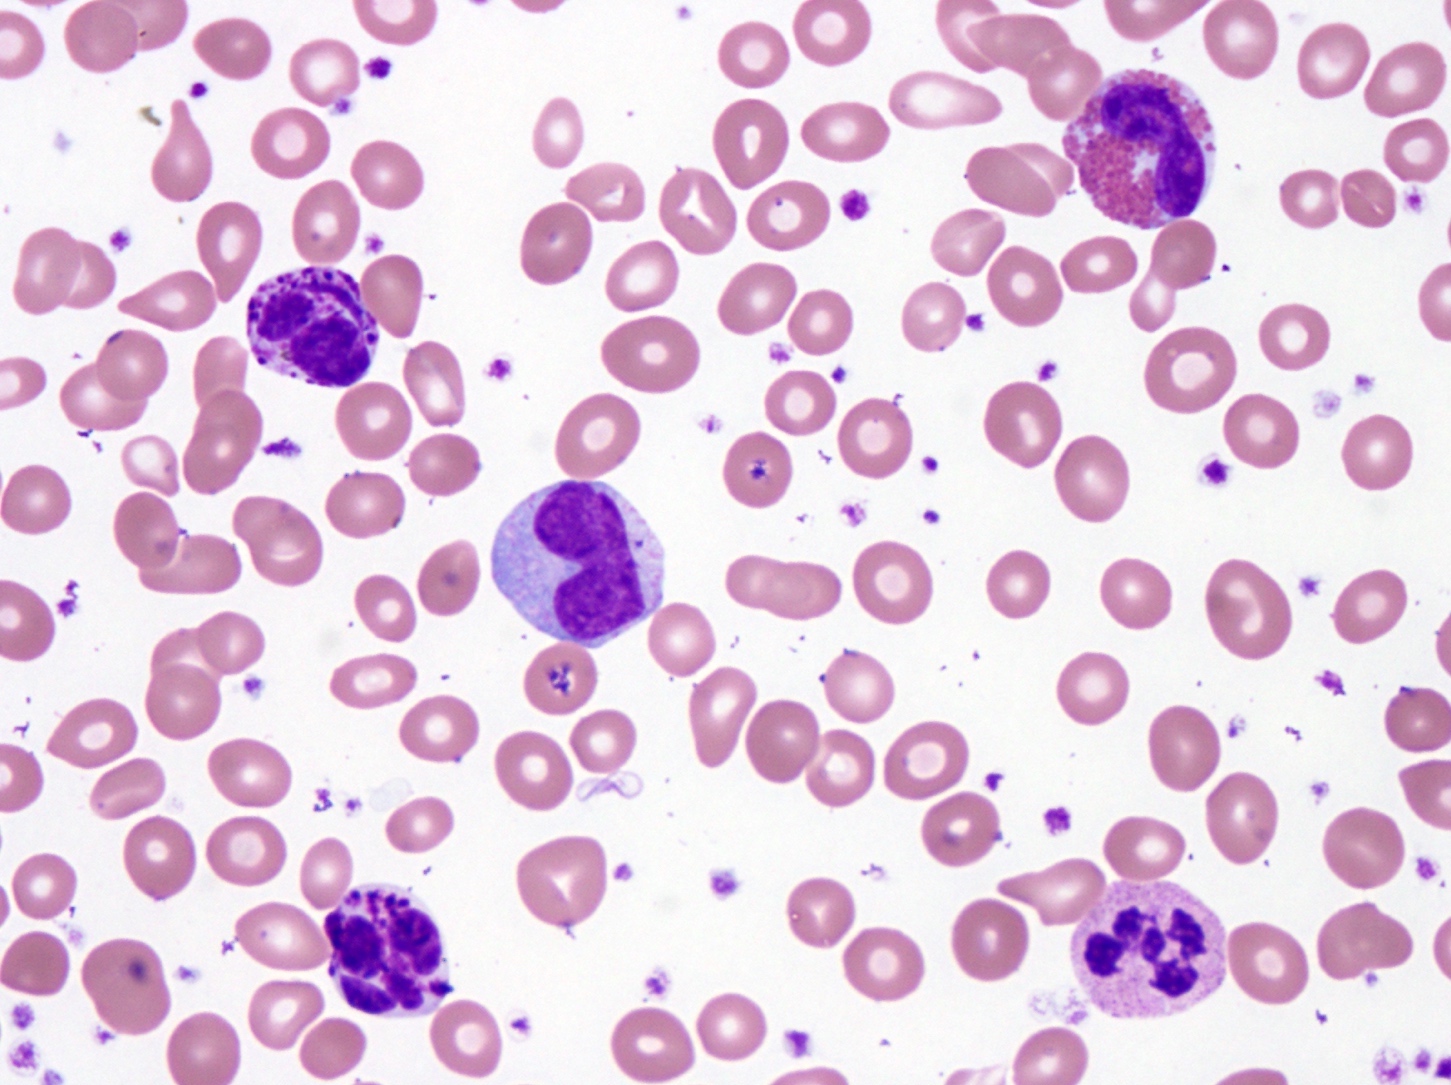
Peripheral blood
AFIP images
Erythroid precursor shows iron deposits
Contributed by Cecilia C.S. Yeung, M.D.
Erythroid predominance
Erythroid hyperplasia and dyserythropoiesis
Multilineage dysplasia
Ring sideroblasts

Bone marrow aspirate, iron stain

Bone marrow aspirate, Wright-Giemsa stain
AFIP images
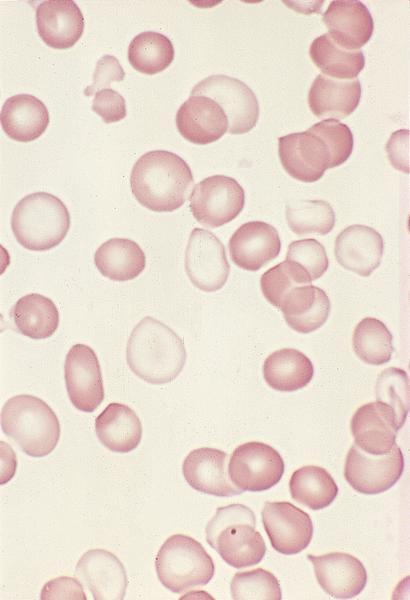
Dimorphic red blood cells
AFIP images
Erythroid precursor shows iron deposits
Contributed by Hamzah Rehan, D.O.
Hypercellular bone marrow

Dysplastic megakaryocytes

Clot section

CD34
Contributed by Hamzah Rehan, D.O.

Aspirate smear
Erythroid budding
Contributed by Karan Saluja, M.D. and Beenu Thakral, M.D.
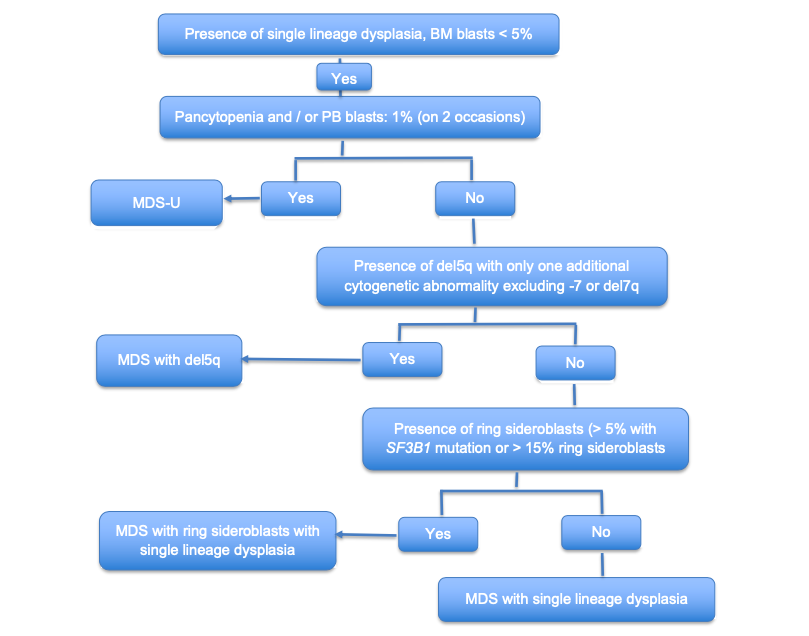
Classification algorithm for MDS SLD
Contributed by Beenu Thakral, M.D.
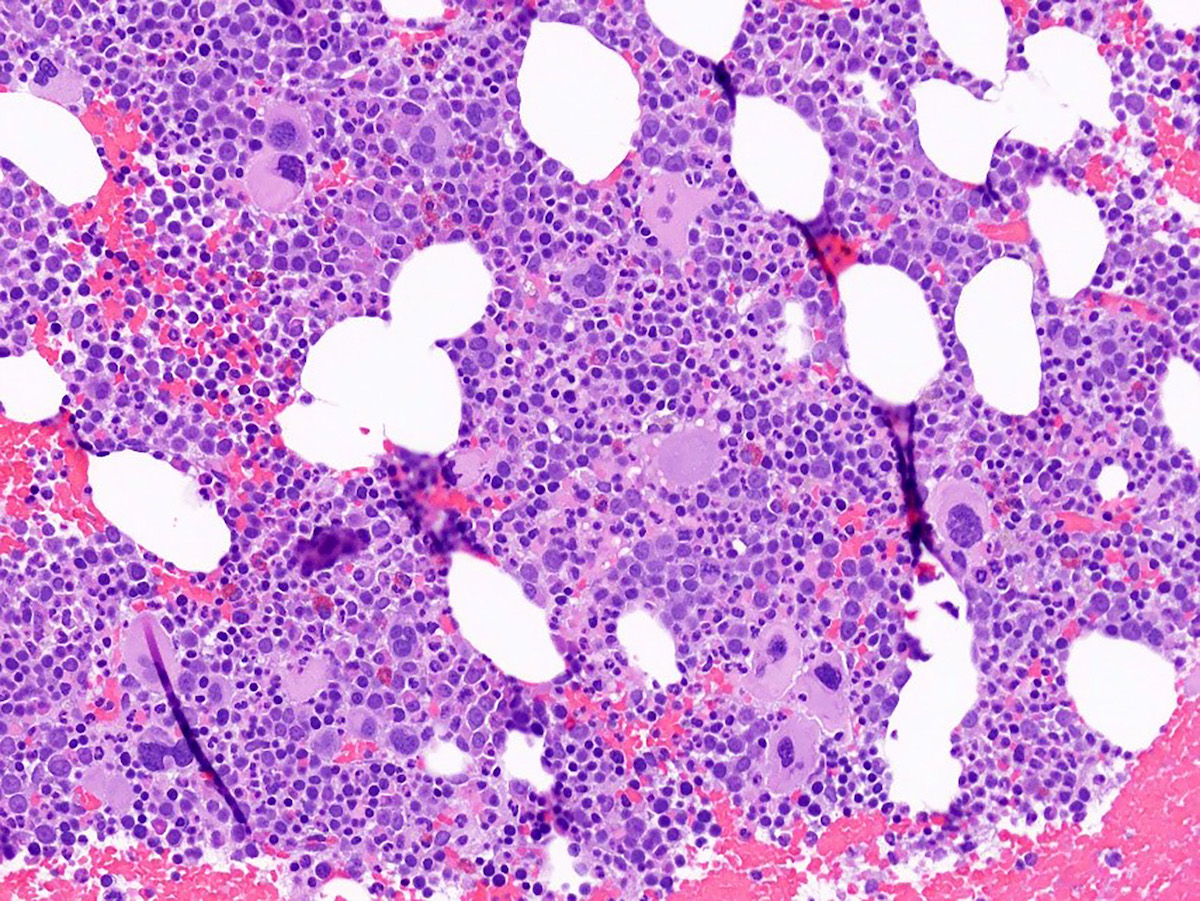
Hypercellular BM and megakaryocytic dysplasia

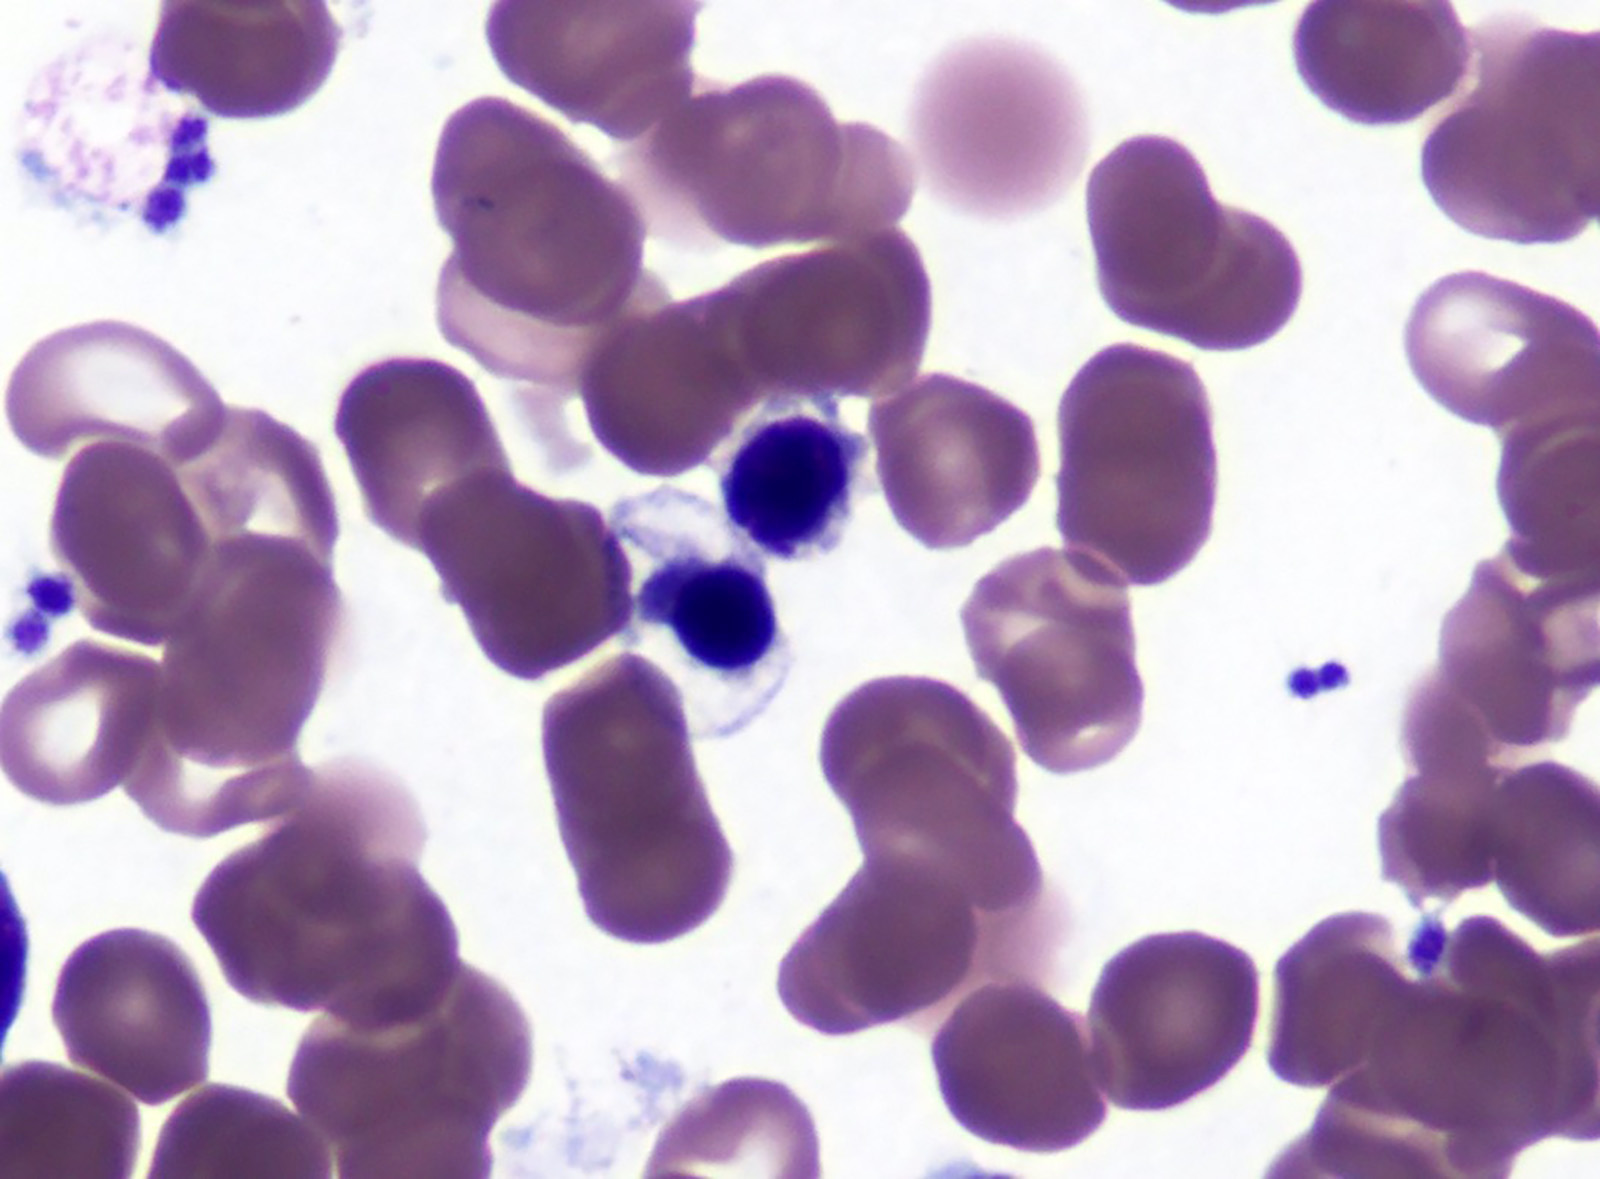
Erythroid dysplasia

Ring sideroblasts (Pearl stain)
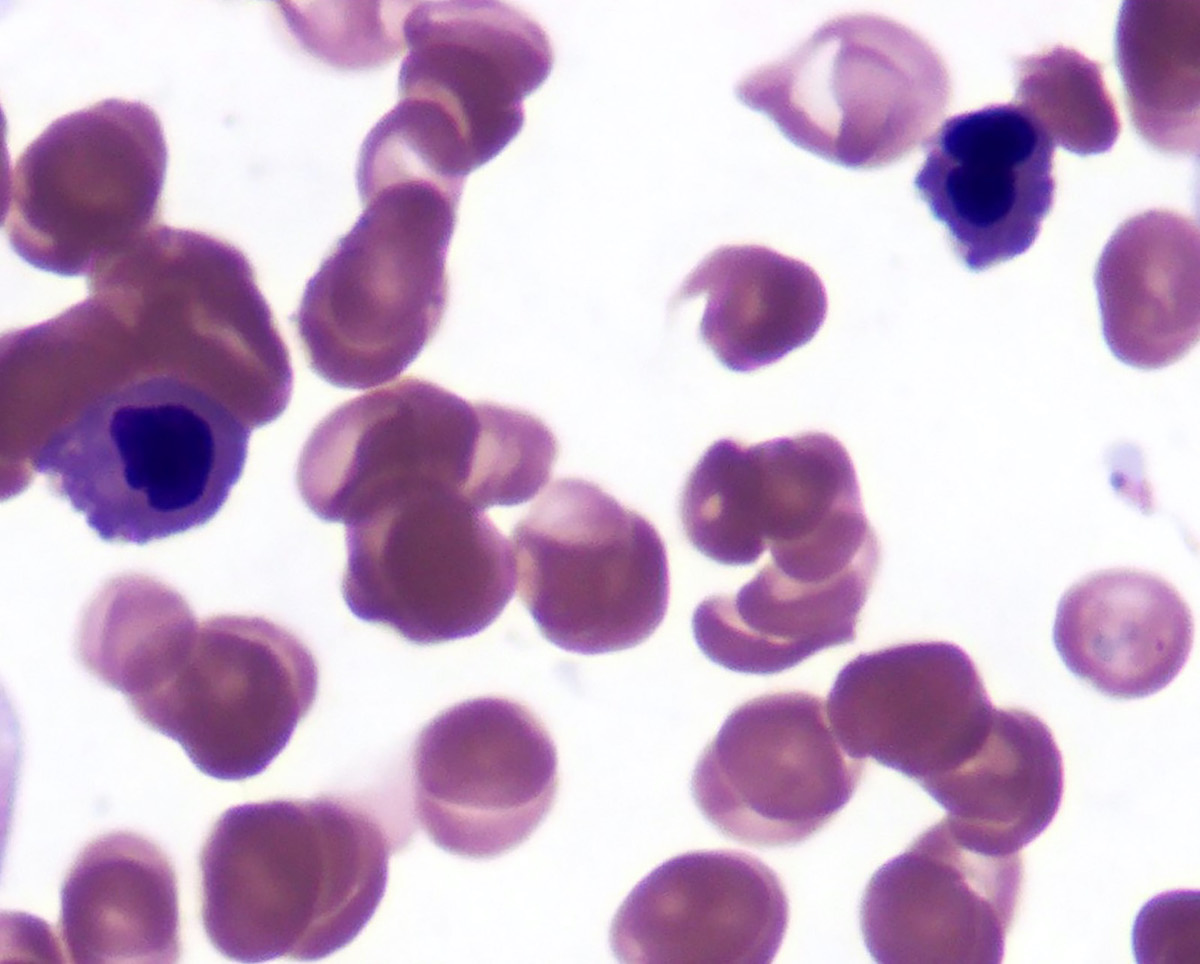
Myeloid dysplasia
Myeloid dysplasia

Megakaryocytic dysplasia
Megakaryocytic dysplasia
Contributed by Beenu Thakral, M.D.
CD45 versus side scatter

CD19 versus CD33
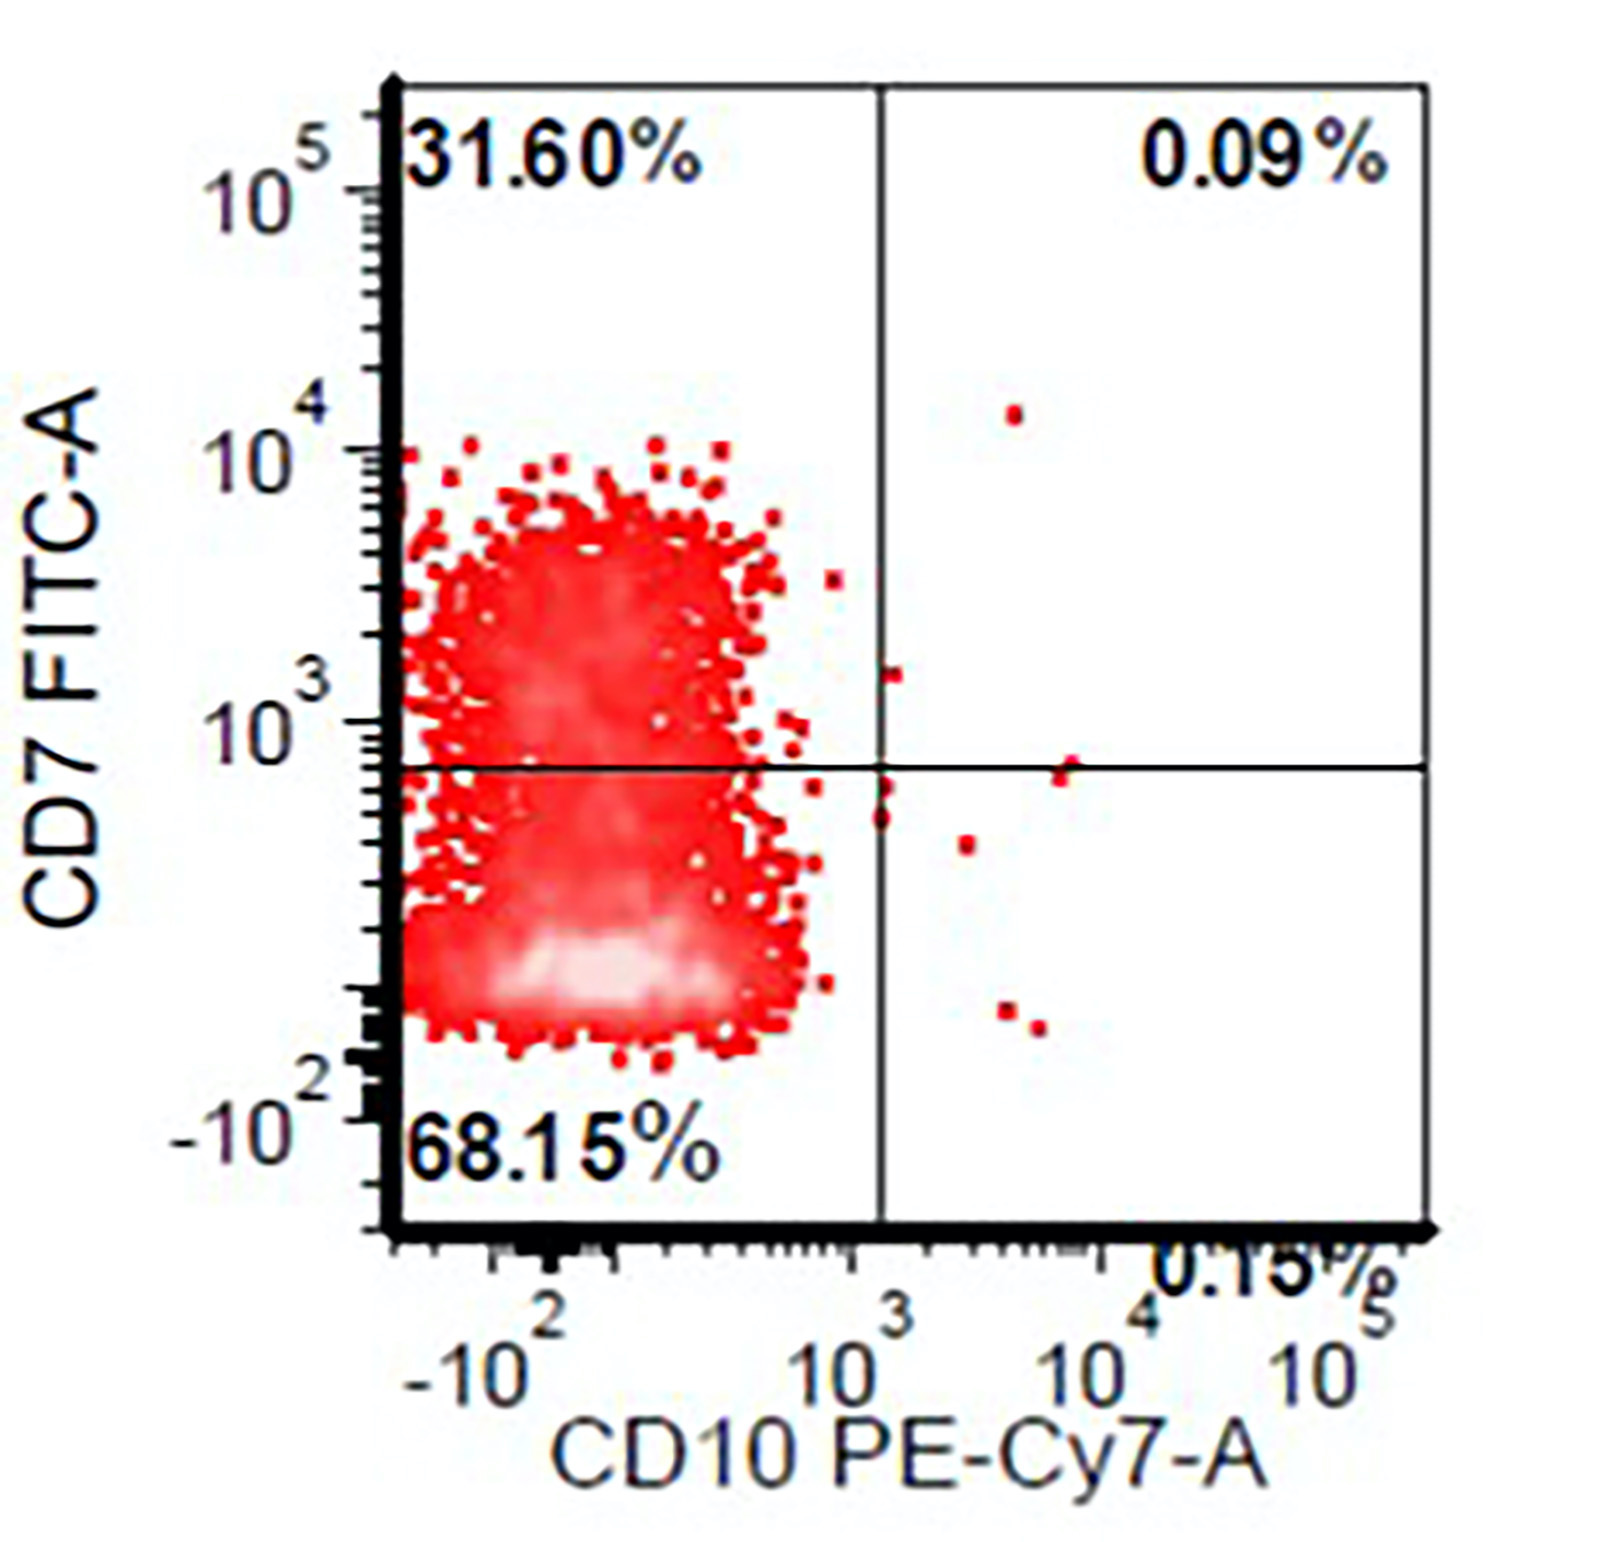
CD7 versus CD10
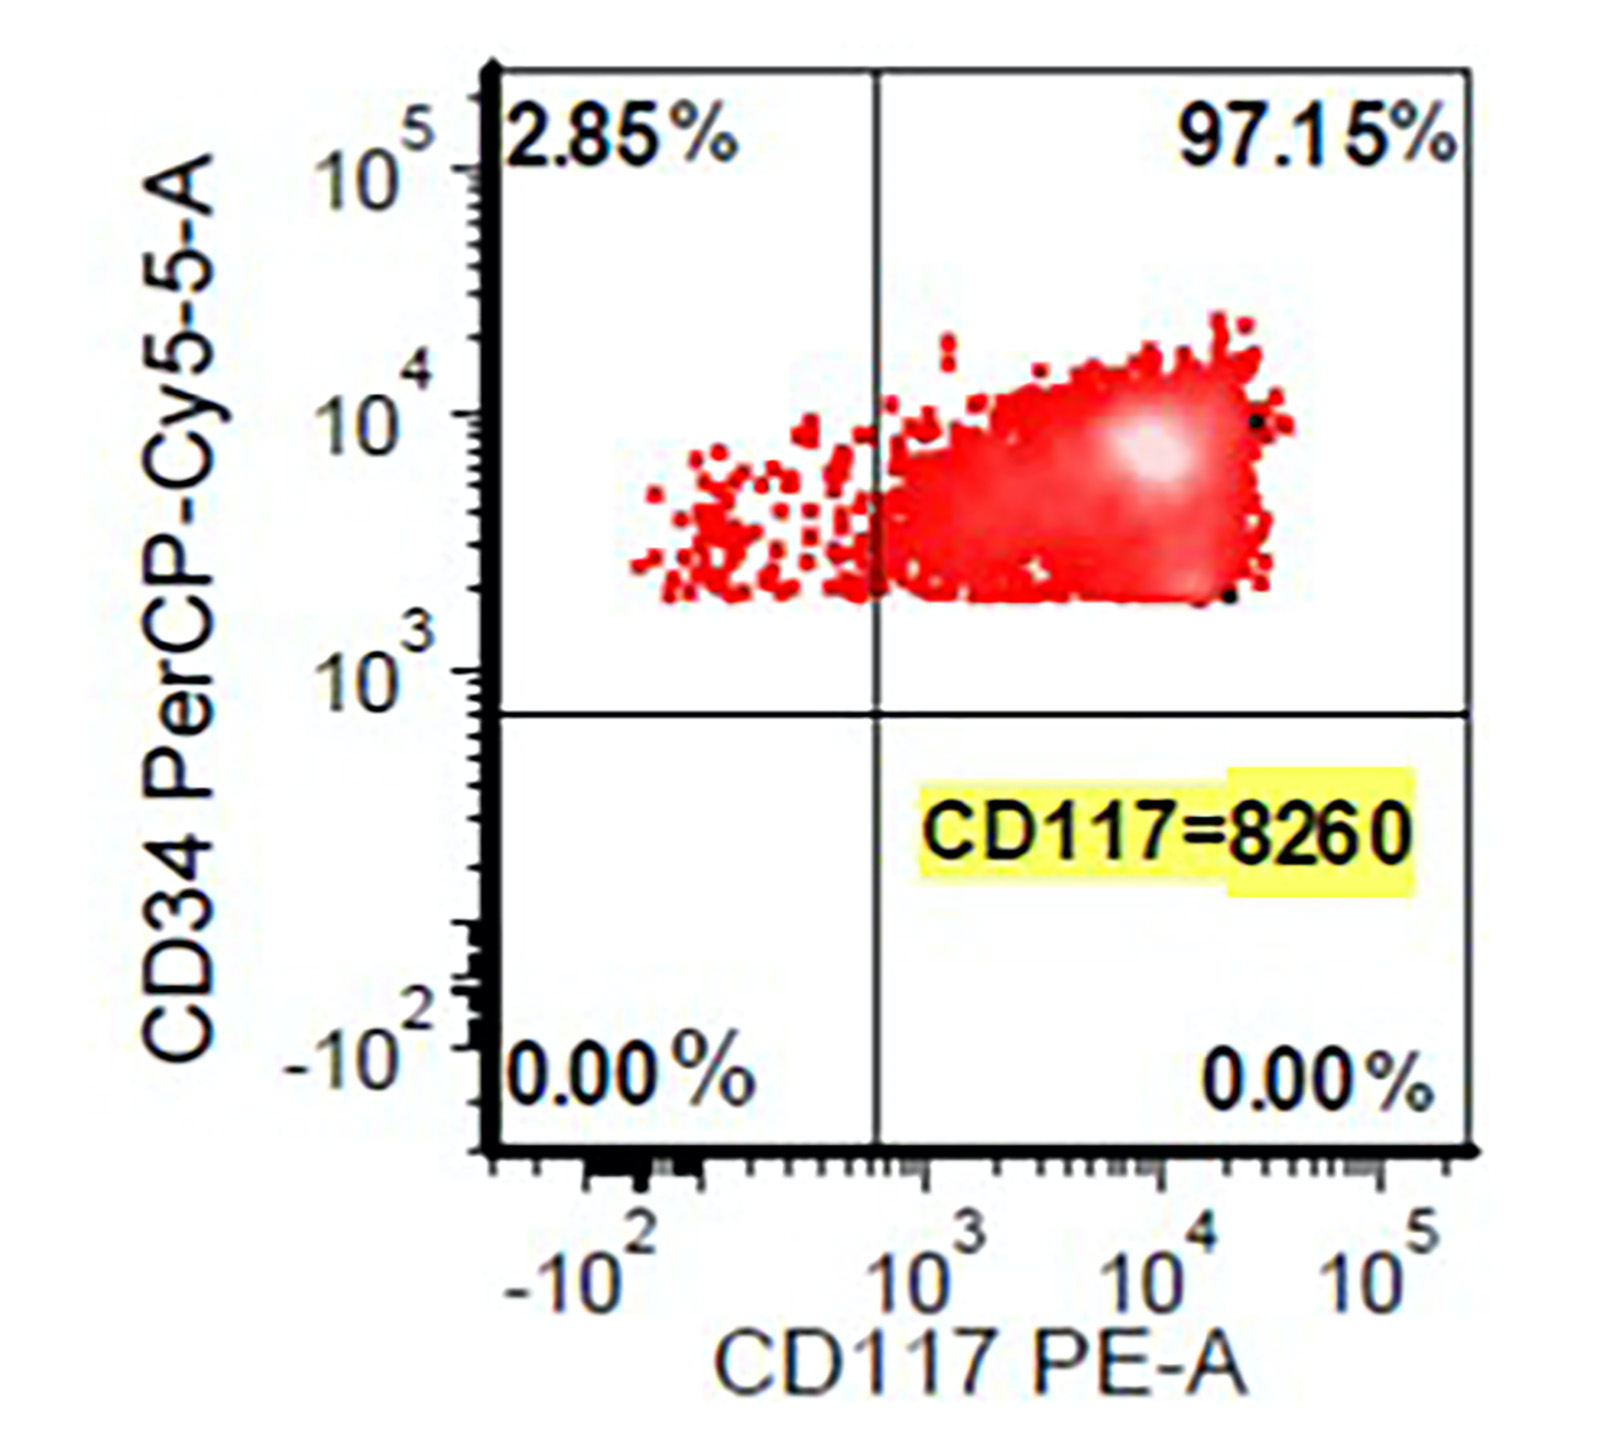
CD117 versus CD34
| Comparison of guidelines | WHO 4th edition, 2016 | WHO 5th edition, 2022 | ICC 2022 | |
| Name of the entity | Myelodysplastic syndrome (MDS) | Myelodysplastic neoplasms (MDS) | Myelodysplastic syndromes (MDS) | |
| Morphologically defined | ||||
| Lineage | MDS-SLD MDS-MLD | Subclassification using dysplastic lineages removed, replaced with MDS-LB (MDS with low blasts) | MDS, NOS-SLD MDS, NOS-MLD | |
| Excessive blast counts in bone marrow (5 - 9%) or in peripheral blood (2 - 4%) | MDS-EB-I# | MDS-IB1 | MDS-EB* | |
| Excessive blast counts in bone marrow (10 - 19%) or in peripheral blood (5 - 19%) | MDS-EB-II# | MDS-IB2 | MDS-AML** | |
| Others | MDS-U | cMDS (MDS of childhood) MDS-h (hypoplastic MDS) MDS-f (MDS with fibrosis, blasts 5 - 19% in bone marrow, 2 - 19% in peripheral blood) | MDS, NOS (without dysplasia) | |
| Defining genetic abnormalities | ||||
| SF3B1 mutation | MDS-RS-SLD MDS-RS-MLD (5% ring sideroblasts if SF3B1 mutated, 15% ring sideroblasts if SF3B1 wild type) | MDS-SF3B1 (MDS with low blasts and SF3B1 mutation or MDS with ring sideroblasts if SF3B1 wild type) | MDS-SF3B1 (MDS with mutated SF3B1) or MDS, NOS (with ring sideroblasts and SF3B1 wild type) | |
| del(5q) | MDS with isolated del(5q) | MDS-5q (MDS with low blasts and 5q deletion) [5q deletion alone or with 1 other genetic aberration other than del(7q) / -7] | MDS with del(5q) [del(5q) is isolated or with up 1 genetic aberration except del(7q) / -7 or multihit TP53] | |
| TP53 | Not included in classification | MDS-biTP53 (MDS with biallelic TP53 inactivation) | MDS with mutated TP53 Multihit TP53 Includes MDS, MDS / AML, AML | |
- WHO 4th edition, 2016
- MDS-SLD: MDS with single lineage dysplasia
- MDS-MLD: MDS with multilineage dysplasia
- MDS-RS-SLD: MDS with ring sideroblasts and single lineage dysplasia
- MDS-RS-MLD: MDS with ring sideroblasts and multilineage dysplasia
- MDS-EB-I: MDS with excess blast I
- MDS-EB-II: MDS with excess blast II
- MDS del(5q): MDS with isolated del(5q)
- MDS-U: MDS, unclassifiable
- RCC: refractory cytopenia of childhood
- WHO 5th edition, 2022
- MDS-LB: MDS with low blasts
- MDS-IB1: MDS with increased blasts I
- MDS-IB2: MDS with increased blasts II
- cMDS: MDS of childhood
- MDS-h: hypoplastic MDS
- MDS-f: MDS with fibrosis
- MDS-SF3B1: MDS with low blasts and SF3B1 mutation or MDS with RS if SF3B1 wild type
- MDS-5q: MDS with low blasts and 5q deletion
- MDS-biTP53: MDS with biallelic TP53 inactivation
- ICC 2022
- MDS, NOS-SLD: MDS, not otherwise specified with single lineage dysplasia
- MDS, NOS-MLD: MDS, not otherwise specified with multilineage dysplasia
- MDS-EB: MDS with excess blasts
- MDS-AML: myelodysplastic syndrome / acute myeloid leukemia
- MDS-SF3B1: MDS with mutated SF3B1
- MDS, NOS: MDS, not otherwise specified
- * ICC MDS-EB, MDS with excess blasts (blast count 5 - 9% in bone marrow, 2 - 4% in peripheral blood)
- ** ICC MDS-AML: myelodysplastic syndrome / acute myeloid leukemia (blast count 10 - 19% in bone marrow and 2 - 4% in peripheral blood)
- # WHO 4th edition, 2016: MDS-EB including MDS-EB and erythroid preponderance and MDS-EB and fibrosis
Contributed by Ling Zhang, M.D.

Dysplastic erythroid precursors

Dysplastic myeloid
and megaloblastic
erythroid precursors
Bone marrow core biopsy, MDS with del(5q)


Aspirate smear, MDS with del(5q)

MDS, SF3B1 mutated with increased ring sideroblasts
Dysplastic
megakaryocytes
and granulocytes
with biallelic TP53

MDS transformation to AML-MR

ALIP in bone marrow biopsy

ALIP CD34 immunostaining
Contributed by Ling Zhang, M.D.
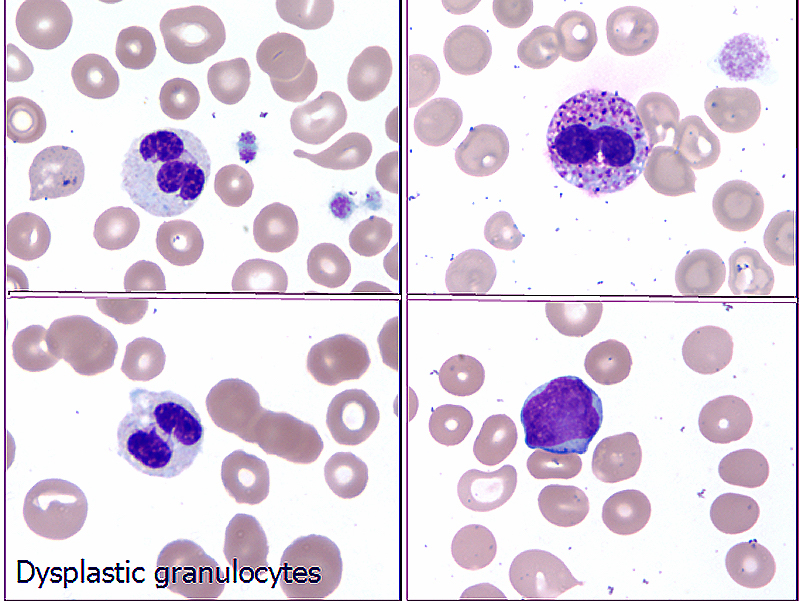
Dysplastic granulocytes and peripheral blood blast
Contributed by Hatem Kaseb, M.D., Ph.D., M.P.H.
Bone biopsy
Interspersed plasma cells
Few mature plasma cells
Contributed by Ameet R. Kini, M.D., Ph.D. and Maryam F. Raouf, M.D.
Increased CD20+ B cells
Increased plasma cells
Contributed by Ameet R. Kini, M.D., Ph.D. and Maryam F. Raouf, M.D.
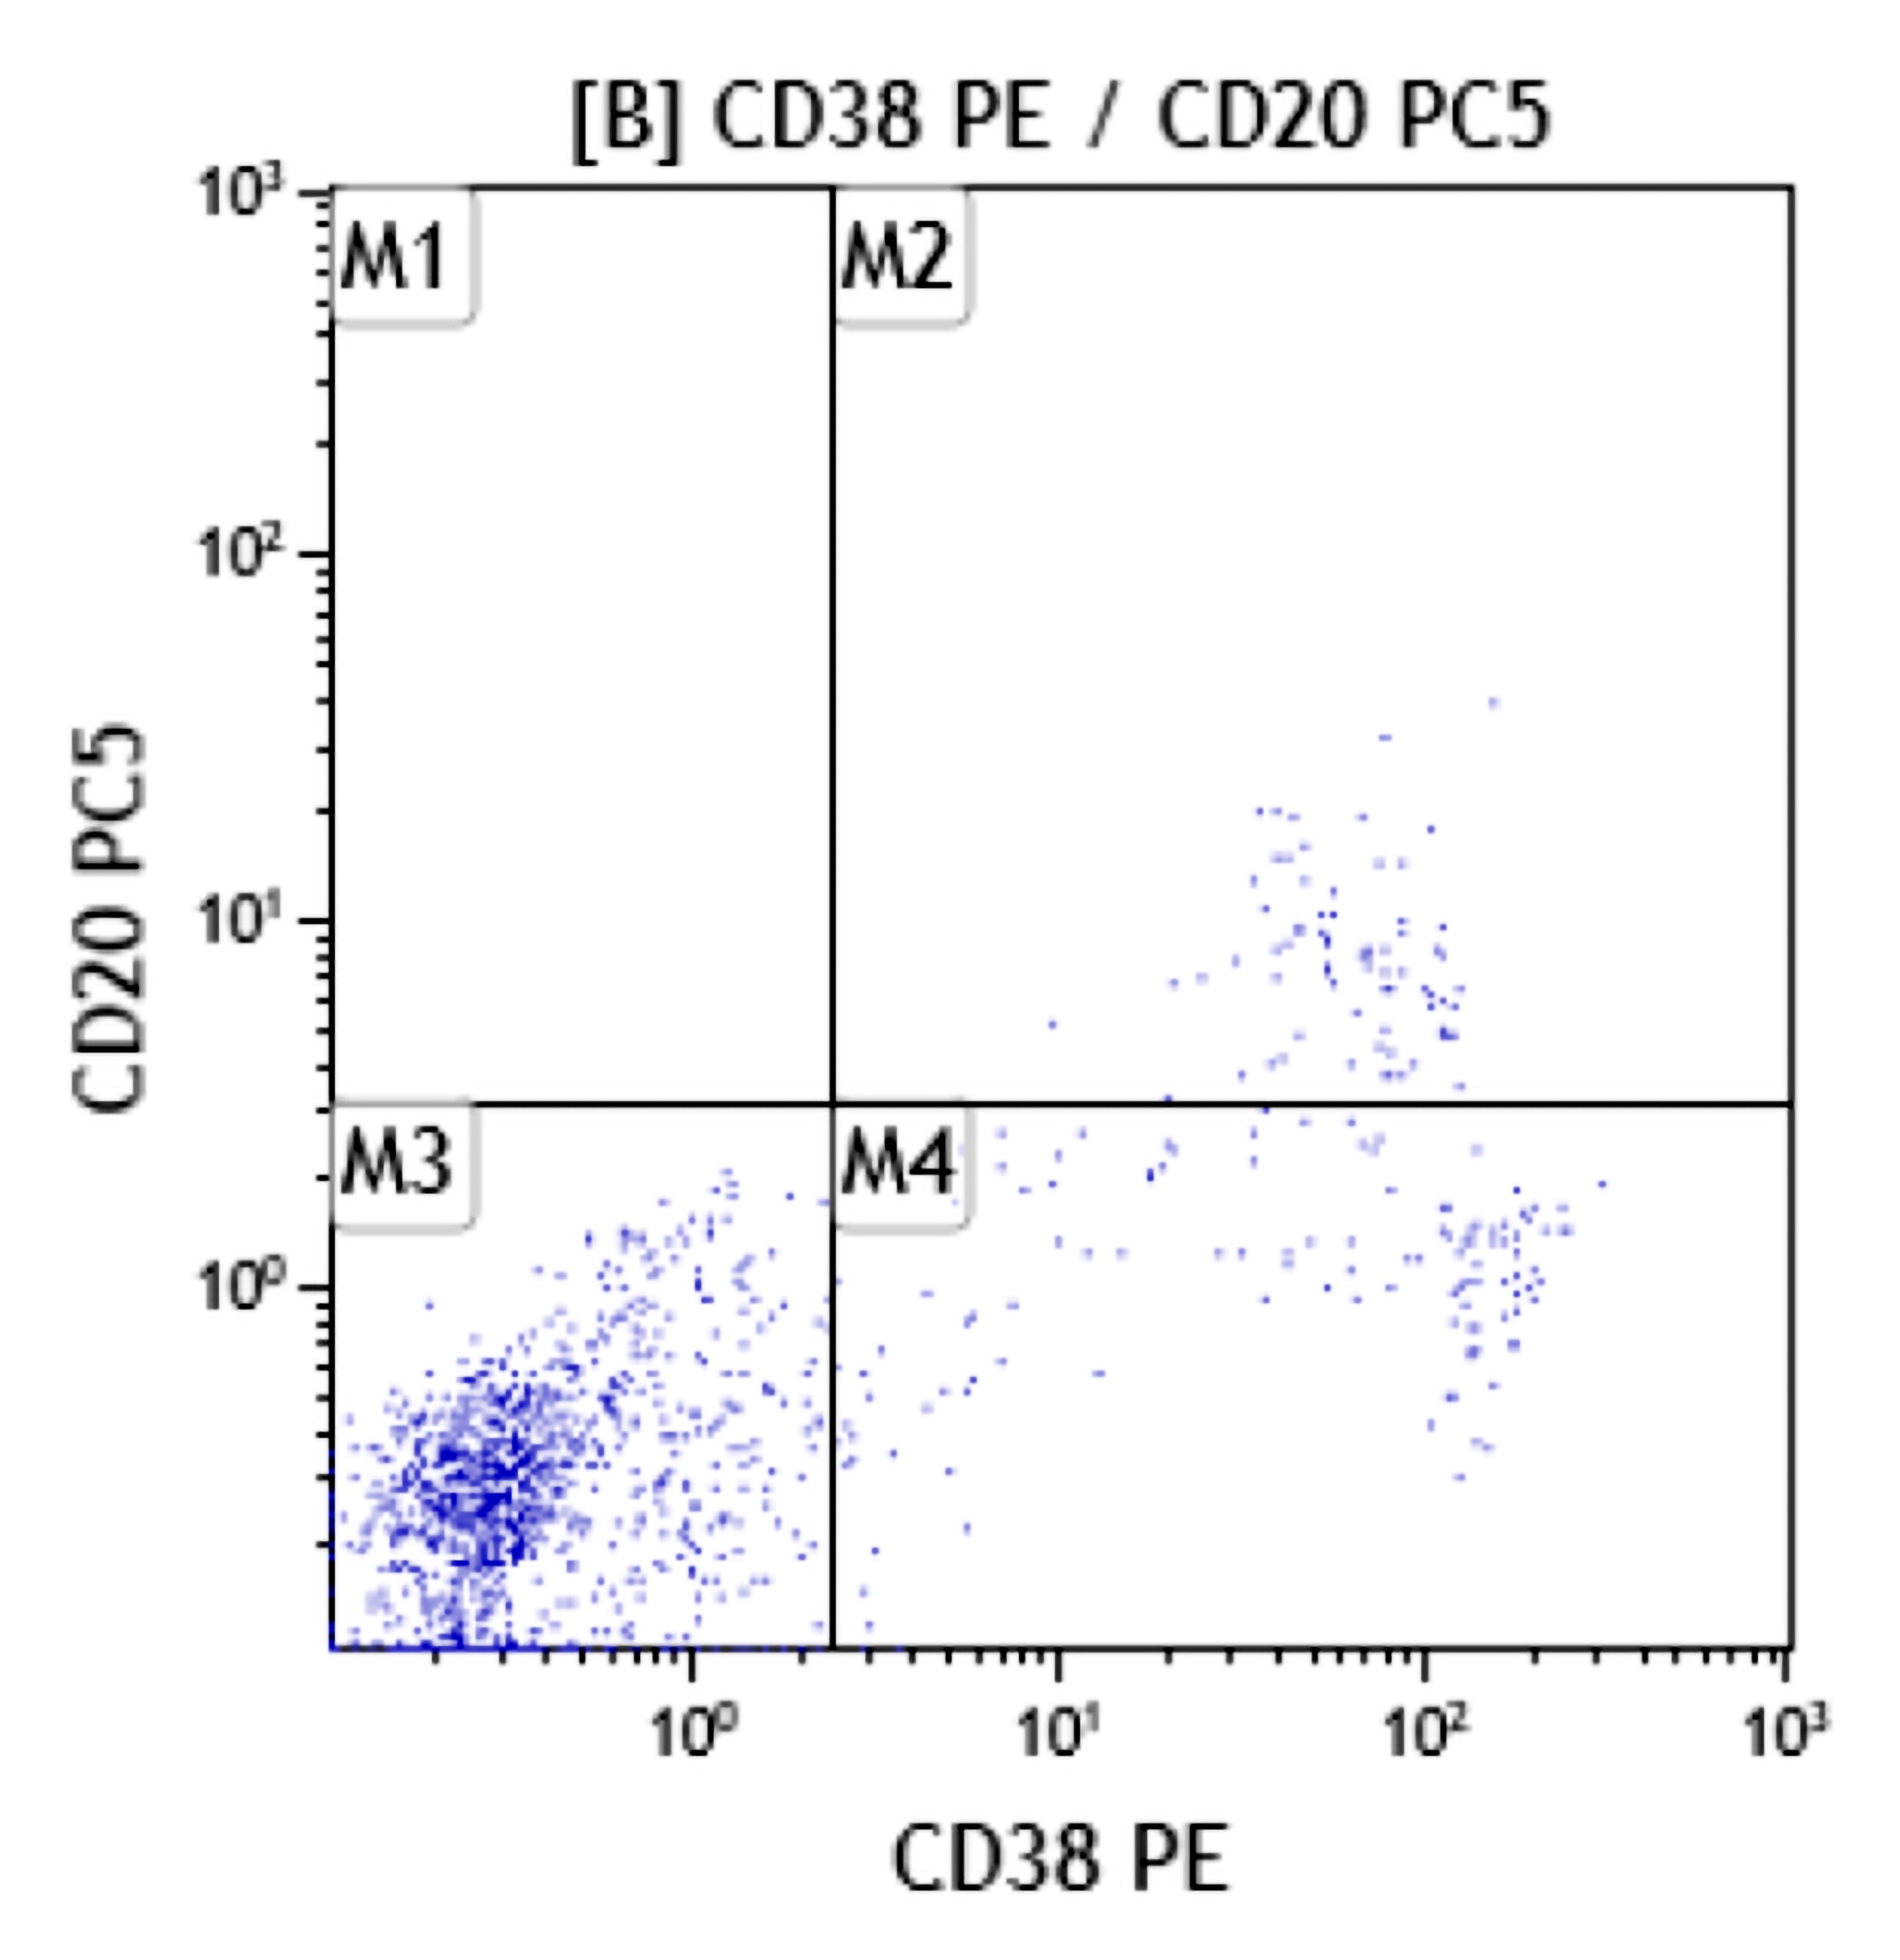
Abnormal plasma cells
Contributed by Ameet R. Kini, M.D., Ph.D. and Maryam F. Raouf, M.D.
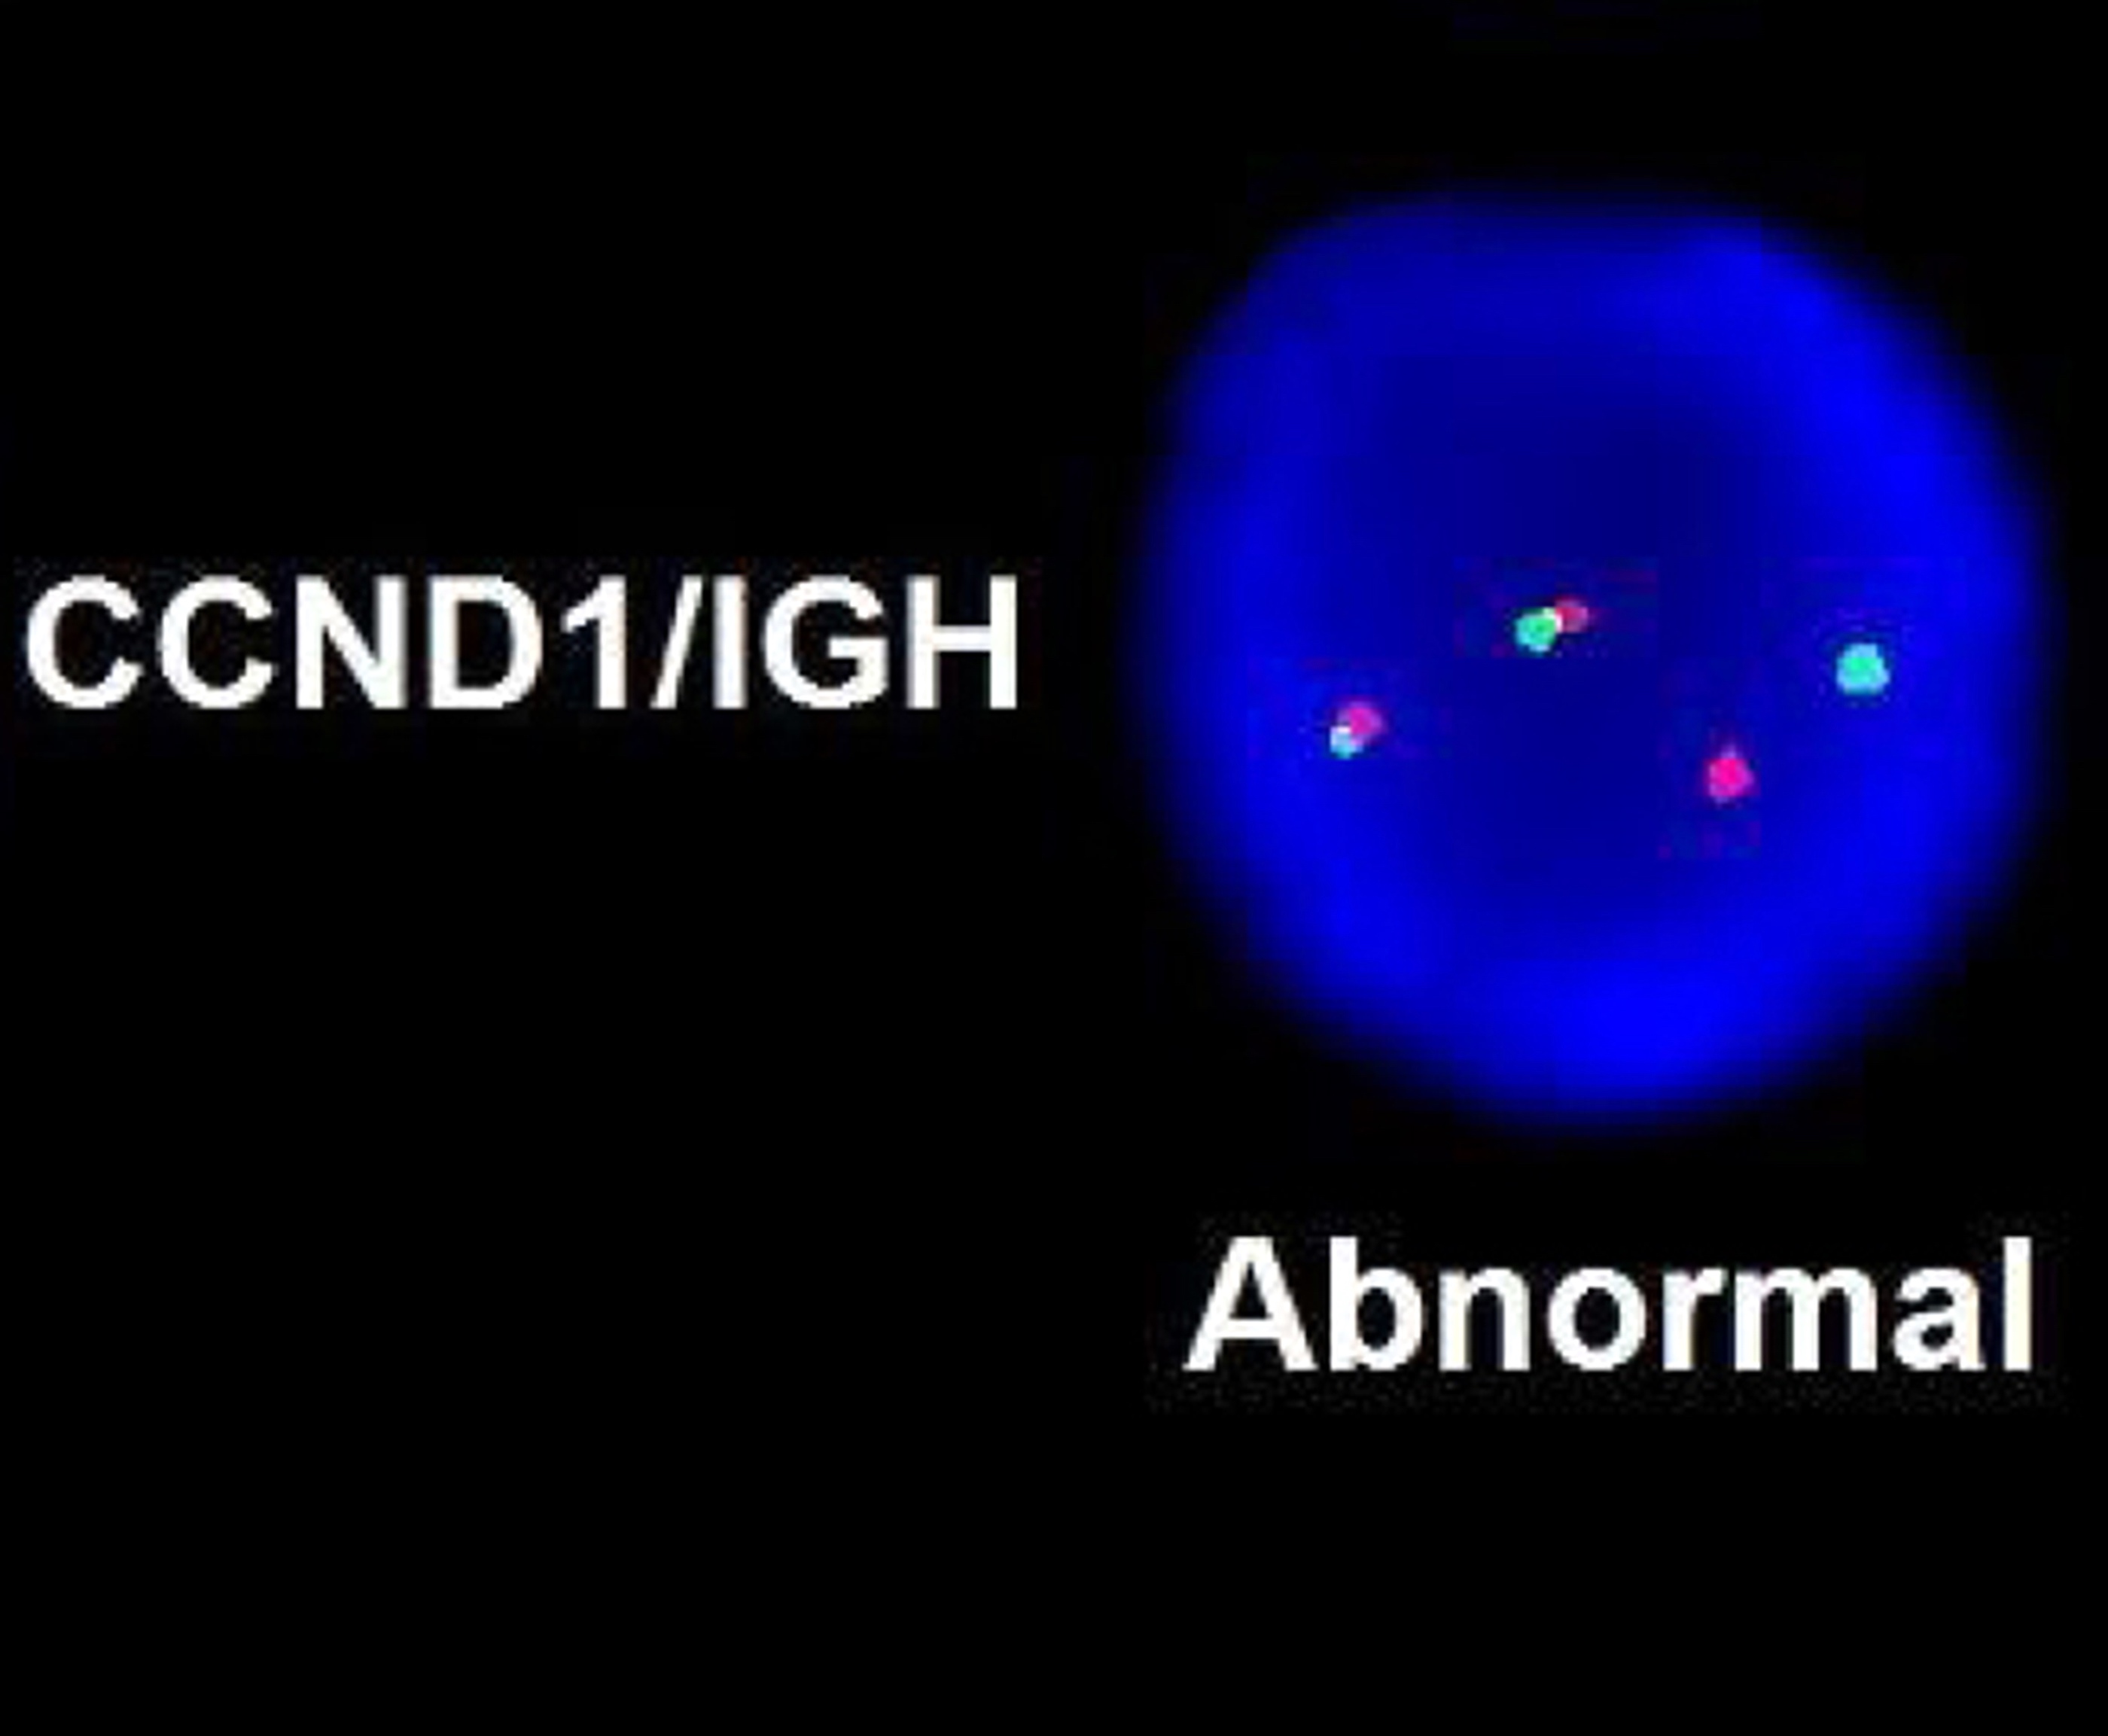
CCND1-IGH fusion
Introduction to MGUS
MGUS diagnosis
MGUS management
MGUS associated diseases
IgM MGUS pathophysiology
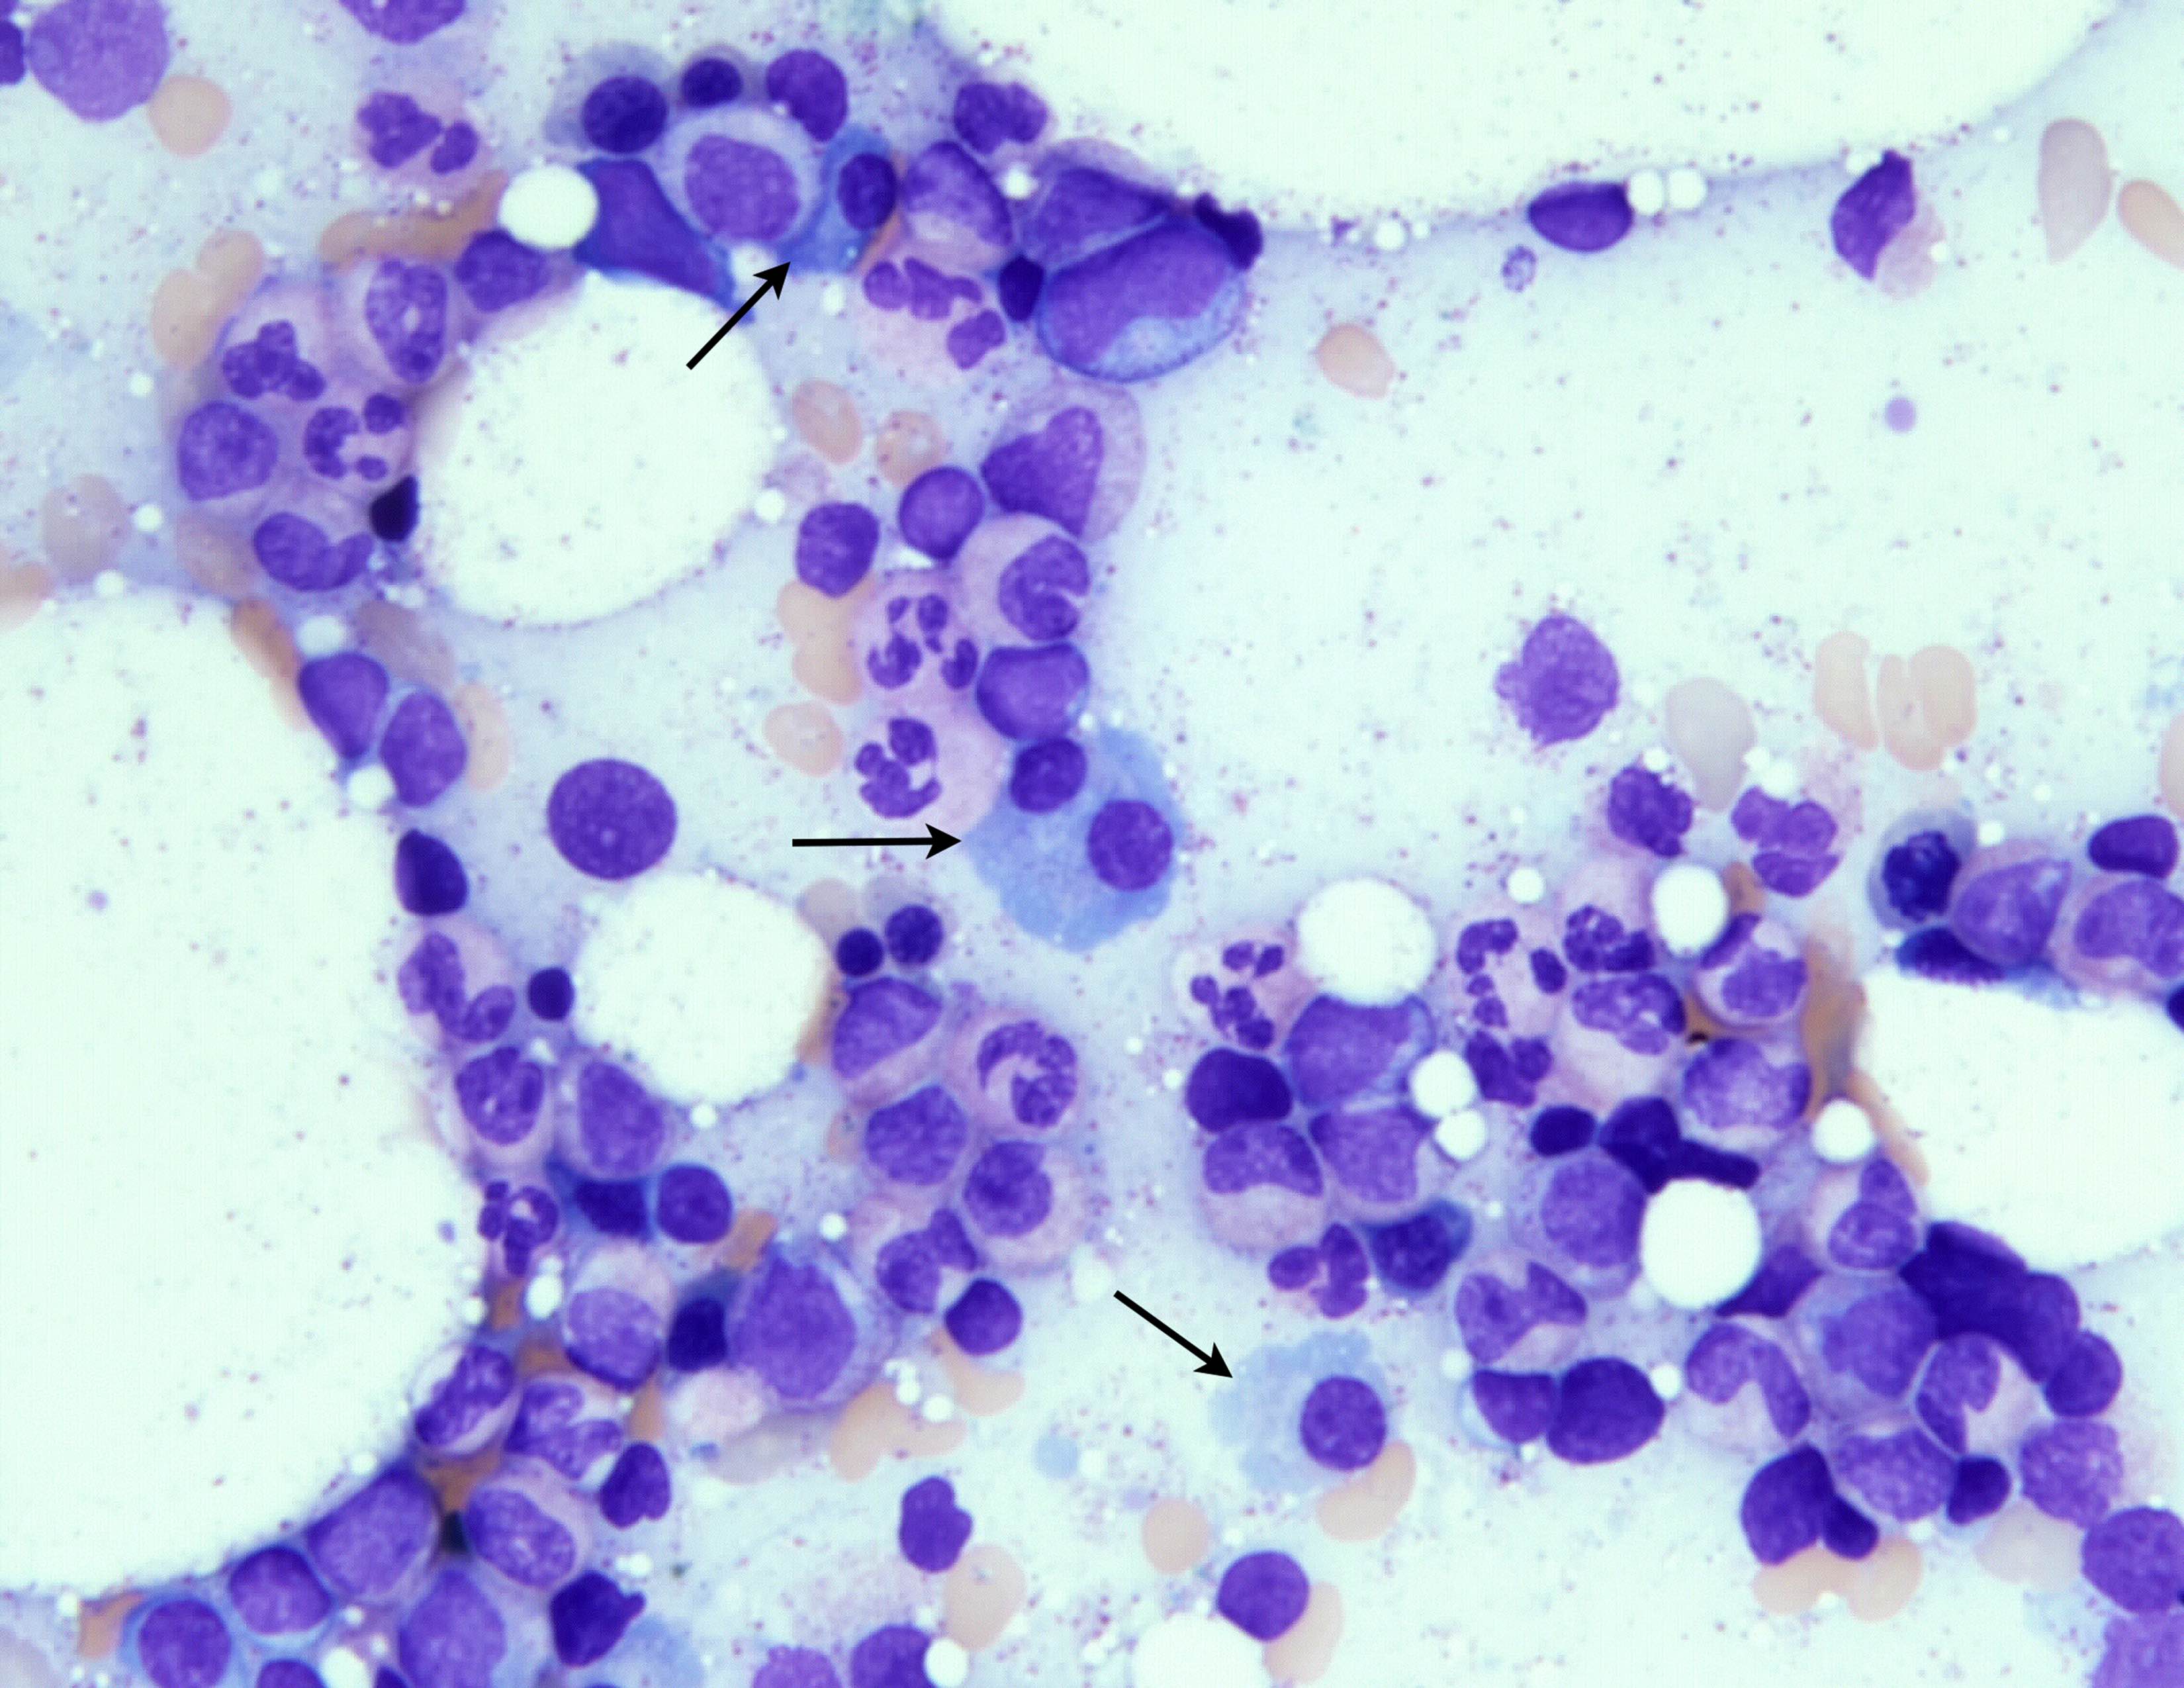
Contributed by Daniela Mihova, M.D.
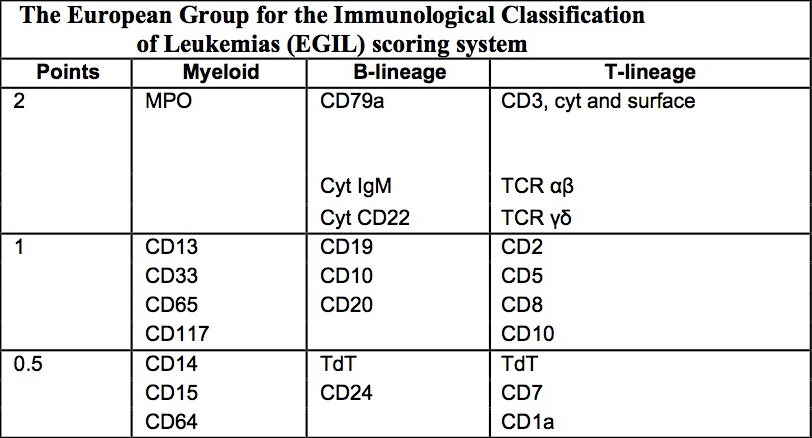
The European Group
for the Immunological
Classification of Leukemias
(EGIL) scoring system
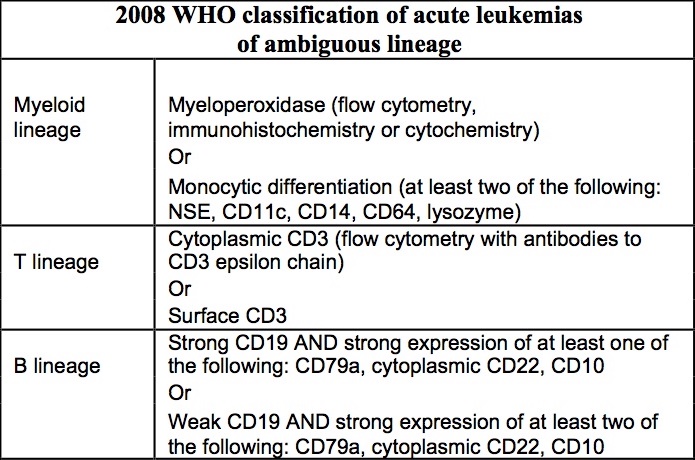
2008 WHO
classification of
acute leukemias of
ambiguous lineage
AFIP images
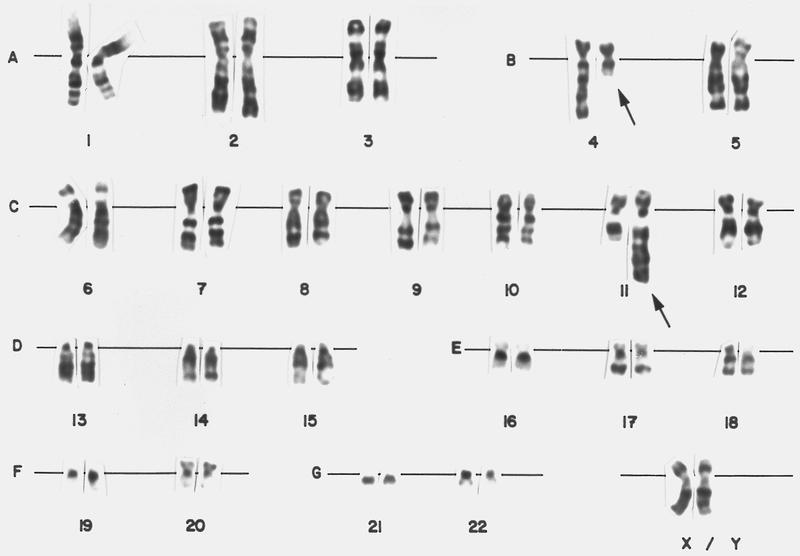
t(4;11)(q21;23) in bilineal leukemia
Contributed by Alexa J. Siddon, M.D.

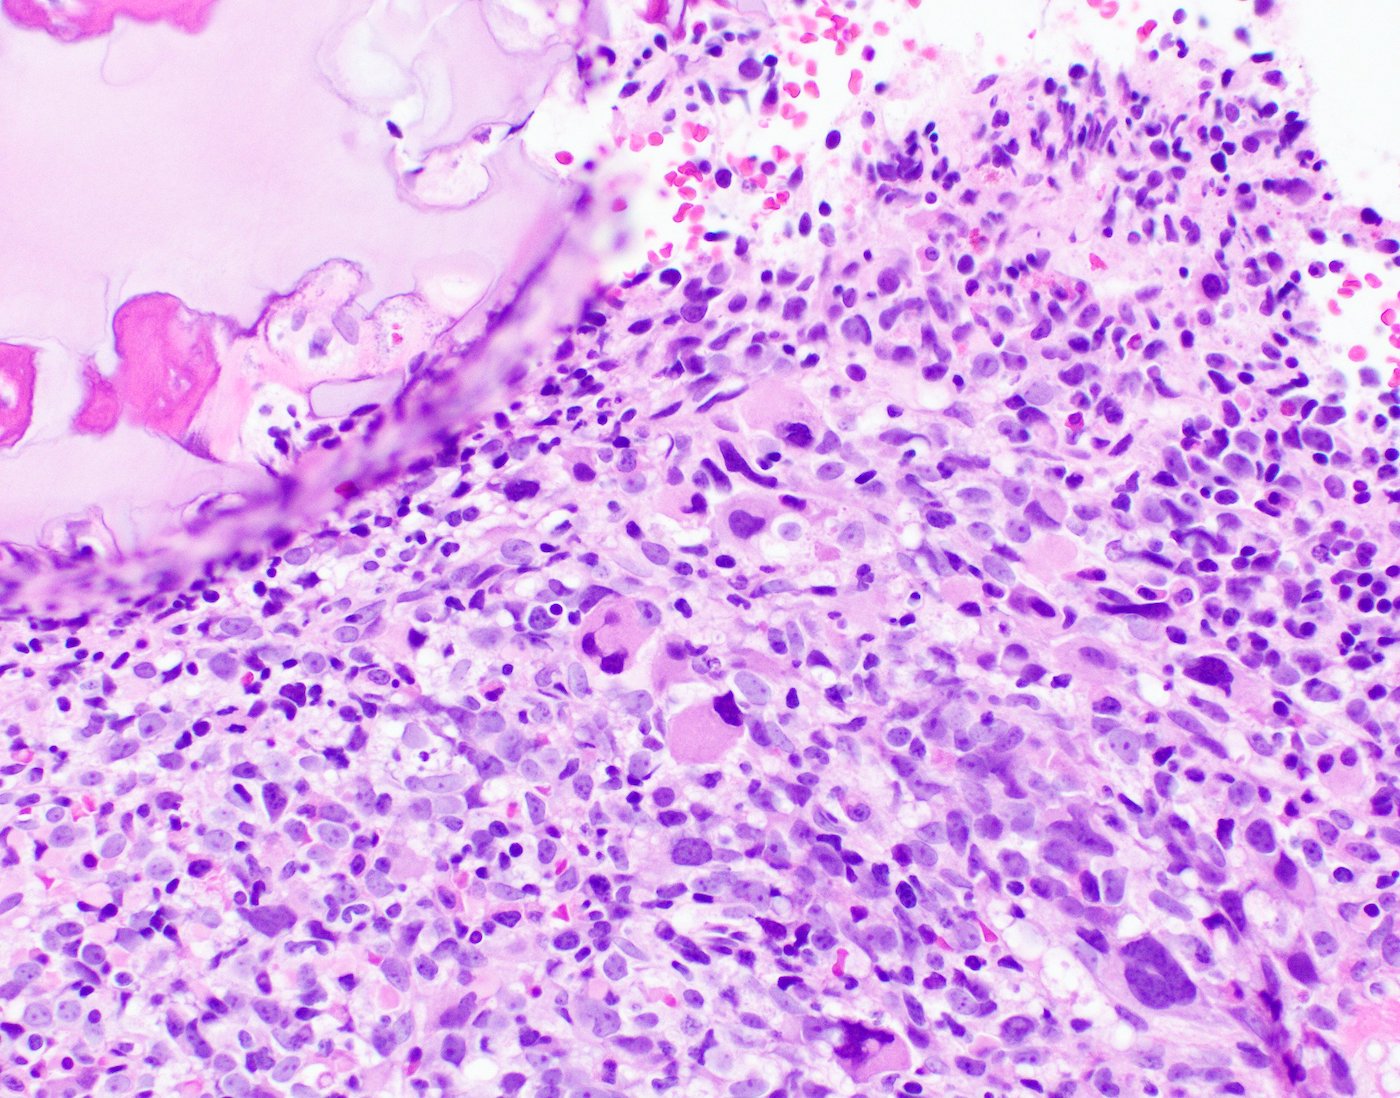
Hypercellular bone marrow
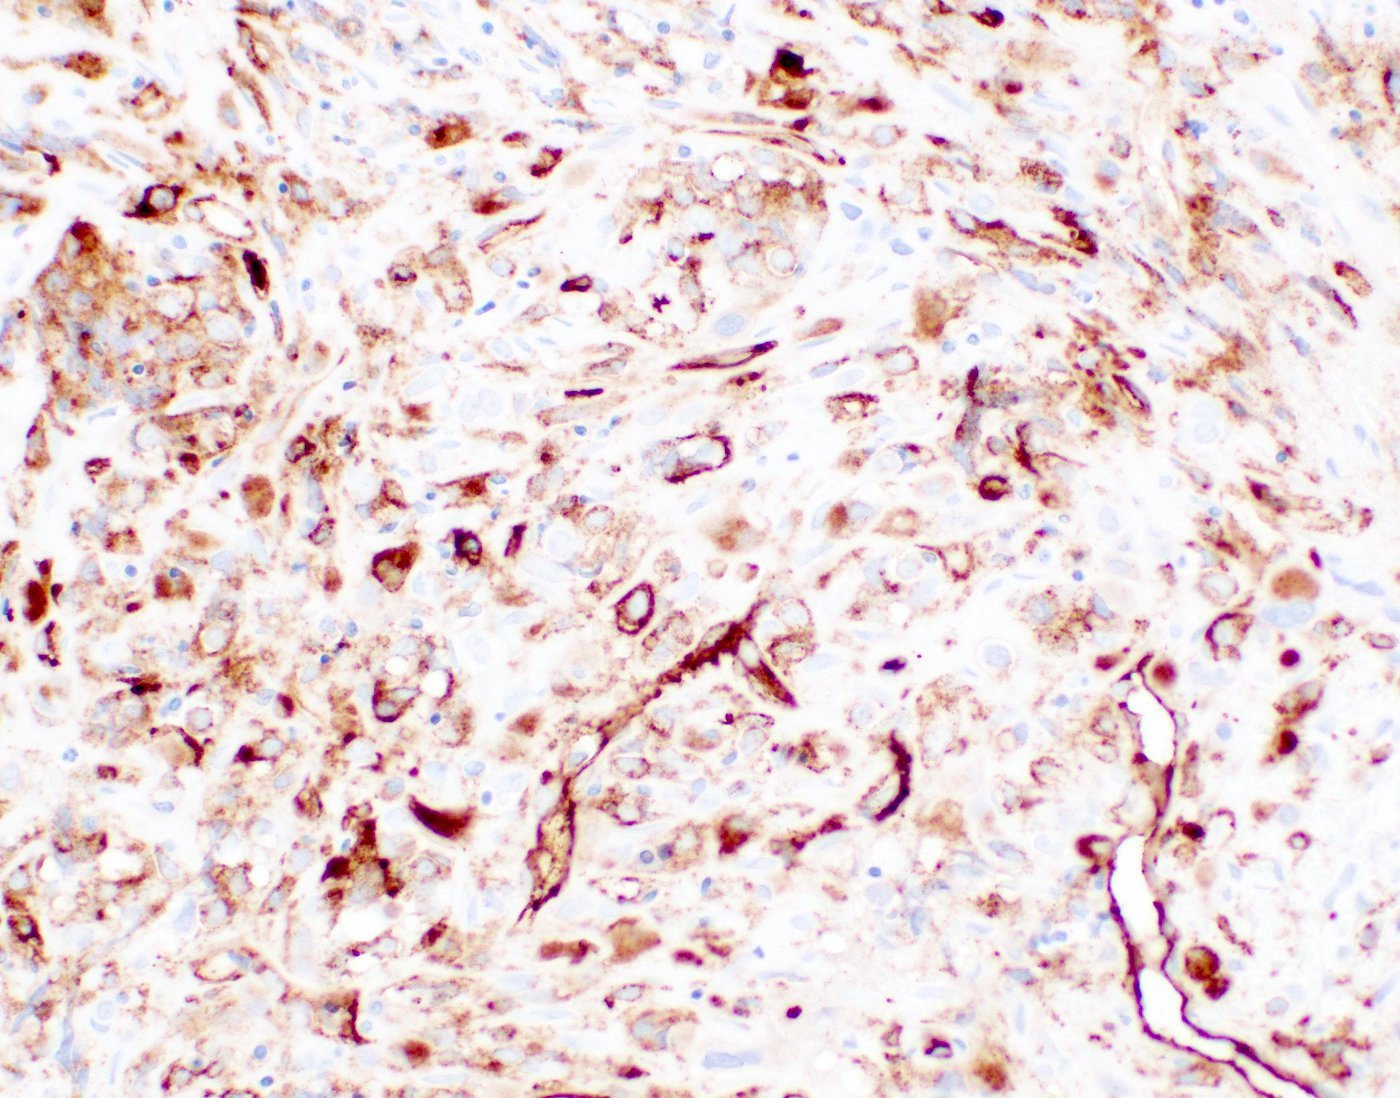
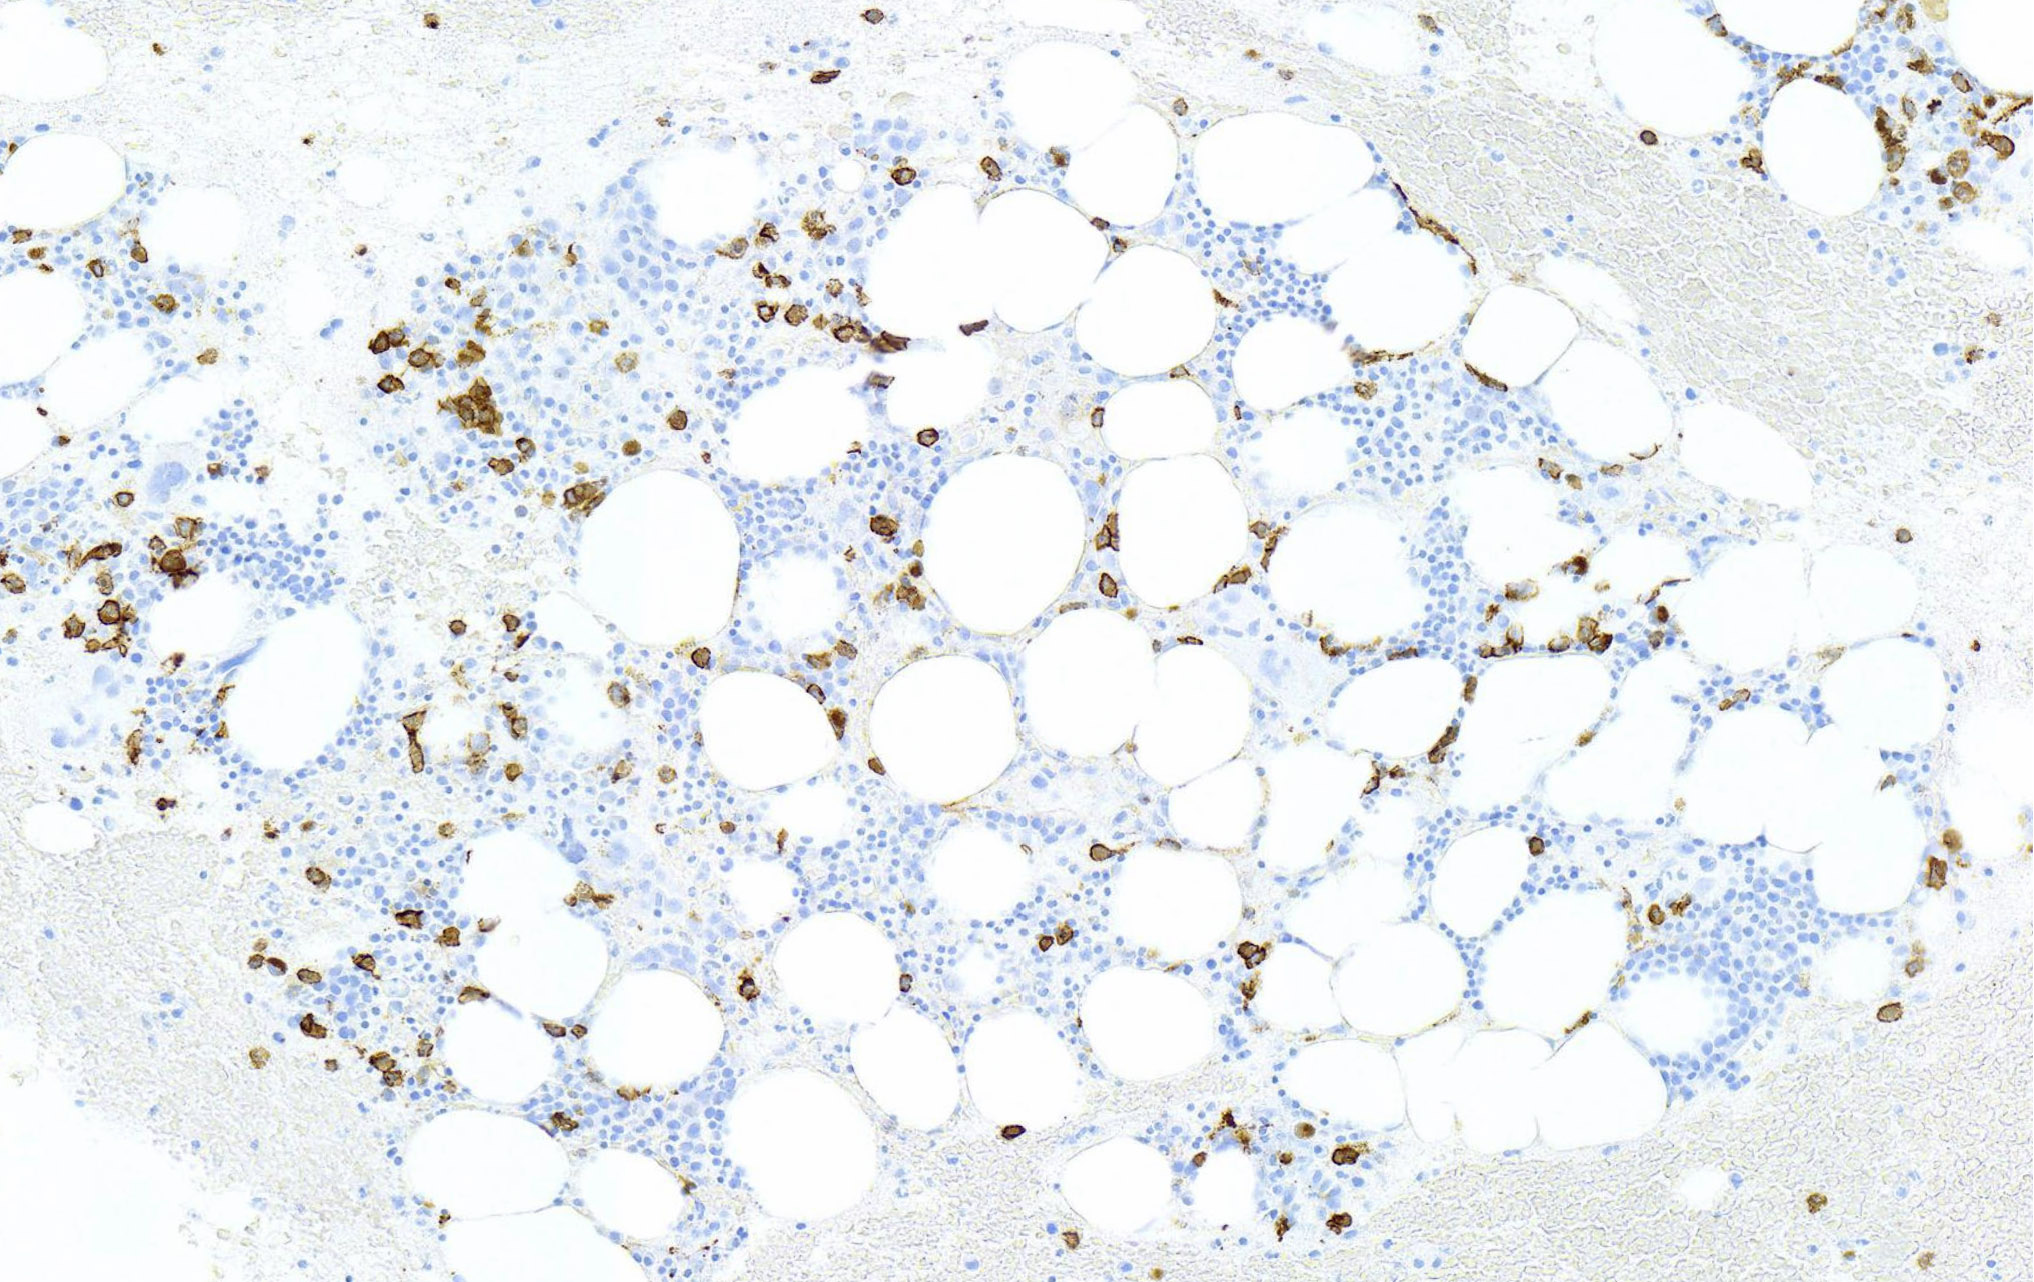
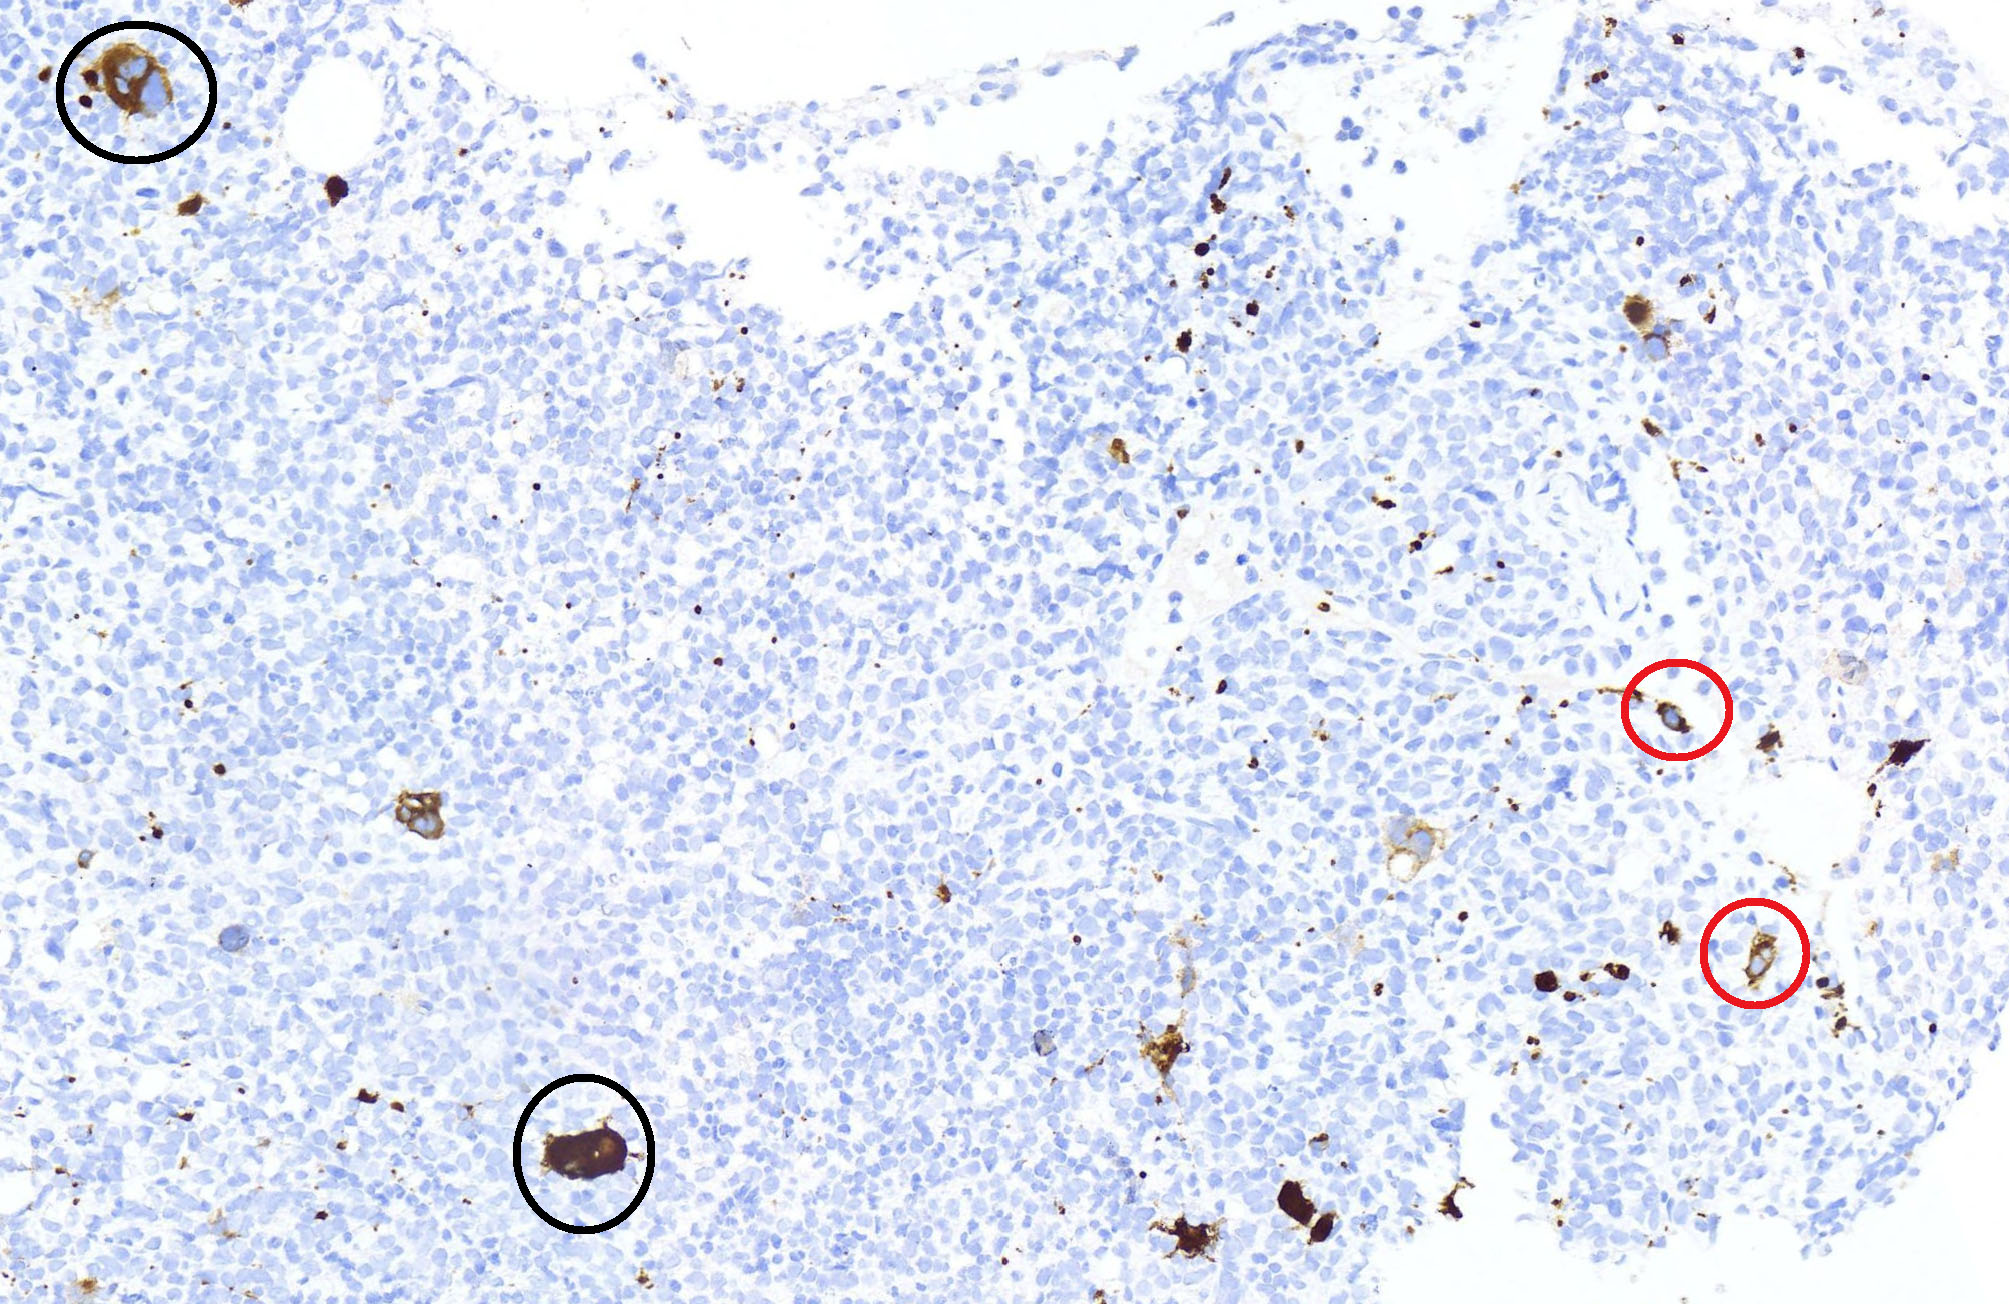
Bone marrow with CD34+ blasts

Bone marrow with CD61+ megakaryocytes and blasts
Contributed by Alexa J. Siddon, M.D.
Megakaryoblasts in peripheral blood
Images hosted on other servers:

Recalcitrant periungual warts
Contributed by Wei Wang, M.D., Ph.D.
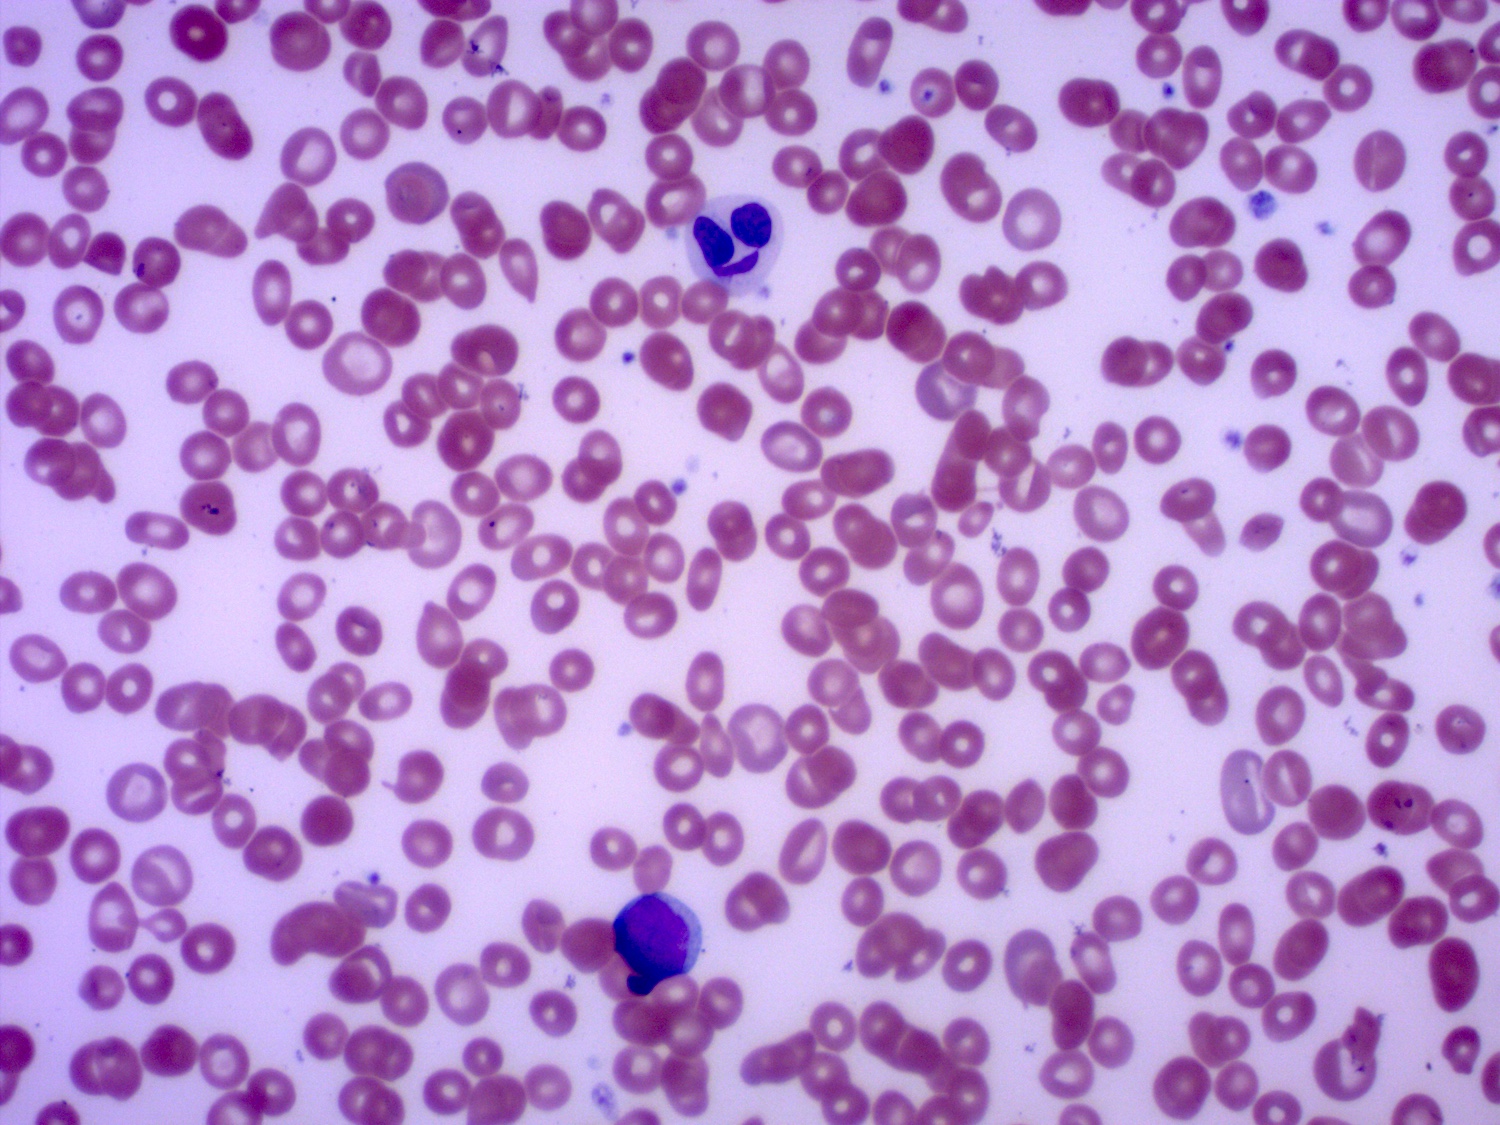
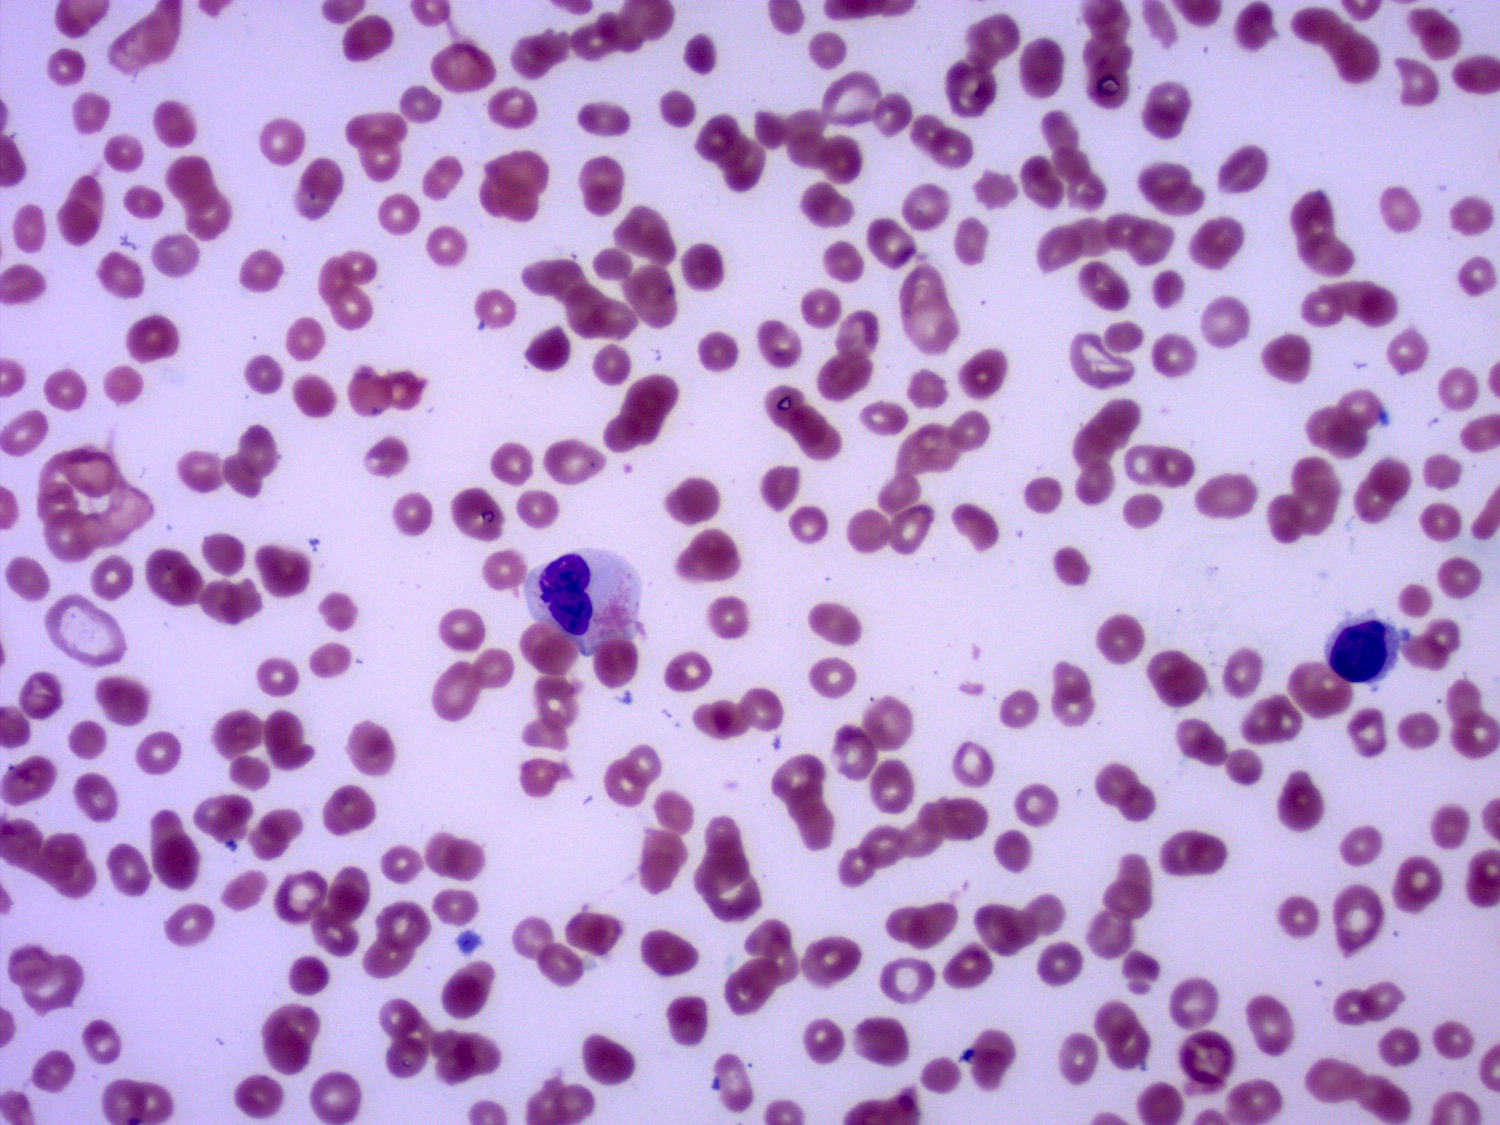
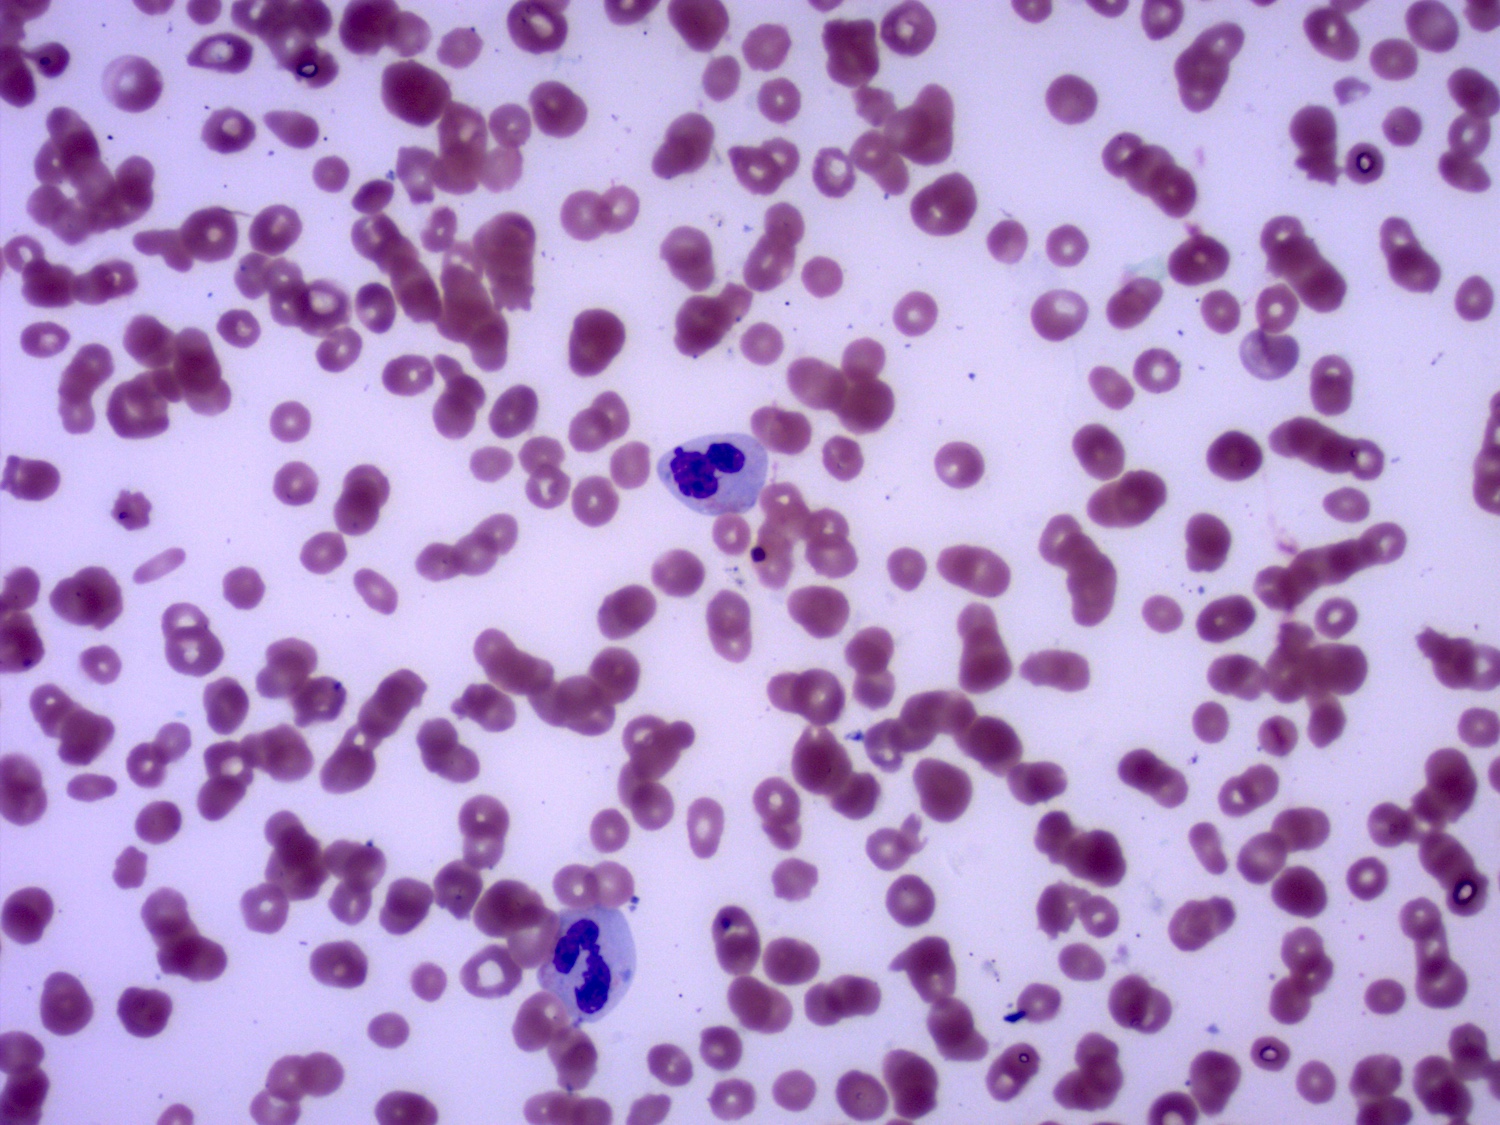
Megakaryocytic dysplasia in MDS
Contributed by Wei Wang, M.D., Ph.D.

Pancytopenia in MDS
Images hosted on other servers:

Flow cytometry study of peripheral blood
Contributed by Zhenya Tang, M.D., Ph.D.
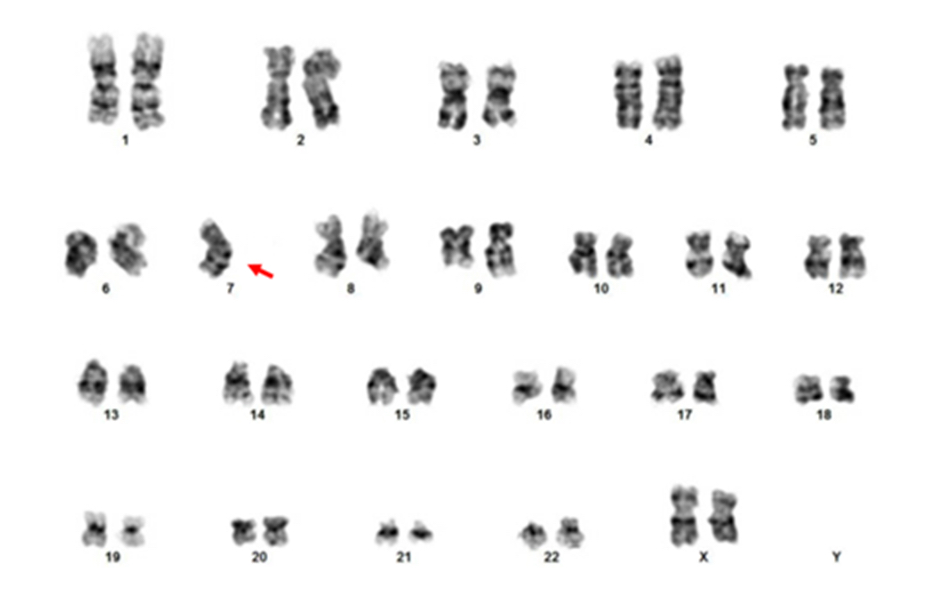
Abnormal karyotype with -7

FISH analysis
Contributed by Barina Aqil, M.D.


Small hypolobated megakaryocyte

Erythroid dysplasia

Scattered blasts

CD61 highlights small megakaryocytes
Contributed by Madina Sukhanova, Ph.D.
RUNX1 whole gene deletion
Images hosted on other servers:

RUNX1 germline mutations

Reverse mosaicism due to LOH
Contributed by Yen-Chun Liu, M.D., Ph.D.
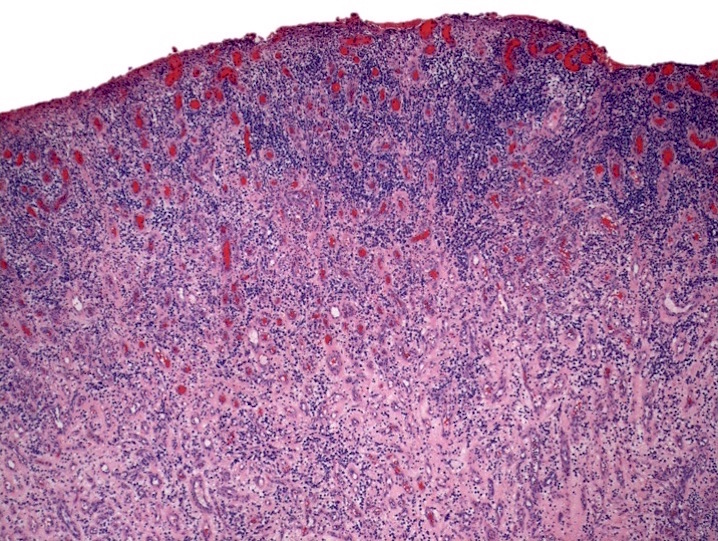
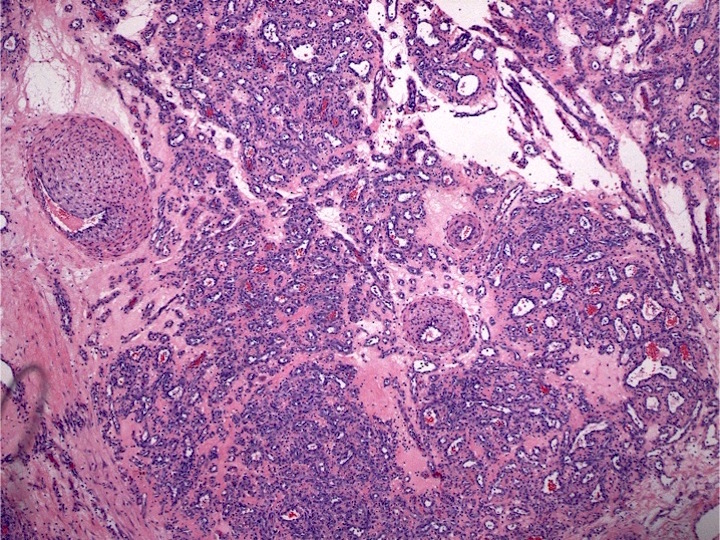
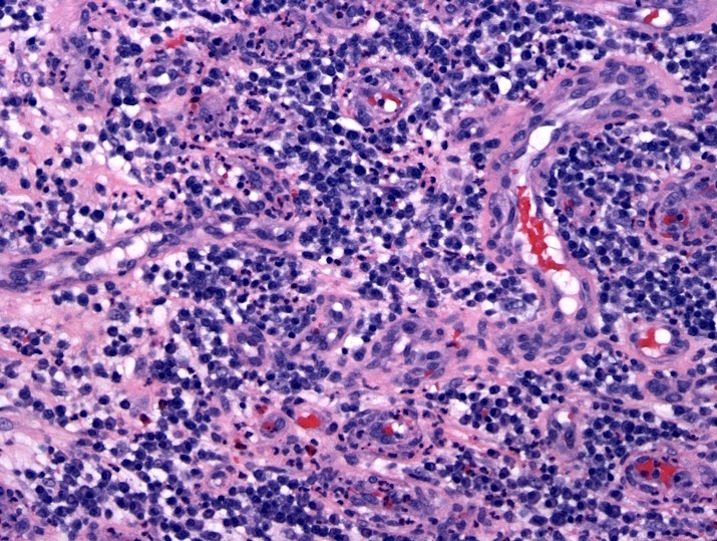
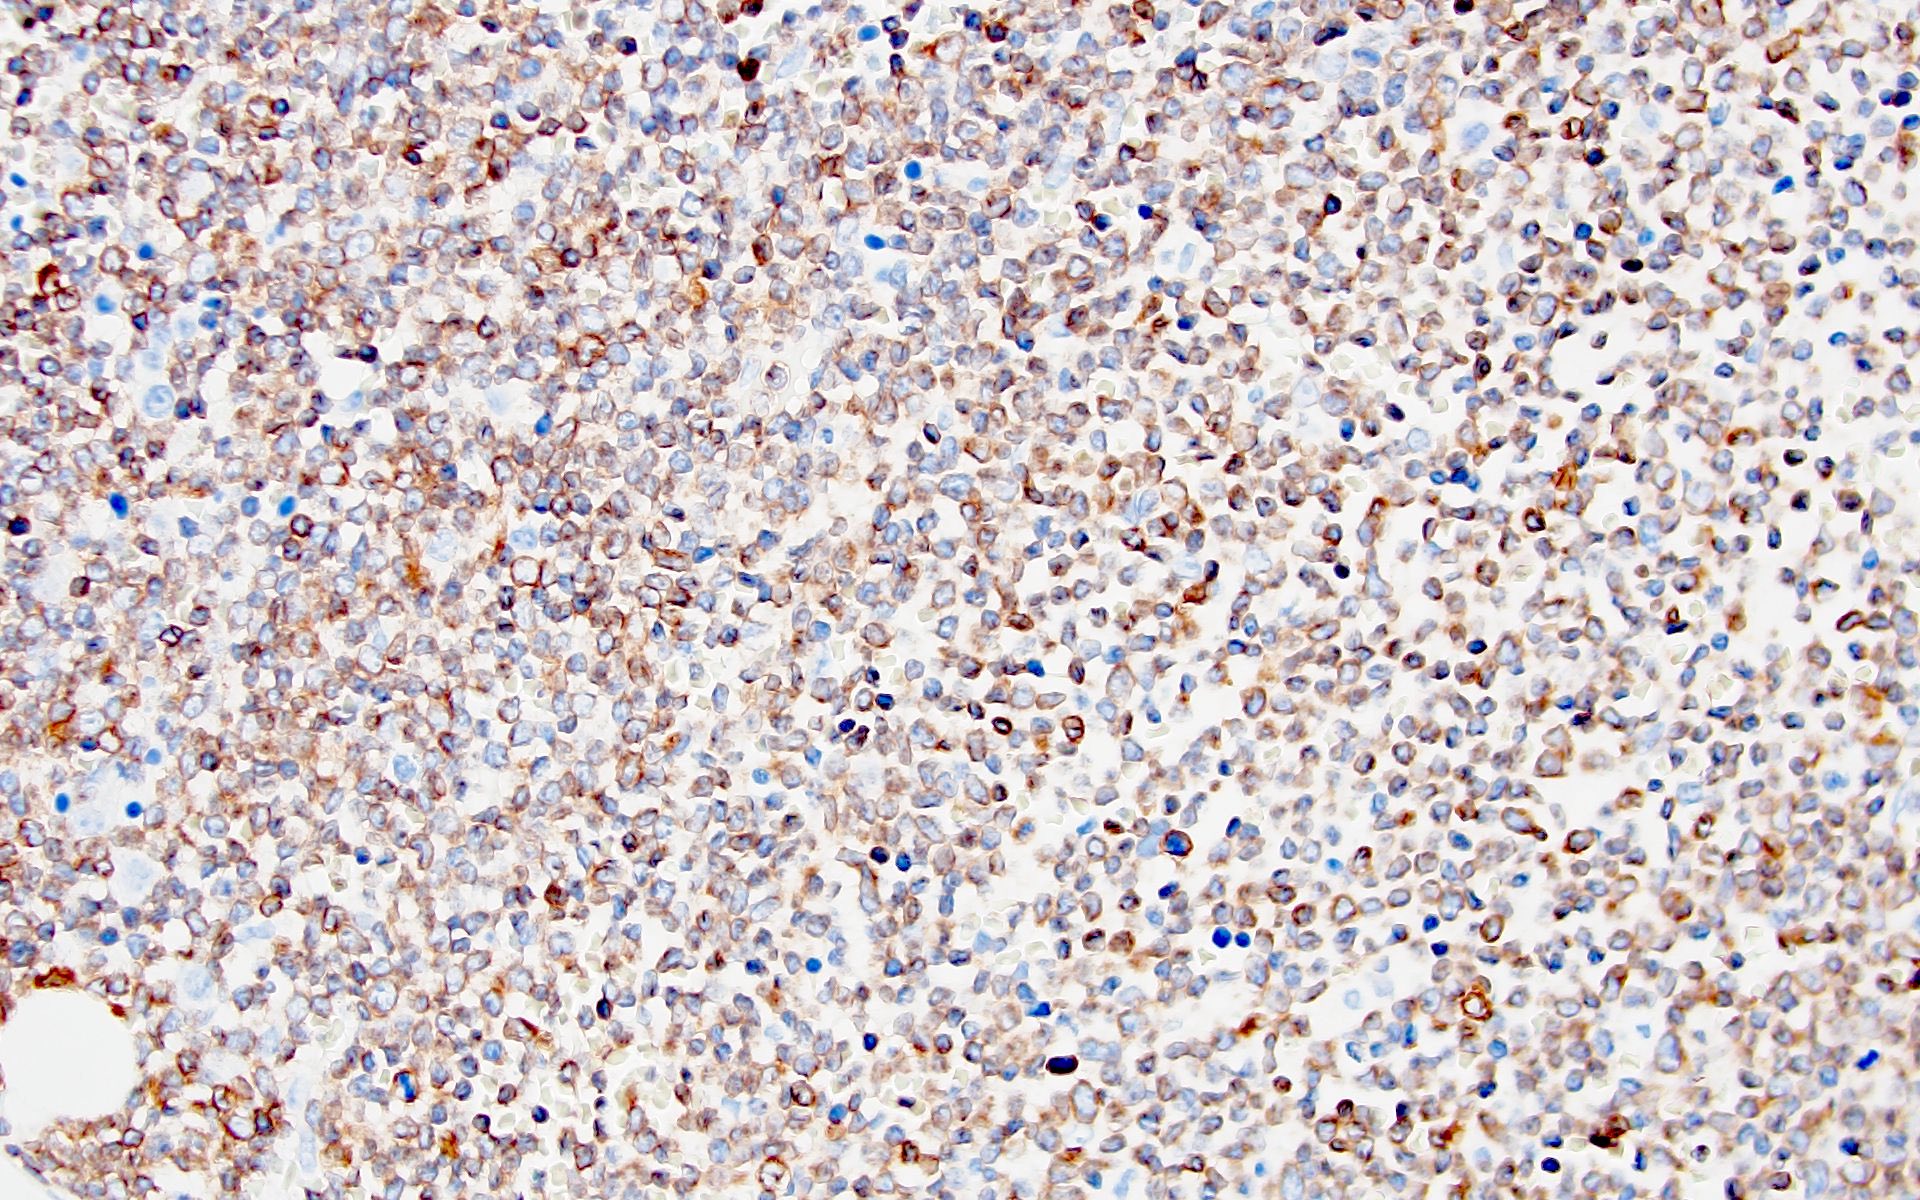
Architecture effaced by neoplasm
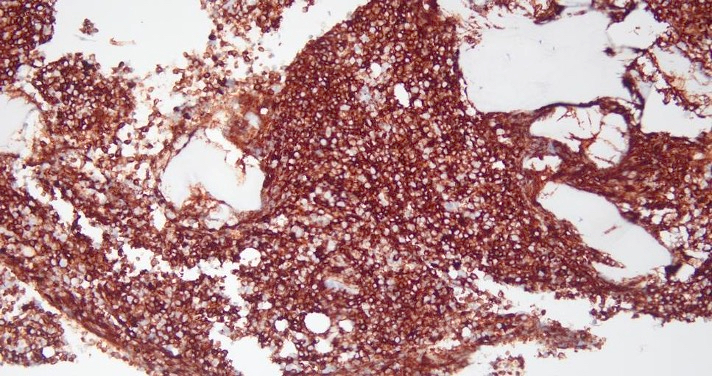
Sheets of myeloid blasts
Blasts positive for CD34
Blasts positive for CD33
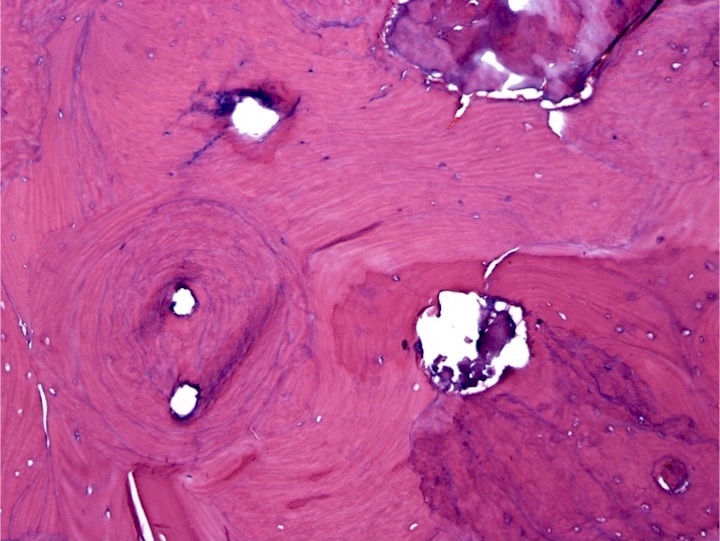
Nasopharyngeal mass
Mitosis and apoptosis identified

Blasts positive for CD117
Blasts positive for MPO
Contributed by Ismail Elbaz Younes, M.D. and Ling Zhang, M.D.
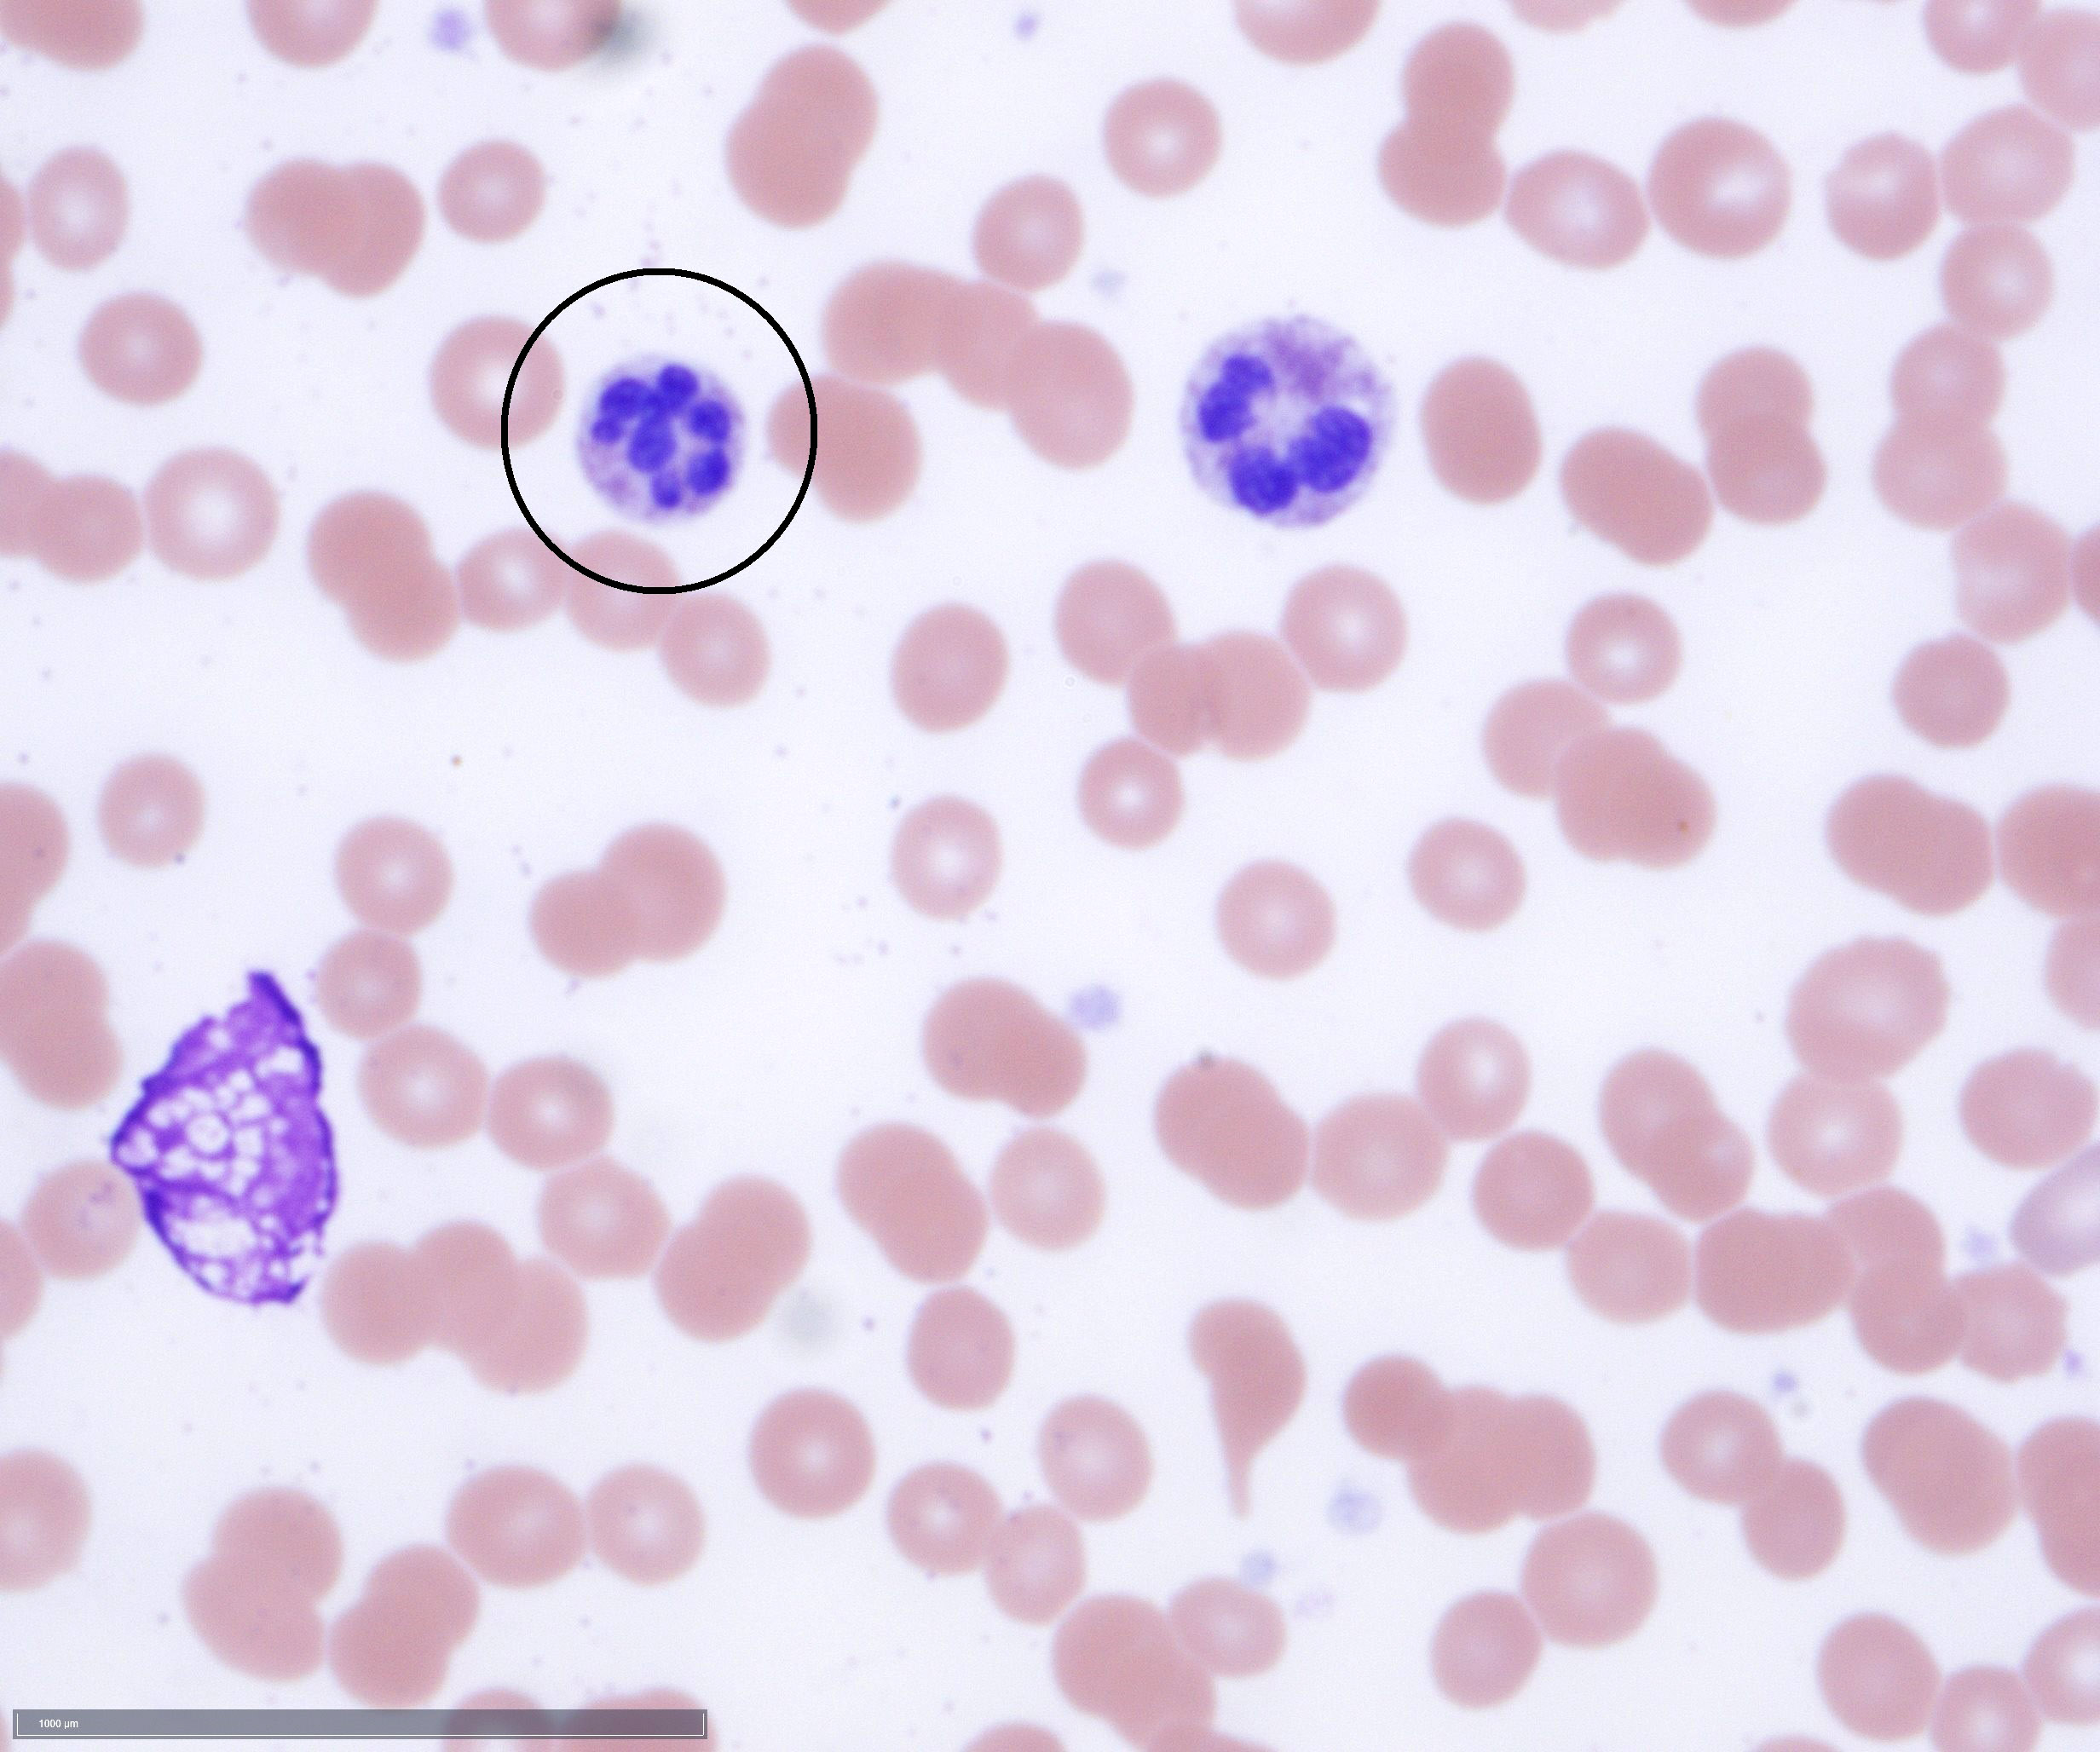
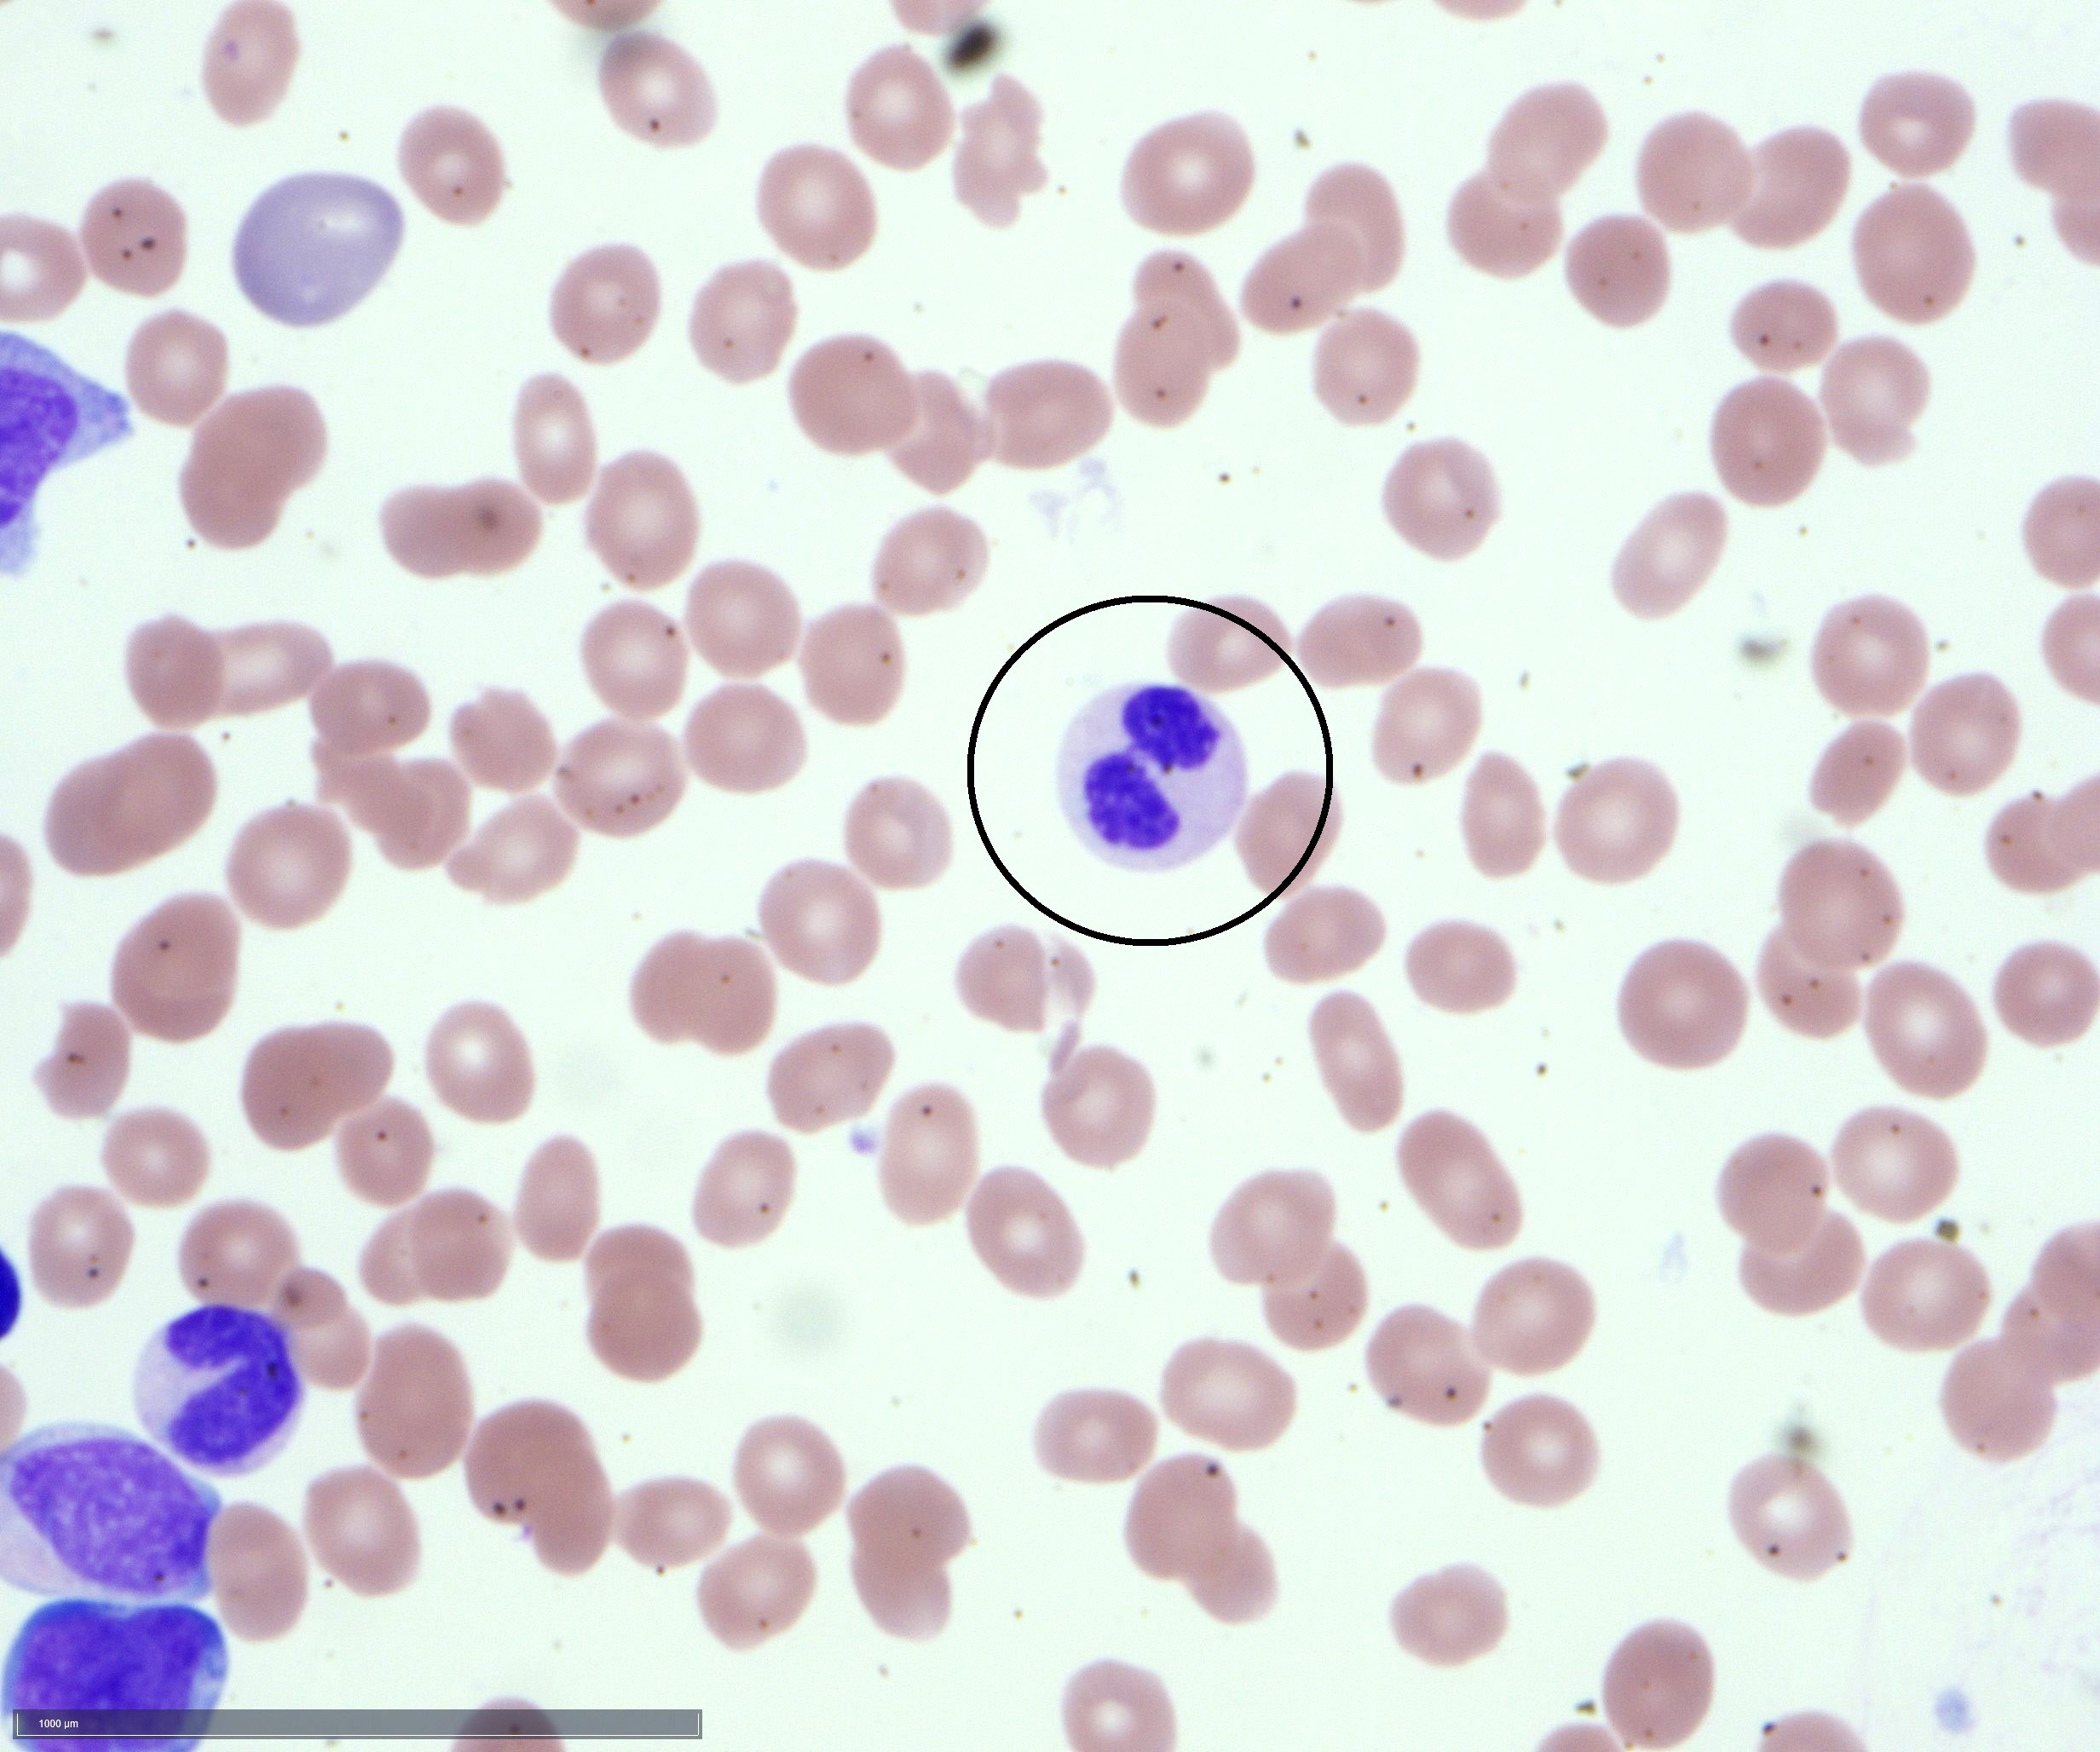
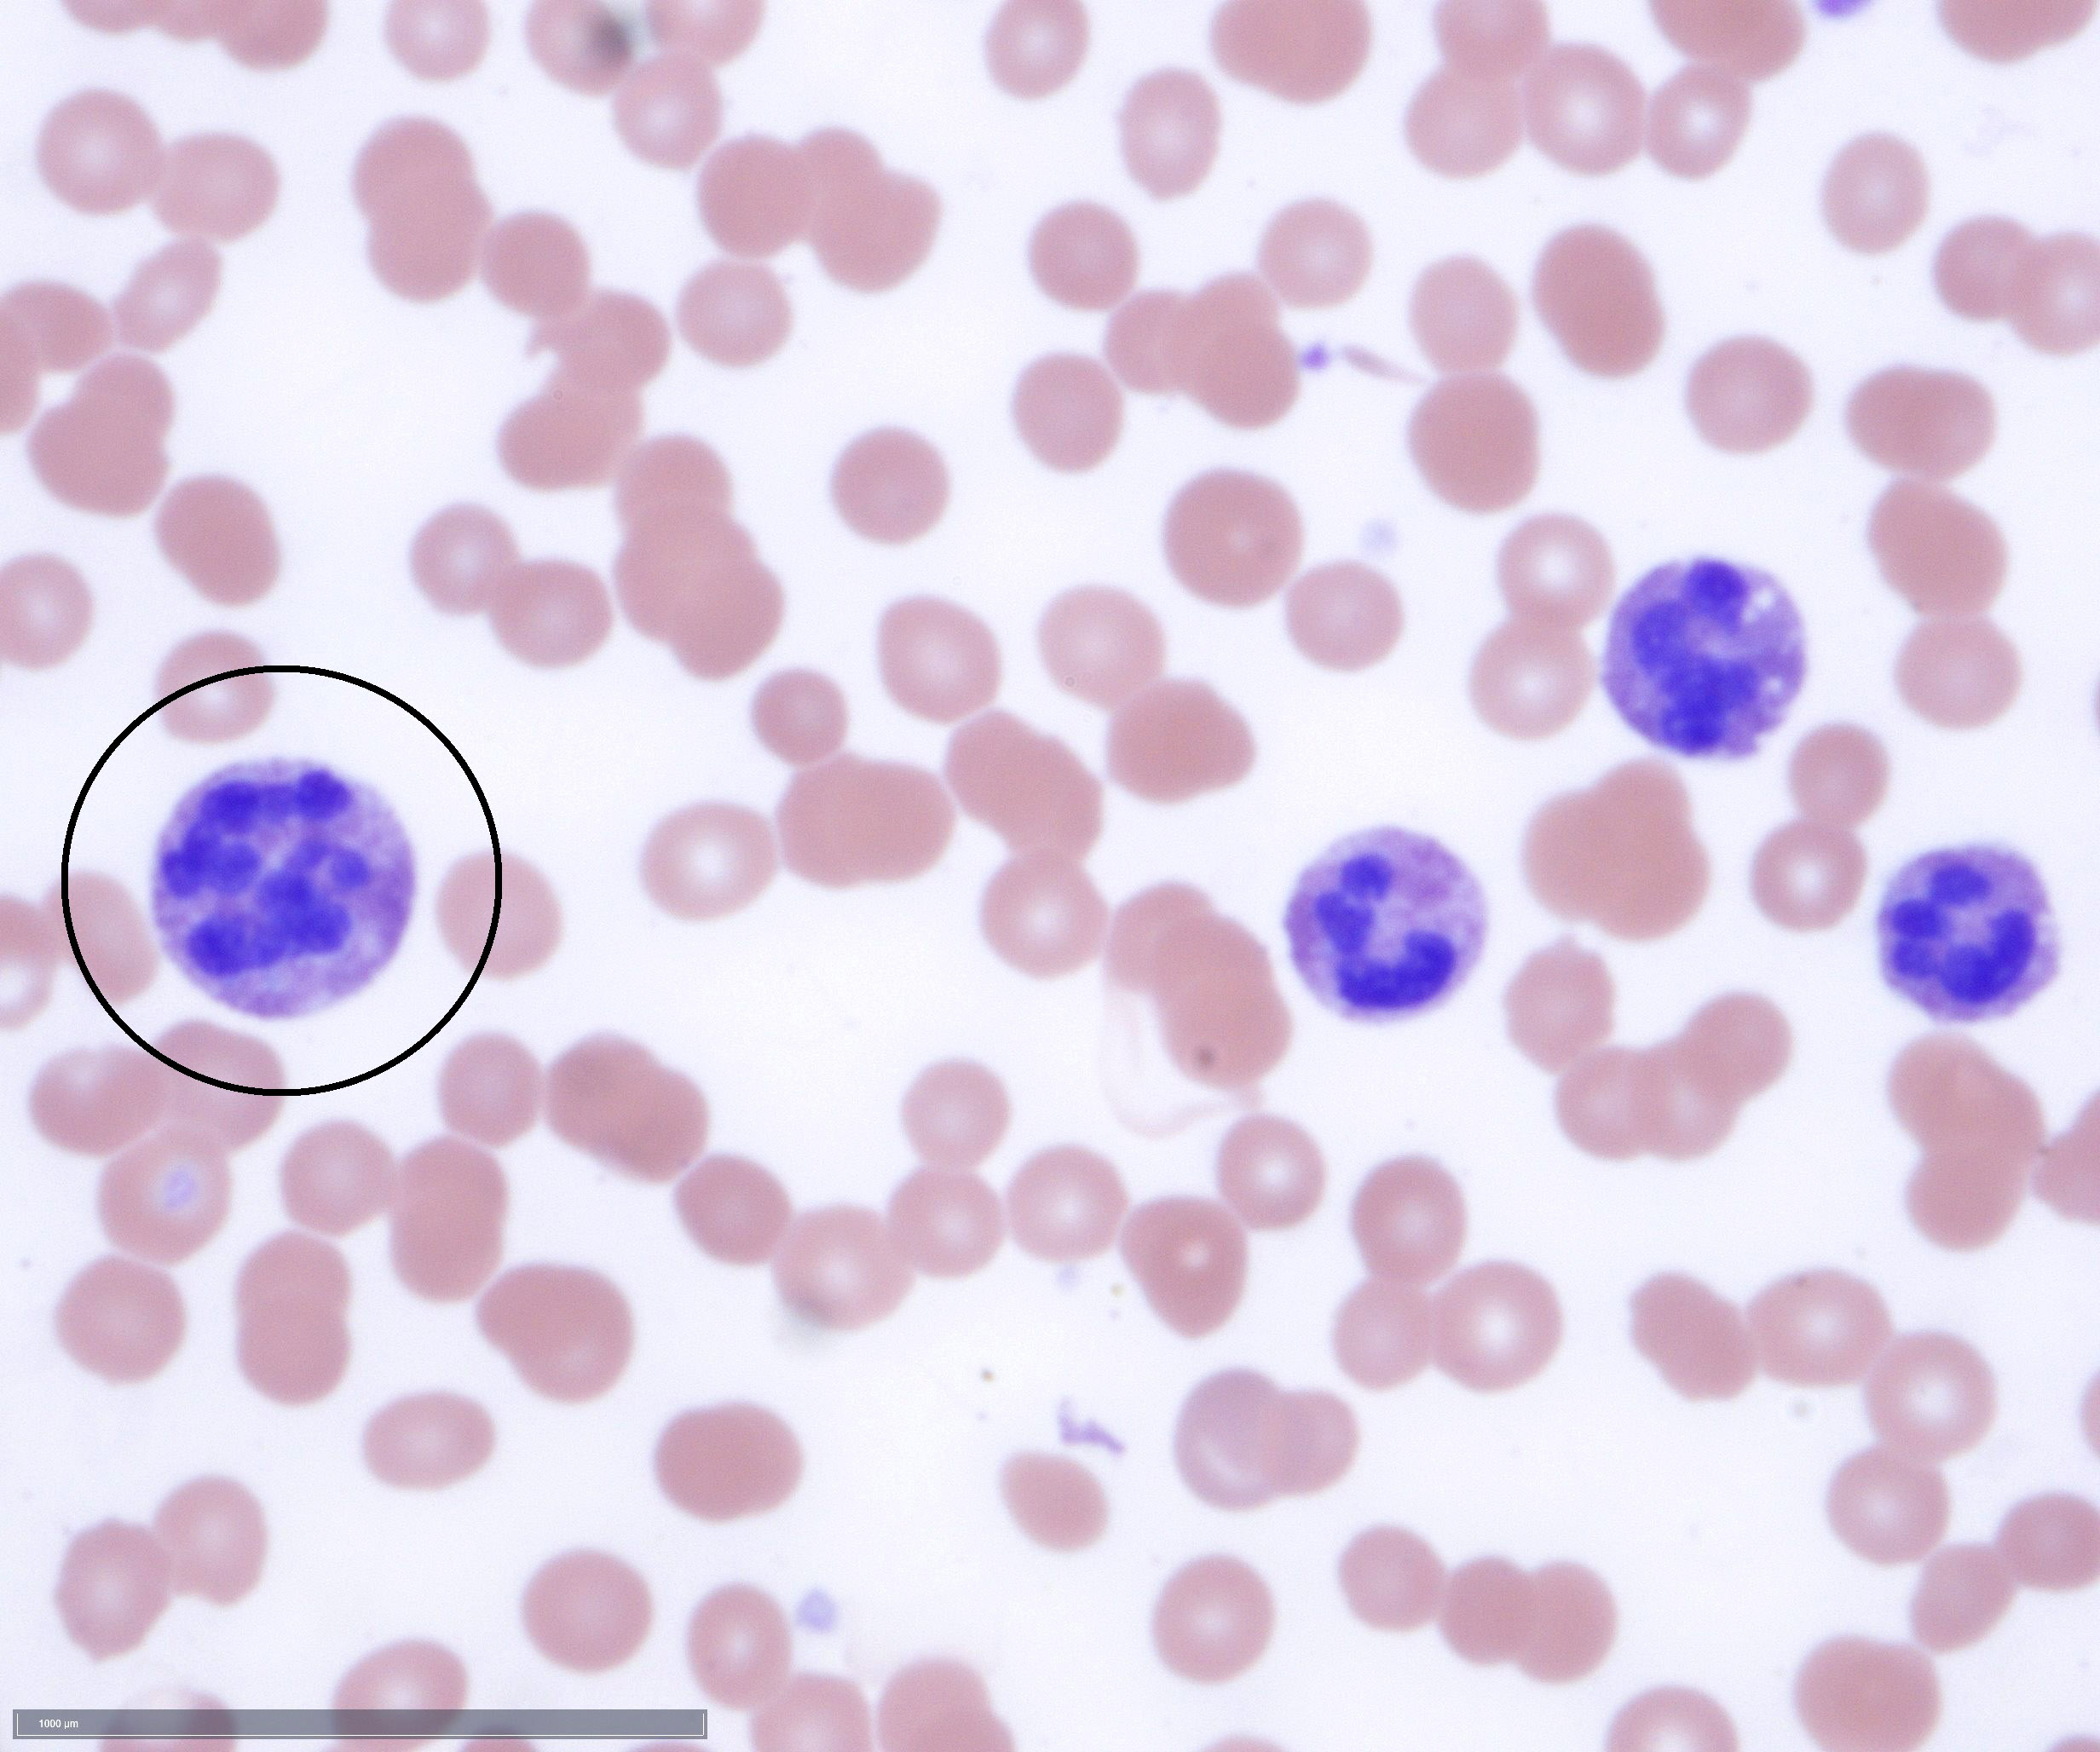
Increased eosinophils with
abnormal granulation
Contributed by Ismail Elbaz Younes, M.D. and Ling Zhang, M.D.
Deletion of CHIC2
Contributed by Ismail Elbaz Younes, M.D. and Ling Zhang, M.D.
Increased blasts in bone marrow core biopsy
Dysplastic megakaryocytes and neutrophils
Increased blasts
Contributed by Ismail Elbaz Younes, M.D. and Ling Zhang, M.D.
Increased myeloid blasts
Contributed by Ismail Elbaz Younes, M.D. and Ling Zhang, M.D.
Rearrangement with 5q31~33 breakpoint
Images hosted on other servers:


FISH assays indicate rearrangement of PDGFRB
Images hosted on other servers:

Classic findings of POEMS syndrome
Contributed by Genevieve M. Crane, M.D., Ph.D. and Sarah Elsoukkary, M.D.
A pyogenic granuloma arising in a patient with POEMS syndrome
Biopsy of sclerotic bone lesions in a patient with POEMS syndrome
Bone marrow clot section
Bone marrow aspirate smear
CD138

CD138 / Ki67
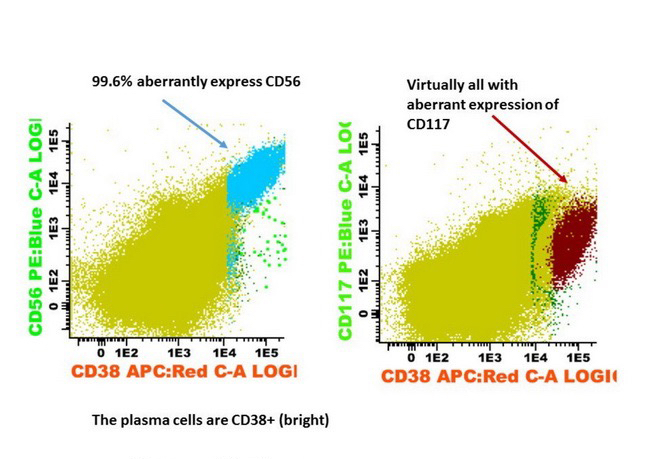
CD56+ clone

Lambda
IHC for kappa and lambda of the bone marrow clot
Contributed by Jesse Manuel Jaso, M.D.

Sheets of plasma cells
Bone marrow core
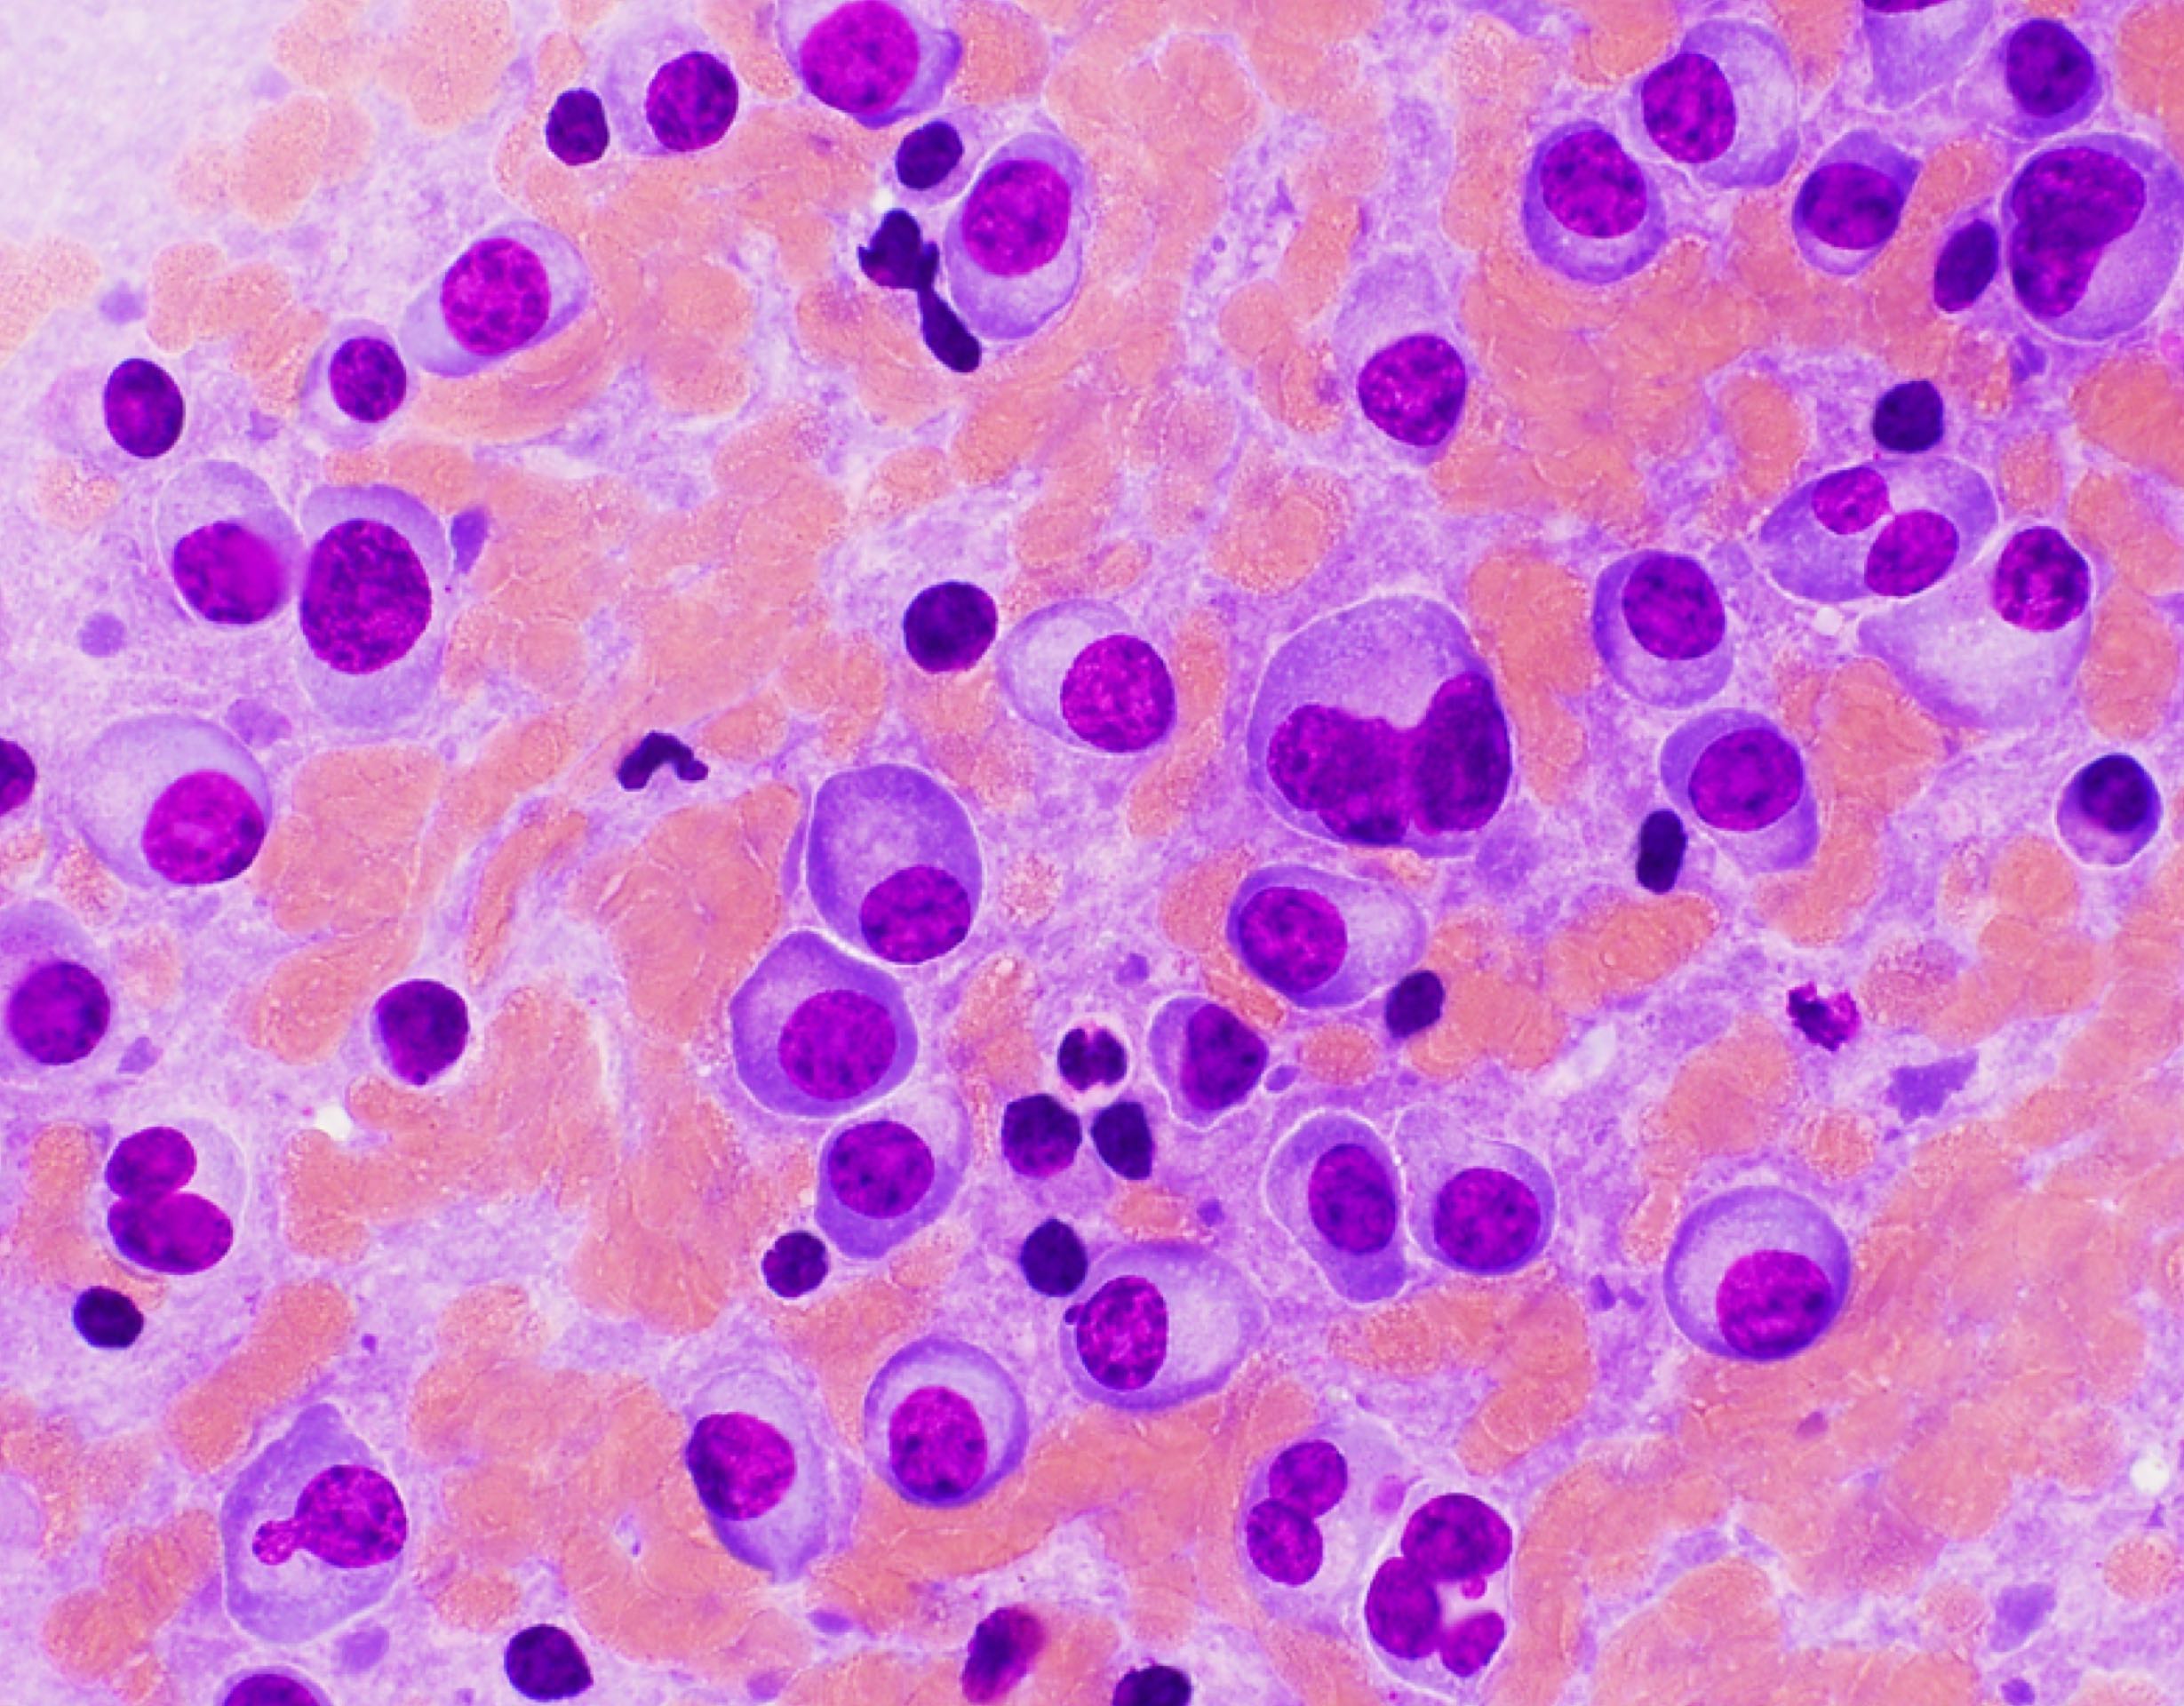
Pleomorphic plasma cells
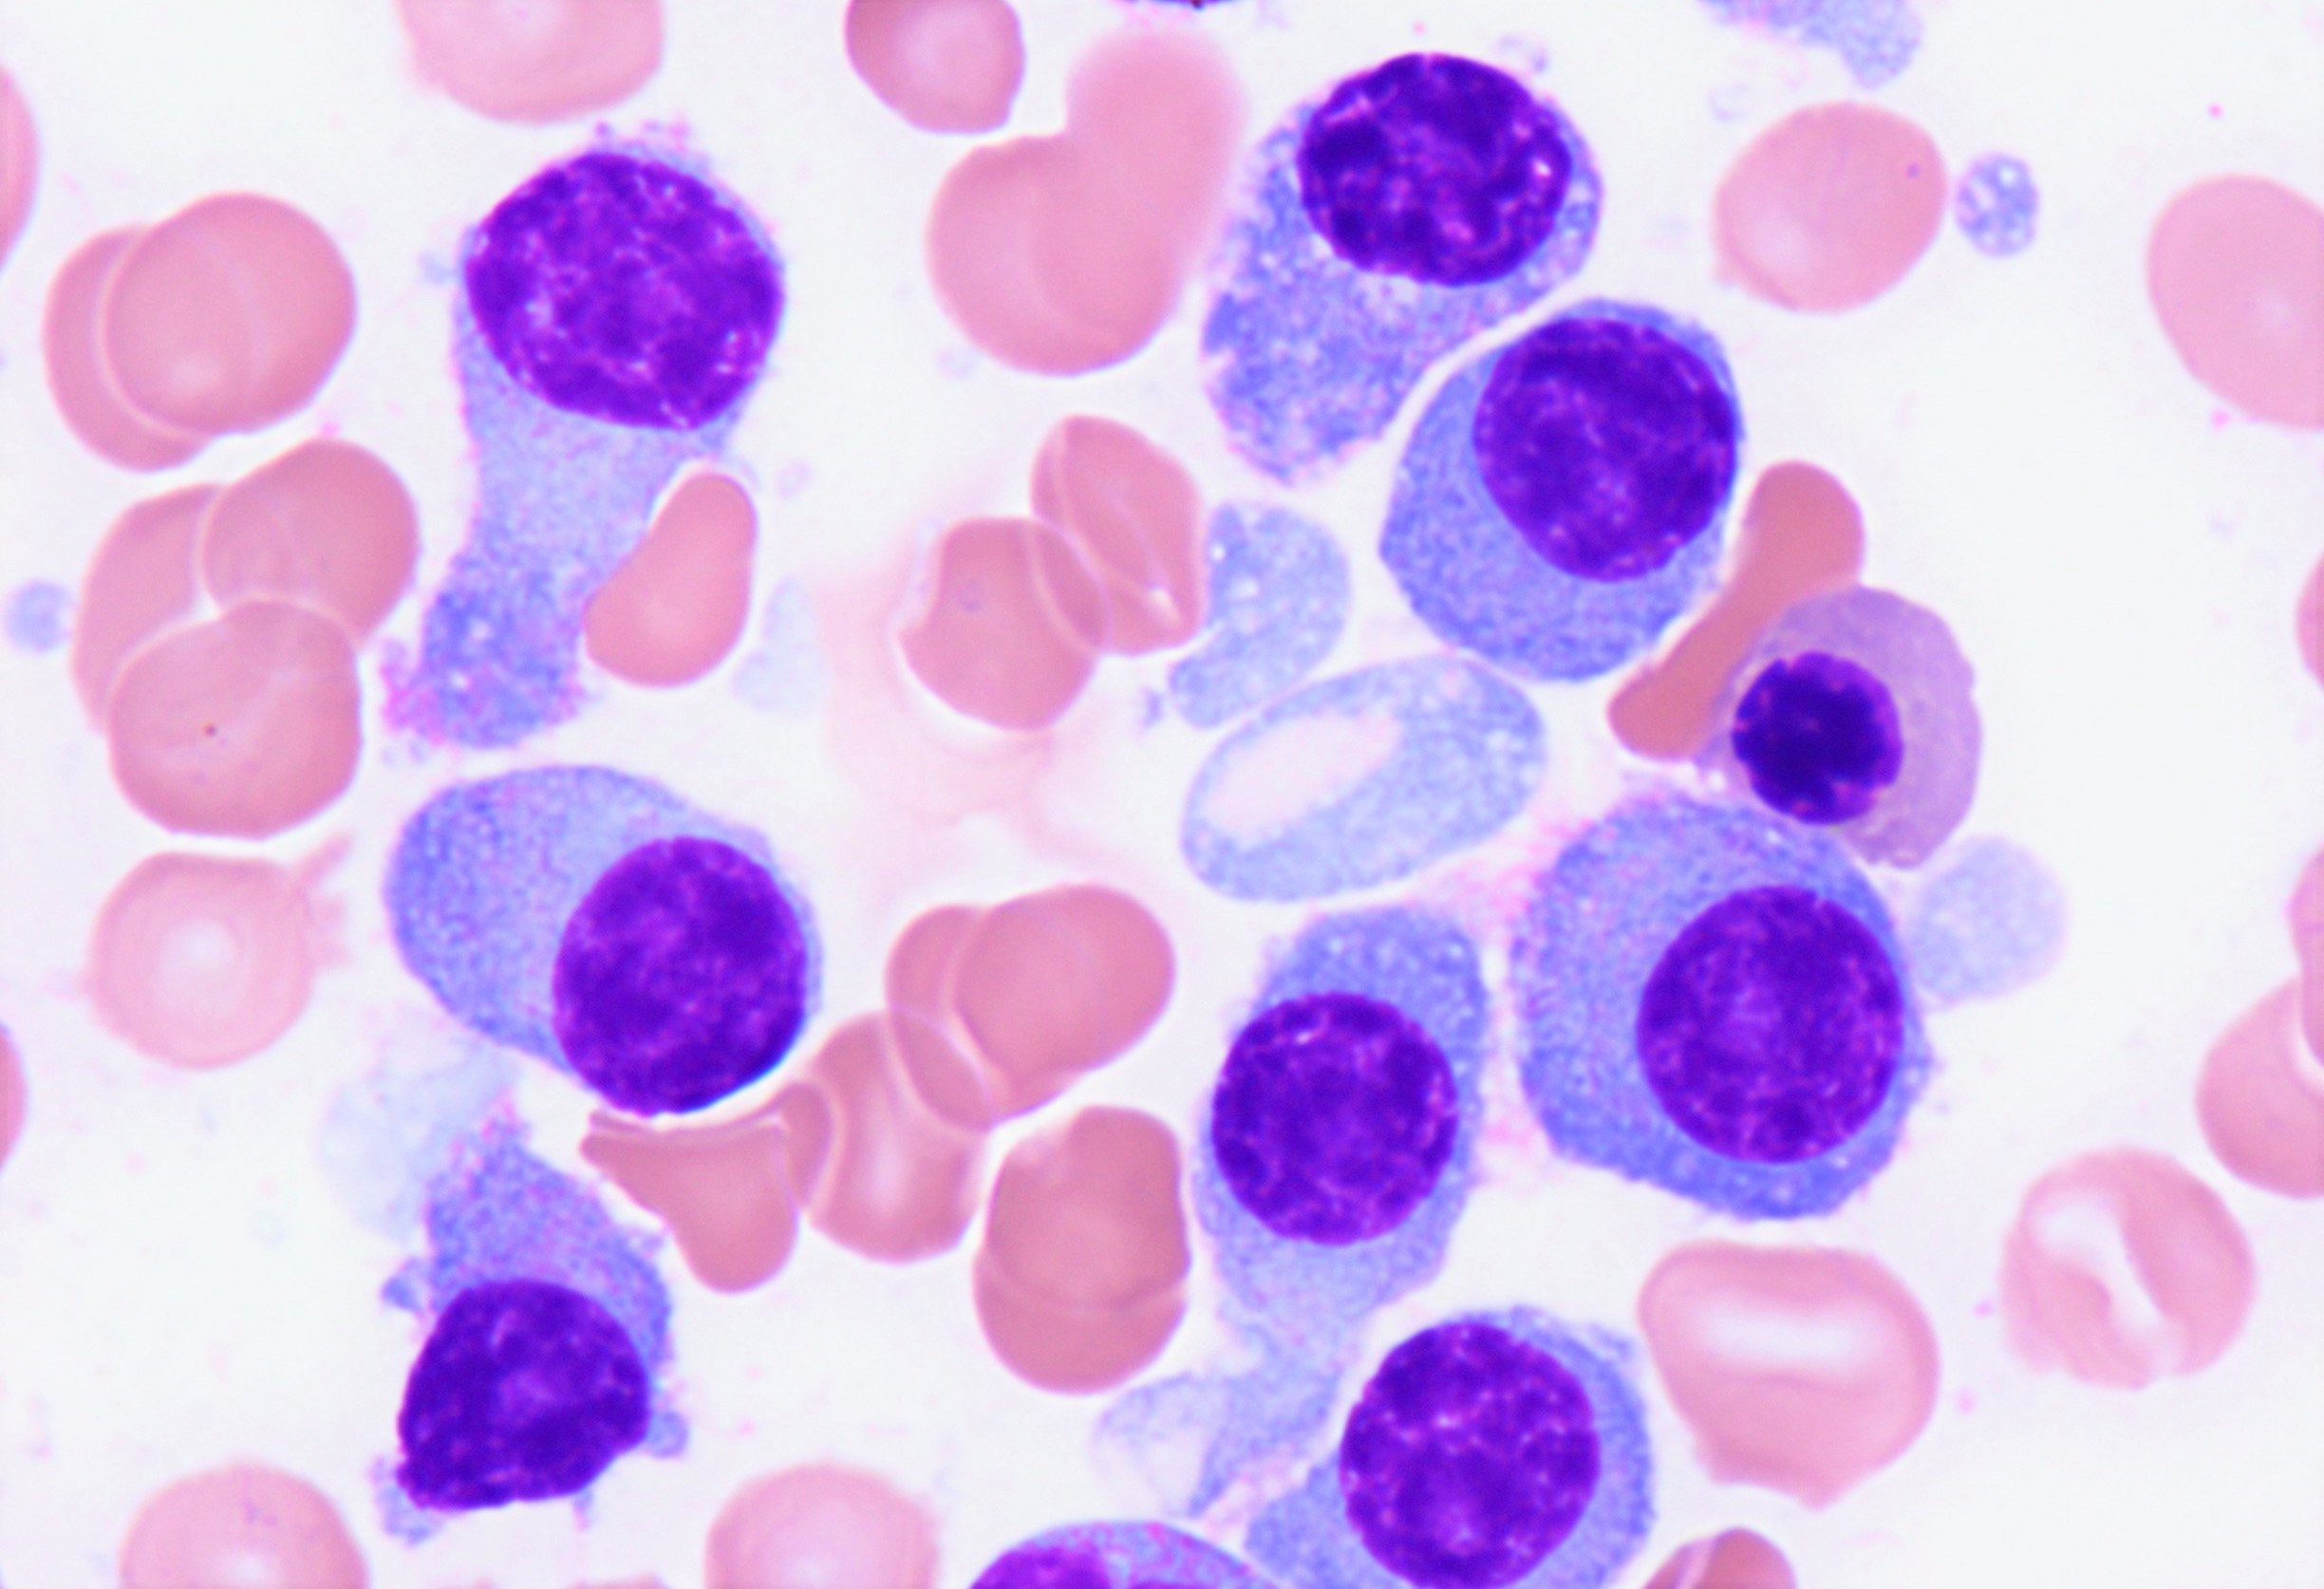
Plasma cells
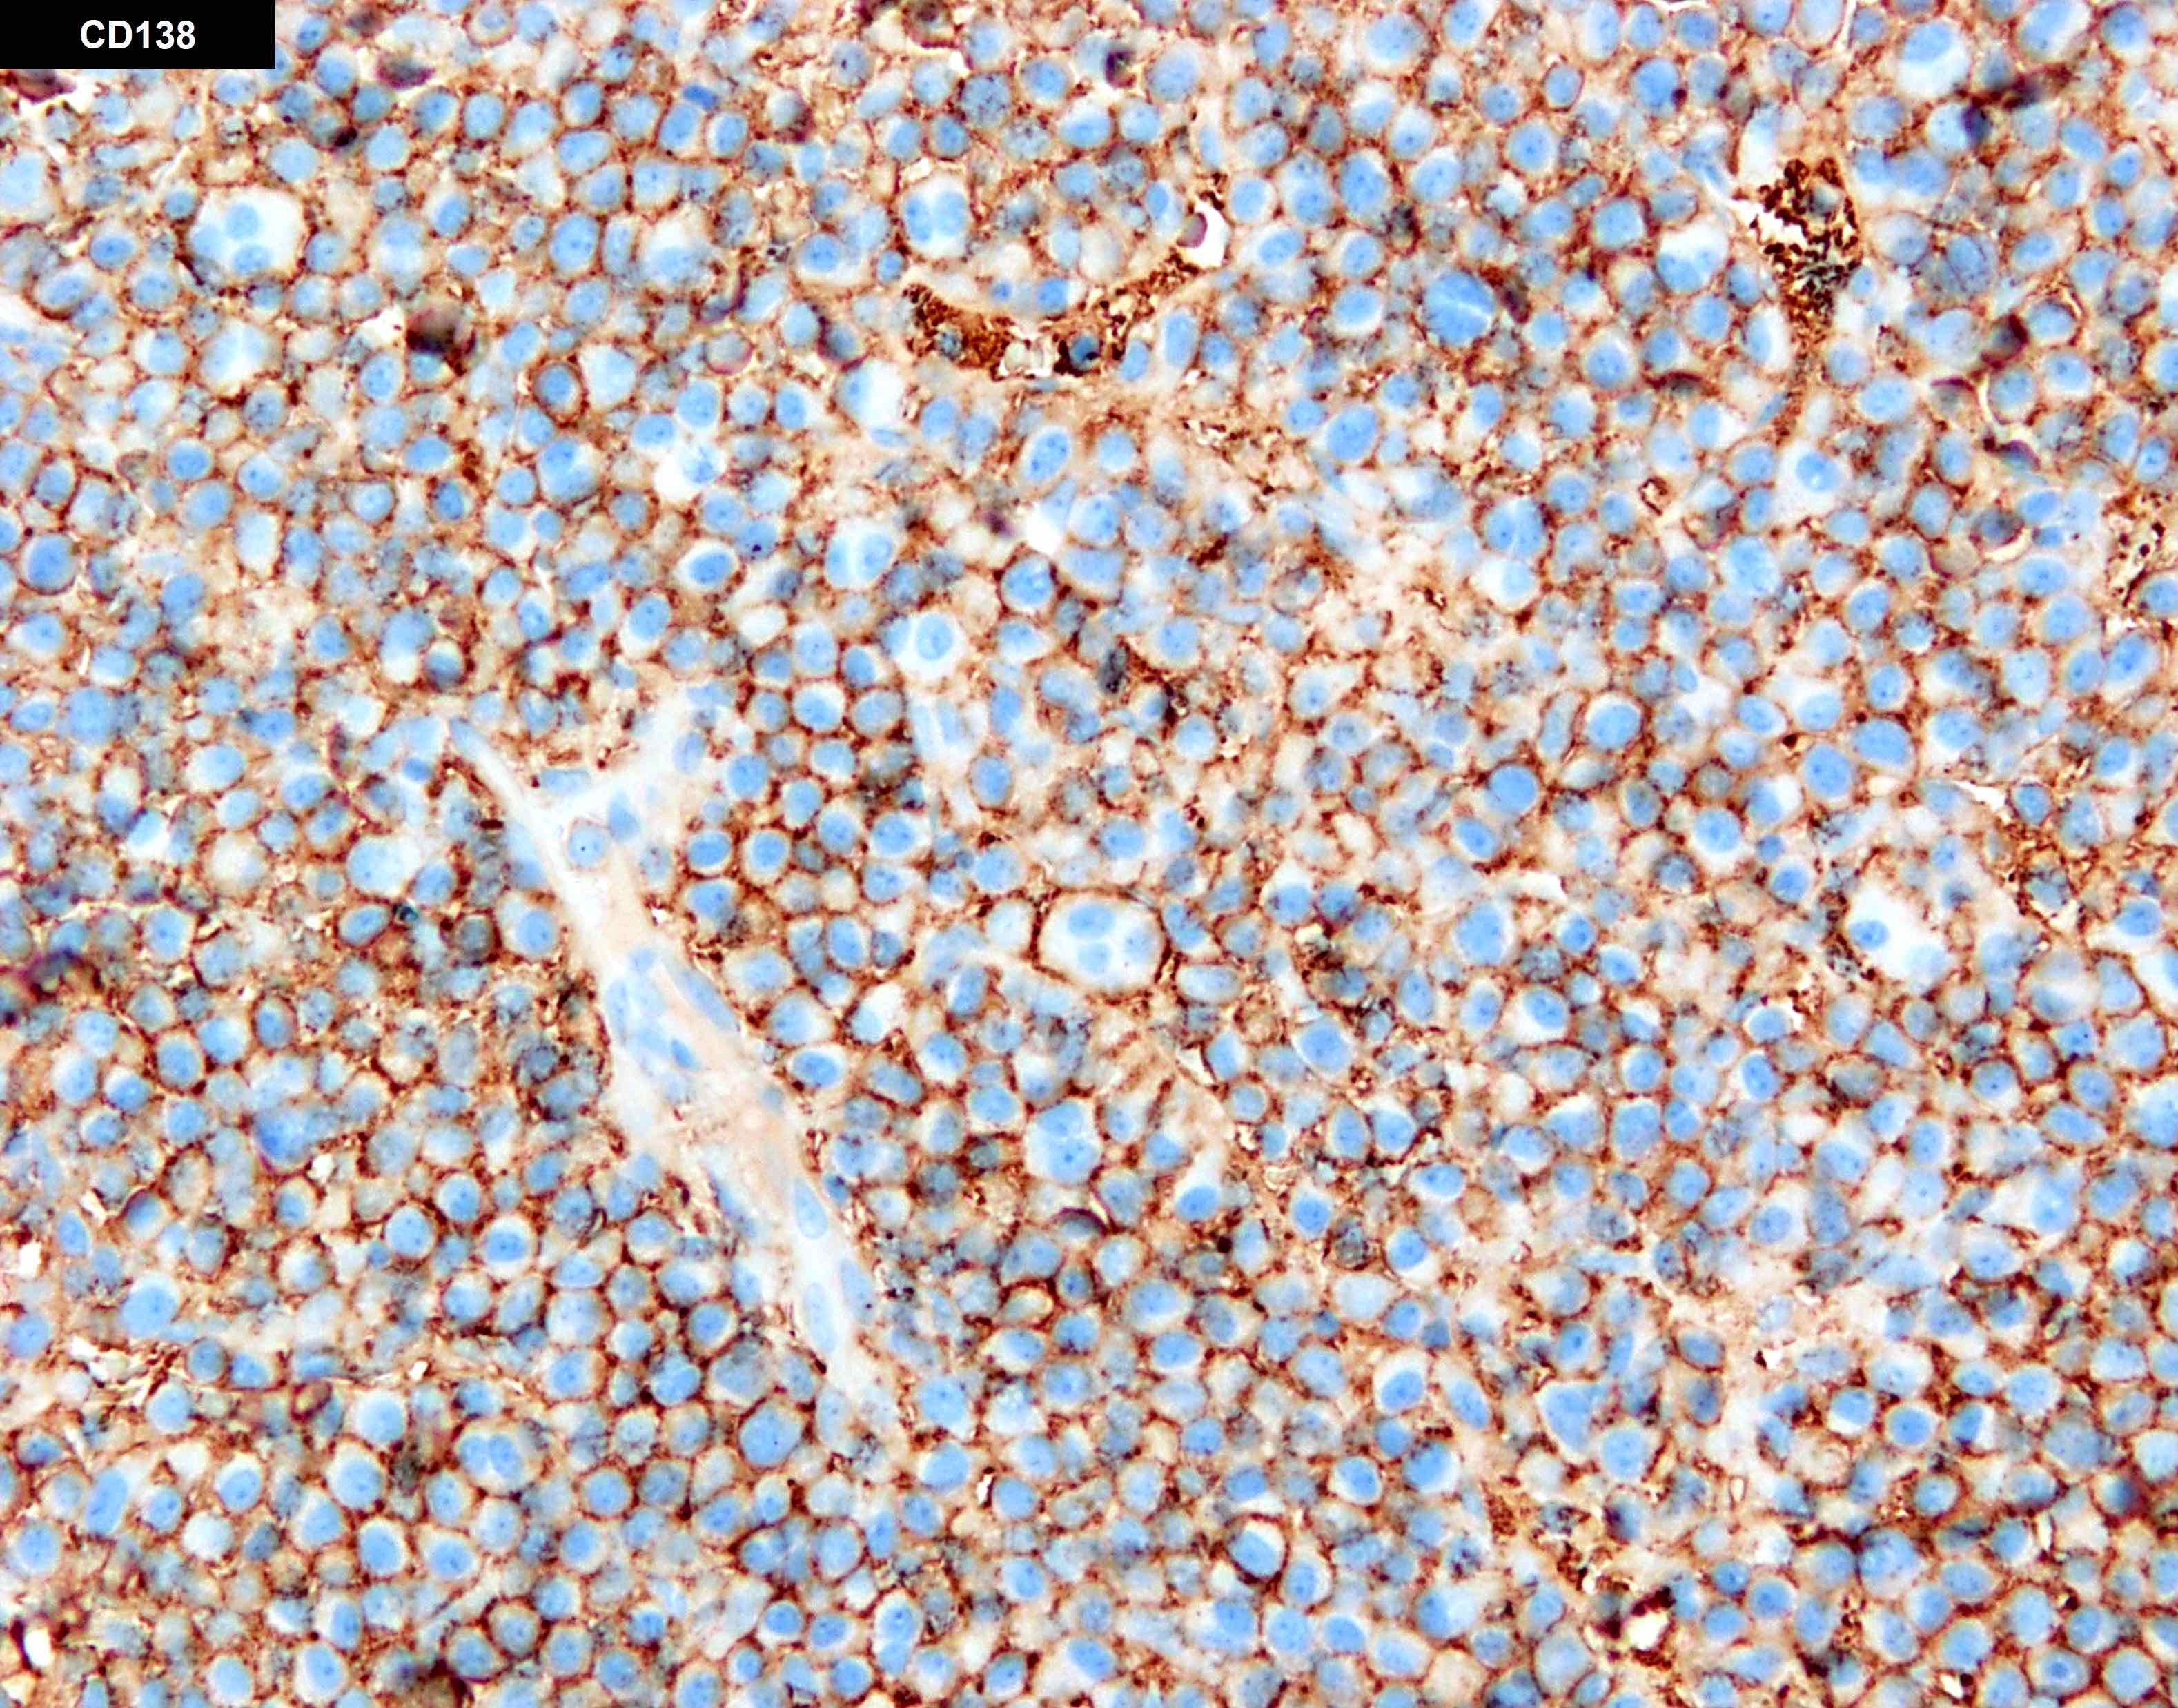
CD138
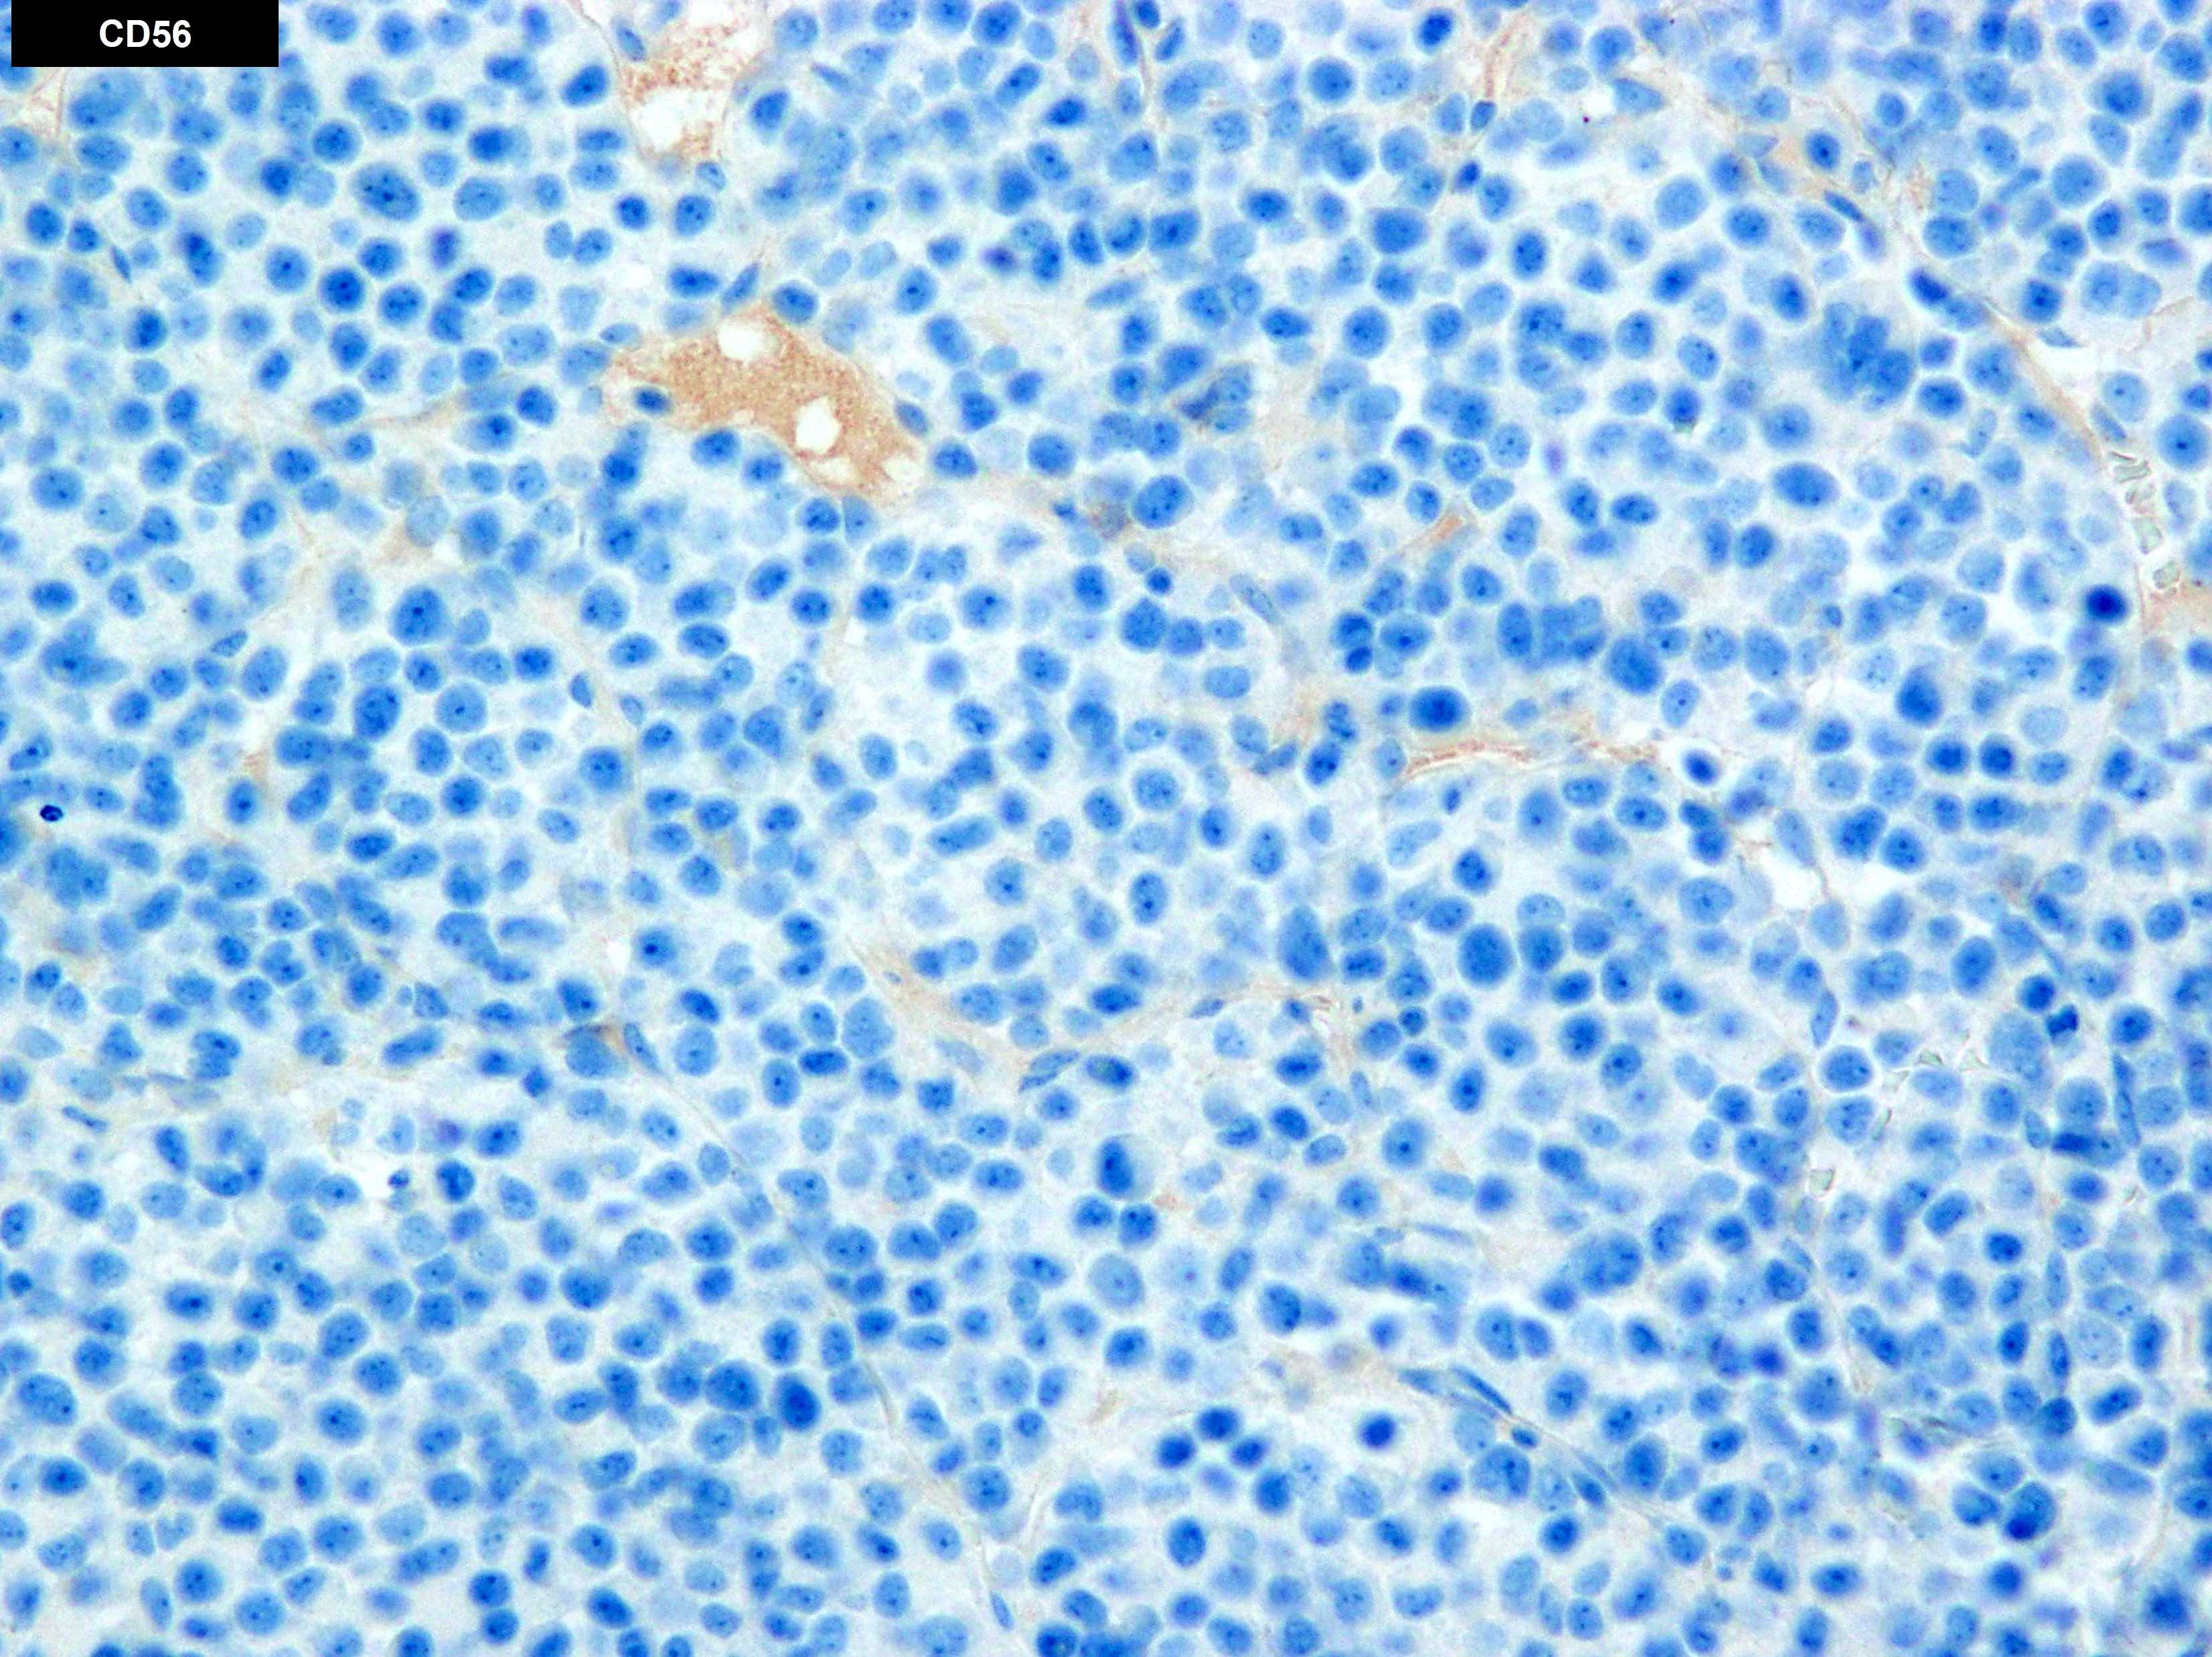
CD56 negative plasma cells

Cyclin D1 expression in plasma cells
Contributed by Jesse Manuel Jaso, M.D.
Circulating plasma cells
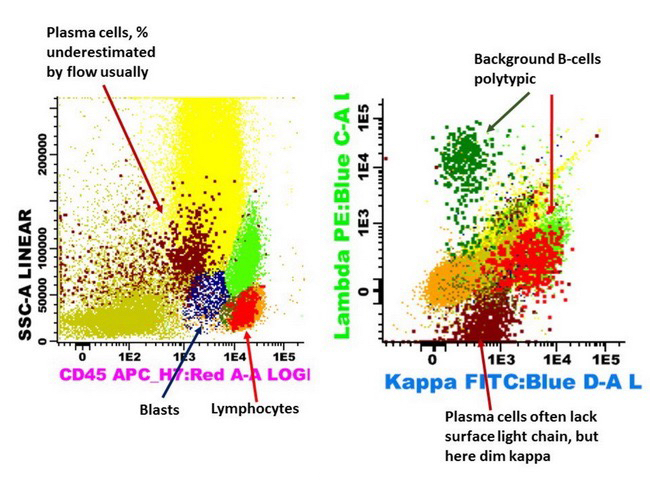
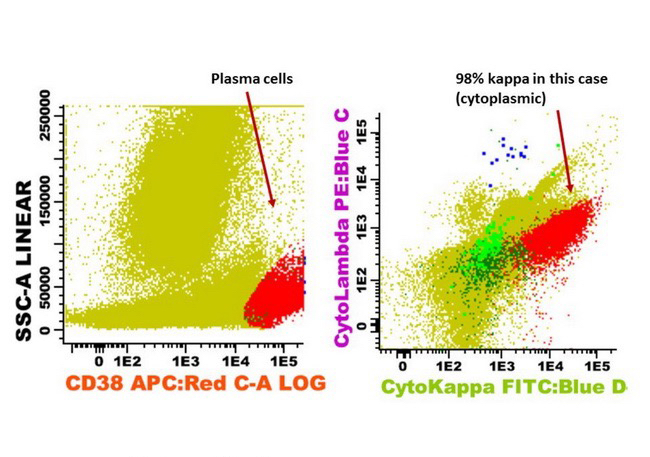
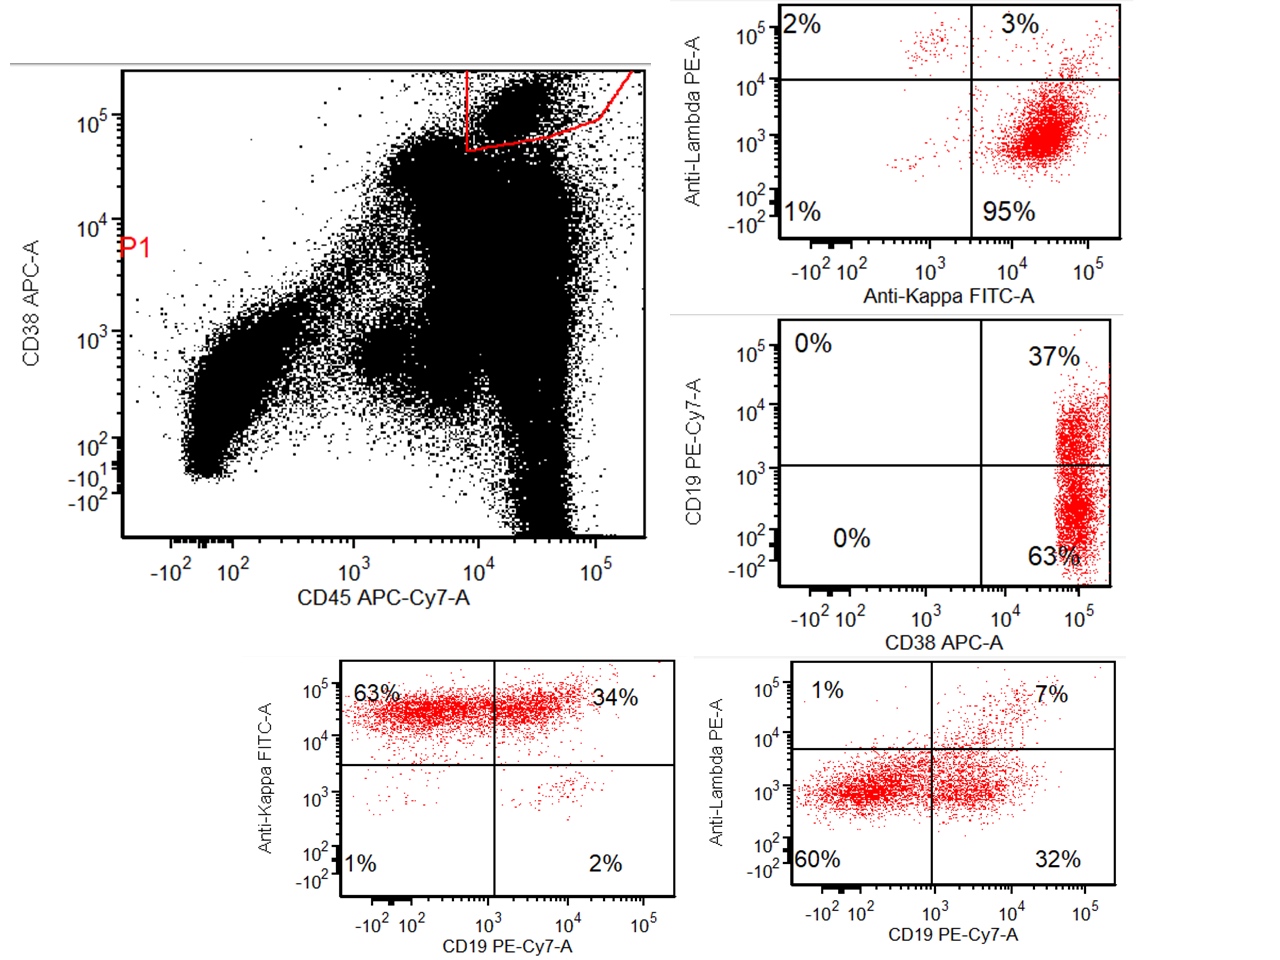
Contributed by Franklin Fuda, D.O.

Increased forward and side scatter
Heterogeneous CD45 expression
Negative for CD19 and CD10

Negative for CD19 and CD5
Bright expression of CD38
Negative for CD22
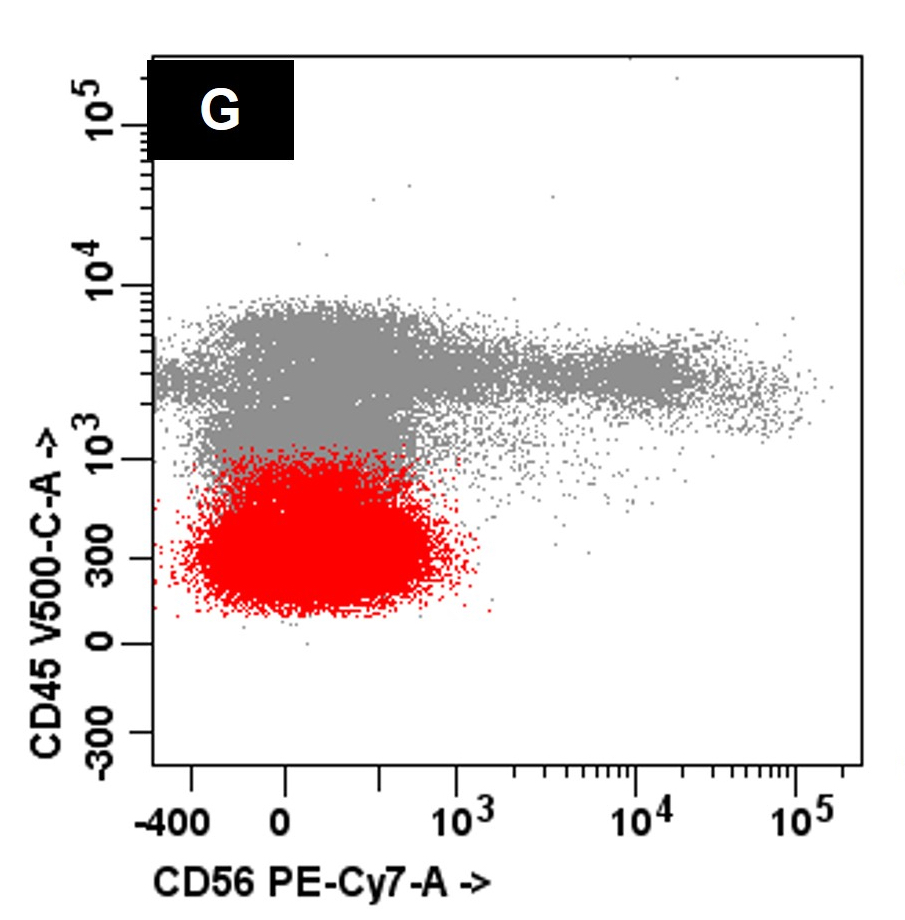
Lack of CD56 expression
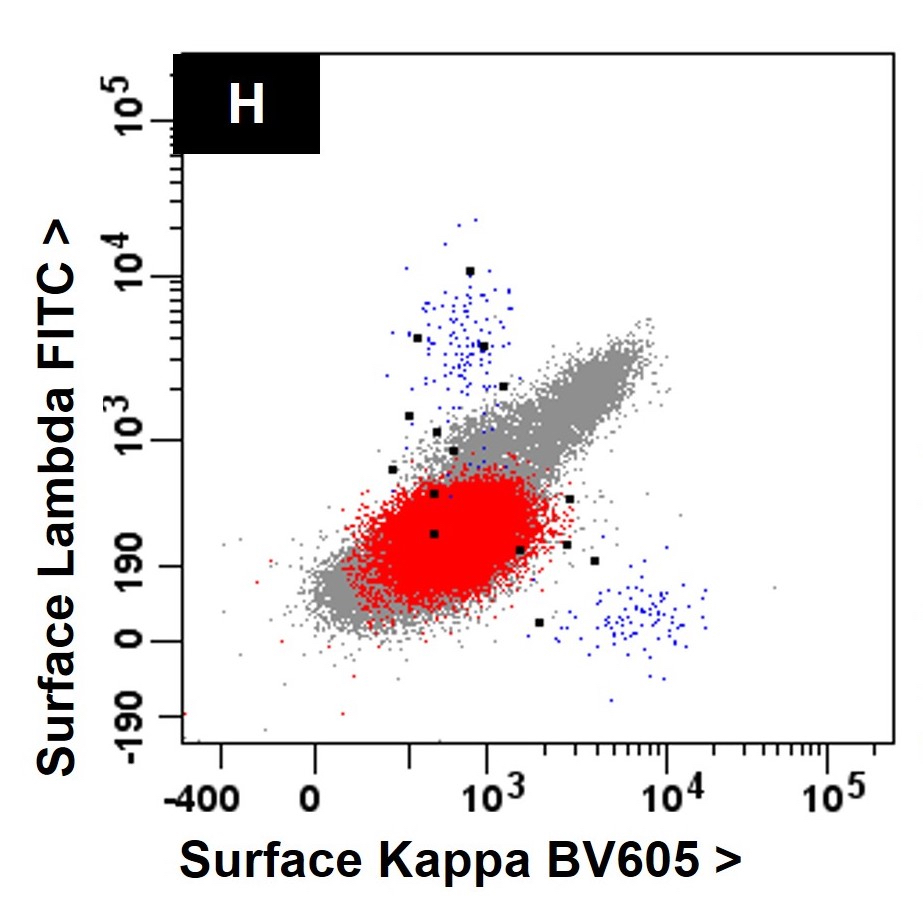
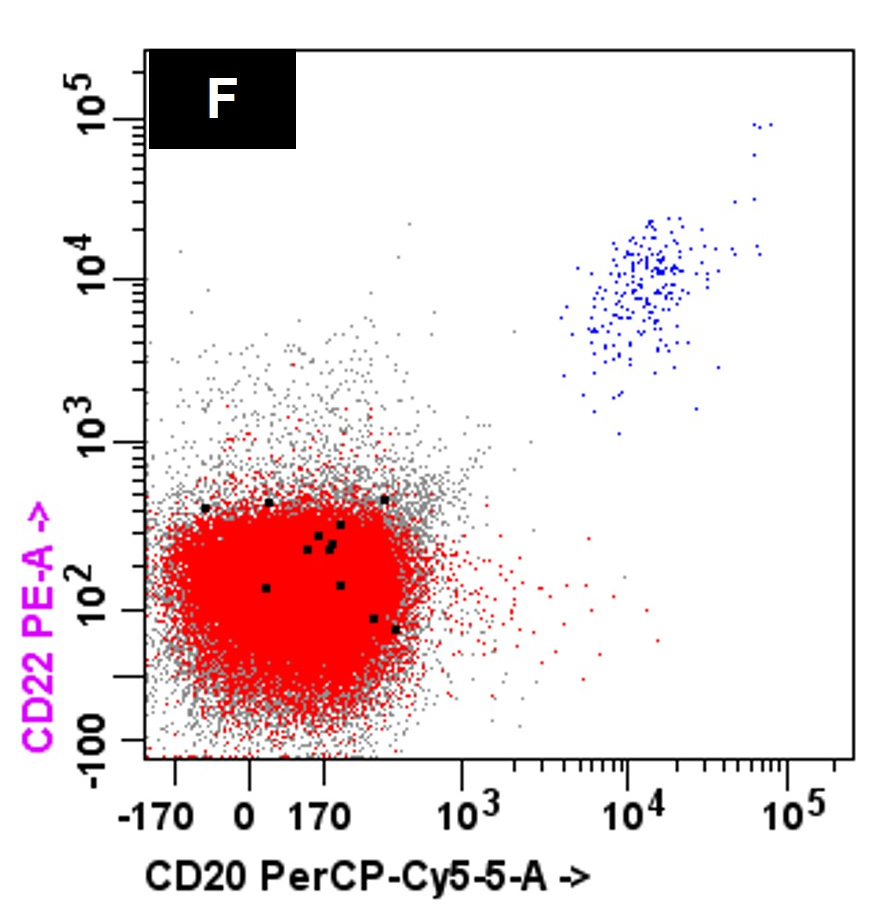
Lack of surface light chain expression

Cytoplasmic kappa expression
Contributed by Mark R. Wick, M.D. and AFIP images
%20skull%20xray.jpg)
%20skull%20xray2.jpg)
Skull Xray
%20tibia%20xray.jpg)
Tibia Xray

Solitary plasma cell myeloma

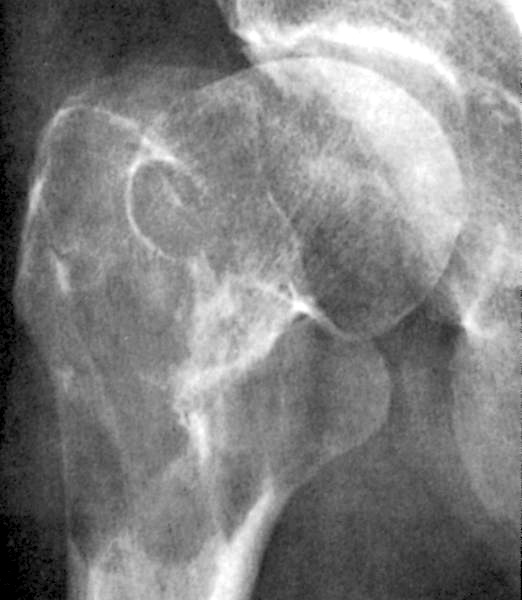
Plasma cell myeloma
Images hosted on other servers:

Prominent skull defect
Images hosted on other servers:

Vertebrae with myeloma lesions

Skull lesions
Contributed by Genevieve M. Crane, M.D., Ph.D. and Tapan Bhavsar, M.D., Ph.D.
Amyloid deposition (Congo red stain)
Amyloid deposition
(Congo red stain
with birefringence)
Focal sheets of plasma cells

Extensive amyloid, bone marrow
Extensive bone marrow involvement by myeloma
Trephine biopsy
Trephine biopsy
Myeloma with plasmablastic transformation
CD138
In situ hybridization for kappa
In situ hybridization for lambda
Myeloma involving bone marrow
Bone marrow touch preparation
Images hosted on other servers:

Bone marrow aspirate has plasmacytoid cells
Contributed by Genevieve M. Crane, M.D., Ph.D.
Extensive amyloid, aspirate
Contributed by Genevieve M. Crane, M.D., Ph.D.
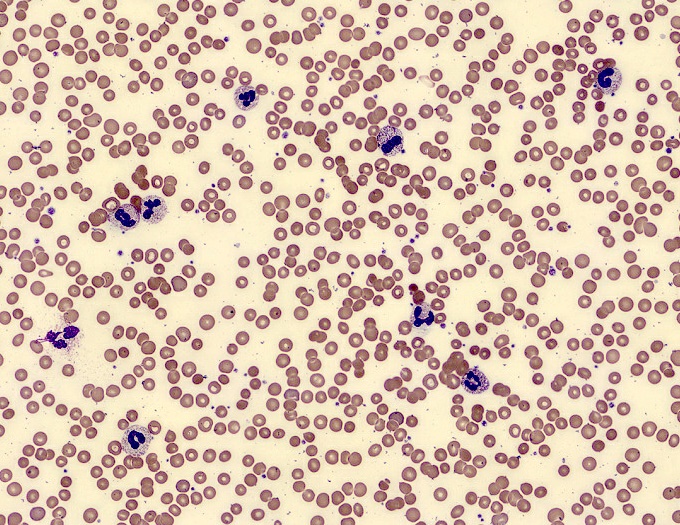
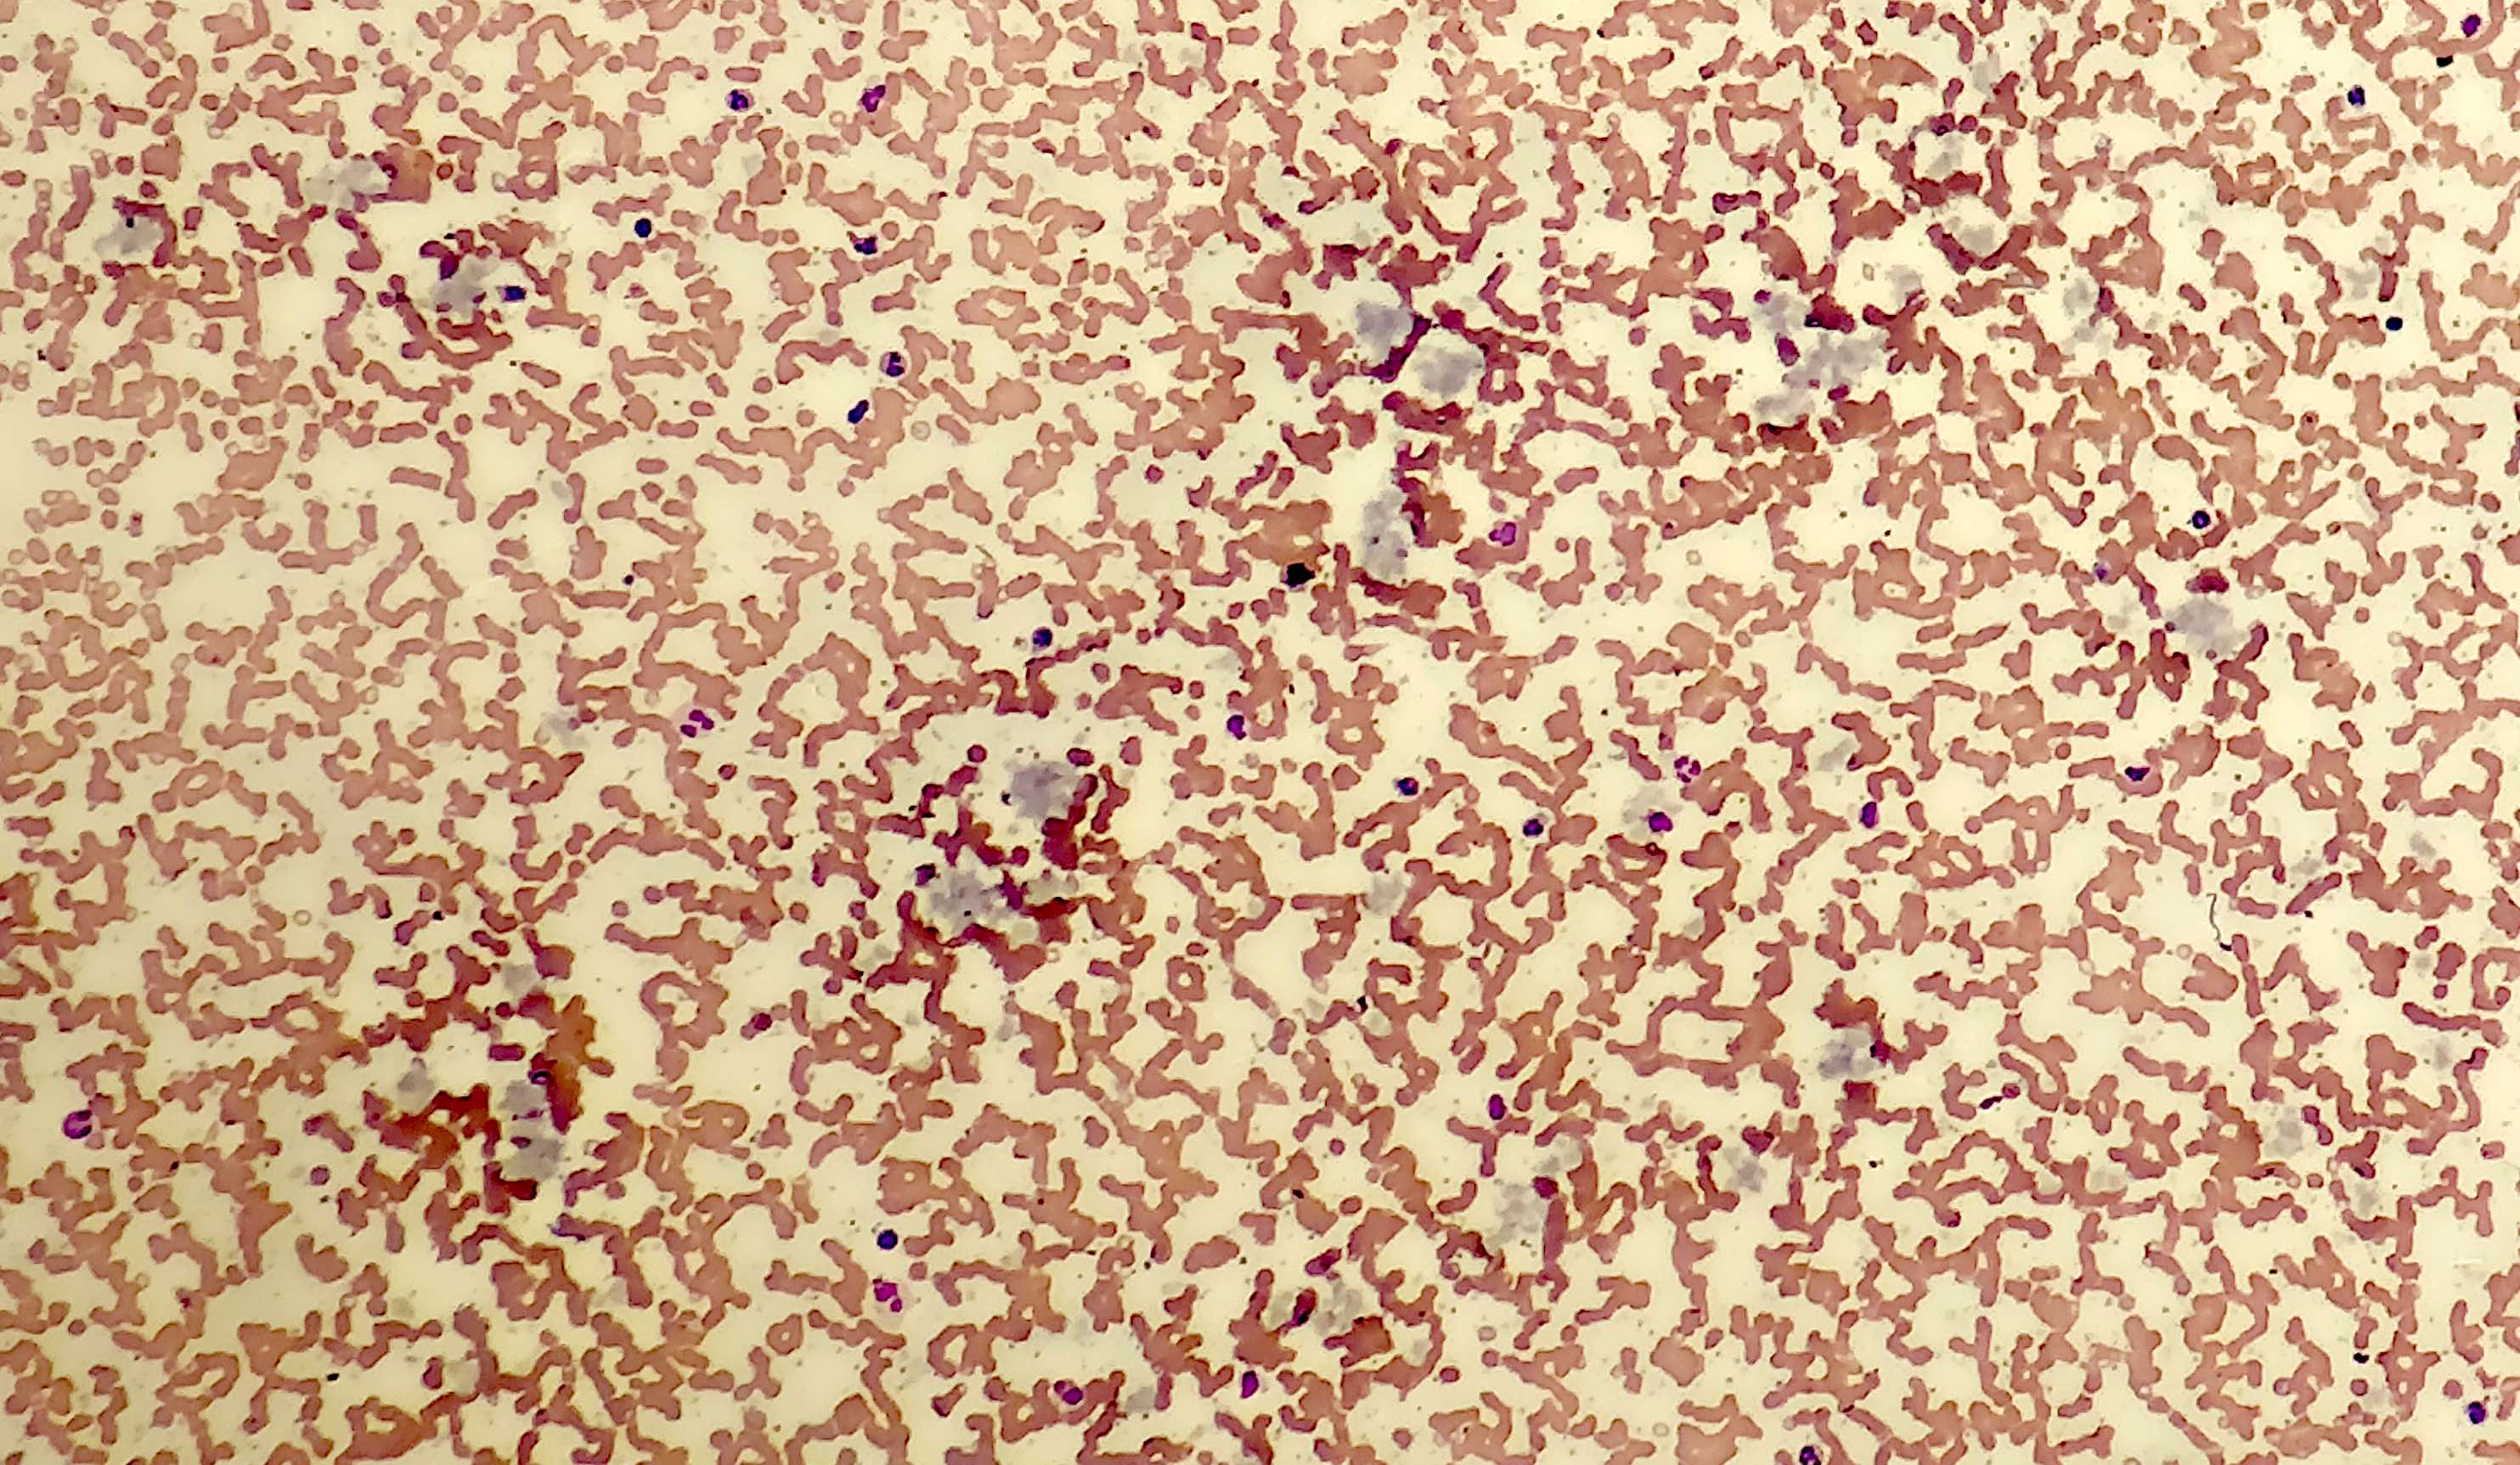
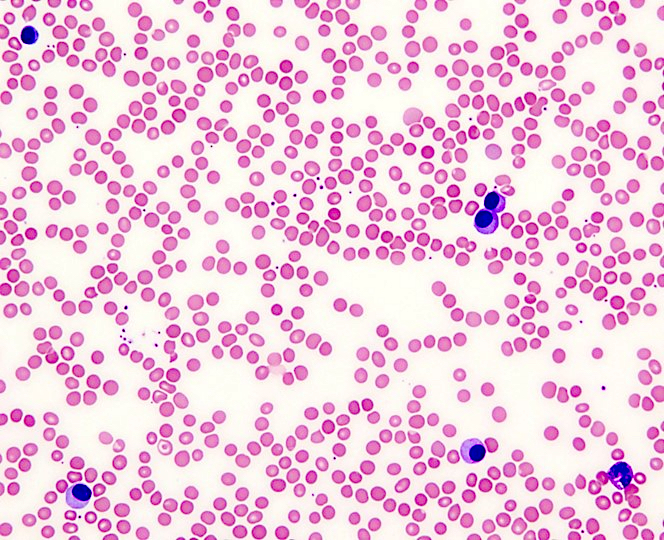
Peripheral blood rouleaux

Rouleaux formation
Images hosted on other servers:


Peripheral blood shows plasma cells (right: with blastic features)
Contributed by Genevieve M. Crane, M.D., Ph.D.
Dim kappa
Strong cytoplasmic expression
Neoplastic plasma cells
Myeloma with t(11;14) and partial CD19
Images hosted on other servers:

Prominent monotypic
pattern (lambda,
with minimal kappa)
Video on myeloma MRD

Plasma cell neoplasms

Podcast on SPEP

Introduction to bone marrow interpretation
Contributed by Genevieve M. Crane, M.D., Ph.D. and Kelly Magliocca, D.D.S., M.P.H.

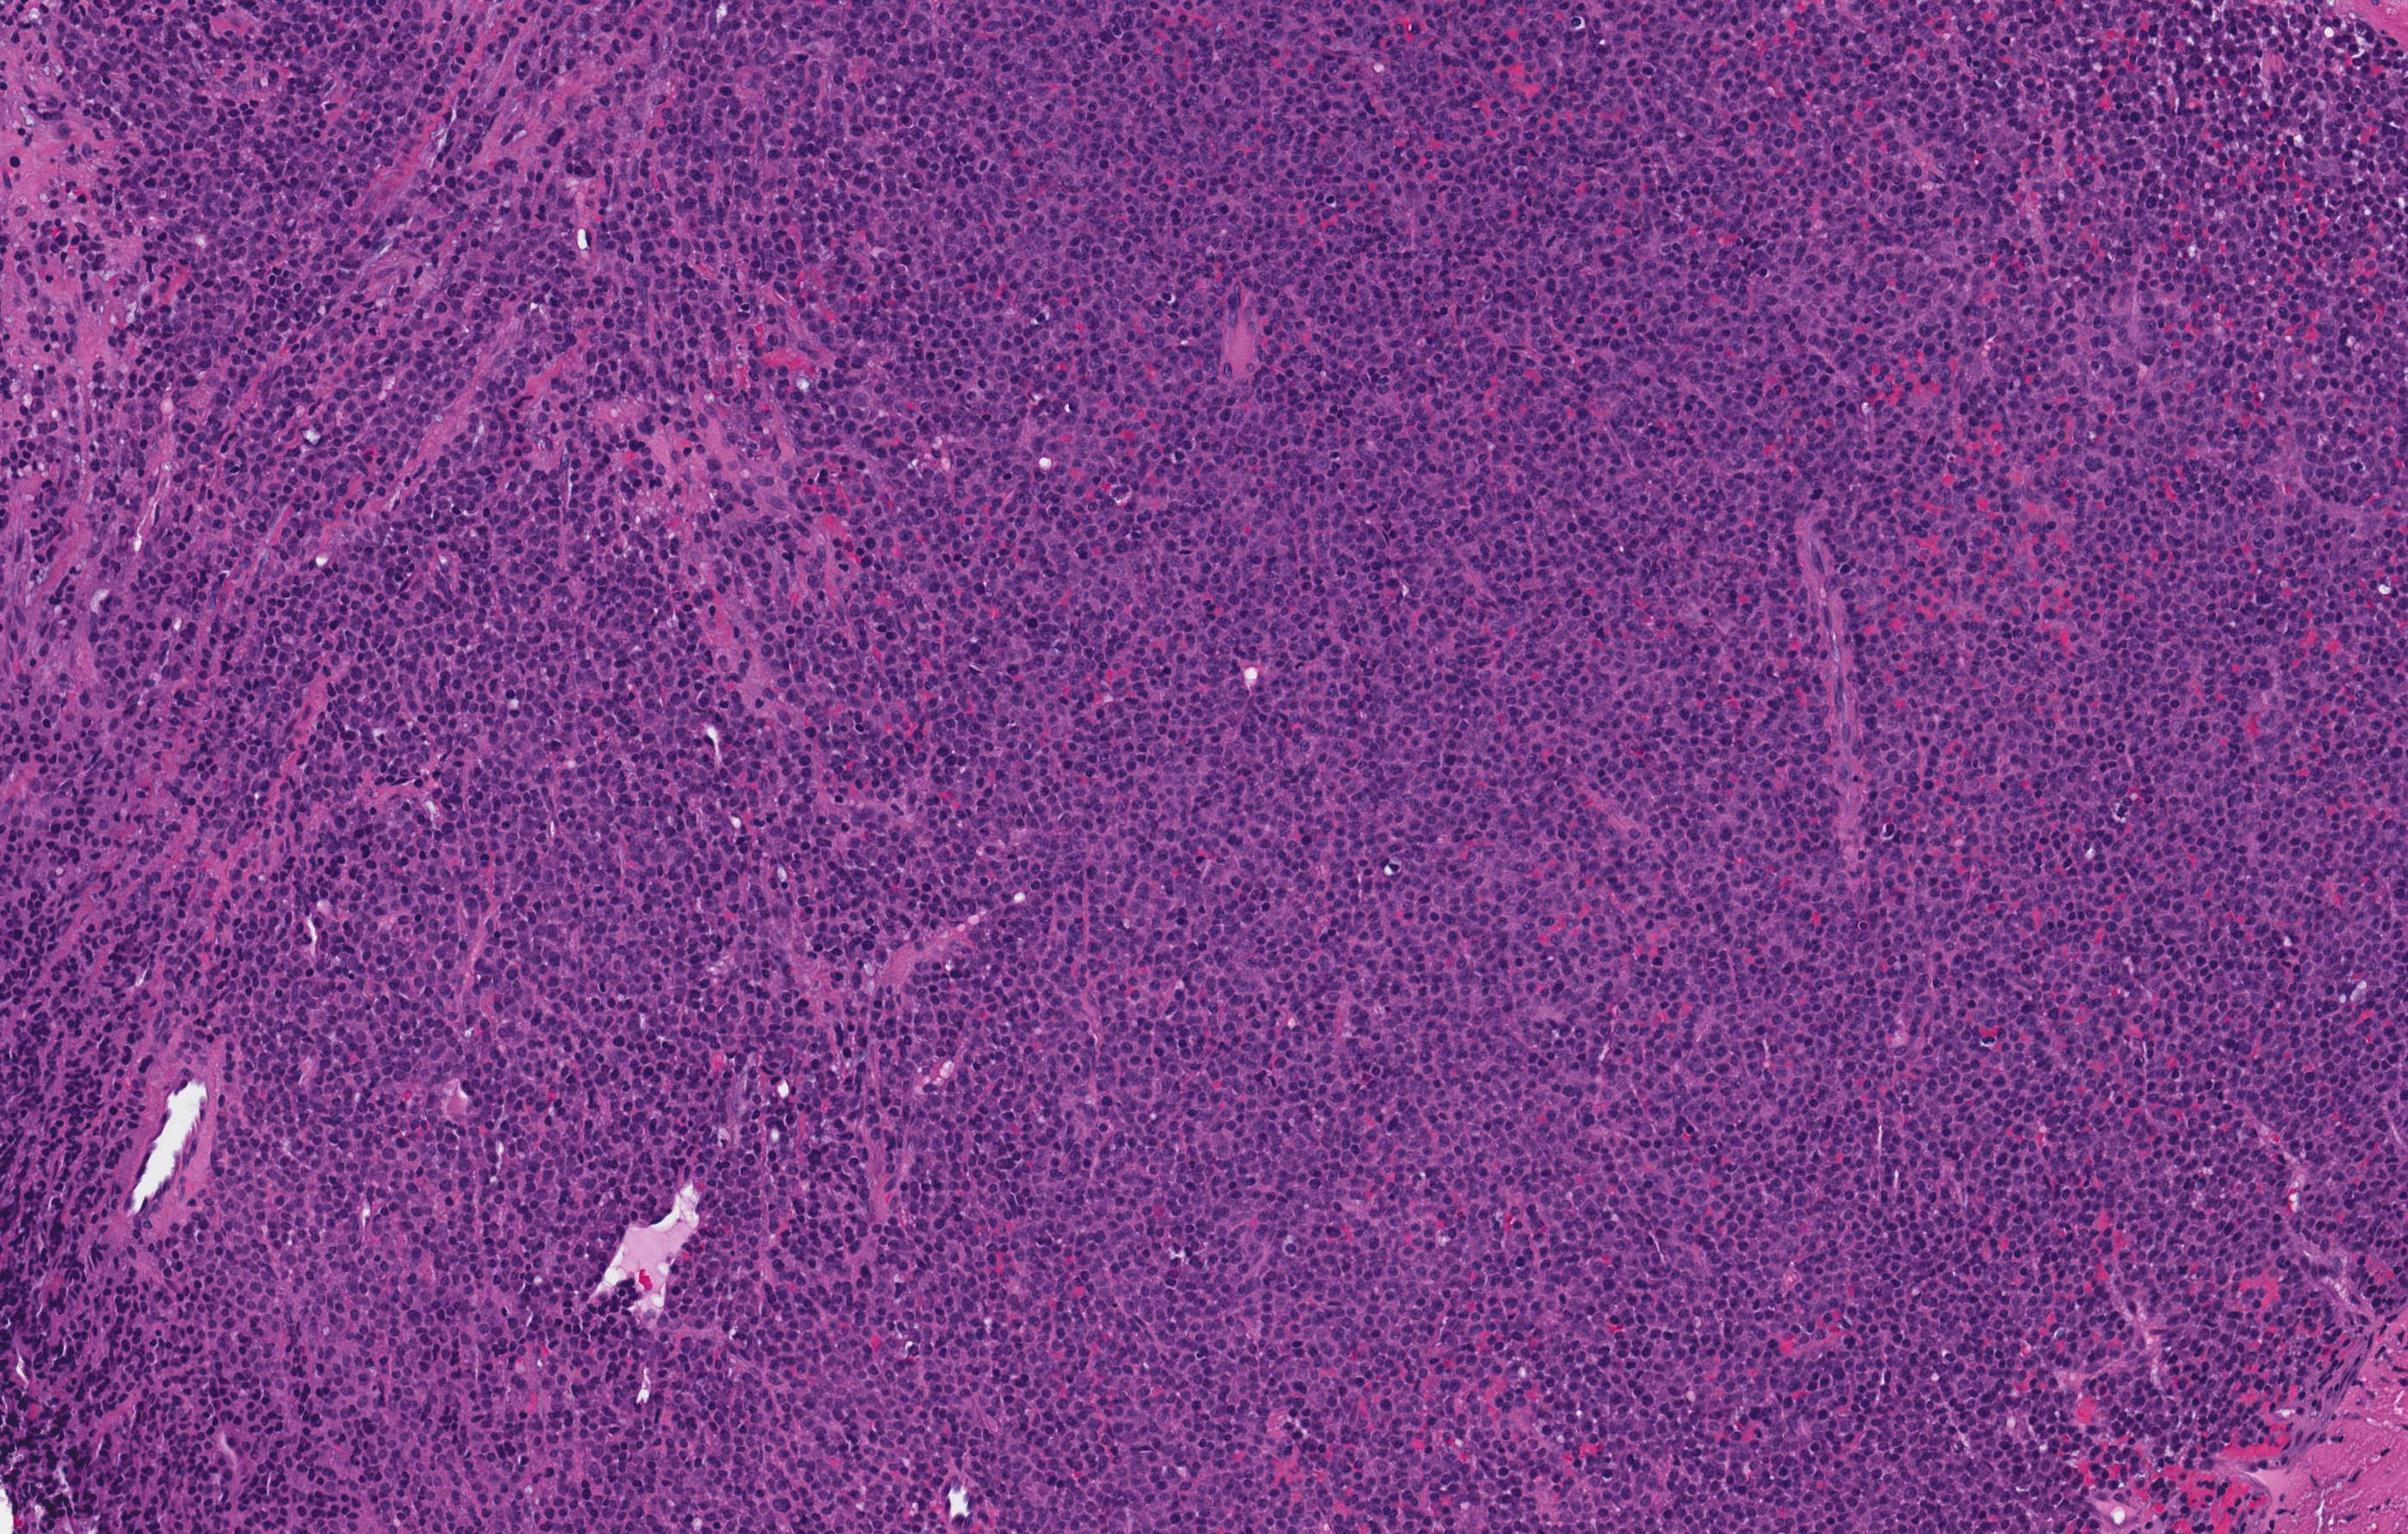
Plasmacytoma
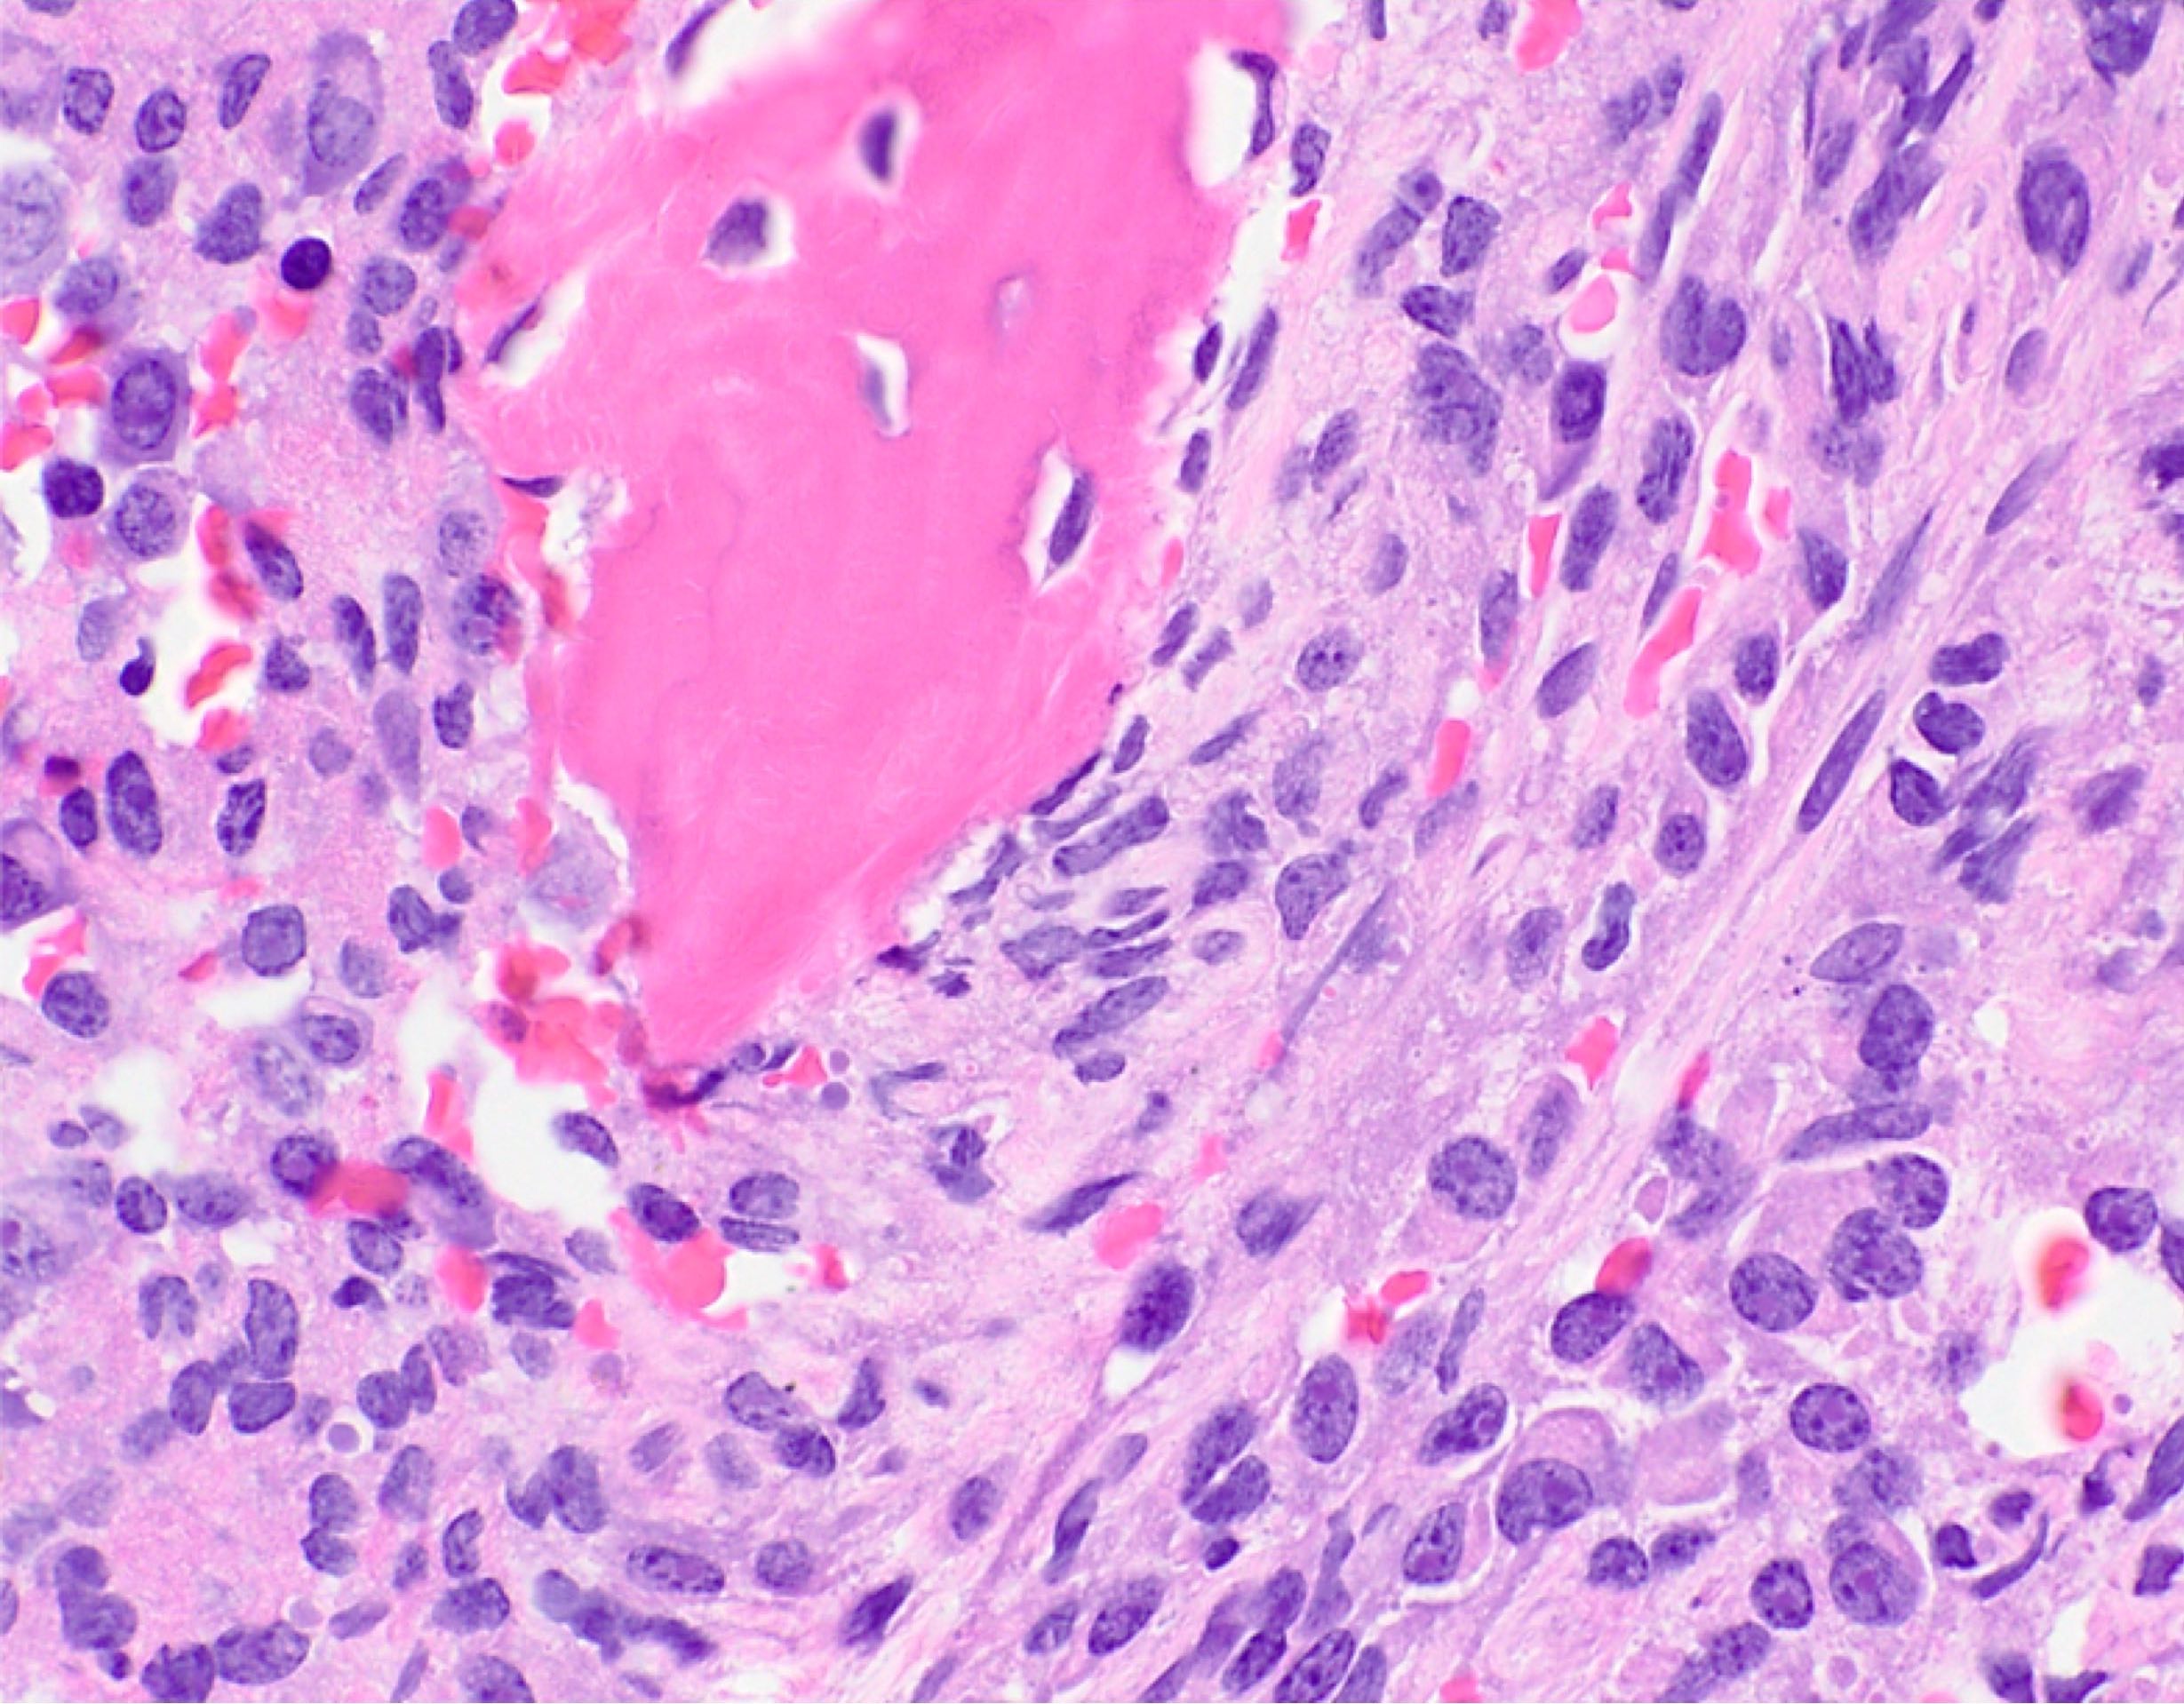
Plasmacytoma of bone with osteolytic destruction
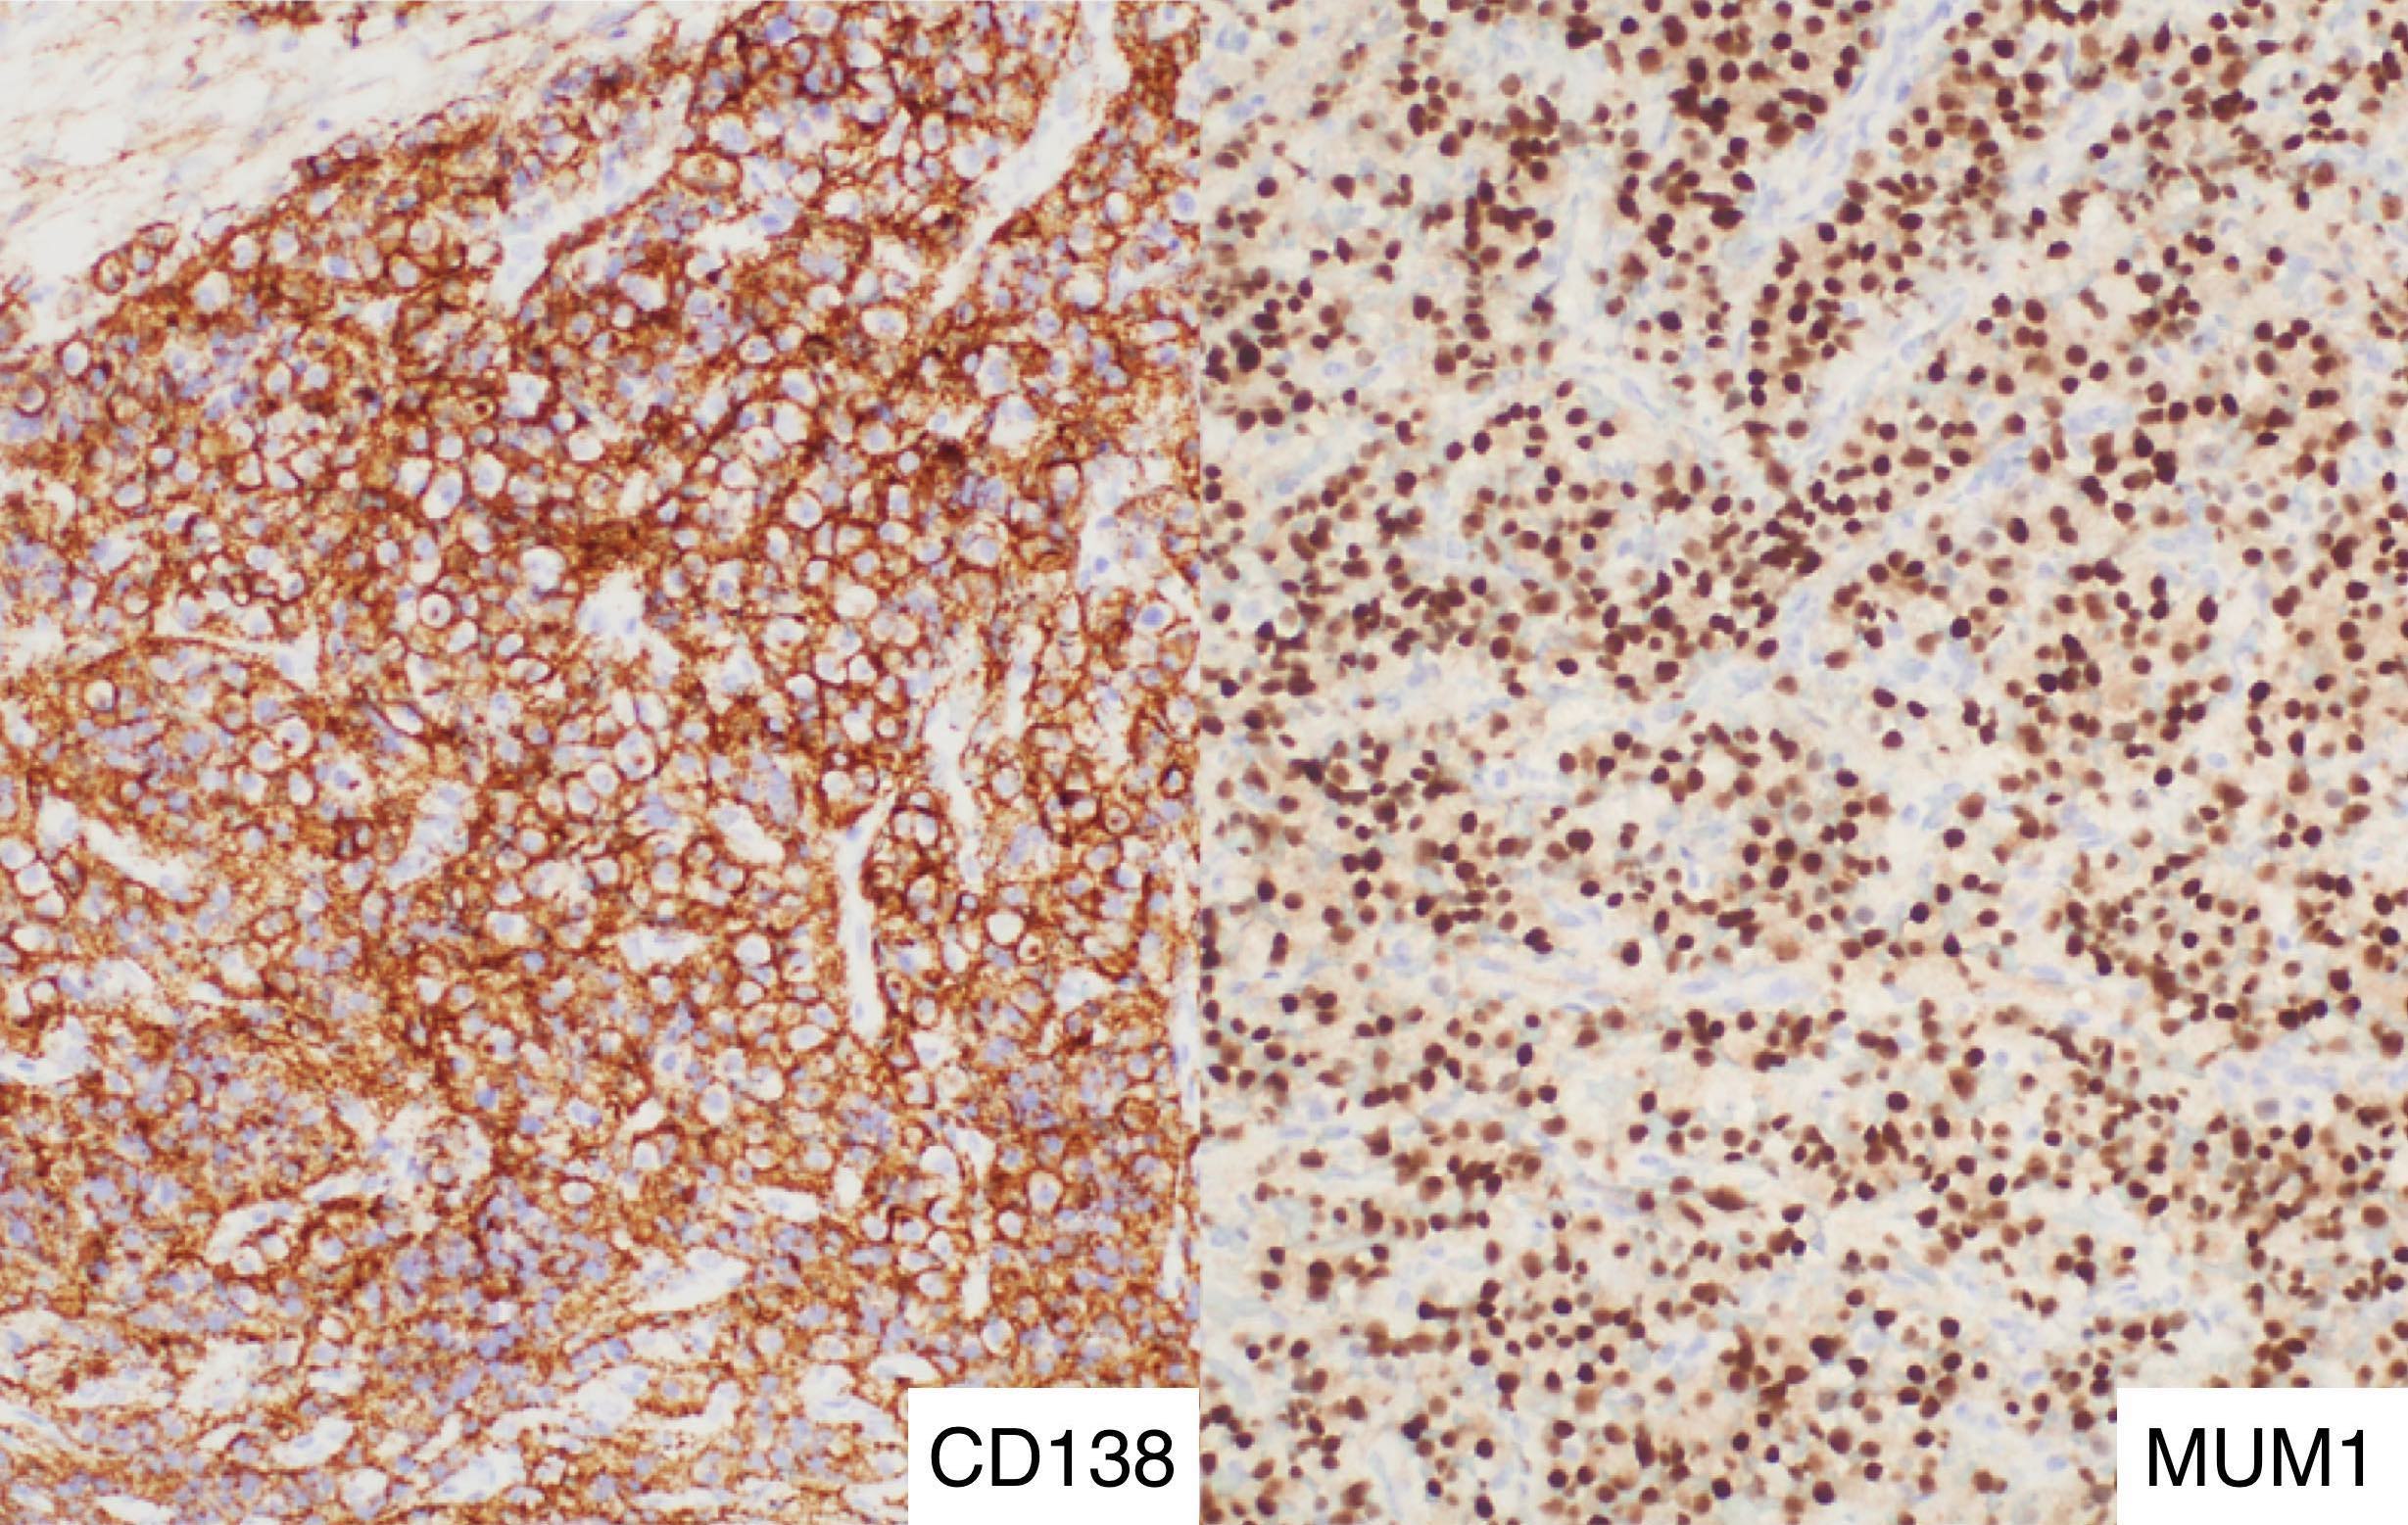
CD138 positive and MUM1 positive

CD79 variable and CD20 negative

Core biopsy section

Core biopsy, kappa and lambda
Solitary plasmacytoma of bone
Contributed by Genevieve M. Crane, M.D., Ph.D.
Plasmacytoma touch preparation

Images hosted on other servers:

Systemic AL amyloidosis
Contributed by Meenakshi Bansal, M.D.
Bone marrow with extensive involvement by amyloid

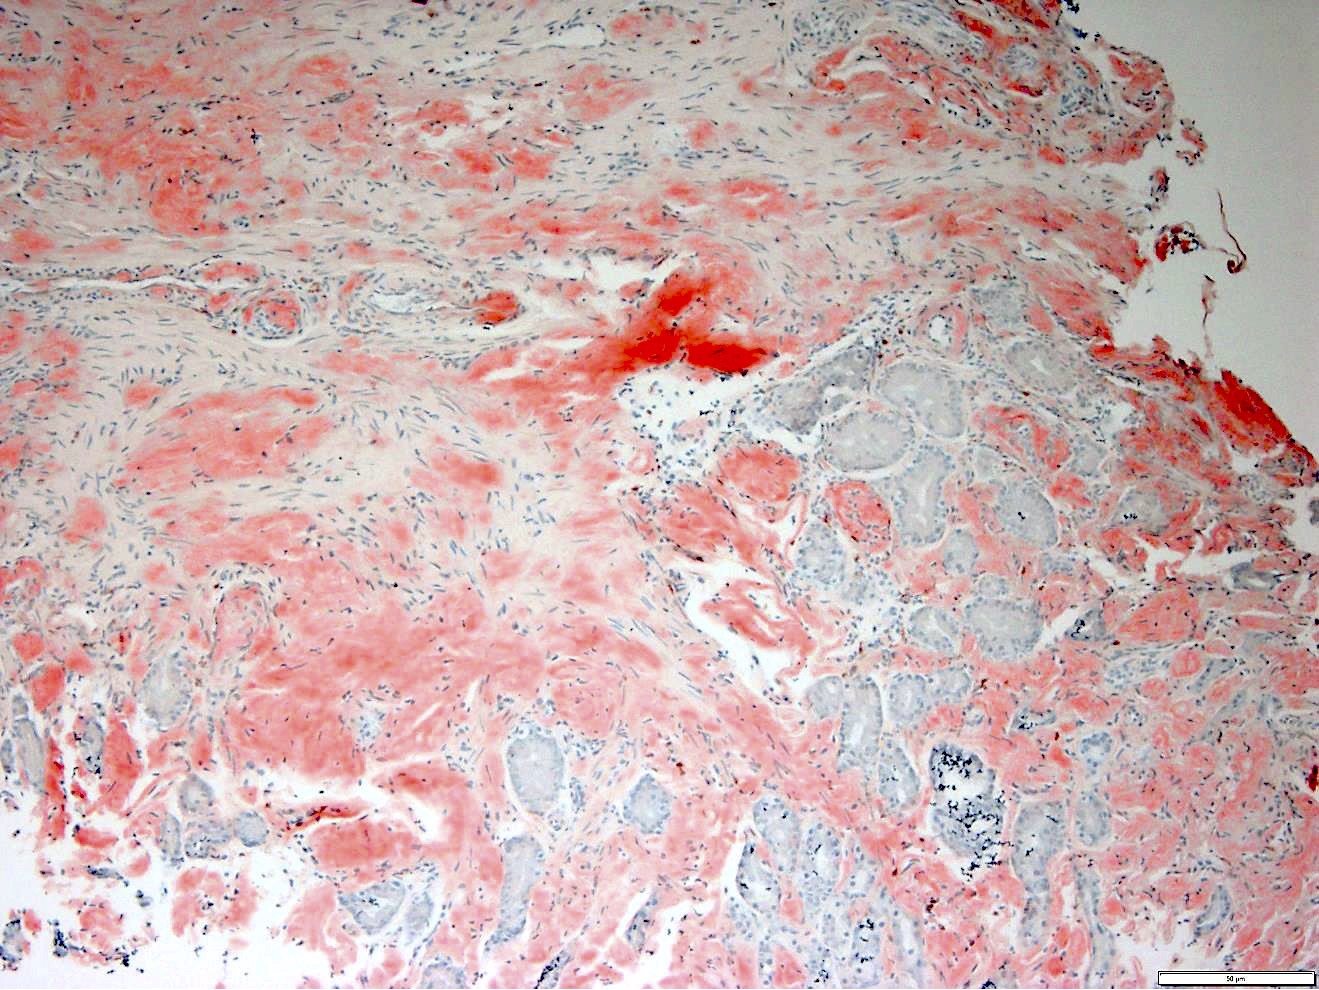

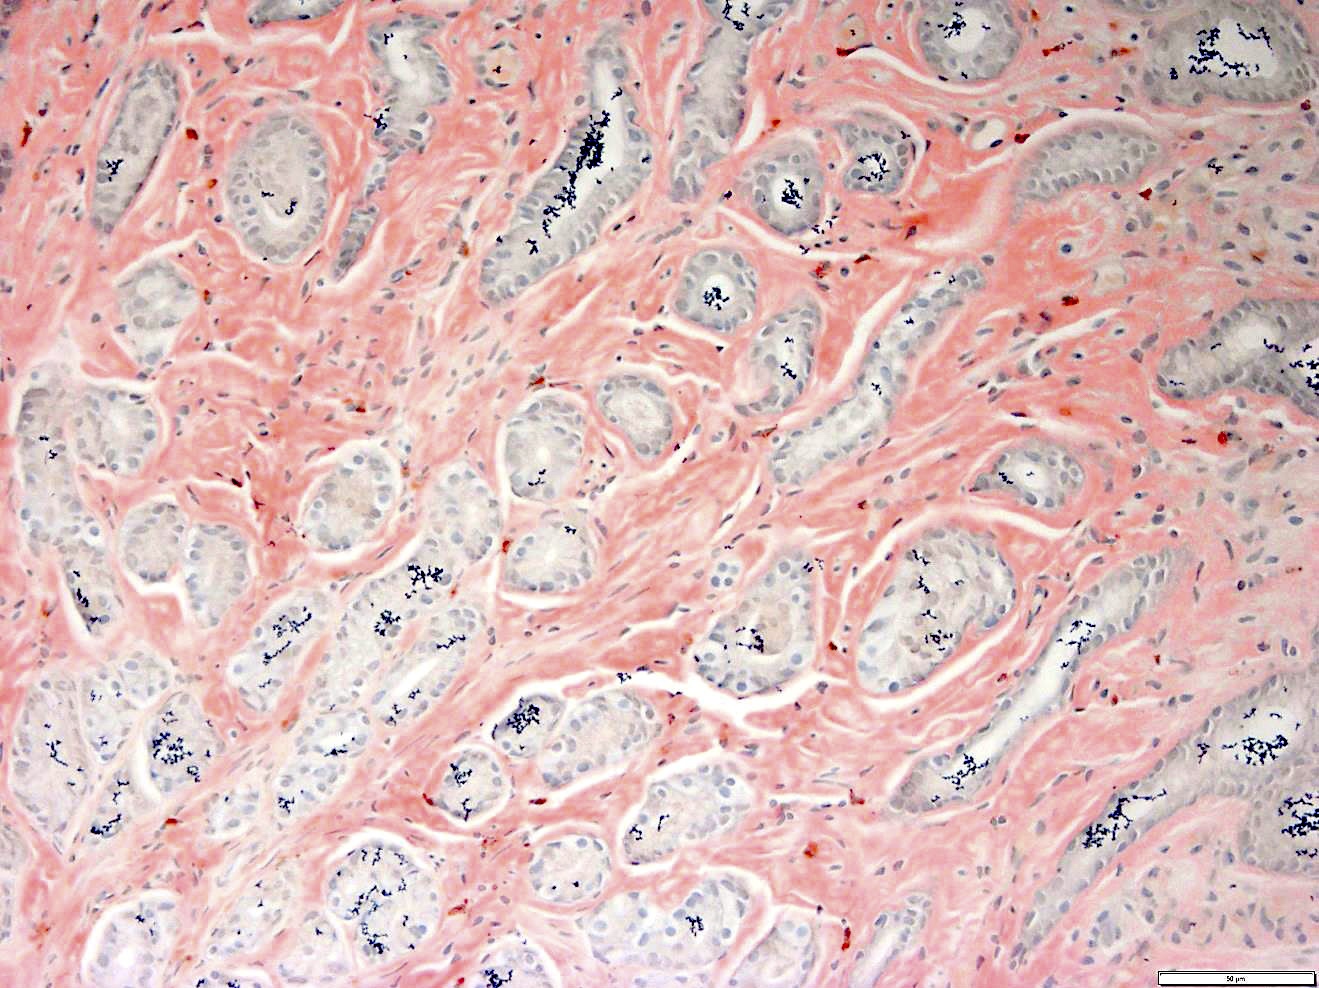
Gastric biopsies from the same patient showing extensive involvement by amyloid
Contributed by Karen Vanderbilt and Bruce Goldman, M.D.
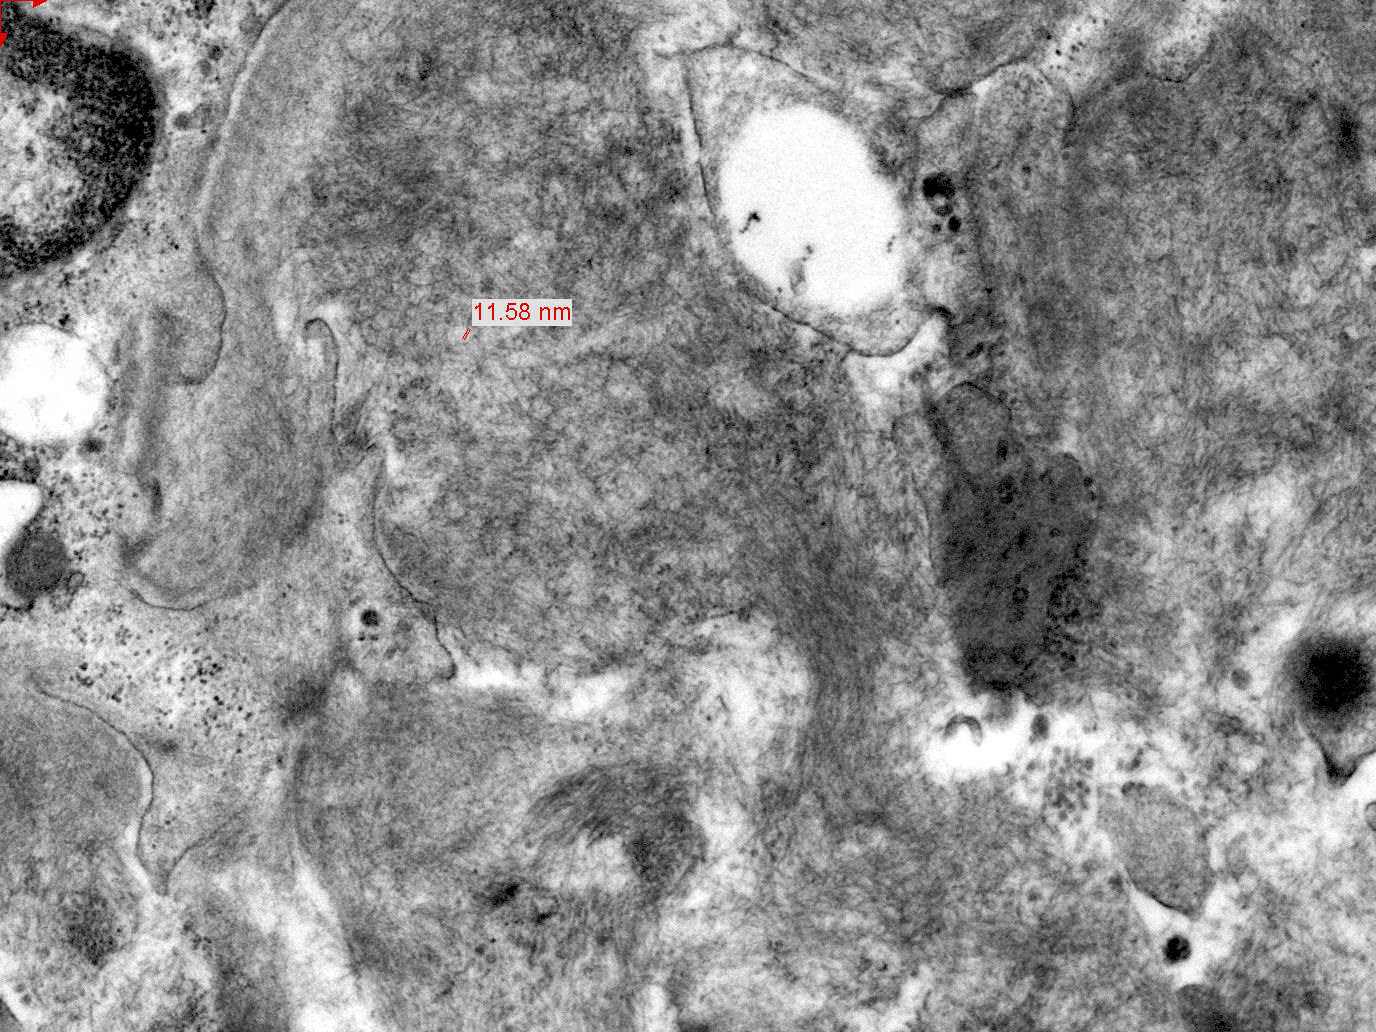
Amyloid by electron micrograph
Contributed by Hatem Kaseb, M.D., Ph.D., M.P.H. and AFIP images

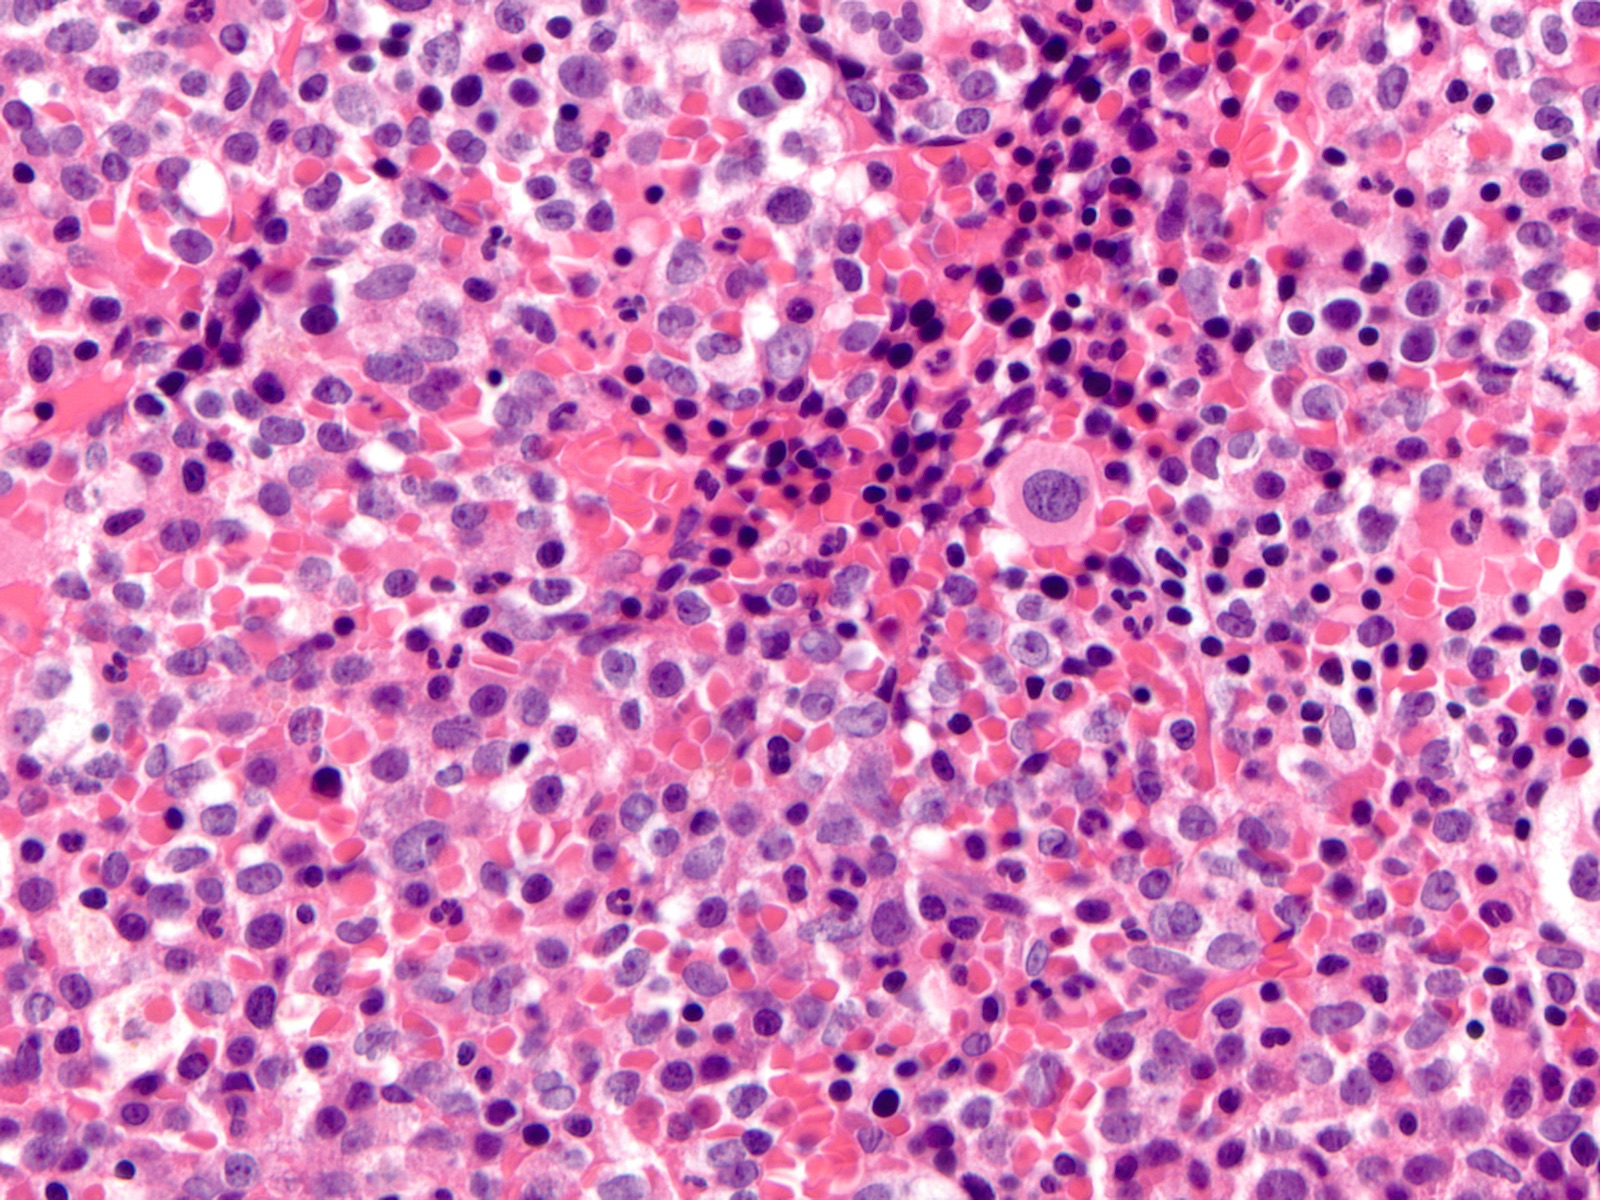
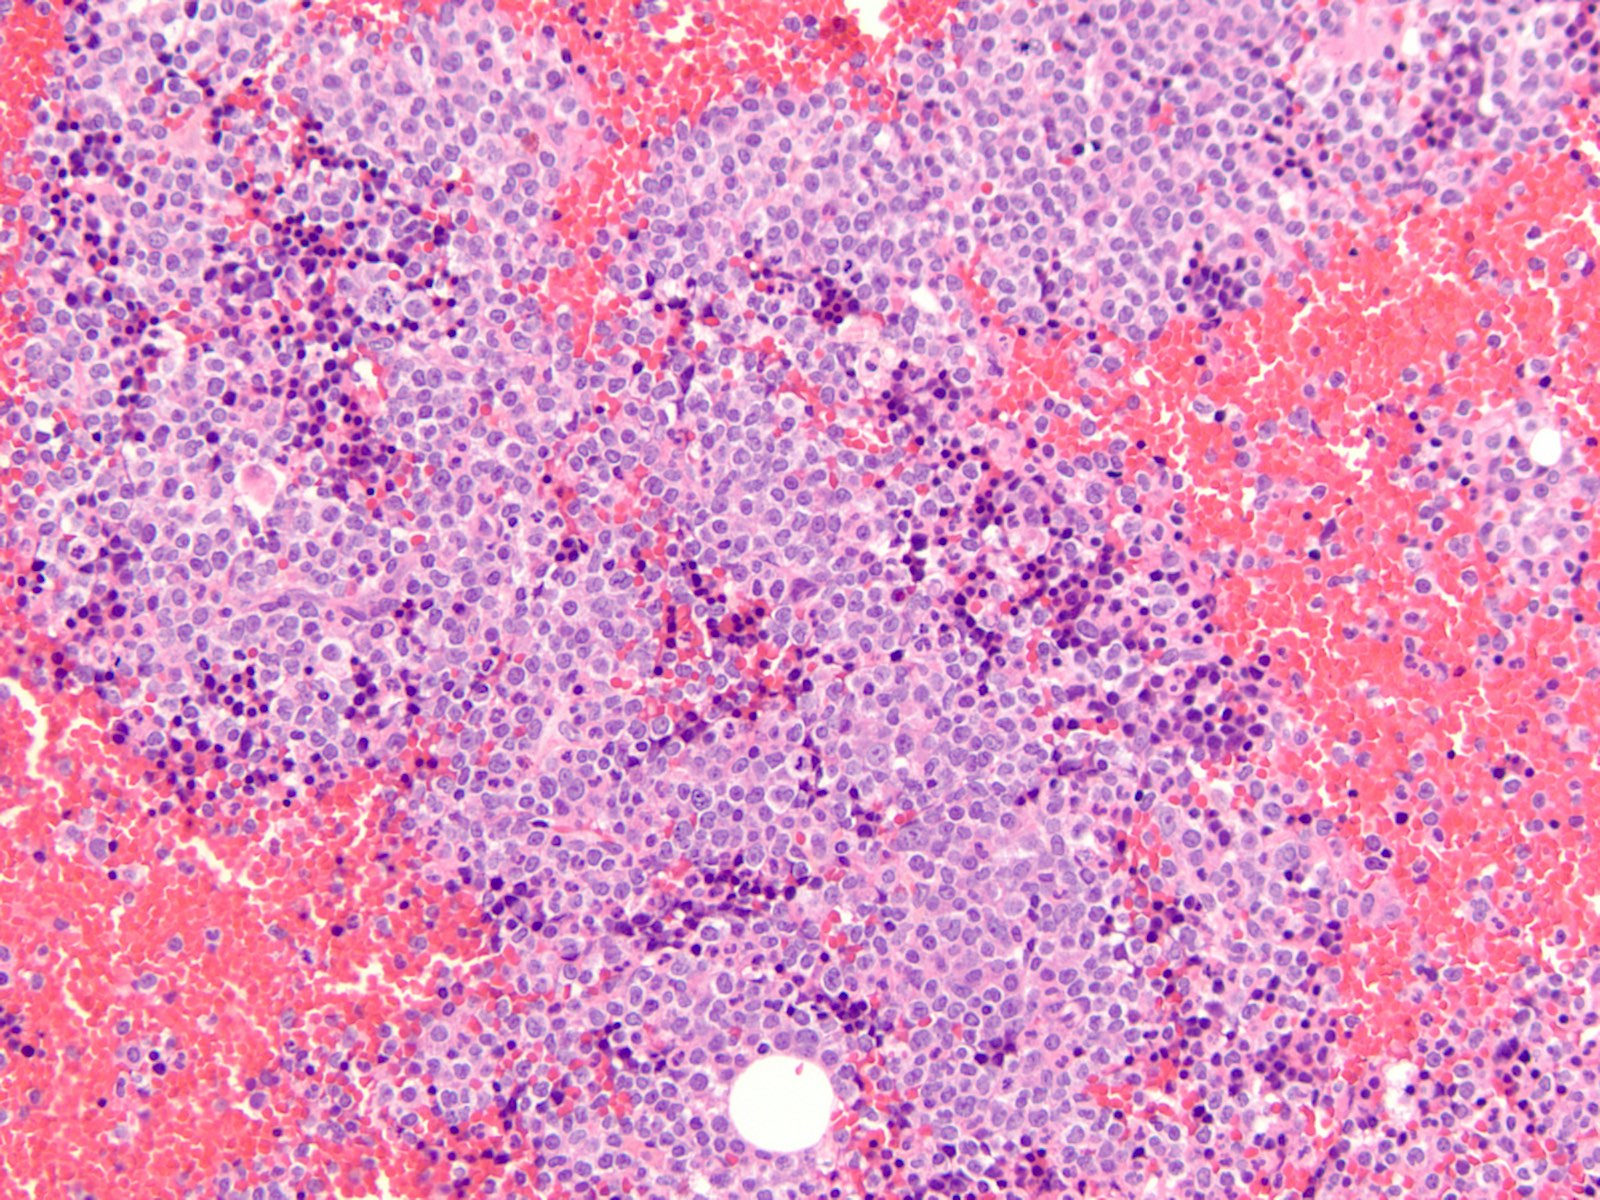
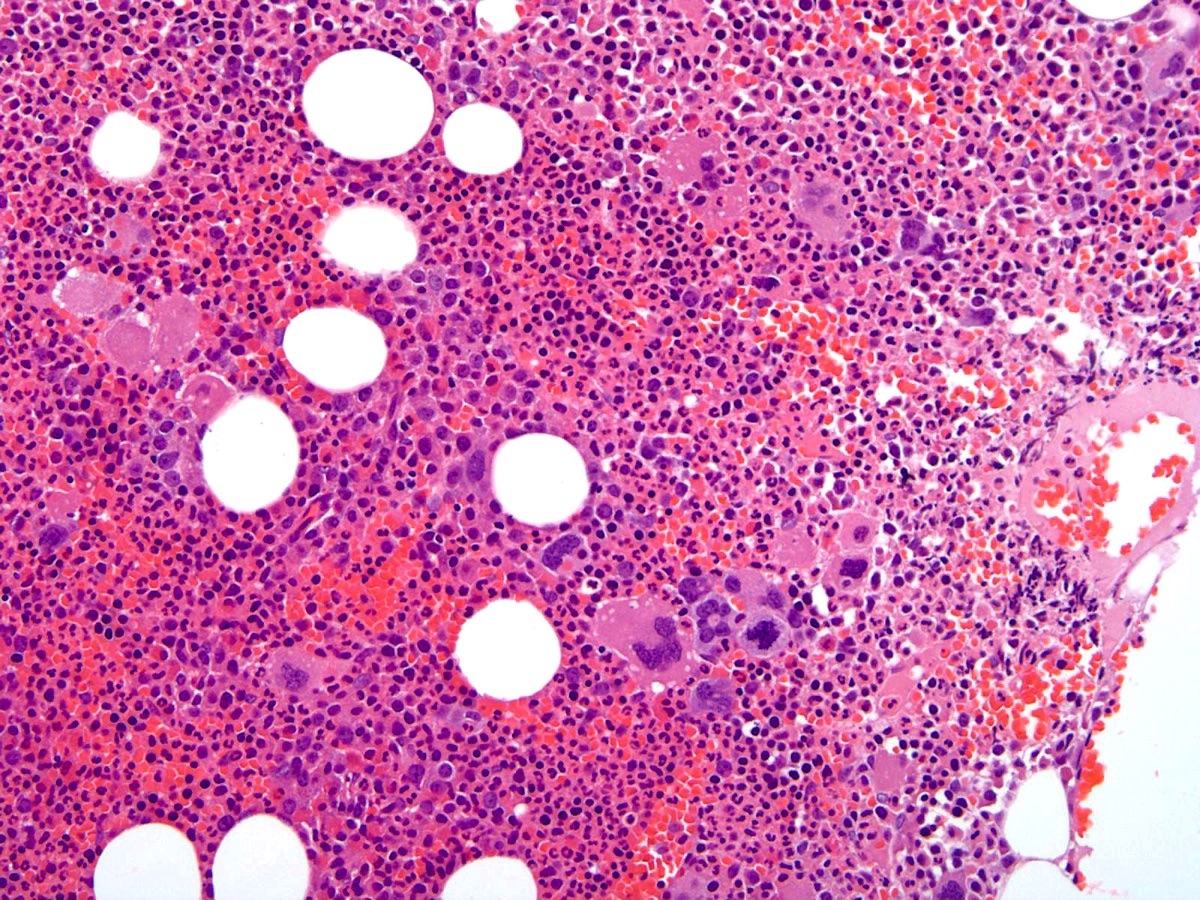
Atypical megakaryocytes
Fibrotic bone marrow
Blast transformation
Contributed by Hatem Kaseb, M.D., Ph.D., M.P.H. and AFIP images
Dacrocytes

Cell intermediate
Blast transformation
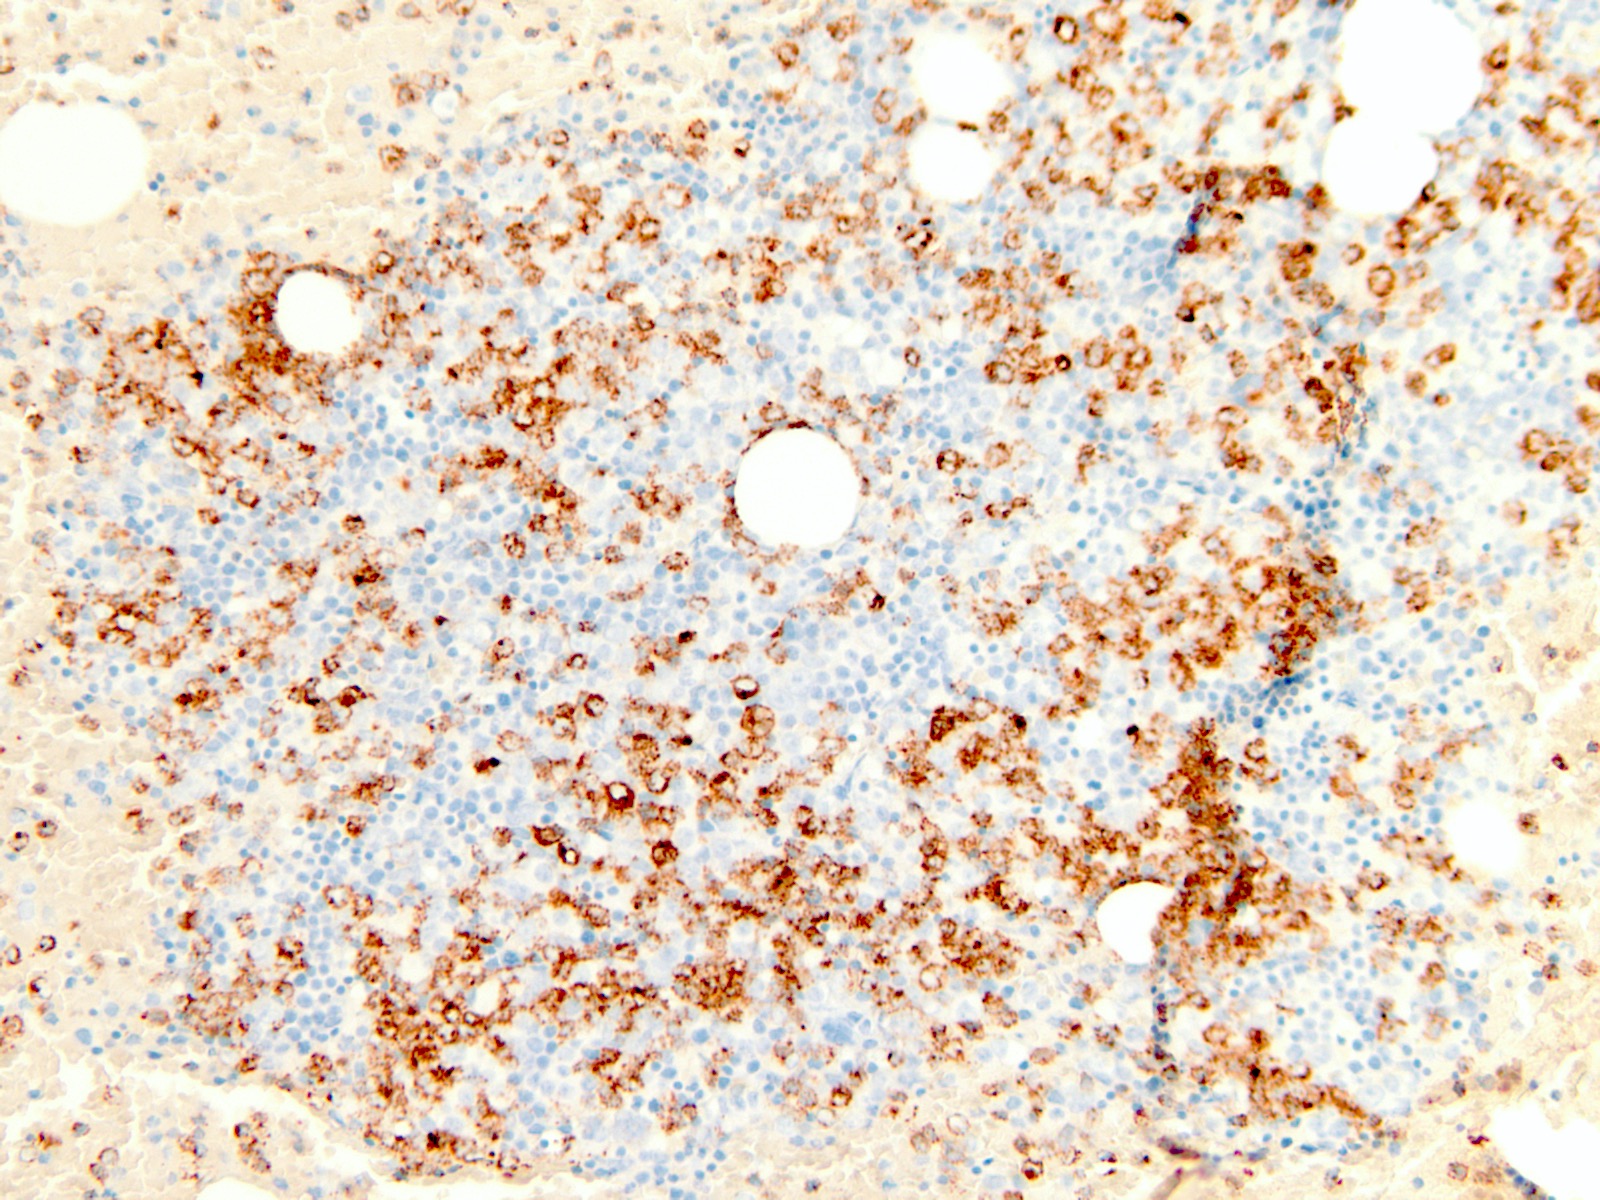
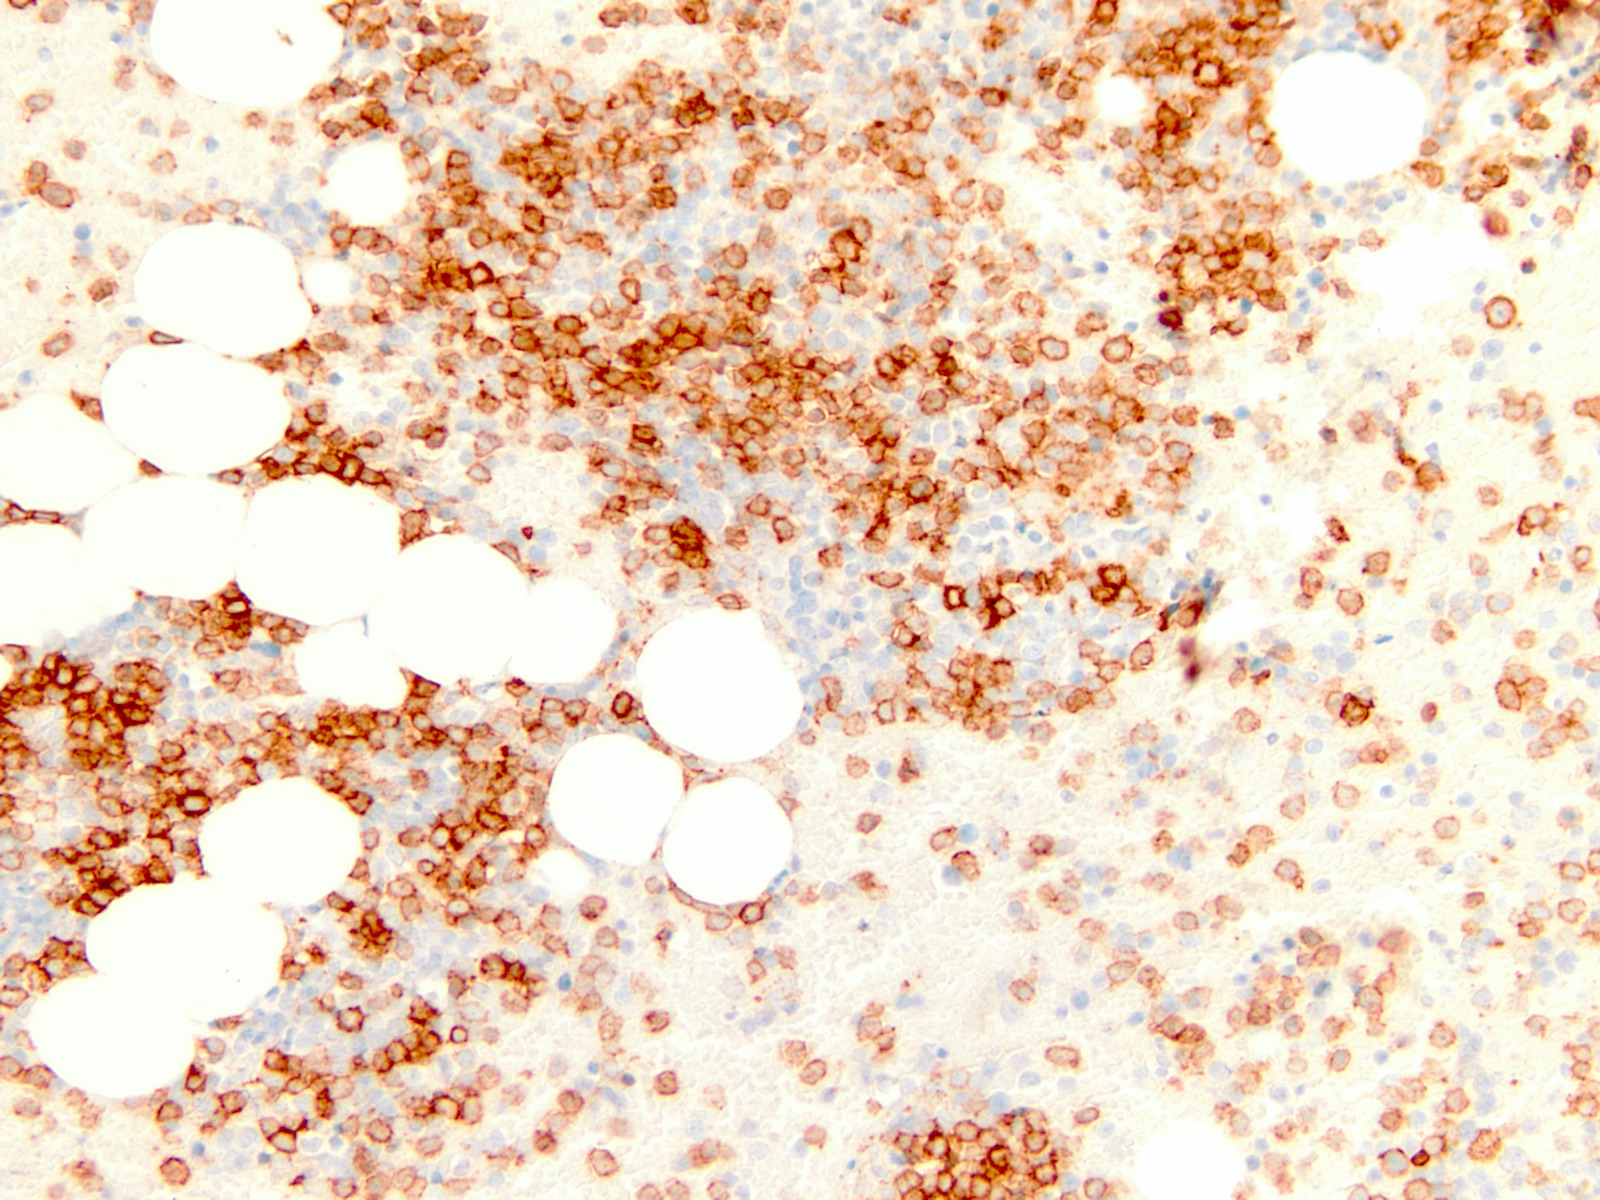
Contributed by Hatem Kaseb, M.D., Ph.D., M.P.H.

Normal myeloid maturation
Contributed by Hatem Kaseb, M.D., Ph.D., M.P.H. and AFIP
Atypical megakaryocytes
Fibrotic bone marrow
Blast transformation
Cell intermediate
Contributed by Hatem Kaseb, M.D., Ph.D., M.P.H.
Dacrocytes
Contributed by Hatem Kaseb, M.D., Ph.D., M.P.H.
Normal myeloid maturation
Contributed by Mark Girton, M.D. and AFIP
Marrow mast cell cluster
Intermixed with lymphoid aggregate
Aspirate with mast cells
Mast cell cluster
Hypercellular bone marrow biopsy
Bone marrow biopsy with marrow replacement
Cytologic spectrum
CD117 positive mast cells
CD25 positive mast cells
CD2 positive mast cells
CD30 positive mast cells
CD117 positive mast cells
Mast cell tryptase positive
CD25 positive mast cells
Perifollicular distribution

Characteristic sclerosis
Mast cell infiltrate
Delicate collagen fibrils and eosinophils
Mast cell staining
Interfollicular pattern
Diffuse involvement
Ovoid nuclei with eosinophilic cytoplasm
Spindle shaped mast cells
Spindly configuration
Contributed by Mark Girton, M.D.
Peripheral blood mast cell
Images hosted on other servers:

Rearrangements involving T cell receptor genes
AFIP images
Bone marrow biopsy
Focal paranuclear acid phosphatase staining
AFIP images
Markedly elevated leukocyte count
L2 type (blood smears)
Images hosted on other servers:

FISH: t(5;14)(q35;q32)
Contributed by Jesse Manuel Jaso, M.D.
Bone marrow with increased blasts
CD34 highlighting clusters of blasts
Contributed by Valentina Sangiorgio, M.D. and AFIP
t-MDS: hypercellular bone marrow
t-AML: hypercellular bone marrow with impaired maturation
t-MDS: bland reticulin fibrosis
t-MDS: myeloid hypoplasia with left shift
t-AML: clusters of blasts
Large erythroid precursors with lobulated nuclei and karyorrhexis

PAS+ erythroid precursors in bone marrow smear
AFIP images
Postradiochemotherapy
and splenectomy for
Hodgkin disease
Contributed by Valentina Sangiorgio, M.D.
t-AML
Contributed by Valentina Sangiorgio, M.D.
G banding karyotype of
t-AML
Role of bone marrow transplant in therapy related AML and MDS
Contributed by Julia T. Geyer, M.D. and Tayler A. van den Akker, M.D.
Bone marrow biopsy
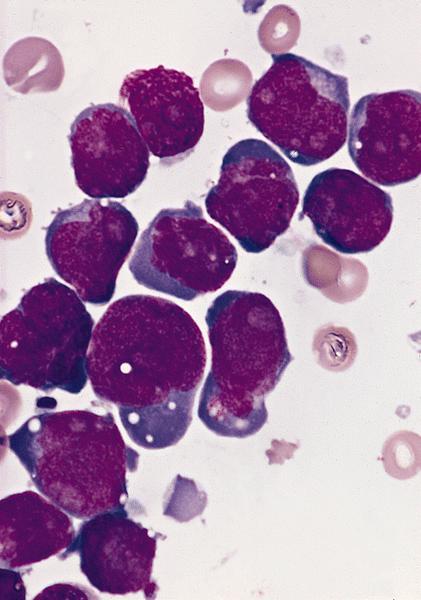
Blasts of TAM-DS
Blasts with hematopoietic elements

Cytoplasmic blebs
Contributed by Julie Teruya-Feldstein, M.D.

Peripheral blood blasts
Contributed by Tayler A. van den Akker, M.D.
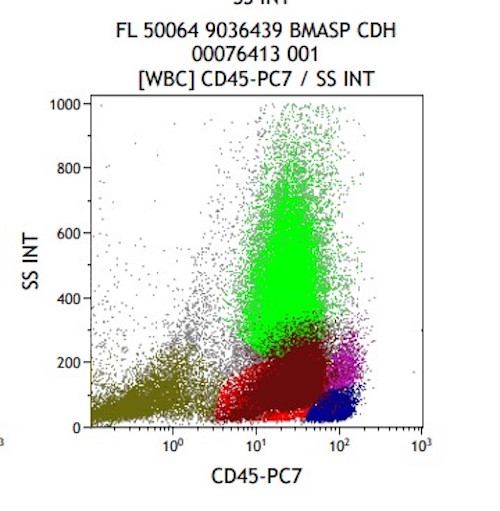
CD45+ dim population
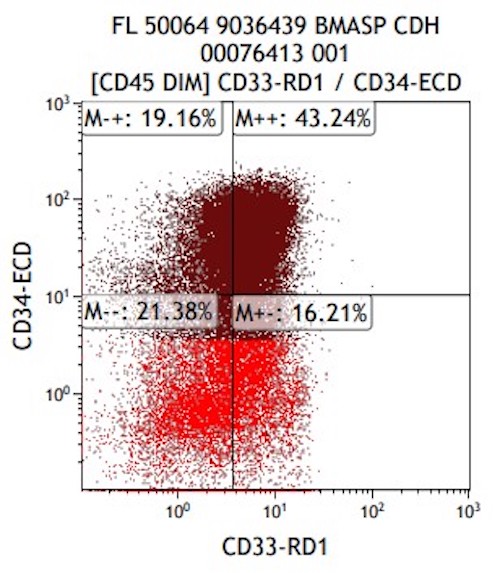
CD34+, CD33+ dim population
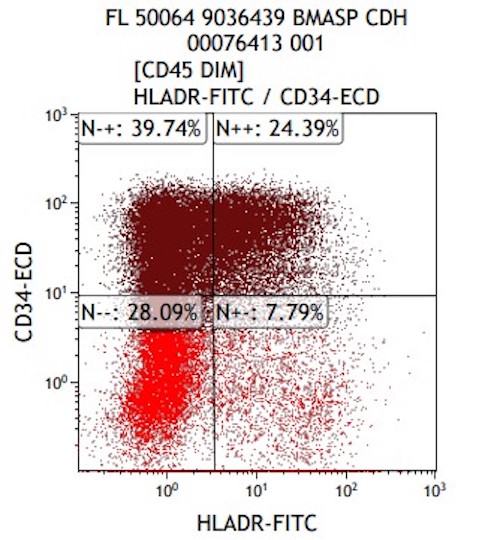
CD34+,
HLA-DR+ partial population

CD33+ dim, CD117+ population
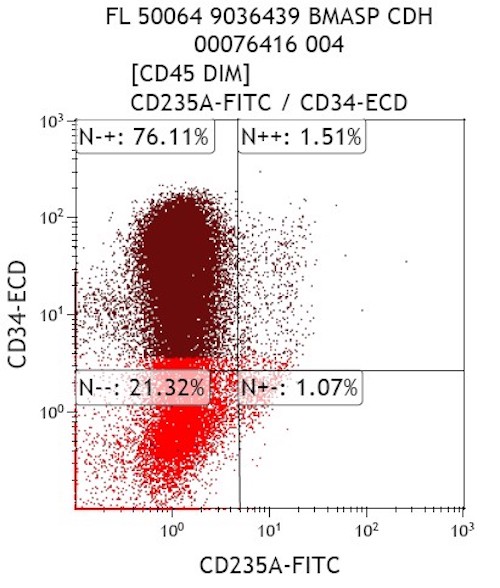
CD34+, CD235A- population
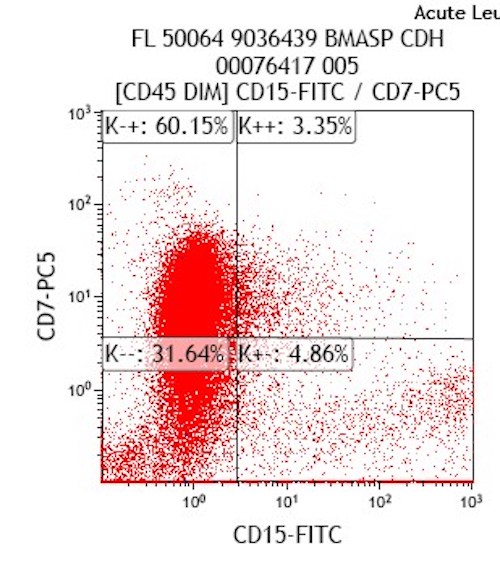
CD7+ heterogeneous, CD15- population
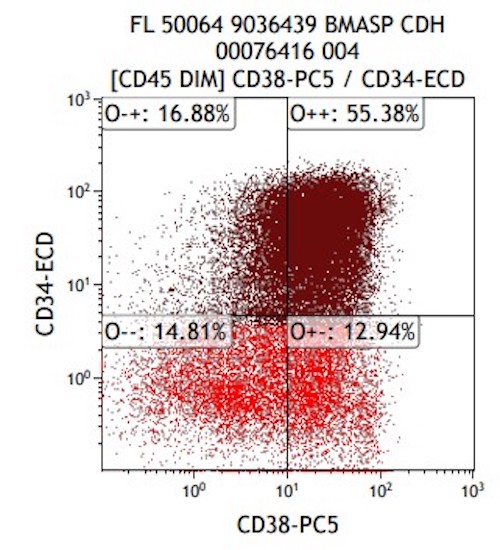
CD34+, CD38+ population
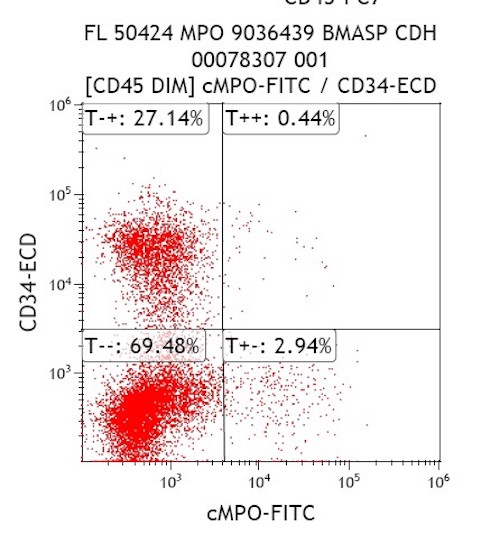
CD34+, MPO- population
Images hosted on other servers:

FISH: t(12;21)(p13;q22)
AFIP images
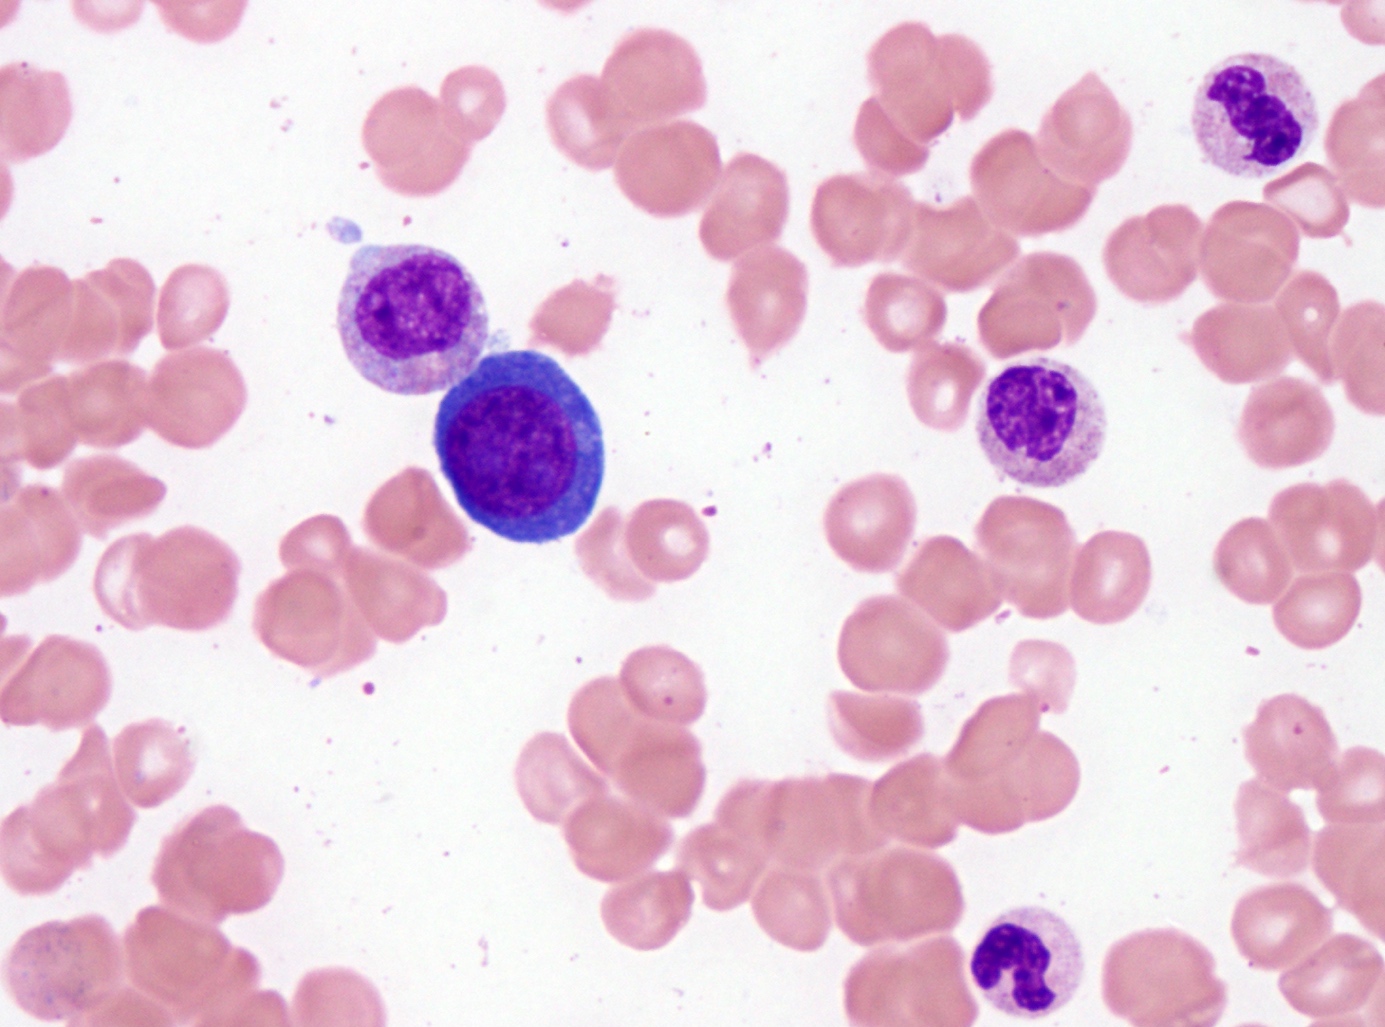
Leukemic cells resemble early erythroblasts
Contributed by Julia Braza, M.D., M.S.

CSF
Images hosted on other servers:

B-ALL associated with t(9;22); lymphoblasts express B-lineage
markers CD19, CD20, CD22, immature markers CD34, TdT, CD10,
and aberrant CD25; they are aberrantly dim for CD38 and CD81;
this pattern is useful in identifying minimal residual disease
Contributed by Julia Braza, M.D., M.S. and AFIP
FISH
Karyotype
Images hosted on other servers:

Drawing of translocation
Images hosted on other servers:

ALL1 / MLL duplication
Images hosted on other servers:

Proposed mechanisms for DDX41 involvement
Contributed by Jacob Armstrong, M.D.

Hypocellular bone marrow core

Hyperchromatic megakaryocytes

Hypercellular bone marrow core
Marrow with AML
CD34 with ~10% blasts
CD61 with megakaryocyte atypia
Aspirate with increased blasts
nRBC with irregular nuclei
nRBC with nuclear budding

nRBC with multinucleation
Hypolobated megakaryocytes

Ring sideroblasts
Contributed by Jacob Armstrong, M.D.
Macrocytic anemia
Circulating blasts and nRBC
Contributed by Zubaidah Al-Jumaili, M.D.


CD45 versus side scatter

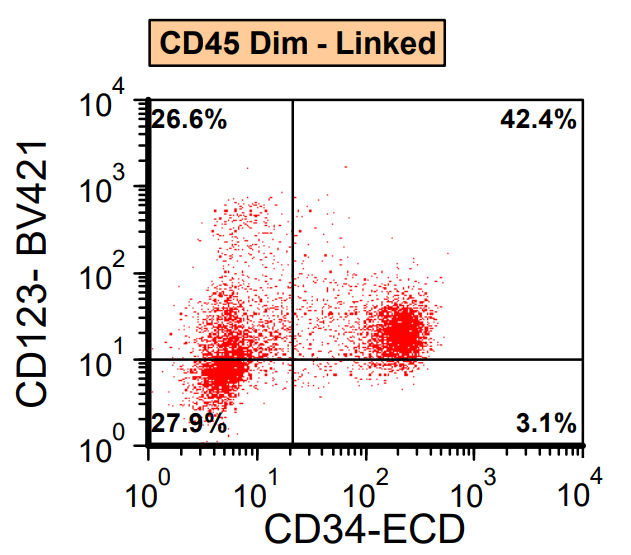
CD34 versus CD123
Images hosted on other servers:

Distribution of DDX41 mutations along the gene

Germline and somatic DDX41 mutations

Deleterious DDX41 germline variants
What is the clinical impact of DDX41 mutations in myeloid neoplasms?
Germline predisposition to myeloid malignancies
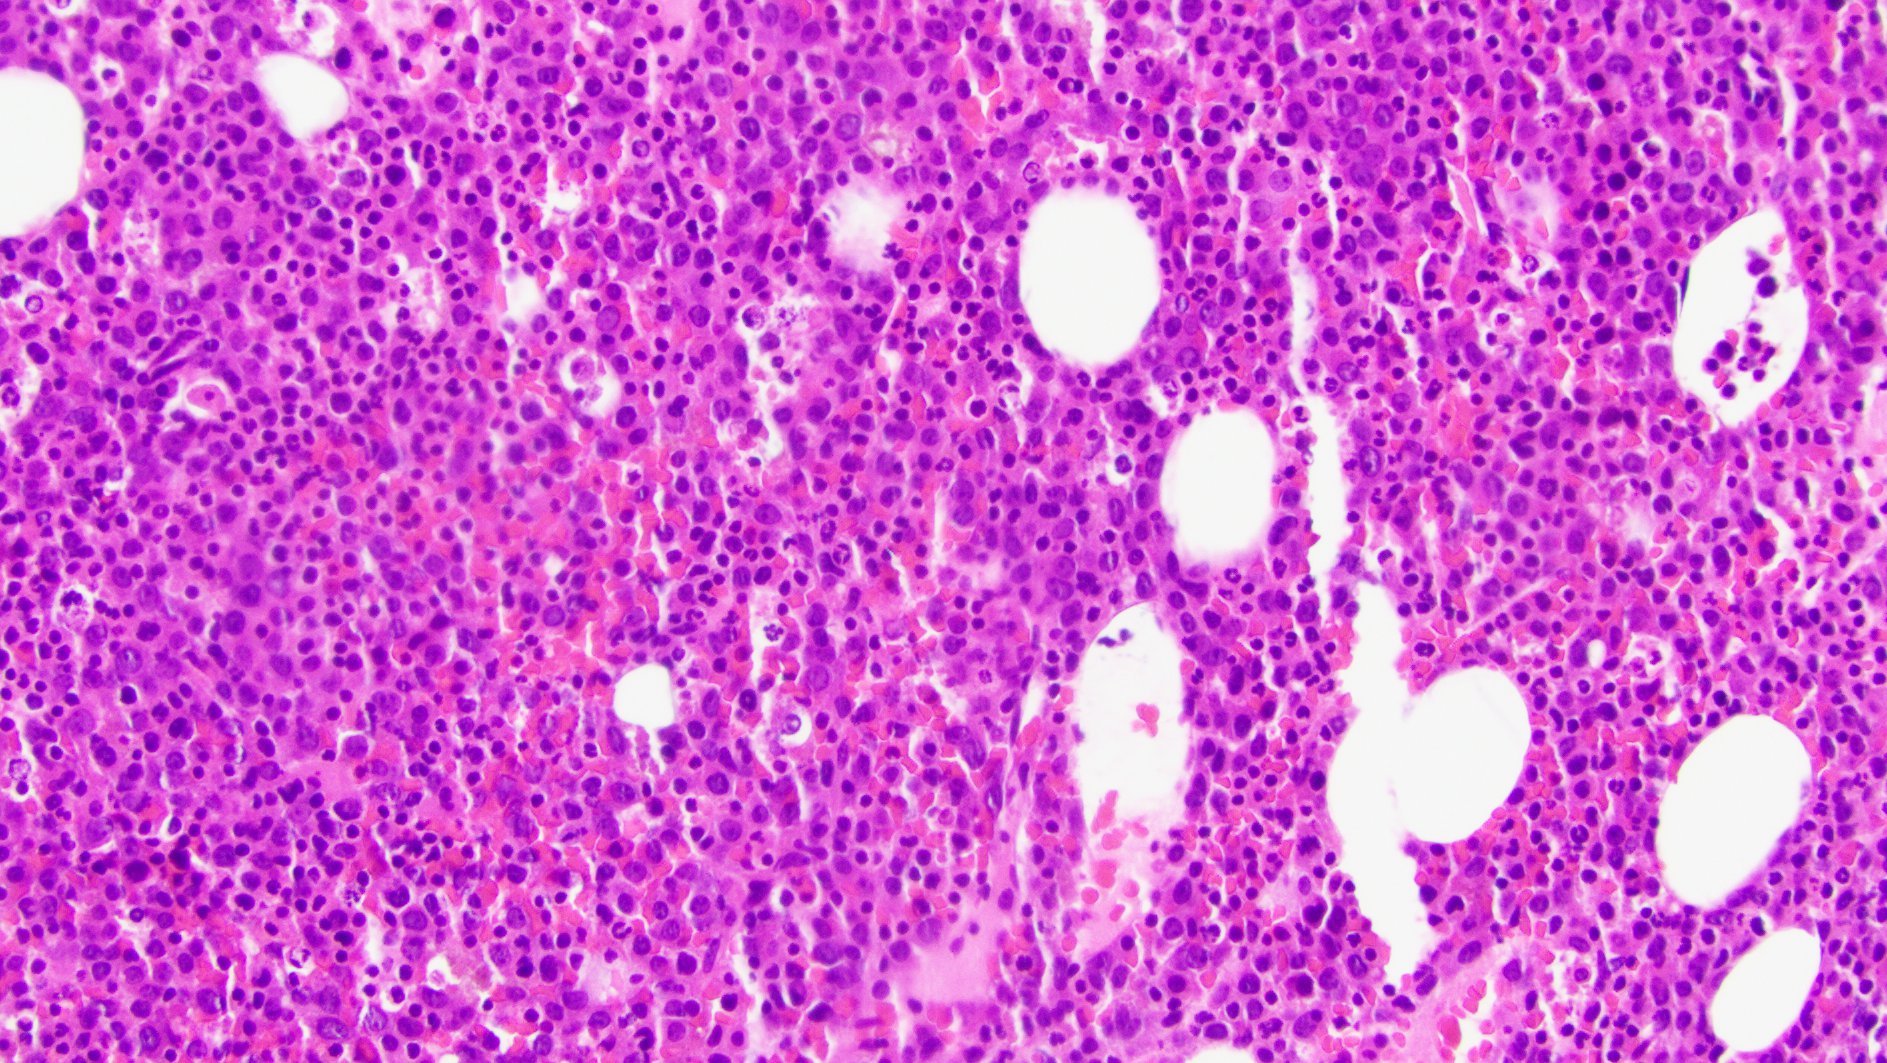
Contributed by Natasha Iranzad, M.D.

Normocellular bone marrow
Megakaryocyte dysplasia
CD61
Images hosted on other servers:

Karyogram with del(5q)
Images hosted on other servers:

Karyotype of severe hypodiploidy
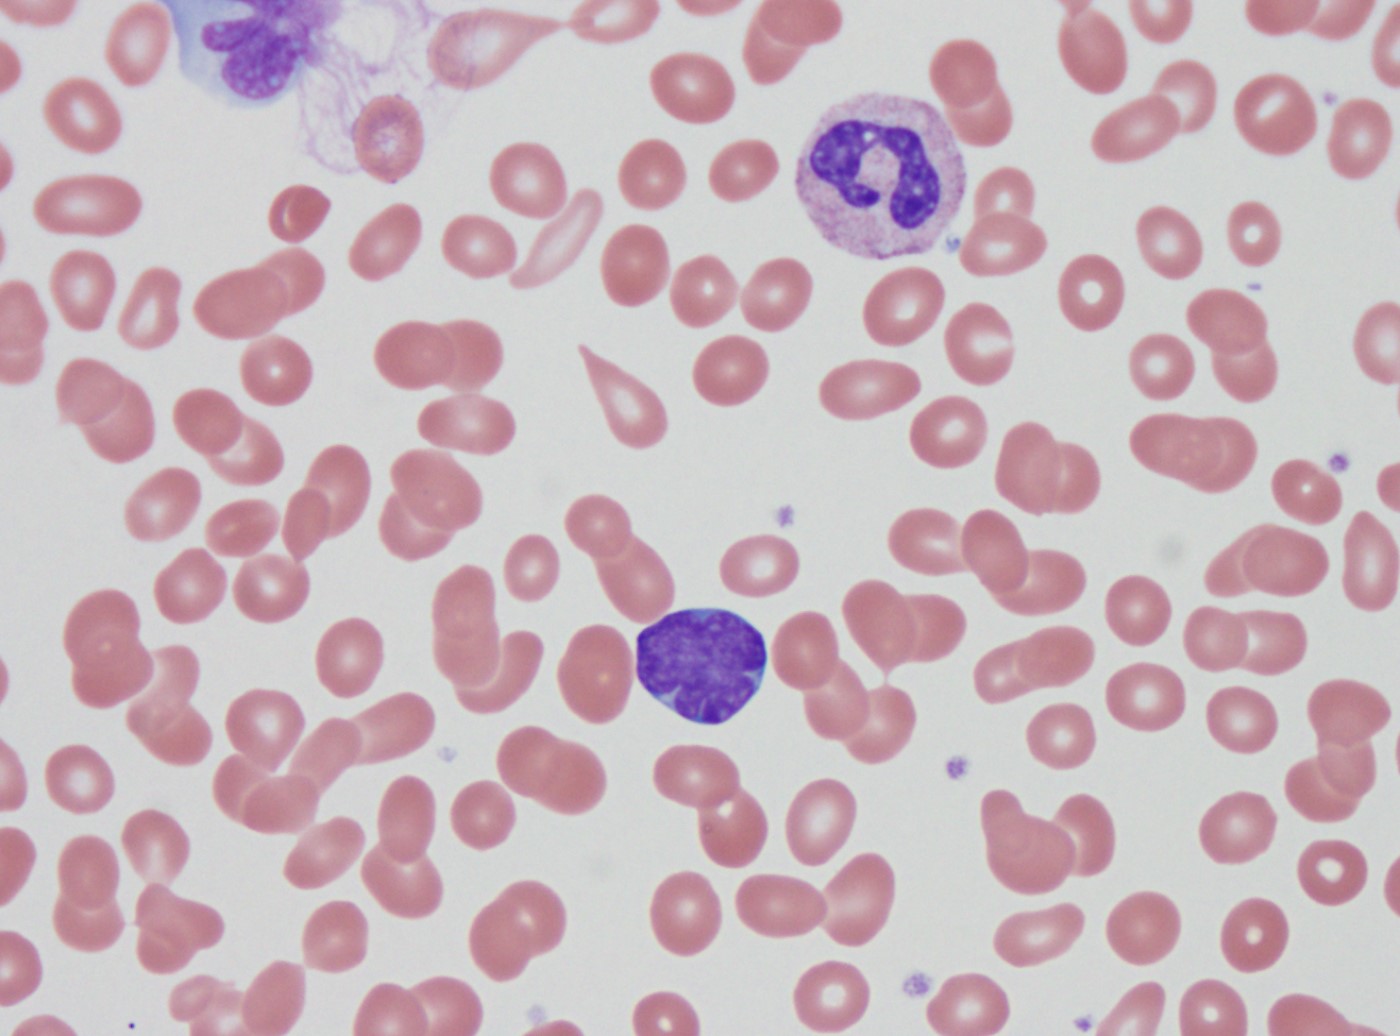
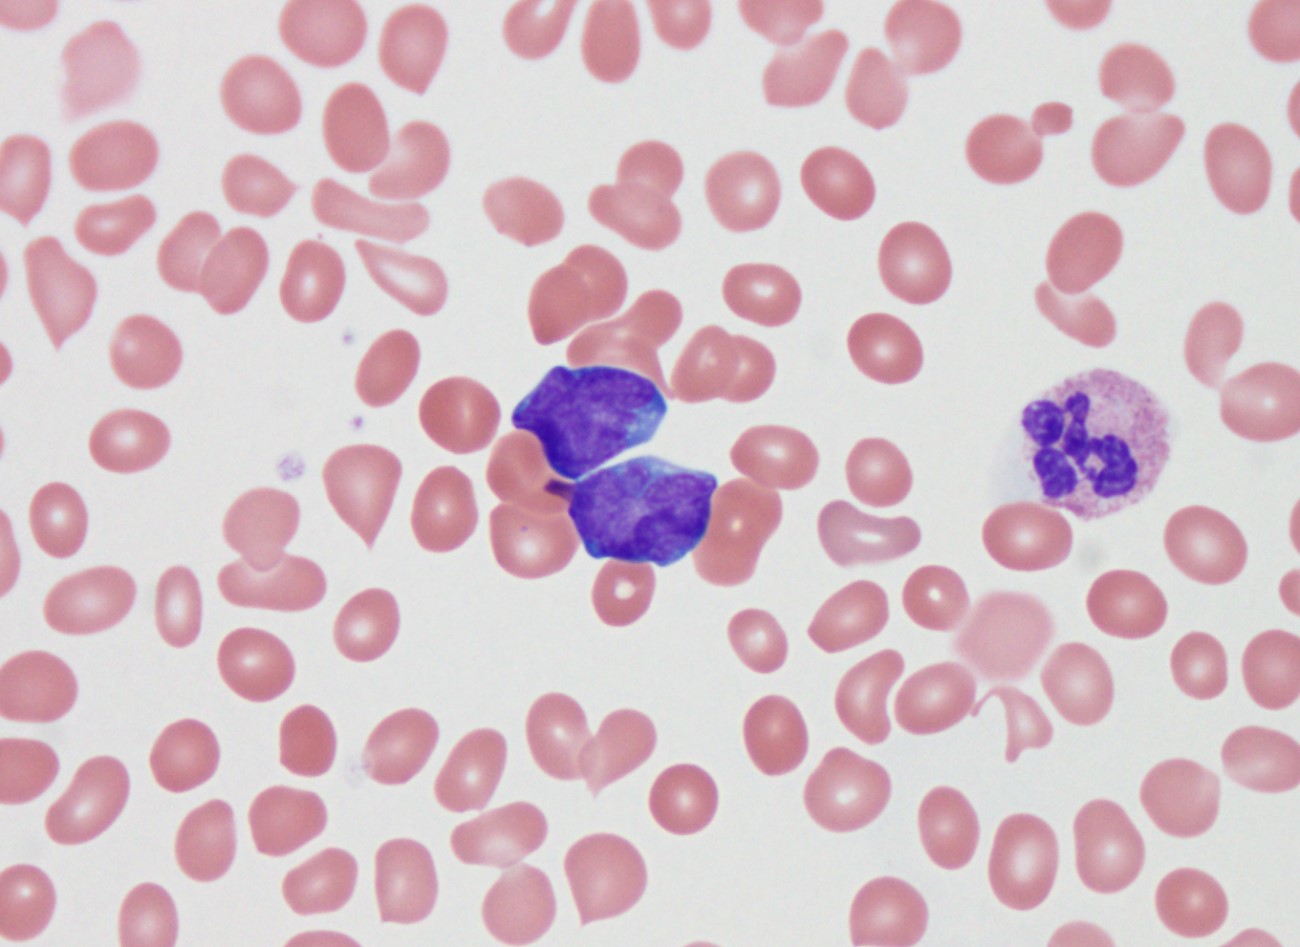
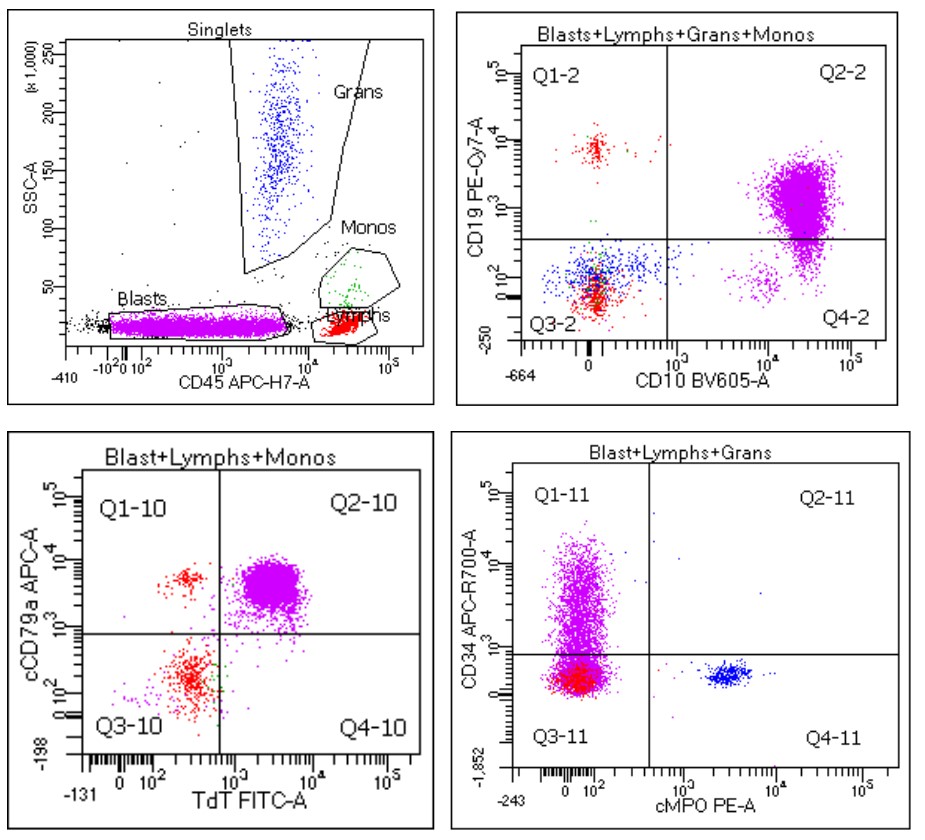
Contributed by Barina Aqil, M.D.

Increased blasts
Atypical mononuclear cells

Blast morphology
CD34+ blasts

TDT positivity
CD79a+ blasts
Contributed by Barina Aqil, M.D.
Circulating blasts
Contributed by Barina Aqil, M.D.
Blast phenotype
Contributed by Barina Aqil, M.D. and Madina Sukhanova, Ph.D.

Complex karyotype and derivative chromosome 21
Beck: 2021
Cherry: 2022
Dorfman: 2023
Hsi: 2017
Hudnall: 2019
Husain: 2021
IARC: 2017
Jaffe: 2016
Kantarjian: 2016
Lanzkowsky: 2016
Naeim: 2018
Wake: 2023
Wang: 2020
Find related Pathology books: oncology, hematopathology, pediatric, immunology / transplant, lab medicine
