
Laboratory administration & management of pathology practices
Quality management
Moving average quality control
Editorial Board Member: Lewis A. Hassell, M.D.
Editor-in-Chief: Patricia Tsang, M.D., M.B.A.


Last author update: 18 November 2024
Last staff update: 18 November 2024
Copyright: 2023-2025, PathologyOutlines.com, Inc.
PubMed Search: Moving average quality control

Table of Contents
Definition / general | Essential features | Terminology | Diagrams / tables | History | Principles | Implementation | Practical application | Limitations | Videos | Additional references | Practice question #1 | Practice answer #1 | Practice question #2 | Practice answer #2Cite this page: Napit A, Shashack M. Moving average quality control. PathologyOutlines.com website. https://www.pathologyoutlines.com/topic/managementlabaverageqc.html. Accessed September 10th, 2025.
Definition / general
- Moving average quality control (MA QC), first described as an average of normals (AoN)
- A type of patient based real time quality control (PBRTQC) that utilizes patient results in real time
- Averages patient test results and uses that average for the purpose of analytical quality control (Clinical Laboratory International: Consider Moving Average Quality Control When Internal Control is Insufficient or Inefficient – the Time is Now! [Accessed 17 September 2024])
Essential features
- Internal quality control functions to monitor the examination process and prevent the generation of inaccurate information about a patient's health status (Adv Lab Med 2022;3:243)
- Noncommutability of commercial controls led to the recommendation of patient based QC
- Components of MA QC are
- Inclusion criteria, exclusion criteria and truncation limit
- Calculation algorithm
- Control limits
- Moving average settings must be optimized, incorporated into the laboratory information system (LIS) and validated before implementation
Terminology
- Quality control (QC): the control of the testing process in the pathology lab to ensure that test results meet their quality requirements (Clin Chem Lab Med 2003;41:617)
- Internal quality control (IQC): procedures for continuously assessing laboratory work and emergent results to ensure day to day consistency of an analytical process and reliability of patient results (J Clin Pathol 2013;66:1027)
- Levey-Jennings chart: also known as a control chart or statistical process control chart; tracks data over time to analyze how a process changes over time
- Levey-Jennings charts feature a central line representing the average and an upper control limit and a lower control limit derived from historical data
- Comparing current data to these reference lines on the Levey-Jennings chart indicates if the process variation is in control or out of control (ASQ: Control Chart [Accessed 17 September 2024])
- Patient based real time quality control (PBRTQC): monitoring patient population parameters (such as the mean or median analyte value) or using single within patient changes (such as the delta check) and using them as data to detect analytical errors (Clin Chem 2019;65:962)
Diagrams / tables

History
- In the 1950s, Levey-Jennings control charts, a type of Shewhart chart, were utilized in monitoring process stability and variability of laboratory tests over time
- Levey-Jennings charts use the results of control samples, where results of those samples were plotted on the y axis along with mean, standard deviation (SD) and time on the x axis (Adv Lab Med 2022;3:243)
- Control samples are liquid QC (LQC) materials with assigned known values, measured at specific intervals during patient result production to evaluate the analytical accuracy of a given method
- LQC materials may either be lyophilized and reconstituted to a liquid state before analysis or obtained in a ready to use liquid form
- Control limits (acceptable limits) were typically set at plus or minus 2 SDs from the mean, encompassing ~95% of the data if the process is stable and in control
- Control sample results falling within these limits were considered in control, meaning they were within the expected range of variability, the system is functioning correctly and patient results can be reported
- Control sample results outside these limits (~5% of the time) were considered out of control, indicating a potential issue with the system and patient results might not be accurate
- In the 1980s, James Westgard introduced alternative control rules, with shorthand notations such as 13s, which signifies rejecting a process when a single control measurement exceeds the control limits set at the mean plus or minus 3 SD (6 sigma rule) (Westgard QC: Westgard Sigma Rules [Accessed 17 September 2024])
- A series of Westgard rules, example 13s / 22s / R4s / 41s / 10x, were then introduced by James Westgard (Westgard QC: Westgard Sigma Rules [Accessed 17 September 2024])
- Individual Westgard rules were chosen to keep the likelihood of false rejection low, while the combined effect of these rules increased the probability of detecting errors (4 sigma rule, 5 sigma rule) (Westgard QC: Westgard Sigma Rules [Accessed 17 September 2024])
- Multirule algorithms were incorporated into many automated analyzers, enabling laboratory professionals to choose the specific control rules to be applied
- In the 2000s, concerns emerged about the commutability of control materials due to the use of stabilizers and additives
- To overcome this limitation, control samples derived from human sources, frozen and stored at negative 80 °C and distributed in aliquots, were used without further processing
- Use of control samples derived from human specimens introduced challenges, such as producing enough material for daily internal quality control (IQC) and increased cost of maintaining storage at negative 80 °C (Adv Lab Med 2022;3:243)
- Moving average quality control (MA QC), a concept originally described in 1960 by Hoffmann and Waid, was initially implemented for assays without stable control material (Adv Lab Med 2022;3:243)
Principles
- Hoffmann and Waid initially introduced a method named average of normals in which the average of results that fall within or around the reference range are displayed on a control chart
- The average of normals concept led to the development of alternative methods and new algorithms for calculating average values, a deeper understanding of moving average (MA) error detection and its characteristics and guidelines for both determining optimal MA settings and for an MA approach that does not only rely on normals or mean calculations
- MA QC consists of 3 components (procedure settings)
- Inclusion criteria, exclusion criteria and truncation limit
- Aim to remove outliers, extremes and nonnormals for the calculation algorithm to reduce variation in the included assay results
- Truncation limits are the defined upper and lower limits of patient values used in the MA calculation
- Any relevant variables can be considered for inclusion criteria but this is often organized in MA management software
- Exclusion criteria include tests with too much interpersonal variation as well as specific patient populations with increased test variance due to patient acuity
- Calculation algorithm
- First step in developing the calculation algorithm is intended to select the particular average values: the mean, the median, the exponentially weighted moving average (EWMA) or Bull’s algorithm (XbarB)
- There is no guidance to specify which algorithm is the best
- Calculating the mean is appropriate for MA when assay results are normally distributed and exhibit low variability
- Median calculations are more effective for assays with nonnormally distributed results, particularly those with extreme values or outliers
- Both the mean and median are recalculated continuously as new results are generated
- EWMA calculates a new MA including previous measurements that are modified with a weighting factor
- EWMA weighting factor is between 0 and 1 and a smaller factor assigns less importance to the new results
- XbarB algorithm, also known as Bull's algorithm, was originally developed for batches of 20 measurements on a hematological analyzer to smooth the MA deviation, minimize the impact of outliers and make it suitable for non-Gaussian populations
- XbarB algorithm is calculated per batch, thus delays in detecting bias can occur, especially for lower volume assays
- Second step in developing the calculation algorithm is the selection of variables
- MA algorithm variables include the batch size for mean, median and XbarB methods, whereas a weighting factor between 0 and 1 is required for the EWMA method
- Larger batch sizes or lower weighting factor result in less variation in MA values and enable the detection of smaller systematic errors
- Too large of a batch size can lead to delayed identification of larger systematic errors, as it requires more assay results
- Control limits
- Option 1: when assigned MA upper and lower control limits around the mean are exceeded, this indicates out of control status for the assay
- Option 2: after applying the MA procedure to a training set from the laboratory, control limits are established
- MA established from a training set (option 2) are nonsymmetrical, non-SD based and are designed to eliminate false MA alarms using the most stringent control criteria (Clin Chem Lab Med 2019;57:773)
- Inclusion criteria, exclusion criteria and truncation limit
- Optimal MA setting must be established before its application; optimization can be done in the following ways
- Trial and error
- Graphical
- Power function analysis
- TEa detection probability
- ANPed (average number of patient samples affected until error detection)
- Bias detection curves and MA validation charts
- See Diagrams / tables
Implementation
- Optimal MA settings are implemented in software packages available in laboratories that support the MA application
- Features that are desirable in the laboratory software to perform MA QC are
- MA inclusion and exclusion criteria selection
- Support the selected calculation algorithm
- Support of SD based on accuracy or MA reference range based control levels
- Performs MA calculation for every new set of assay results
- MA displayed as Levey-Jennings or accuracy plots
- Real time notification of MA alarm (push set up)
- Simple reset of MA after MA alarm by end user
- Most hemocytometer analyzers include basic MA packages that support at least the XbarB calculation algorithm
- Various middleware systems, such as Remisol Advance (Beckman Coulter), Instrument Manager (Data Innovations), Roche Middleware Solutions (Roche Diagnostics), Atellica Data Management System (Siemens Healthcare Diagnostics), AlinIQ (Abbott Diagnostics) and LIS like GLIMS, support the MA application
- Some software packages include only a single calculation algorithm, such as mean or XbarB calculations, while others support a broader range of algorithms
- These software packages are utilized for MA QC (i.e., real time MA calculations, graphical representation of MA and alarming in the case of error detection that supports statistical QC and long term assurance of the laboratory test being performed) (Clin Chem Lab Med 2019;57:773)
Practical application
- In a study where 6 parameters (calcium, bicarbonate, FT4, MCV, MCHC and reticulocytes count) were assessed using the MA generator application (Huvaros, versions used between 2019 and 2021) in General Laboratory Information Management System, version 9.5.18 or 9.5.25, LIS and a graphical comparison of bias detection curve were performed
- Result was enhanced patient safety by a continuous system control service, complementing periodic IQC monitoring, prevention of the release of erroneous results to the clinic and faster detection when analytical errors occur
- Proved to be a valuable tool for interanalyzer comparisons and trend monitoring, contributing to improved long term test stability (Clin Chem Lab Med 2022;60:1719)
- MA QC can be integrated into risk based traditional QC plans in small volume medical laboratories, where MA can detect critical size bias
- MA can provide additional security between 2 QC plans without waiting for the interval provided by a traditional QC plan, thus confirming the existence of an error requiring corrective action (Biochem Med (Zagreb) 2022;32:020711)
- Average of deltas (AoD), formed by the combination of delta check (used to detect systematic error) and MA, enhances error detection with relatively few paired patient samples (Clin Chem 2021;67:1019)
- After optimization and validation, MA QC can be successfully implemented in the LIS and can be used for continuous QC (Biochem Med (Zagreb) 2022;32:010705)
Limitations
- Though MA QC is emerging as a promising QC tool, its broad acceptance is hindered by
- Complexity of determining optimal MA settings
- Dearth of evidence based guidelines for its application, especially for low volume tests
- MA QC is gaining acceptance as a supplement to conventional QC, enhancing error detection rather than replacing the use of QC samples (Biochem Med (Zagreb) 2022;32:010705)
Videos
Moving average and individual charts
Moving average forecasting (part 1)
Dr. Harper’s classroom
Additional references
Practice question #1
Which of the following is a benefit of patient moving averages (MA) over traditional internal quality control (QC)?
- Only laboratories with high specimen volume can utilize patient moving averages
- Patient moving averages can improve patient safety by serving as a continuous system monitor
- Patient moving averages eliminate the need for internal quality controls
- Unlike traditional internal quality controls, patient moving averages do not require inclusion and exclusion criteria
Practice answer #1
B. Patient moving averages can improve patient safety by serving as a continuous system monitor that potentially enables faster detection of analytical errors. Answer C is incorrect because internal quality controls are a regulatory requirement and MA is a supplement (not replacement) of internal QC. Answer D is incorrect because MA selection criteria include removing outliers, extremes and nonnormals as well as the use of truncation limits to define upper and lower limits of patient values used in the moving average calculation. Answer A is incorrect because both large and small volume laboratories can utilize MA.
Comment Here
Reference: Moving average quality control
Comment Here
Reference: Moving average quality control
Practice question #2
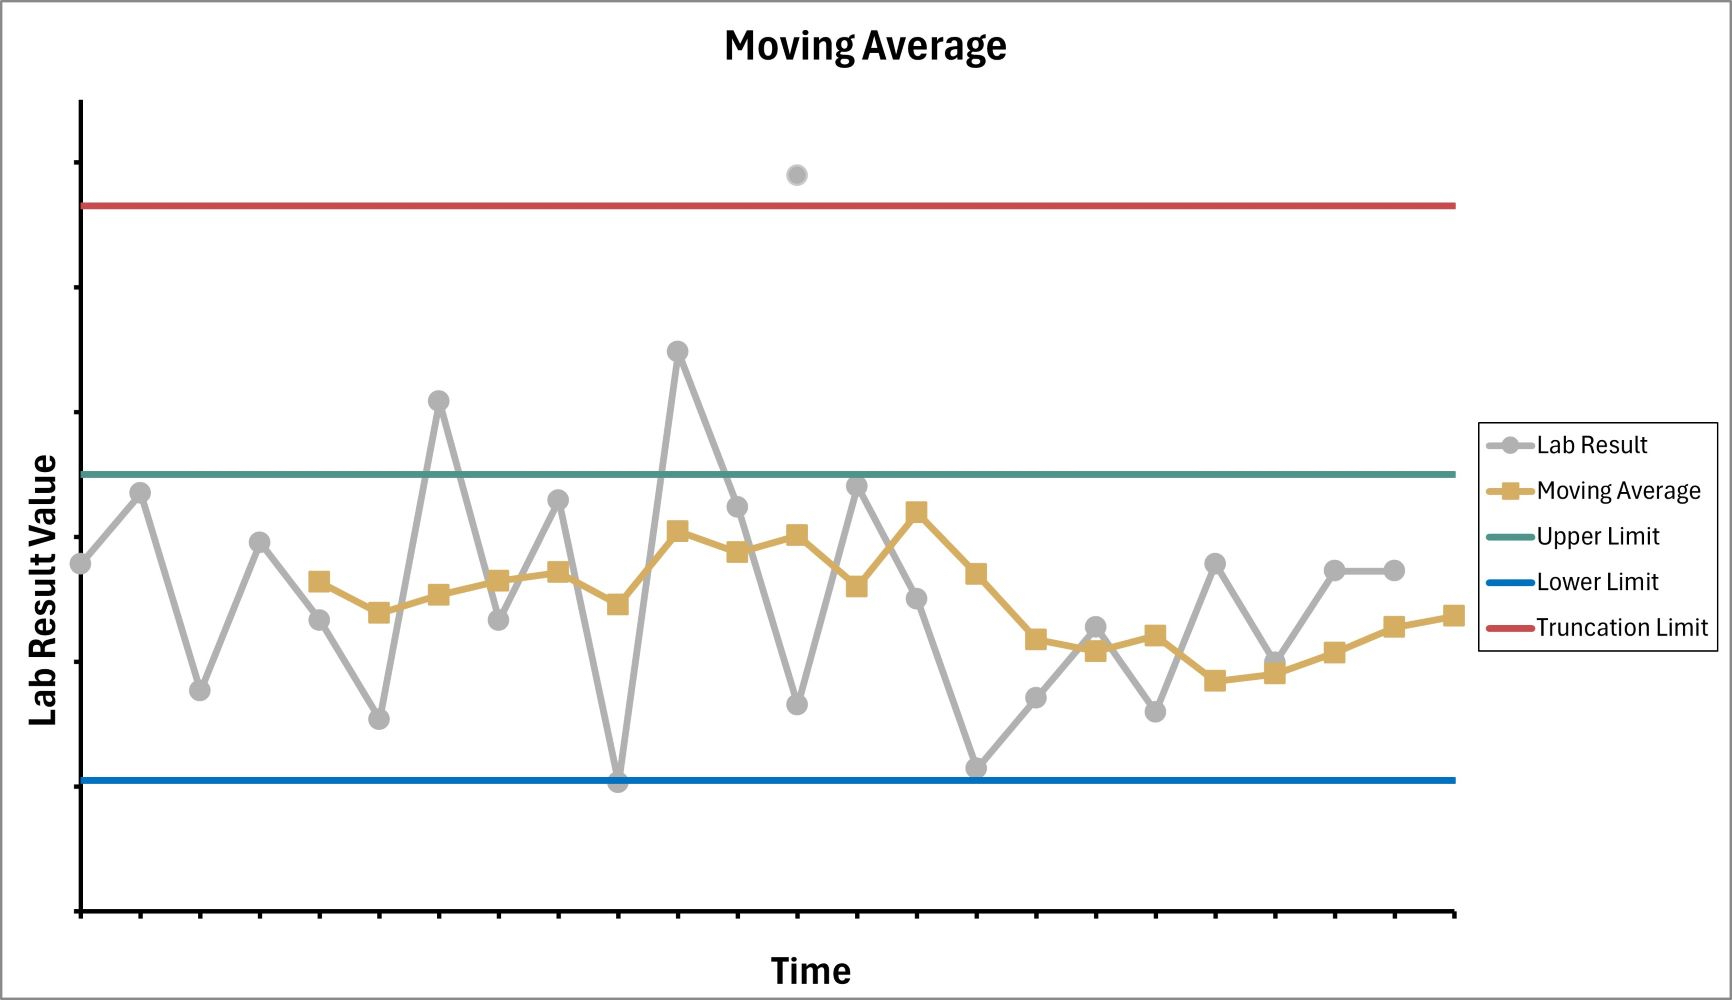
Using the figure shown above, what is the impact of removing the truncation limit?
- Moving average alert frequency decreases because all results are included in the moving average calculation
- Moving average alert frequency increases because all patient data is included in the moving average calculation
- Moving average alert frequency is unchanged
- Moving average becomes more accurate because no patient results are removed
Practice answer #2
B. Moving average alert frequency increases when there is no truncation limit and all patient data, including extreme outliers, are included in the moving average calculation. Answer A is incorrect because removing the truncation limit will include extreme patient results in the MA calculation. This will skew the MA calculations and an increase in alerts. Answer D is incorrect because including extreme patient results can skew the calculated MA and lead to an increase in alerts. Answer C is incorrect because removing the truncation limit will allow all patient results to be included in the MA calculation, which results in a change of the alert frequency.
Comment Here
Reference: Moving average quality control
Comment Here
Reference: Moving average quality control