
Laboratory Administration & Management of Pathology Practices
Quality management
Validating a new quantitative assay
Author: Felix Leung, Ph.D.
Editorial Board Member: Lewis A. Hassell, M.D.
Deputy Editor-in-Chief: Patricia Tsang, M.D., M.B.A.

Last author update: 24 February 2023
Last staff update: 24 February 2023
Copyright: 2022-2024, PathologyOutlines.com, Inc.
PubMed Search: Validating a new assay
Table of Contents
Definition / general | Essential features | Terminology | Overview | Precision | Bias and accuracy | Linearity | Reference interval | Other studies | Analytical validation tools | Board review style question #1 | Board review style answer #1 | Board review style question #2 | Board review style answer #2Cite this page: Leung F. Validating a new quantitative assay. PathologyOutlines.com website. https://www.pathologyoutlines.com/topic/managementlabvalidatingnewassay.html. Accessed April 26th, 2024.
Definition / general
- Proper analytical validation of a new assay is essential prior to patient testing
- Using Clinical Laboratory Standards Institute (CLSI) guidelines as a framework for designing new assay validations is highly recommended
Essential features
- Minimum requirements for analytical validation of a quantitative assay include studies for precision, bias, accuracy, linearity and reference interval
- Required validation studies each have an associated CLSI standard which outlines how to design, carry out and evaluate the specific analytical aspect (CLSI: Method Evaluation Standards [Accessed 1 December 2022])
- Statistical software, such as EP Evaluator and Analyse-it, are useful for analyzing the validation data
Terminology
- Total allowable error (TAE): the amount of error that is allowable without invalidating the interpretation of a test result
- Precision: closeness of agreement between values obtained by replicate measurements
- Bias: estimate of a systematic measurement error
- Linearity: ability to provide results that are directly proportional to the concentration / amount of analyte in the test sample within a given range
Overview
- Precision, bias, accuracy, linearity and reference interval studies are typically the minimum requirements
- Establish performance limits for validation studies a priori using appropriate total allowable error goals
- Laboratory medicine associations have defined total allowable error goals for clinical assays: EFLM Biological Variation, CLIA, CAP, RCPA, IQMH
- Factors to consider for each validation study:
- Sample: what type of samples to use?
- Target values: what concentrations are relevant?
- N (number): how many samples / replicates are needed?
- Limits: what are the performance limits?
Precision
- Precision studies establish variance within replicate measurements and the likelihood / magnitude of random errors
- Refer to CLSI EP05-A3 for designing precision studies:
- Sample: quality control (QC) material, optimally from a third party vendor
- Target values: at least 2 levels of QC near medical decision limit(s)
- N: 20 x 2 x 2 format consisting of 2 runs of duplicate measurements daily for 20 days for each level of QC
- Limits: total observed variance should not typically exceed 33% of the total allowable error
- For the 20 x 2 x 2 format, CLSI recommends calculating the coefficient of variation (%CV) via 2 way nested analysis of variance (ANOVA) (see Analytical validation tools below)
- Reference: CLSI: EP05-A3 - Evaluation of Precision of Quantitative Measurement Procedures [Accessed 1 December 2022]
Bias and accuracy
- Bias studies establish agreement to a predicate assay and the magnitude of systematic error
- Refer to CLSI EP09-A3 for designing bias studies:
- Sample: patient samples with known values as reference standard for comparison
- Target values: preferably an even distribution across the analytical measuring range (AMR)
- N: minimum of 40 patient sample singleton measurements, preferably tested over several days
- Limits: mean bias (absolute or relative) should not typically exceed half of the total allowable error
- Additional analyses to perform for bias studies:
- Regression analyses are typically performed to assess absolute or proportional bias in the form of a regression line
- Passing-Bablock or Deming are the recommended regression methods (see Analytical validation tools below)
- Differences (absolute or relative) are typically plotted on Bland-Altman plots to assess bias trends across the analytical measuring range
- Consider inclusion of higher metrological order samples such as proficiency testing materials or certified reference material to establish bias against a reference method
- Regression analyses are typically performed to assess absolute or proportional bias in the form of a regression line
- Reference: CLSI: EP09-A3 - Measurement Procedure Comparison and Bias Estimation Using Patient Samples [Accessed 1 December 2022]
Linearity
- Linearity studies verify vendor quoted analytical measuring range and reportable limits to be implemented with the assay
- Refer to CLSI EP06 for designing linearity studies:
- Sample: patient derived sample pools preferable (see below for preparation steps)
- Target values: preferably equally spaced concentrations across the analytical measuring range bounded by sample pools at or near the low and high limits
- N: minimum of 5 sample pools, each tested in duplicate
- Limits: various schema are used to evaluate linearity, though CLSI recommends bias limits be used for linearity
- Linearity samples are ideally matrix matched, patient derived sample pools
- Typical preparation involves serial dilutions of a high sample pool with a low sample pool
- If patient derived sample pools are not attainable, consider alternatives:
- Vendor provided material (linearity, calibrator, quality control, etc.)
- High sample pool diluted with vendor diluent
- Reference: CLSI: EP06 - Evaluation of Linearity of Quantitative Measurement Procedures [Accessed 1 December 2022]
Reference interval
- Reference interval (RI) studies verify vendor quoted reference intervals, which represent the normal range for the assay
- Refer to CLSI EP28 for designing reference interval studies:
- Sample: samples from apparently healthy volunteers
- Target values: not applicable
- N: minimum of 20 samples per appropriate stratification (i.e., an assay with reference intervals for males and females would require 40 samples)
- Limits: ≥ 95% of samples fall within vendor quoted reference interval(s)
- Reference: CLSI: EP28 - Defining, Establishing, and Verifying Reference Intervals in the Clinical Laboratory [Accessed 1 December 2022]
Other studies
- Additional studies (stability, interferences, carryover, limit of quantification / detection, dilutional recovery) should be considered if appropriate for the assay in question
- Stability studies to establish the viability of samples for testing across time and storage conditions (i.e., temperature) after collection, as well as any specific sample processing or transportation needs for labile analytes
- Consider adopting CLSI based continuous study design (Clin Chem Lab Med 2020;58:188)
- Interference studies to evaluate interfering substances that can cause a clinically significant difference in assay results; assays on automated analyzers are typically evaluated for interference effects from hemolysis, icterus and lipemia (CLSI: EP07 - Interference Testing in Clinical Chemistry [Accessed 1 December 2022])
- Carryover studies to ensure that instrumentation prevents samples being analyzed from contaminating subsequent samples; especially relevant for assays with a wide expected range of values (i.e., beta hCG, serum free light chains) (CLSI: EP10A3AMD - Preliminary Evaluation of Quantitative Clinical Laboratory Measurement Procedures [Accessed 1 December 2022])
- Limit of quantification / detection (analytical sensitivity) studies to establish assay performance at the lower limit of the analytical measuring range; especially relevant for assays with laboratory or clinical requirements near the lower limit of measurement (i.e., thyroglobulin, high sensitivity cardiac troponins) (CLSI: EP17 - Evaluation of Detection Capability for Clinical Laboratory Measurement Procedures [Accessed 1 December 2022])
- Dilutional recovery studies to establish appropriate dilution protocol (i.e., dilution factor, diluent) for high concentration samples beyond the upper limit of the analytical measuring range for undiluted sample analysis (CLSI: EP34 - Establishing and Verifying an Extended Measuring Interval Through Specimen Dilution and Spiking [Accessed 1 December 2022])
Analytical validation tools
- Statistical programs / software are useful tools to aid the analyses and calculations required for analytical validation studies based on CLSI standards
- EP Evaluator (Data Innovations LLC) is a standalone software
- Analyse-it (Analyse-it Software, Ltd.) is an Excel add on software
Board review style question #1
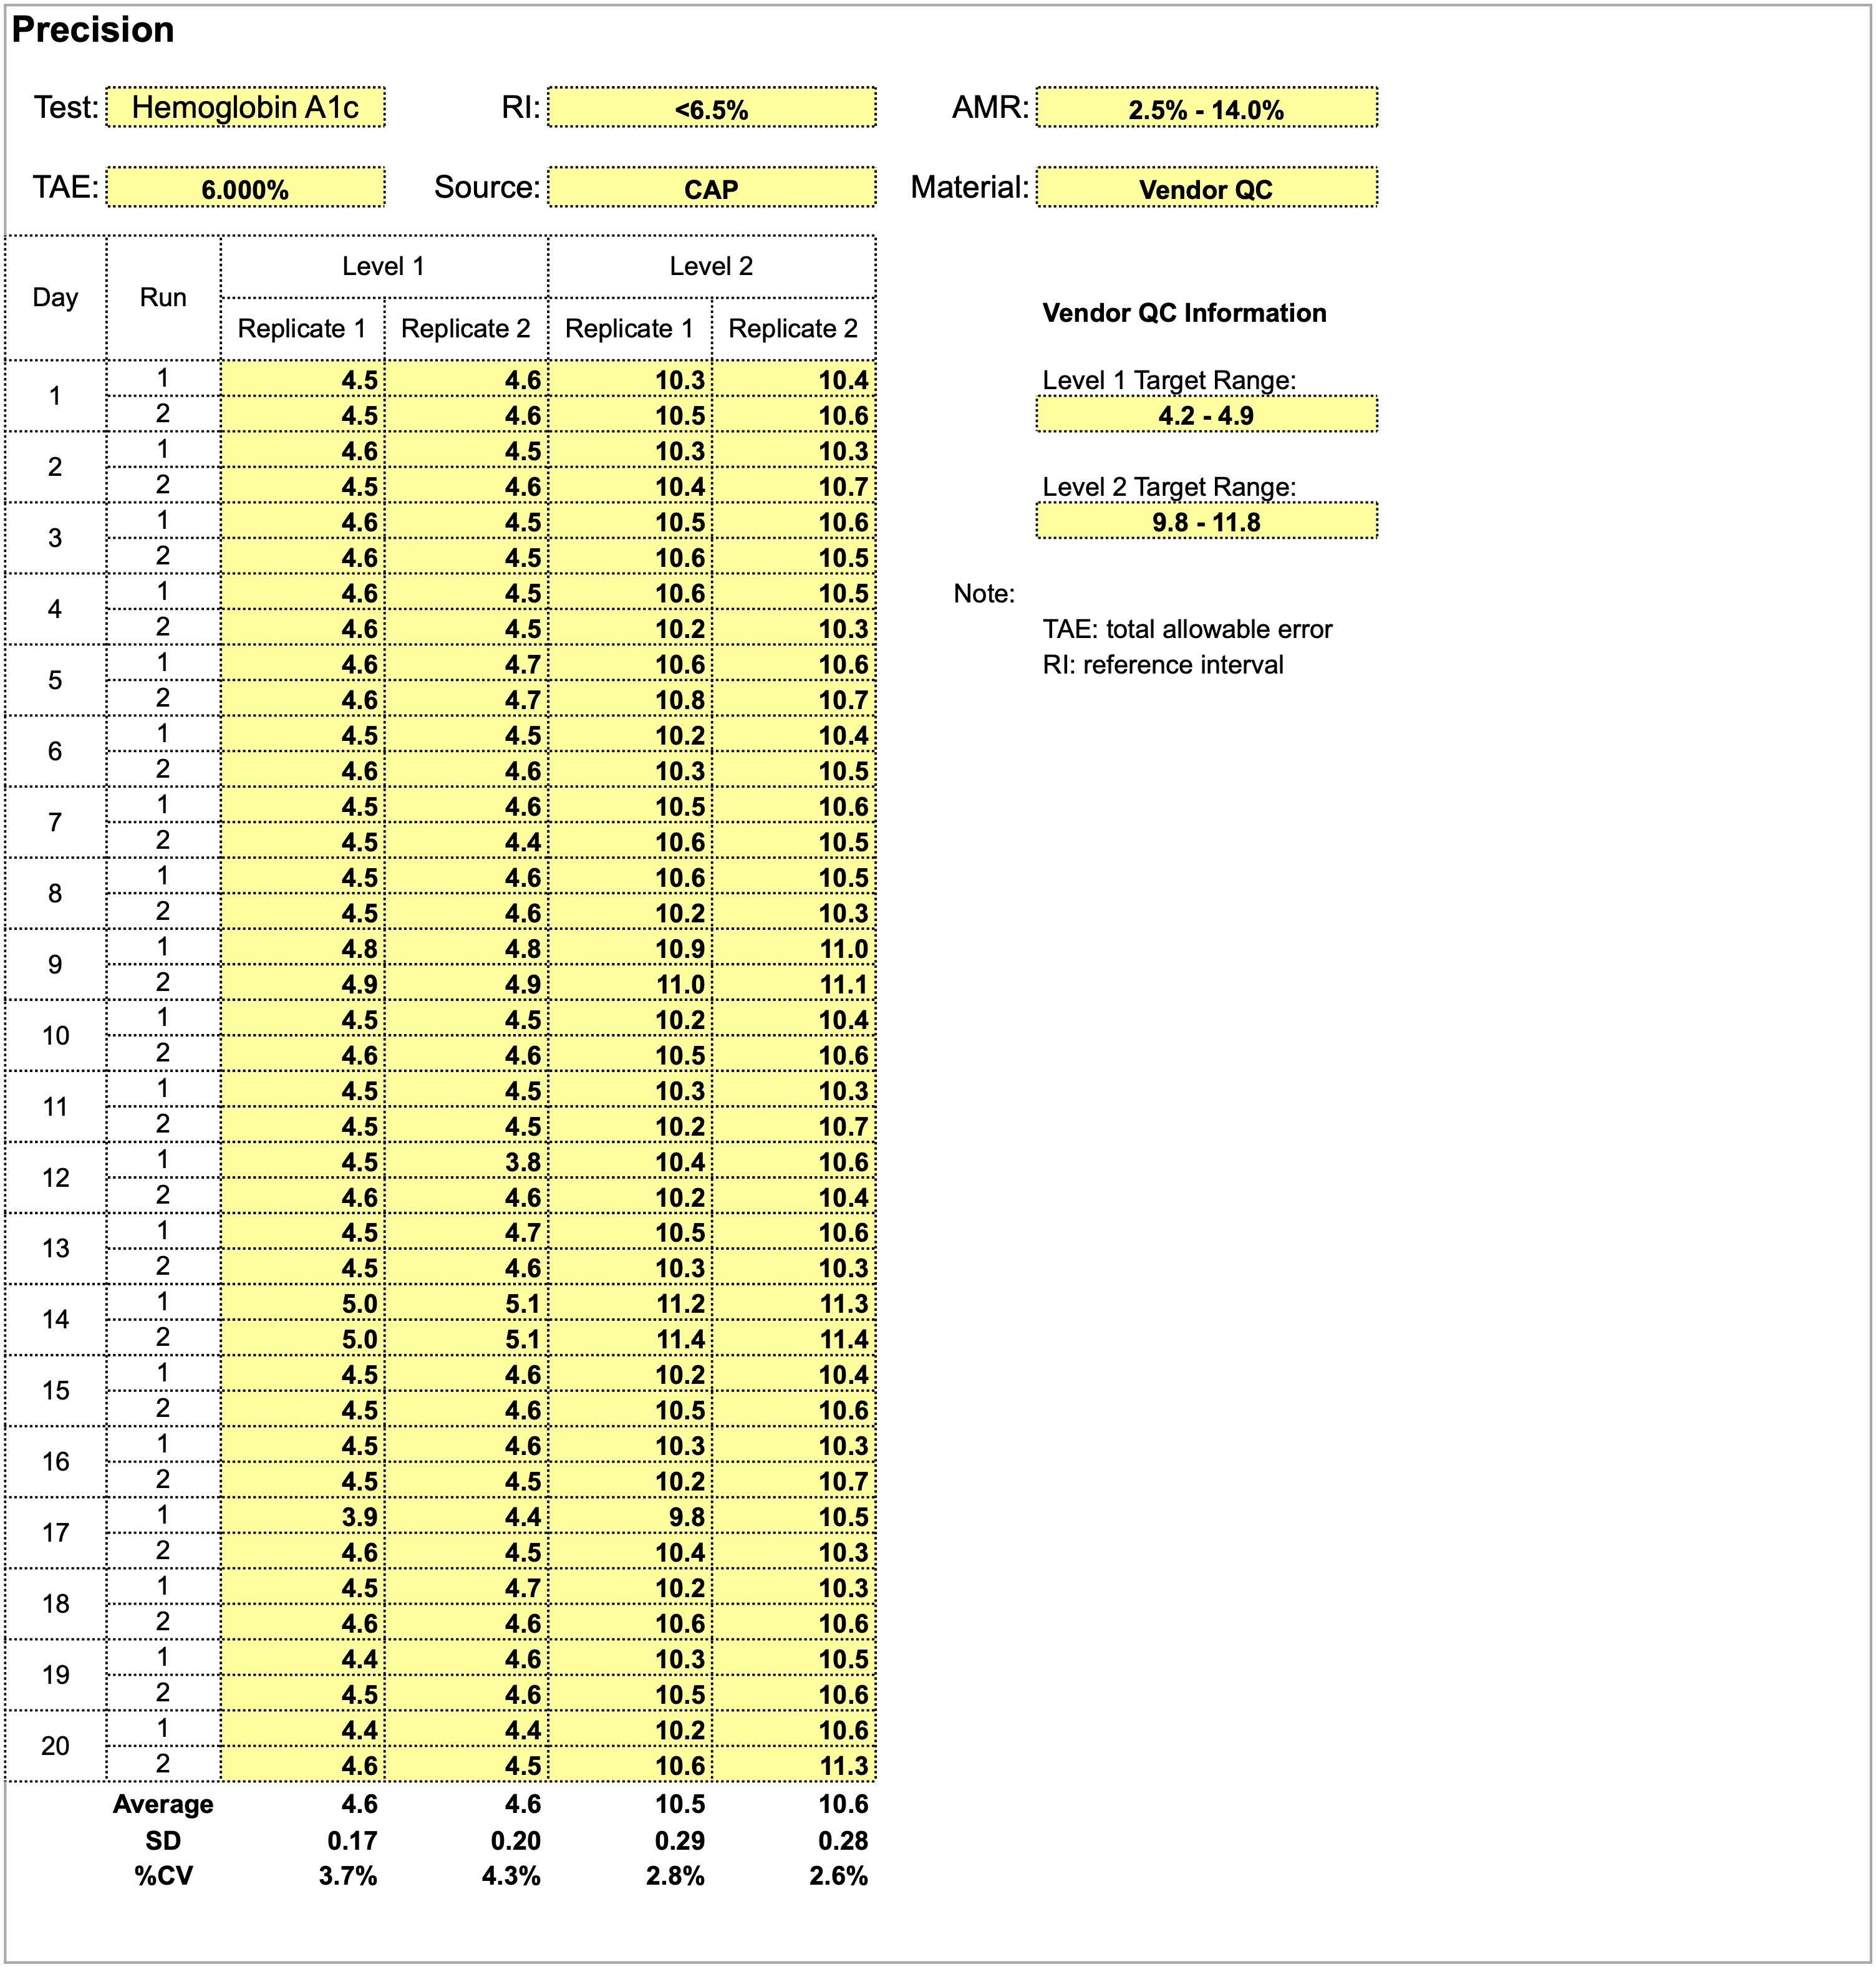
Using the provided dataset for precision studies for a hemoglobin A1c assay, which of the following statements is true?
- A positive shift in both levels is observed on day 14
- Level 1 quality control shows more consistency and stable performance compared to level 2
- Quality control material is inappropriate for precision studies
- The total allowable error of 6% is too stringent and should be widened
Board review style answer #1
A. A positive shift in both levels is observed on day 14. Overall, precision studies show adequate performance for both levels of quality control material in the 20 x 2 x 2 format and are acceptable. Level 2 quality control shows a smaller CV and more consistency than level 1. A total allowable error of 6% is too wide as a precision goal for hemoglobin a1c, which has relatively small absolute values.
Comment Here
Reference: Validating a new quantitative assay
Comment Here
Reference: Validating a new quantitative assay
Board review style question #2

Using the provided dataset for method comparison studies for a hemoglobin A1c assay, which of the following statements is true?
- The data shows acceptable linearity
- The result suggests analytical errors due to carryover
- There is an increasing negative bias of the new method with increasing HbA1c concentrations
- There is an insufficient number of data points for the analysis to be conclusive
Board review style answer #2
C. While the average bias of -1.5% is within the total allowable error, it is clear that there is an increasing negative bias of the new method with increasing HbA1c concentrations (current method is negatively biased against new method). The bias hovers around 6% starting around 6.0% A1c units and greater, which encompasses the medical decision limit of 6.5% A1c units. This bias renders the method comparison result not acceptable for patient testing.
Comment Here
Reference: Validating a new quantitative assay
Comment Here
Reference: Validating a new quantitative assay
Back to top
