

- A laboratory information system (LIS) is a computer software that processes, stores and manages data from all stages of medical processes and tests in the following ways:
- Coordinates inpatient and outpatient medical testing
- Contains features that manage patient check in, order entry specimen processing, result entry and patient demographics

APLIS workflow
- Tracks and stores clinical details about a patient during laboratory visit

LIS assisted transactions
- Keeps all patient information stored in a database for future reference
- Electronic submission of lab test results to public health agencies and the incorporation of clinical lab test results into a certified electronic health record (EHR) system (see Videos) (TechTarget Network: Laboratory Information System [Accessed 10 February 2023])
- Laboratory information system (LIS) is remarkably like laboratory information management system (LIMS) except that the later, in addition to healthcare, is also deployed in multiple nonmedical settings (TechTarget Network: Laboratory Information System [Accessed 10 February 2023])
- Anatomic pathology laboratory information systems (APLIS) are also typically networked to other external information systems, such as hospital information systems (HIS)
- The HIS makes use of the admission discharge transfer (ADT) interface
- Anatomic pathology (AP) is the subspecialty of pathology that:
- Deals with the examination and microscopic study of organs and tissues removed for biopsy or during postmortem examination
- Interprets the results of the studies above
- Involves the use of the naked eye for examination (gross pathology and by autopsy)
- Involves the use of microscopy (histopathology)
- Involves the use of electron microscopy (ultrastructural pathology) and other methods (The Free Dictionary by Farlex: Anatomic Pathology [Accessed 10 February 2023])

- LIS integration into pathology laboratory activities comes with the following features (Trust Radius: Laboratory Information Management Systems [Accessed 10 February 2023]):
- Enhances efficiency in the laboratory by reducing manual procedures
- Allows for the storage of comprehensive patient profile for extended periods
- Generates easy and accurate billing of patient's charges
- Makes use of barcode generation, printing and reading for the efficient identification of tubes, samples, documents, slides, etc.
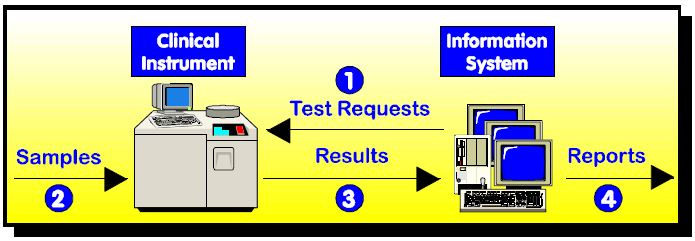
- Makes use of a built in bidirectional interface that allows for efficient interactions between the information system and the clinical instrument required (see Videos)

LIS based bidirectional interface
- Vannevar Bush was the first to recommend the use of memex (memory extender) for the management of medical data (History of Information: In "As We May Think" Vannevar Bush Envisions Mechanized Information Retrieval and the Concept of Hypertext [Accessed 10 February 2023])
- Douglas and Engelbart invented technologies that provided the basis for LIS and electronic medical record (EMR) (Adv Anat Pathol 2012;19:81)
- One of the first rudimentary laboratory information systems was built by Bolt Beranek Newman company in conjunction with the Massachusetts General Hospital
- Included time sharing and multiuser techniques (Blum: A History of Medical Informatics, 1st Edition, 1990)
- Massachusetts General Hospital utility multiprogramming system (MUMPS) was one of the first successful hierarchical database management systems (DBMS) in computing history (Comput Biomed Res 1969;2:469)
- User friendly relational database management systems (RDBMS) and structured query language (SQL) initially provided a standardized manner of manipulating clinical data in a coherent manner (Sinard: Practical Pathology Informatics, 1st Edition, 2005)
- In the modern era, the following have significantly impacted the practice of AP:
- World wide web
- Database centric rich internet applications (RIA)
- Advent of whole slide imaging (WSI)
- Emerging trends in cloud computing (Adv Anat Pathol 2012;19:81)
- Components of APLIS are detailed below and are summarized in Table 1 below (see Diagrams / tables)
- Hardware: this refers to any physical device that interfaces electronically with the APLIS application, including (Adv Anat Pathol 2012;19:81):
- Server computer
- Client computer
- Input / output devices of the computer
- Keyboards, mice, monitor, etc.
- Document scanners
- Digital cameras
- Printers (papers, labels, tissue cassettes)
- Network hardware
- Cables
- Routers
- Barcode scanners
- Gross pathology examination stations
- H&E autostainers
- Whole slide imaging scanners: this requires a large amount of storage data and bandwidth (Adv Anat Pathol 2012;19:81)

APLIS hardware components
- Operating systems (OS)
- OS are the point of human computer interface (Adv Anat Pathol 2012;19:81)
- There are 2 categories:
- Frontend operating system involving interactions with a human being
- Backend operating system, which includes the following:
- Databasing
- Web serving
- Storage
- Networking
- Other automated processes not requiring human intervention
- Most modern OS combine both categories but are optimized toward one end or the other
- Examples of OS include:
- Microsoft
- Windows
- Mac OS X
- Linux
- APLIS software
- Software used in APLIS comes as drivers that provide an interface between an operating system and a peripheral device (Adv Anat Pathol 2012;19:81)
- These drivers are extremely operating system specific
- Third party software known as middleware can be integrated into LIS, enabling the performance of the following functions:
- Lab operation improvements; examples include:
- LIS operations support (Microsoft Word and Excel, Crystal Reports)
- Data transmission (Forward Advantage, LabDE)
- Storage solutions (HP StorageWorks EVA8000)
- Virtual applications support
- Legacy apps
- Web based cloud management (VMWare, Citrix)
- Workflow improvements; examples include:
- Instrument middleware
- Tracking solutions
- Remote system monitoring (Realtime)
- Digital image management (Apollo PathPACS)
- Quality improvement; examples include:
- Quality assurance programs for platforms like Altosoft Insight, IBM Cognos
- Service improvements; examples include:
- Patient and client services (web portals)
- Outreach connectivity tools (e.g., Lifepoint, Atlas, CareEvolve, etc.)
- Revenue improvements (e.g., interfaced billing management tools)
- Lab operation improvements; examples include:
- Database management systems
- A database is a collection of data in digital form, organized to model information of interest (Adv Anat Pathol 2012;19:81)
- Examples include:
- Spreadsheet containing patient data
- Spreadsheet containing information on all surgical pathology slides signed out in a laboratory in a month
- Database management system (DBMS) refers to the software used to manage a database and its data structures
- DBMS allows users to create, update, delete and retrieve the data or the records stored (EDCUBA: What is DBMS? [Accessed 10 February 2023])
- Thus, DBMS users can manipulate data to fit their individual requirements
- In fact, DBMS is considered the heart of APLIS
- An example is a Microsoft Excel application that can be used to manage information on the spreadsheets above
- DBMS can be classified into 4 models detailed below:
- Flat model makes use of single 2 dimensional tables stored in individual files (e.g., Microsoft Excel spreadsheet, tab separated values [TSV] or comma separated values [CSV])
- Hierarchical model uses a tree-like model in which the parent nodes have multiple branches (children's nodes) but each child node has only 1 parent (e.g., MUMPS, eXtensible Markup Language [XML]) (J Am Med Inform Assoc 2002;9:307)
- Relational model is the dominant model at present and uses 2 dimensional tables linked to each other by way of special key values (e.g., Microsoft SQL server, oracle database) (EDCUBA: Data Models in DBMS [Accessed 10 February 2023])
- Dimensional model is a specialized form of relational model that uses 3 dimensional instead of 2 dimensional tables (e.g., Altosoft Insight, IBM Cognos)
- Document / procedure management systems (DMS)
- DMS can be employed by an AP laboratory to track, share and store relevant documents (Smartsheet: Guide to Document Management Systems [Accessed 10 February 2023])
- DMS can also be possibly integrated into the laboratory's workflow process or project management process as part of the APLIS
- Features of a good DMS include the following:
- Intuitive surface requiring minimal training
- Straightforward file structure that is easy to access
- Ability to accommodate AP naming procedure / conventions
- Accessible across different platforms and locations
- Collaborative work on same documents by multiple employees at the same time
- Easy to integrate with the APLIS software
- Compliance configurations compatible with laboratory policies
- Enough current and scalable storage space
- In solution chat and email notifications
- Security against cyber threats
- Archiving abilities to enable prolonged storage of documents
- Customer support
- Examples of free DMS
- Google Drive
- OpenKM
- Dropbox basic
- Mayan EDMS
- Machine installed
- Examples of paid DMS solutions
- Microsoft OneDrive
- Microsoft OneNote
- OpenKM Professional
- Ascensio System OnlyOffice
- DocuWare Cloud
- Dropbox
- Box for business
- SAP DMS
- Smartsheet
- APLIS application
- APLIS application is the layer of APLIS that the end user (e.g., pathologist, technologist) directly interacts with (Adv Anat Pathol 2012;19:81)
- Regarded as the face of APLIS
- The user's experience is directly impacted by the user interface design
- Modern APLIS can present a different user interface for the following purposes:
- Specimen accessioning
- Histology (including stain / recut order entry)
- Transcription
- Billing
- Sign out
- APLIS application layer can be presented to end users in the following ways:
- Installable desktop applications
- Simplest and most common mode of APLIS presentation
- Virtualized application
- Resides on the server but is presented to the end user like desktop applications
- More complex than simple downloadable desktop applications
- Advantages include the following:
- Client operating system agnostic
- Protects data from third parties
- Data storage methods are more secure than traditional desktop or cloud computing methods
- RIA / web portal
- Makes use of a set of webpages that are viewable to any modern browser
- New method in APLIS application layer
- Precludes the need for additional software installations especially when the end user lacks work machine administrative privileges
- A major disadvantage, however, is that it is exposed to the internet with consequent security and data ownership issues
- Text based terminal
- Primarily of historical interest with minor modern applications in clinical pathology (CP)
- Installable desktop applications
Table 1: APLIS components (Adv Anat Pathol 2012;19:81)
| Layer | Description | Examples |
| APLIS application | The software interface to the end user; usually programmed for a specific operating system and almost always programmed for a specific DBMS; has user interfaces for data entry and manipulation | Cerner, CoPath, Cerner, PathNet, Orchard, Harvest, LIS, SSC SoftPath |
| Database management systems | A specialized software package for the persistent storage and manipulation of data; currently the vast majority of these use the relational model and implement an SQL interface; in the LIS, high performance is not as important as high reliability, requiring certain tradeoffs to be made | Microsoft SQL Server, mySQL, PostgreSQL, Oracle Database, MUMPS |
| Operating system | The fundamental control program through which the end user interacts with a computer; there are different operating systems that are suitable for different niches (e.g., it is far more common for Linux to be the operating system of choice for a server than for a personal computer) | Microsoft, Windows, Mac OS X, Linux |
| Hardware | Any physical device that either hosts or interfaces with the APLIS; requires both a hardware and a software interface for the operating system (and APLIS) to function | Server computer, client computer, barcode scanner, label printer, slide printer, H&E autostainer |
- This refers to the combined hardware and software setup of devices within the laboratory network
- APLIS architecture can come in the following architecture setups:
- Hub and spoke mainframe architecture
- This method involves the central processing and storage of data at a mainframe computer with the display of information on peripheral terminals that lack processing capabilities; network is centered on a central mainframe computer that is cheaper and easier to secure and maintain
- A major disadvantage is that a security breach or technical fault in the mainframe computer may negatively affect the whole network (Am J Clin Pathol 1996;105:S25)
- Client server architecture
- At present, it is the dominant architecture used
- End users interact with smart computers that run the APLIS application layer as standalone programs
- These programs interface over the network with the servers on which the DBMS resides
- Advantages of this architecture include the following:
- Uses the computational powers of modern day desktop computers
- Centralized data management and manipulation
- Can operate temporarily when the servers go down
- Disadvantages are as follows:
- Increased complexity of design
- Heftier network resources are needed
- High overhead maintenance cost
- Excessive cost of security maintenance across different systems (Adv Anat Pathol 2012;19:81)
APLIS hardware components
- Thin client architecture
- Variant of the client server architecture
- Makes use of hardware virtualized technology such as advanced microdynamics (AMDs), advanced microdynamics virtualization (AMD-v), Intel's virtualization technology (Intel VT-x) and Intel's virtualization technology for directed I / O (VT-d) (Sharma: Virtualiziation - A Review and Future Directions [Accessed 10 February 2023])
- Web based (cloud) LIS architecture
- Enables a laboratory to use web delivery portals provided by LIS vendors
- Has the advantage of lower installation and maintenance costs
- A major disadvantage is security and customization problems due to data storage on off site servers (Adv Anat Pathol 2012;19:81)
- Hub and spoke mainframe architecture
- Reduces laboratory requests, turnaround time and errors associated with the transcribing process (TechTarget Network: Laboratory Information System [Accessed 10 February 2023])
- Ensures accuracy of a patient's sample identification
- Ensures accuracy of result processing
- Ensures long storage of patient information
- Lessens the generation of waste (see Videos)
- The functionality of an APLIS in an AP laboratory can be divided into the following 3 phases:
- Preanalytical phase
- APLIS data entry is still largely manual and dependent on paper for the following reasons:
- APLIS lacks specific dictionary driven texts
- AP orders require more information compared with CP orders
- A single AP order may encompass several parts from several organs
- AP specimen collection is inherently driven and may sometimes lead to accession numbers with no specimen
- The first interaction of APLIS with a specimen is usually at the time of its receipt at the AP laboratory
- Specimen is normally followed with a printed requisition
- Human labor is required to accession the cases on reception
- After accessioning the specimens, APLIS is used to assign them unique accession numbers
- Related information from the requisition is entered into the APLIS
- In multipart cases, each part is entered and documented separately
- APLIS makes use of data fields to enter specimen information such as those below:
- Part type data field
- This is used for specimen types that have been built into the APLIS part type dictionary
- For these specimen types, information cannot be entered into the APLIS as free text
- The part type field can also trigger other field types, such as:
- Fee codes
- Histology protocols (e.g., H&E X3, immunohistochemical stain for H. pylori)
- Part description field type
- This part is most often entered in free text
- Comprises the descriptive information about the specimen that was provided in the requisition (e.g., LUL 2 cm mass lung biopsy)
- Provides relevant information to the pathologist interpreting the case
- Part type data field
- The following patient information can be entered into the APLIS:
- Location of specimen procurement
- Patient demographics
- Billing, etc.
- Patient information is entered electronically using an ADT feed transmitted from the HIS
- Patient information can also be manually entered by an accessioner, though this method is prone to errors
- At the end of a specimen entry into the APLIS, the case is updated to accessioned, effectively ending the preanalytical phase (Adv Anat Pathol 2012;19:81)
- APLIS data entry is still largely manual and dependent on paper for the following reasons:
- Analytical phase
- The first part of this phase is referred to as grossing and is comprised of the following:
- Description of the gross appearance of specimens
- Dissection of the specimen
- Selection of individual tissue sections
- Designation of tissue sections for microscopic examinations
- Gross descriptions are done in free text
- Text templates for commonly processed specimen types exist (e.g., colon polyp biopsies)
- Speech to text recognition software have recorded successes at this phase
- A gross specimen report is generated at the end of grossing, which contains the following:
- Description of the specimen
- How it was dissected
- What was seen macroscopically upon dissection
- Alphanumerical list (key) designating what tissue went into each cassette
- Cassette engraves that are interfaced with APLIS do not provide enough information on the kind of tissues that went into each cassette at the end of grossing
- As a result, tissue cassette designations must be entered into the APLIS manually
- Gross specimen digital images obtained during grossing have APLIS modules capable of accommodating and managing them

APLIS digital image
- This phase also makes use of the part type dictionary for cut sections and stains during slide preparations
- Specimen tracking, barcoding and radiofrequency identification (RFID) technology can be used to update specimen status and location
- Autogeneration of barcodes and slides labels have also been used by some LIS at histotechnologist stations during microtomy to reduce case misidentification and improve efficiency
- Completed slides are paired with an autogenerated working draft (case assembly)
- The case assembly above is usually templated in an LIS dictionary and it includes:
- Patients’ demographics
- Relevant clinical history
- Gross description of the specimen
- Interoperative consultation diagnosis (e.g., frozen sections)
- Patients' past AP reports
- Final pathologic diagnosis is mainly done with free text
- Sometimes involves the transcription of a pathologist's dictation
- Predefined templates or quick text can be used for frequent diagnoses (e.g., tubular adenoma)
- Speech to text conversion by voice recognition software can be used as well
- After entry of a final diagnosis, the case is marked as final on the APLIS and placed on the pathologist's worklist for final edits and electronic sign out
- Billing and diagnostic codes are generated automatically at this stage
- Final report is then transmitted into a downstream system, such as the clinician's EMR
- There is a push for increased adoption of structured synoptic reports and checklists
- This is an improvement over the use of free text for data storage

Synoptic pathology report

Synoptic worksheet
- This is an improvement over the use of free text for data storage
- Advantages of synoptic reports / checklists:
- Make reporting more efficient
- Standardize reporting among surgical pathologists
- Contain all the data elements required on a diagnostic checklist (e.g., the CAP cancer checklist) (Adv Anat Pathol 2012;19:81)
- The first part of this phase is referred to as grossing and is comprised of the following:
- Postanalytical phase
- The following methods can be used to transmit pathology reports to clinicians:
- HL7 messaging system is used to send patients' reports to a hospital's EMR for easy access by clinicians in that hospital
- Automatic faxing is used to send reports to clinicians in an external hospital
- Online portals can also be used to store patients' reports and clinicians who need the reports are given access to the portal
- APLIS also allows amendments and addendums to be added to final reports (Adv Anat Pathol 2012;19:81)
- The following methods can be used to transmit pathology reports to clinicians:
- Preanalytical phase

- Recent advances in WSI have raised the possibility of an all digital AP workflow (J Digit Imaging 2020;33:1034)
- APLIS can be integrated with digital pathology in the following ways:
- APLIS as an image management system
- Many AP practices now exclusively use digital cameras to take pictures of gross and microscopic specimens
- APLIS can be applied to the following digital imaging processing stages:
- Acquisition
- Refers to the process of creating digital images
- End users usually import images into the LIS using separate applications
- Storage
- Digital images can be stored on the LIS using the 2 approaches below:
- Integral image management
- In this module, the image is stored and managed in the database of the LIS
APLIS digital image
- Advantages:
- Images can be kept in the gallery for internal use (e.g., for documentation purposes)
- Images can be copied into final reports
- Contains the details of the image, such as dates, locations and users who took the pictures
- Disadvantages:
- Image editing is restricted to what the LIS supports
- End users find it difficult to access the raw image data
- If the LIS fails, the digital images in system are lost as well
- File format of image storage hinders interoperability
- In this module, the image is stored and managed in the database of the LIS
- Separate (modular) image management
- Makes use of a different application that automatically feeds images into the LIS

APLIS image storage modules
- This module can do the same work as the integral module above using different means
- Advantage: end users have the flexibility of using image editing software on the image
- Disadvantages: increases overhead cost; this module may not be compatible with certain LIS
- Makes use of a different application that automatically feeds images into the LIS
- Integral image management
- Manipulation
- Refers to the annotation or transformation of images using image editing software (e.g., insertion of measurements and captions)
- Image sharing
- Image sharing can be done in the following ways:
- Integration into final reports
- For use in consultations
- As adjuncts to tumor board presentations
- Advantage: image sharing facilitates teaching and communication to patients and clinicians
- Disadvantage: legal liability for embedding images in pathology reports is not well understood (J Am Acad Dermatol 2006;54:353)
- Image sharing can be done in the following ways:
- Digital images can be stored on the LIS using the 2 approaches below:
- Acquisition
- APLIS applications in digital pathology sign outs
- There is a need for an APLIS WSI interface that fulfills the following needs of an anatomic pathologist:
- Relevant case data, including intraoperative notes
- Old surgical pathology cases from the same patient
- Patients' clinical notes
- Most current APLIS WSI interfaces rely on at least 2 monitors to meet the needs listed above:
- 1 monitor to display the WSI
- The other monitor to display the case and clinical data
- There is a need for an APLIS WSI interface that fulfills the following needs of an anatomic pathologist:
- APLIS as an image management system

- APLIS holds unique opportunities for cytopathology as a whole (Cytojournal 2008;5:16)
- Cytopathology workflow differs from surgical pathology in that slides prepared for pathologists are first screened by cytotechnologists
- Thus, some APLIS allow separate fields for the impressions of the cytotechnologist and the final diagnosis
- APLIS design for cytopathology must integrate the following:
- Whether the obtained specimen is adequate (satisfactory or unsatisfactory)
- A primary interpretation (negative, atypical, suspicious, positive)
- Final diagnosis
- APLIS used for gynecologic and thyroid cytopathology must integrate dictionaries codified in the Bethesda system terminology
- The use of APLIS in creating standardized data allows for reflex testing (e.g., ASCUS for a Pap test followed by a reflex high risk HPV testing) (Clin Lab Med 2007;27:823)
- APLIS must also take into consideration the cap on the maximum number of slides allowed for manual screening per 8 hour periods by a cytotechnologist
- It must also consider the rescreening rates of negative Pap smears allowed for cytotechnologists based on their years of experience
- It must ensure that all slide rescreening in a practice is done appropriately (Cytojournal 2008;5:16)
- LIS could also be used to flag high risk cases using the following markers:
- Previous history
- Current history of abnormal signs and symptoms
- Pathologic findings
- The method above can improve the detection of Pap smear cases diagnosed as LSIL in the previous year
- These APLIS cytopathology measures will improve patient care and turnaround time (Cytojournal 2008;5:16, Adv Anat Pathol 2012;19:81)
- APLIS provides a reliable information structure in modern anatomic pathology laboratories today by:
- Registering specimens
- Recording gross and microscopic findings
- Regulating laboratory workflow
- Formulating and signing out reports
- Disseminating reports to intended recipients across the whole health system
- Supporting quality assurance measures (Adv Anat Pathol 2012;19:81)
- When integrated with digital pathology systems (DPS), APLIS improves AP diagnosis as follows:
- Improves the efficiency of digital sign out for primary diagnosis
- Makes teleconsultation more practical and efficient
- Streamlines the digital sign out workflow

Integrated APLIS (CoPath Plus) and DPI (Omnyx IDP)

APLIS DPI interface
- Data mining refers to the use of computers to analyze substantial amounts of data to identify meaningful and statistically significant patterns (Adv Anat Pathol 2012;19:81)
- Mining of large scale clinical trials, for instance, provides new directions for research and health policies
- In APLIS, data mining is used for quality assurance (QA) and tissue bank support
- Examples of APLIS application in data mining includes the following:
- How long a pathology department takes on average to sign out a breast biopsy
- Flagging unusual cases for review
- Running analysis on the number of bankable tumors banked over a given period
- Specimen rejection frequency by a clinician's office
- Periodic reports that identify trends associated with any clinician's office
- Challenges to APLIS based data mining in AP include:
- Diagnostic terminology changes over time
- Almost all AP gross and final reports are handled as free text
- Challenges to APLIS data mining can be gradually overcome by the increased adoption of synoptic grossing and reporting (Am J Clin Pathol 2009;132:521, Chen: Medical Informatics - Knowledge Management and Data Mining in Biomedicine, 1st Edition, 2005)
- College of American Pathologists currently advocates for increased use of discrete data capture via synoptic reporting (Dovepress: Current Status of Discrete Data Capture in Synoptic Surgical Pathology and Cancer Reporting [Accessed 10 February 2023])
- The goal of such moves is to significantly improve the quality of pathology reports used for quality assurance, data mining and other related functions
- Built in software features such as spell check and automated comments can be used to improve LIS data mining capabilities (Adv Anat Pathol 2012;19:81)
- Limited access to electronic medical record (EMR) and hospital information systems (HIS) by APLIS software
- Poor APLIS whole slide imaging (WSI) computer interface
- The complexity of the data to be mined
- The prevalent reporting of AP grossing and final diagnostic reports using free text style
Comment Here
Reference: APLIS

What is the best way to improve the quality and standard of diagnostic reporting in anatomic pathology practices that make use of anatomic pathology laboratory information systems (APLIS) applications?
- Increased adoption of synoptic grossing and reporting worksheets for surgical pathology specimens
- SQL integration into the APLIS software
- Upgrade of the operating systems on which APLIS applications run
- Use of the relational model in the database management systems of APLIS
Comment Here
Reference: APLIS
- Through a set of computational heuristics, artificial intelligence (AI) technologies efficiently parse and summarize millions of clinical variables collected in modern pathology laboratories in a knowledge / rules based or data driven way to augment clinical decision making
- Machine learning (ML) is a subset of AI approaches that learn patterned associations and rules to solve specific problems in instances where the number of clinical variables is far too large and complex for normal human comprehension
- Supervised algorithms can make predictions on data that has been annotated by pathologists, whereas unsupervised algorithms do not require pathologist annotations
- Advances in genomics and imaging have generated complex biomedical data, posing challenges in comprehensive evaluation of clinical variables (Lab Invest 2021;101:412)
- Early AI applications relied on rules based approaches embedded in electronic medical record systems (Artif Intell Med 1992;4:463)
- Machine learning algorithms can derive patterns and rules from diverse pathology datasets, with deep learning excelling in image / text processing (Acad Pathol 2019;6:2374289519873088)
- Machine learning models learn from training sets and their generalizability is assessed using validation / test sets
- Several informatics software solutions have been developed to streamline the AI algorithm development process
- Investments in technical personnel, computing and data infrastructure enable rapid prototyping and techniques like transfer learning and expert in the loop which reduce costs in data collection and annotation (Pathol Res Pract 2020;216:153040)
- Potential for batch effects requires partitioning patients into separate training / test sets to avoid biasing the prediction models (JCO Clin Cancer Inform 2019;3:1)
- Whole slide image (WSI): digitized representation of histologic slide after whole slide scanning at 20x or 40x resolution (e.g., using Aperio AT2 or GT450 scanner); slide dimensionality can exceed 100,000 pixels in any given spatial dimension and typically contains 3 color channels, red, green and blue (RGB) (Annu Rev Pathol 2013;8:331)
- Subimage / patch: smaller, local rectangular region extracted from a WSI, often done to reduce the computational resources required for the development and deployment of machine learning algorithms (J Pathol Inform 2019;10:9)
- Gene expression array: using DNA microarrays and next generation sequencing to simultaneously estimate the expression of thousands of genes from a sample; used for diagnosis, prognosis and the selection of optimal therapeutics (Clin Biochem Rev 2011;32:177)
- Spatial / single cell omics: technologies that report gene expression for individual genes or locations within distinct spatial architectures within a tissue section (Nat Methods 2021;18:997, Trends Biotechnol 2010;28:281)
- Pathology note / sign out: textual representation of clinical narrative that can be broken down into words and phrases for further analysis (J Biomed Inform 2021;116:103712, Sci Rep 2021;11:23823, JCO Clin Cancer Inform 2018;2:1, J Pathol Inform 2019;10:13, J Pathol Inform 2022;13:3)
- Artificial intelligence: computational approaches developed to perform tasks that typically require human intelligence / semantic understanding (Lancet Oncol 2019;20:e253)
- Machine learning: computational heuristics that learn patterns from data without requiring explicit programming to make decisions (Med Image Anal 2016;33:170)
- Artificial neural networks (ANN) (Nature 2015;521:436)
- Type of machine learning algorithm that represents input data (e.g., images) as nodes (neurons)
- Learns image filters (e.g., color, shapes) used to extract histomorphological / cytological features
- Comprised of multiple processing layers to represent object at multiple levels of abstraction (deep learning)
- Inspired by the visual cortex
- Classification: use of computer algorithm for assigning type of object into a specific, predetermined grouping (Med Image Anal 2016;33:170)
- Regression: computer algorithm that can predict a continuous measure from input information (Med Image Anal 2016;33:170)
- Clustering: use of computer algorithm to group objects together, either based on similar features or spatially based on their colocalization (Med Image Anal 2016;33:170)
- Dimensionality reduction: use of a computer algorithm to visualize high dimensional data (e.g., many genes) into a low dimensional space (e.g., 2D scatterplot); each dimension typically represents a combination of markers and the distance between points in the scatterplot depicts relationships between datapoints in a simplified form (Med Image Anal 2016;33:170)
- Feature selection: use of a computer algorithm to rank and select features based on their perceived relevance to the target of interest using a quantitative metric (Med Image Anal 2016;33:170)
- Segmentation: use of a computer algorithm for pixelwise assignment of specific classes (e.g., nucleus) without specific separation of objects (Med Image Comput Comput Assist Interv 2015;18:234)
- Detection: use of computer algorithm to isolate specific objects in an image and report object’s bounding box location, etc. (Am J Pathol 2021;191:1693)
- Generative adversarial networks (GAN): type of neural network that generates highly realistic synthetic images from input signal (e.g., noise, source image) through iterative optimization of a generator that synthesizes images and discriminator / critic that attempts to distinguish generated from real images (Mod Pathol 2021;34:808)
- Evaluation metrics: used to depict performance of automated algorithm (Arch Pathol Lab Med 2021;145:1228)
- Accuracy: proportion of observations that were classified correctly
- Sensitivity: proportion of cases that were classified correctly at the given cutoff probability threshold
- Specificity: proportion of controls that were classified correctly at the given cutoff probability threshold
- AUC: area under the receiver operating characteristic curve, an overall measure of performance considering sensitivity / specificity reported across many cutoff thresholds
- F1 score: captures tradeoff between sensitivity / specificity
- Intersection over union (IoU): used to evaluate accuracy of cell localization algorithm by comparing the area overlap between the predicted cell location and ground truth location to the area union between the predicted / ground truth location
- Mean average precision (mAP) averages the precision of the model across many IoU thresholds (i.e., minimum IoU between predicted / ground truth locations to indicate a true positive detection)
- Training cohort: set of cases used for training machine learning model
- Validation / test cohort: set of cases used for evaluating machine learning model that the model does not train on
- Validation set is used to optimize the hyperparameters of the machine learning model, i.e., its training configuration (e.g., learning rate)
- Data complexities (Reg Anesth Pain Med 2021;46:936, Advances in Molecular Pathology 2022;5:e1)
- Confounding: risk of a specific outcome varies due to an exposure, this difference can be attributed to an unrelated variable
- Effect modification: risk of a specific outcome, given an exposure, changes depending on the patient subgroup
- Nonlinearity: relationship between a specific clinical variable and the outcome changes based on the variable's value
- Interactions: relationship between a specific clinical variable and the outcome changes based on a separate clinical variable, similar to effect modification
- Dimensionality: a large number of clinical predictors (millions to billions) are regularly collected per patient, surpassing the number of patients; these variables are further complicated by nonlinearity and interactions
- Personalized medicine: individualized categorization of health conditions by considering various factors specific to each person
- Current health assessment methods are often unreliable, slow, nuanced and tedious, highlighting the need for reliable, quantitative and efficient algorithms (Mod Pathol 2022;35:1540)
- Data complexities necessitate pattern mining AI algorithms: assessing nuanced information becomes challenging due to confounding, effect modification, nonlinearity and interactions in the context of hyperdimensional data, where each patient may have millions to billions of features (BMC Med Res Methodol 2020;20:171)
- Pursuit of personalized medicine will lead to individualized assessments, enhancing health outcomes across different diagnostic settings and geographic regions (Genome 2021;64:416)
- Includes molecular alterations, comorbidities and healthcare data that interact across space and time and considers unique screening, assessment and treatment options
- While it is important to understand population level risk factors, it is equally important to assess risks for individual of diverse backgrounds, epigenetics / genetic makeup and exposures who experience care differently
- Originated as a summer project at Dartmouth College in 1956 (Acad Radiol 2021;28:1810)
- Concept of machines imitating human cognitive abilities
- Turing test: if a human evaluator cannot distinguish between responses from a computer and a human, it indicates that the machine is capable of human level intelligence (Nat Cancer 2020;1:137)
- Narrow intelligence: optimize / solve one narrow problem at a time, excel in one domain at a time (Lab Invest 2021;101:412)
- Does not possess human-like cognitive processes
- Encompasses the following methods
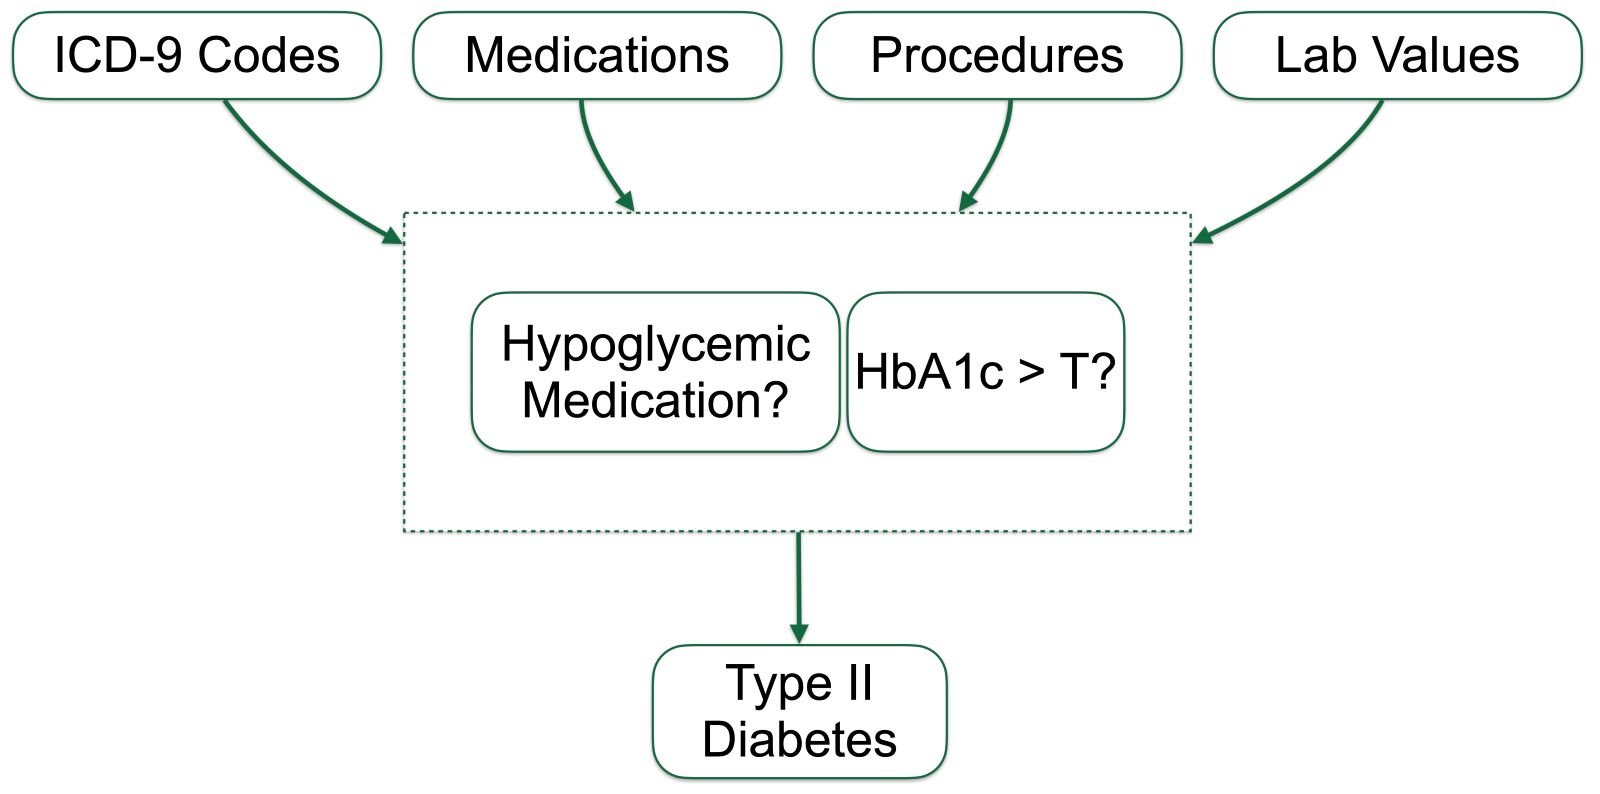
- Expert systems: rules based approaches that leverage human curated knowledge, common to most EMR systems and used in real time decision support systems focused on monitoring a specific function or a small set of information (Diagram 1)
- Knowledge engineering: embedding human expertise and knowledge into computer systems; domain experts provide rules, heuristics and guidelines to implement in AI systems for clinical decision making
- Symbolic reasoning: representing knowledge through a series of logical statements, symbols (that contain certain mathematical properties) and rules; the manipulation of these 3 components is used to solve problems
- Automated planning processes: generation of plans and sequences of actions to achieve a goal of interest
- Given a problem, search algorithms / optimization techniques are employed to generate a series of possible events and relevant actions
- The set of actions taken reflects the maximum possible expected reward
- Planning / scheduling tasks may be used to optimize the laboratory workflow and the surgical pathology schedule based on a number of constraints and the patient’s complexity
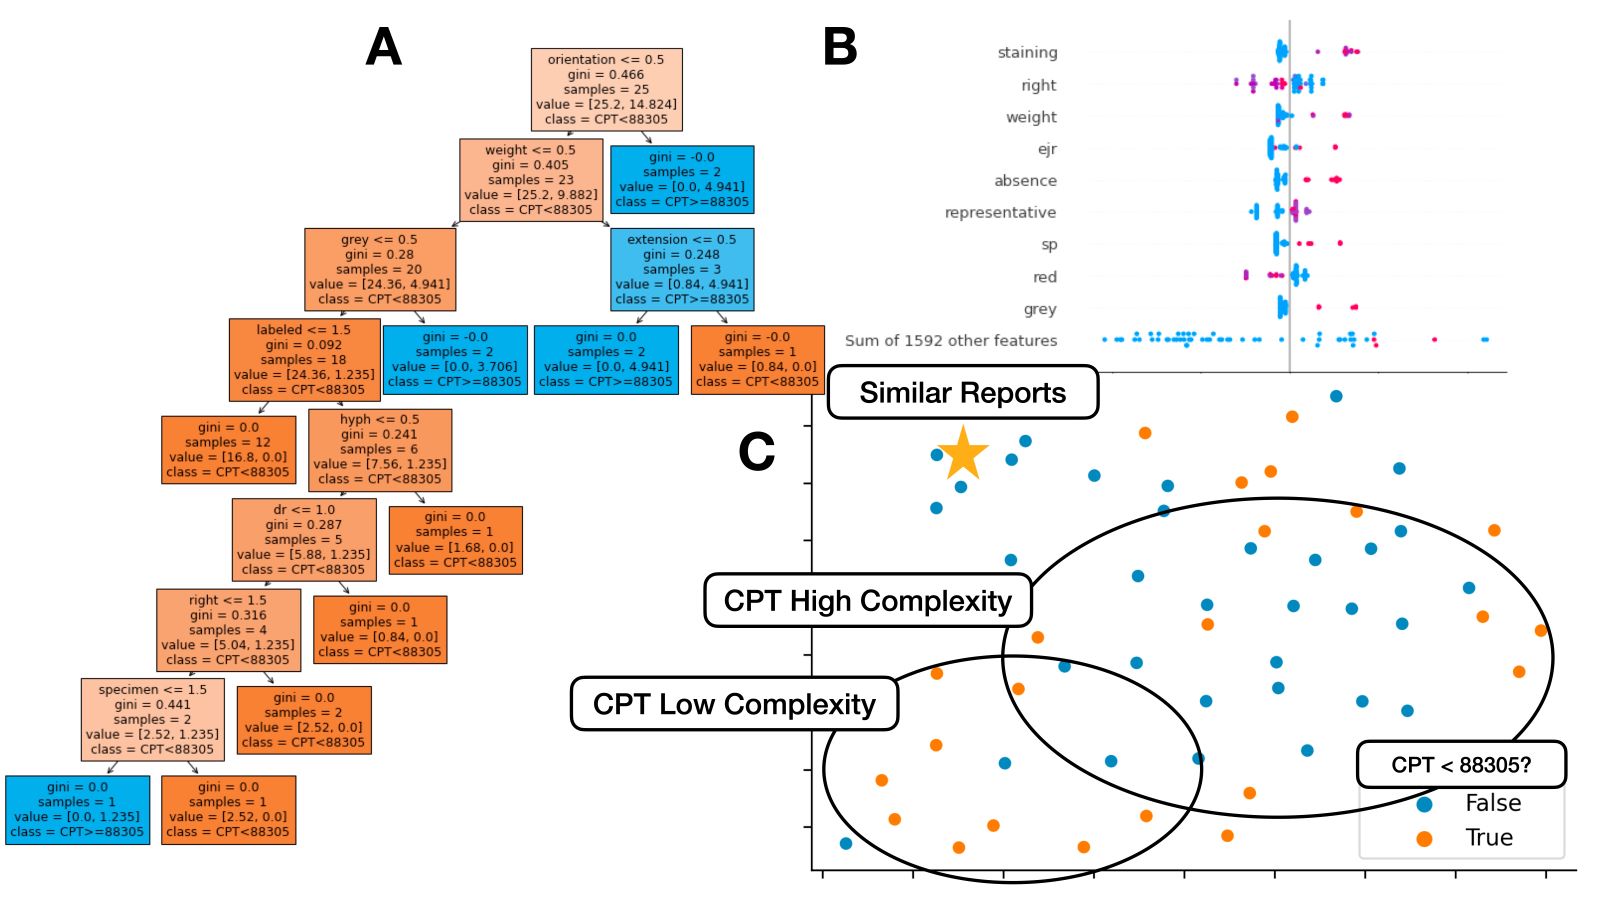
- Case based problem solving
- Identifies similar cases in a database of prior cases and their solutions to solve a problem
- Used to solve rare cases by providing a similar guide to follow
- Quality assurance / detect errors through comparison to nominal findings
- Used to compare against similar cases for clinical decision support
- Evolutionary computation: optimization systems that recommend a number of solutions that compete / combine with each other to form an optimal solution, inspired by natural selection with generations of recombination, mutation and selection; genetic algorithms can be used as an optimization routine for the decision support systems themselves
- Machine learning: discovers rules and patterns by directly learning relevant features from the data (e.g., collections of relevant shapes within image)
- Artificial general intelligence (AGI): intelligence comparable to that of a human, capable of solving large, complex tasks from first principles (Semin Diagn Pathol 2023;40:71)
- Artificial superintelligence (ASI): computer possessing intelligence that far surpasses that of a human (Arrhythm Electrophysiol Rev 2021;10:223)
- Natural language processing: development of algorithms to understand, interpret / parse and imitate human language (Am J Pathol 2022 Aug 17 [Epub ahead of print])
- Tasks include tokenization (breaking sentences into words), parsing (locating specific words), stop word removal (removing common words), lemmatization / word stemming (converting word to common word root), part of speech tagging, named entity recognition (e.g., identifying mention of disease within pathology report), topic modeling (i.e., identifying prevailing trends), text generation (e.g., autocomplete for pathology report), classification (e.g., assigning report case complexity CPT code), etc.
- Count matrices (frequency of each words by report) and word vectors / embeddings (i.e., assigning each word a numerical descriptor that can be compared to other words; e.g., word2vec, transformer, etc.) used to represent data
- Large language models (e.g., ChatGPT) have risen in popularity over the past few years and have many use cases in pathology, including assistance with writing / summarizing clinical reports and grant proposals (PLOS Digit Health 2023;2:e0000198)
- Computer vision: aims to identify and quantify the presence of significant patterns within an image (NPJ Digit Med 2021;4:5)
- Imaging features can be used to effectively organize and extract meaningful information from the image
- Capable of taking measurements such as nucleus size, the number of nuclear grooves and other relevant metrics derived from imaging features
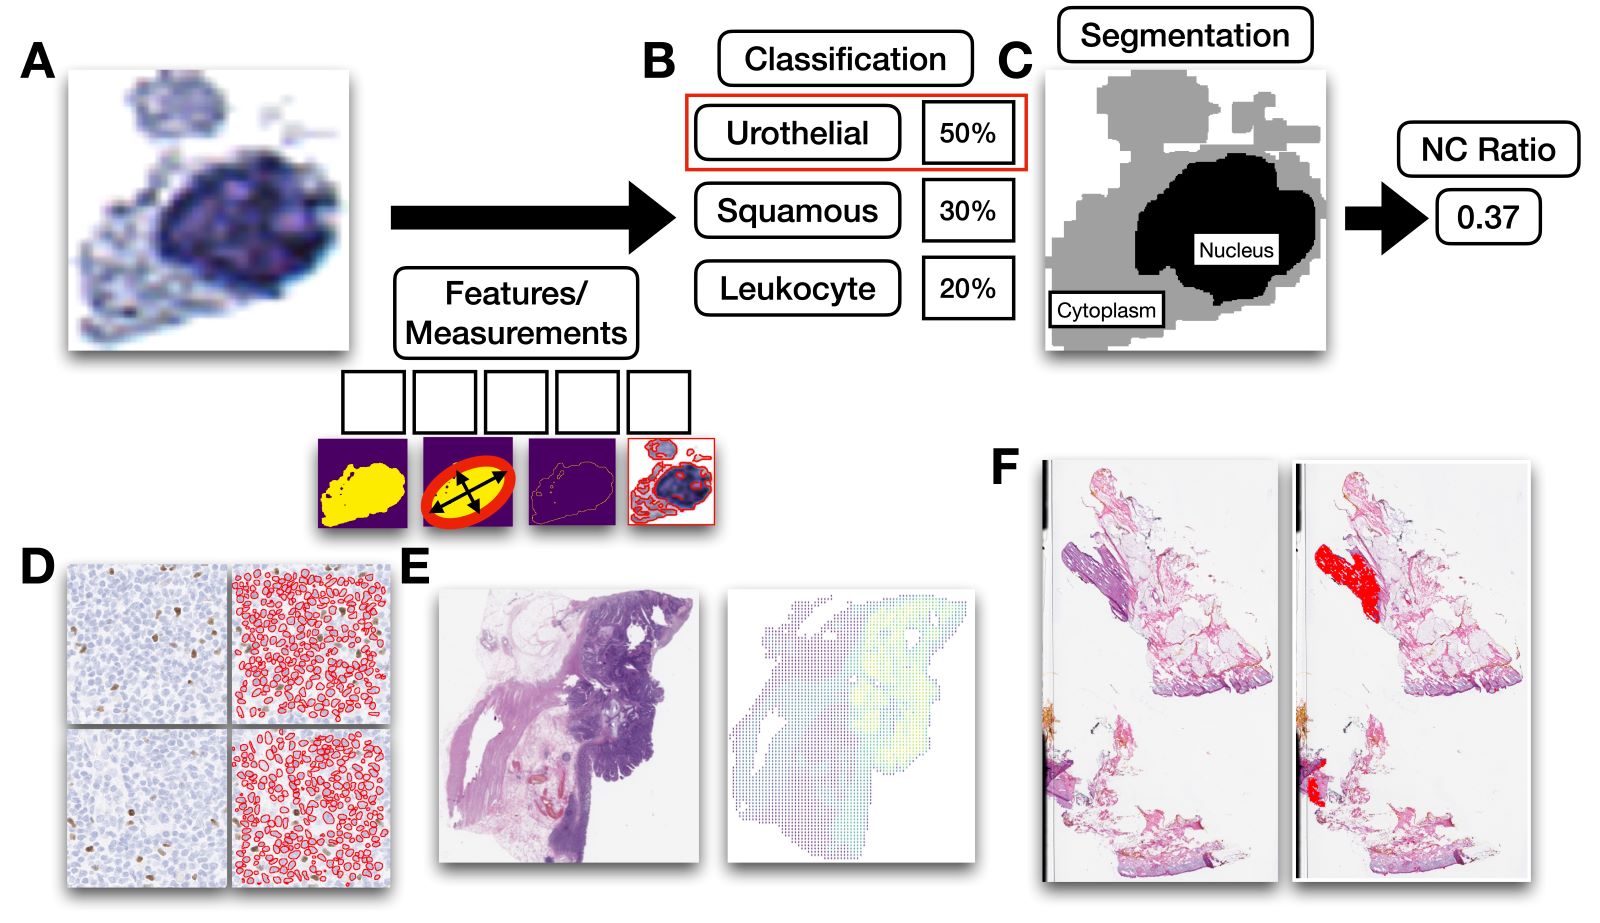
- Tasks include classification (e.g., binning cell based on assigned cell type), segmentation (e.g., separating nucleus from cytoplasm in pixel by pixel manner), detection (e.g., locating instances of cells within slide images), coregistration (aligning 2 restained sections together to tag cells with multiple immunostains), etc.
- Supervised learning: when diagnosis / outcome is known
- Classification: prediction of a categorical assignment
- Regression: prediction of a continuous dependent variable
- Survival analysis: special form of regression analysis to estimate time to event outcomes; commonly formulated using Cox proportional hazards
- Example approaches: multivariable linear / logistic regression, decision trees, random forest, support vector machines, discriminant analyses, K nearest neighbors
- Unsupervised learning: when diagnosis / outcome is not known
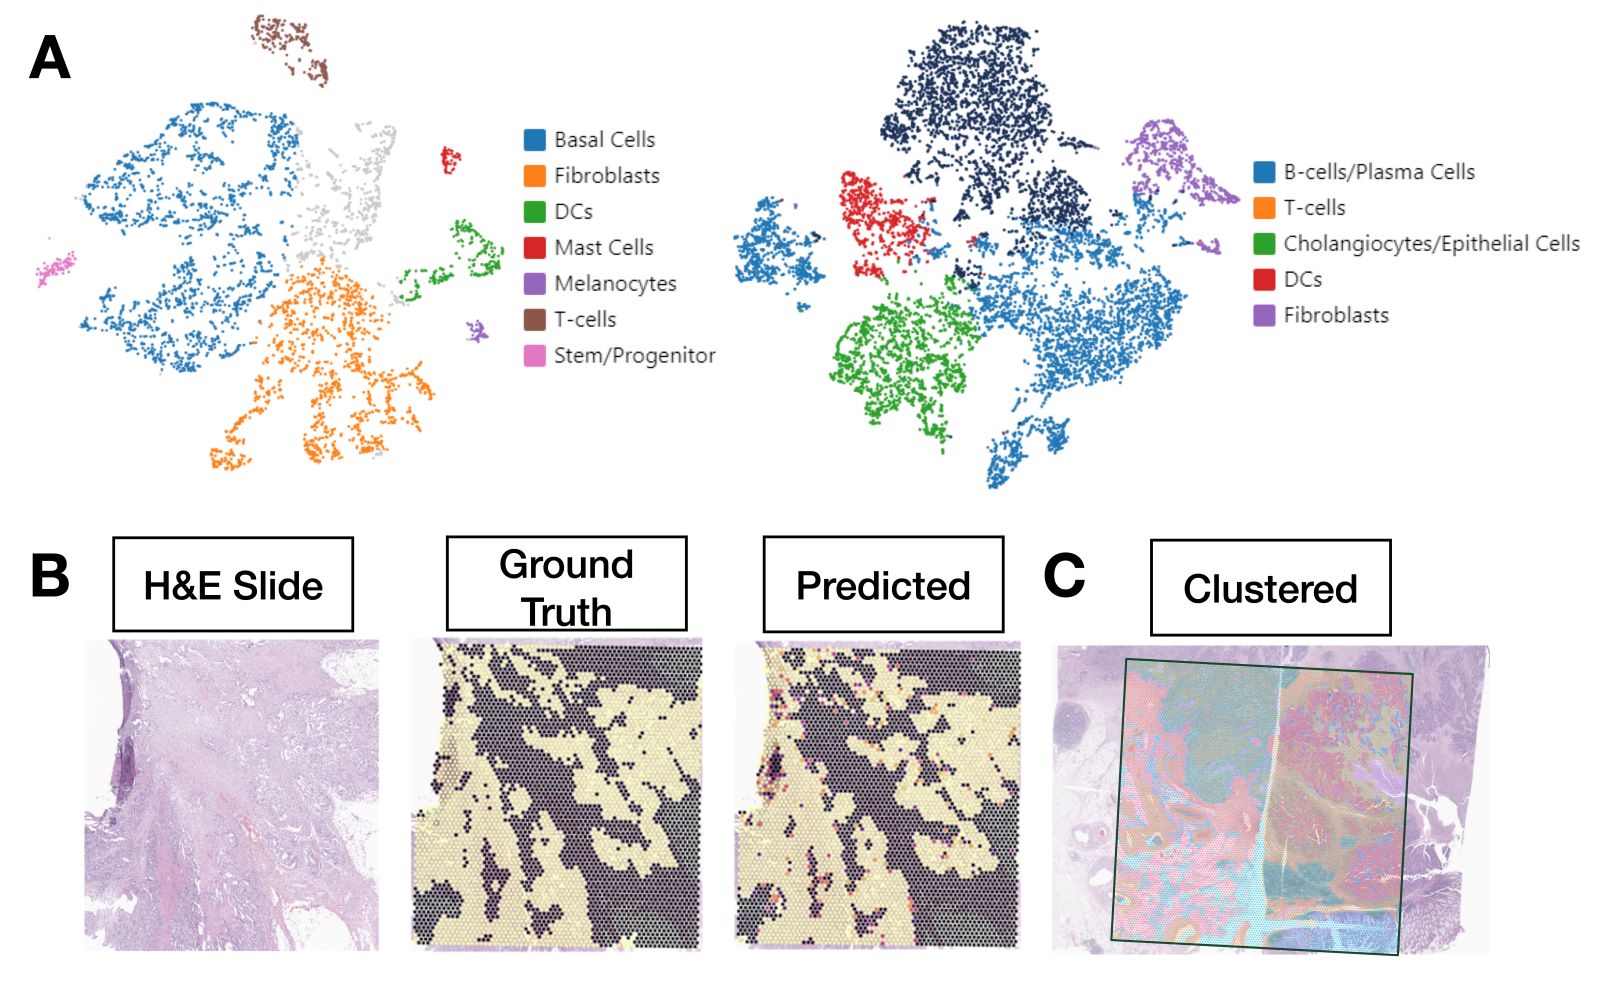
- Dimensionality reduction: reduces the number of high dimensional input variables to a manageable form (i.e., makes it easier to visualize data in a 2 dimensional scatterplot to see how patients relate to one another) (Nat Biotechnol 2018 Dec 3 [Epub ahead of print], mSystems 2021;6:e0069121)
- Example approaches: principal component analysis (PCA), uniform manifold approximation and projection (UMAP), T distributed stochastic neighbor embedding (TSNE), variational autoencoders (VAE)
- Clustering: process of grouping patients, genes etc., based on similar characteristics
- Example algorithms: K means, hierarchical clustering, spectral clustering, density based clustering, mixture models
- Dimensionality reduction: reduces the number of high dimensional input variables to a manageable form (i.e., makes it easier to visualize data in a 2 dimensional scatterplot to see how patients relate to one another) (Nat Biotechnol 2018 Dec 3 [Epub ahead of print], mSystems 2021;6:e0069121)
- Deep learning: leverage artificial neural networks (ANN), comprised of multiple processing layers to represent objects at several levels of abstraction (J R Soc Interface 2018;15:20170387)
- Can perform both supervised and unsupervised tasks
- Requires significant computing capabilities in the form of graphics processing units (GPU)
- Convolutional neural networks: ideal for image data (e.g., whole slide images), work by storing filters to extract task relevant shapes and patterns
- Recurrent neural networks: well suited for sequence data (e.g., genomics, text, time series) by keeping a working memory of previous states in a sequence
- Graph neural networks: optimal for graph structured data through message passing operations between linked entities (e.g., incorporating information from adjacent histological structures, cells, etc.) (Nat Biomed Eng 2022;6:1353)
- Attention mechanism: dynamically assigns weights to subcomponents of different data types (e.g., images, text, genomics, graphs, etc.), considering their relevance and importance
- Generative adversarial networks: capable of generating synthetic data for various pathological data types (e.g., images of cells, simulating application of different chemical staining reagents)
- Reinforcement learning: learns from feedback in the environment or system of interaction to anticipate future actions based on the patient's state and expected rewards (Acad Pathol 2019;6:2374289519873088)
- Popularly used for drug design and delivery with only limited applications in pathology
- Data preprocessing: transform data into a format that can be readily understood by AI algorithms (Pac Symp Biocomput 2020;25:307)
- Missing data: imputation (i.e., replacement) of missing features if data is missing at random (MAR) or missing completely at random (MCAR); removal of features if excessive missingness or missing not at random (MNAR; i.e., missingness tied to outcome) if the reason for missingness is not well known
- Standardization / normalization: process of lessening the impact of extraneous values to improve model performance
- Feature selection: selecting a subset of the most relevant input variables to improve predictive models (Machine Intelligence and Pattern Recognition 1994;16:403)
- Variance filtering: retains features with greatest variation within the dataset
- Variance inflation factor: metric that scores features based on correlation / redundancy of variable to other independent variables (Qual Quant 2007;41:673)
- LASSO / ridge: shrinks or eliminates predictors, largely based on whether they are correlated / contain redundant information
- Feature importance: model specific scoring of features based on contribution to predictive performance; retains most relevant features
- Recursive feature elimination: iteratively considers smaller set of features using the metrics defined above
- Algorithmic development process (Diagram 2) (Nat Med 2020;26:1320, BMJ Health Care Inform 2021;28:e100385)
- Defining the problem: guide collection of data germane to the task at hand; decide whether the problem conforms to a specific task (e.g., classification, regression, etc.) based on the available data and the anticipated outcomes
- Data: organizing (e.g., annotation by a pathologist using software) and preprocessing data into a format digestible by computer algorithms and partitioned to demonstrate broad scale applicability
- ASAP, Qupath, ImageJ: used for annotating image data (Sci Rep 2017;7:16878, Comput Struct Biotechnol J 2021;19:852)
- Doccano: used for annotating text data (arXiv: POTATO - The Portable Text Annotation Tool [Accessed 19 July 2023])
- Cross validation procedures iteratively partition the dataset to compare models (e.g., random forest) and their set of hyperparameters (i.e., specifies constraints for how a machine learning model learns from the data; e.g., maximum depth of the decision tree) to decide on an optimal set to use as the final model while avoiding overfitting (memorization of the input data); model is trained across the cross validated dataset and evaluated on the test set
- Alternatively, separate training, validation and test datasets can be specified, identifying the optimal set based on validation set performance, ensuring patients and other sources of systematic variation are solely assigned into separate cohorts (e.g., all samples from one patient are only in the validation set)
- See evaluation metrics
- Solutions
- Statistics: interpreting the relationship between predictors and outcomes
- Algorithms: prioritizing prediction accuracy for specific tasks, with less emphasis on interpretation
- Evaluation: utilizing performance metrics to assess algorithm performance in real world clinical settings
- Interpretation techniques assign scores to features that are pertinent to the prediction; used to evaluate the coherence and validity of the model's outputs or identify sources of systematic bias
- Feedback / refine: iteratively collecting data, improving algorithms and aligning algorithms with clinical needs through consultation with clinical stakeholders
- Anatomic pathology (Diagram 3)
- Prostate cancer Gleason grading (Mod Pathol 2018;31:S96)
- Surgical pathology: rapid intraoperative margin assessment for Mohs surgery (medRxiv 2023 May 16 [Preprint], medRxiv 2022 May 20 [Preprint])
- Nuclei detection: localizes nuclei within an H&E or IHC slide for further characterization of their spatial distribution (Nat Methods 2019;16:1233)
- Cytopathology
- Separation of cytoplasmic boundaries for characterization of cell clusters (Cancer Cytopathol 2023;131:19)
- Rapid bladder cancer screening and recurrence assessment (medRxiv 2023 March 2 [Preprint], medRxiv 2023 March 5 [Preprint])
- Subclassification of thyroid nodules with atypia of undetermined significance (J Pathol Inform 2022;13:100004)
- Virtual staining: digital conversion between different chemical staining reagents (Light Sci Appl 2020;9:78, Mod Pathol 2021;34:808)
- Image registration: process of aligning 2 different images (e.g., 2 different IHC stained slides from serial sections) into a common coordinate system (Cancer Res 2023;83:2078)
- Graph neural networks: algorithms capable of contextualizing smaller regions / points of interest within a tissue slide by their surrounding architecture (Comput Med Imaging Graph 2022;95:102027, Pac Symp Biocomput 2021;26:285)
- Clinical trials: uses digital algorithms to predict disease outcomes / quantitatively assess prognostic risk as a study endpoint or to derive biomarker for clinical validation (NPJ Precis Oncol 2022;6:37)
- Molecular pathology (Diagram 4)
- Genetic polymorphisms: fast algorithms for calling single nucleotide polymorphisms, estimating epistatic interactions (Hum Genet 2011;129:101)
- DNA methylation: AI can be used to study age acceleration, cellular heterogeneity, cancer subtyping and prognostication (BMC Bioinformatics 2020;21:108)
- RNASeq: machine learning to define intrinsic molecular subtypes (e.g., PAM50, scleroderma) with associated therapeutic response (Arthritis Rheumatol 2019;71:1701)
- Single cell and spatial omics: helps localize distinct cellular populations to distinct histological architectures; machine learning tools help map single cells to tissue slides and predict spatial expression from H&E WSI (Nat Rev Genet 2019;20:257, Nat Methods 2022;19:534)
- Genetic diversity as a prognostic signature: classification and dimensionality reduction of genomic reads assigned to taxa can inform prognostically important microbiome diversity measures (Bioinformatics 2012;28:i356, Front Microbiol 2021;12:634511)
- CRISPR: prediction of off target binding effects and diagnostics (PLoS One 2022;17:e0262299)
- Intersections between anatomic and molecular pathology
- Multimodal models: enhances the ability to prognosticate by leveraging / combining information from different data types (IEEE Trans Med Imaging 2022;41:757, Cancer Cell 2022;40:1095)
- Spatial multimodal models: learn additional biologically relevant features from both coregistered H&E and spatial molecular information (Diagram 4) (J Pathol Inform 2023;14:100308)
- Tumor purity control: uses image analysis methods to estimate the proportion of malignant cells within macrodissected tumor regions for accurate estimation of the tumor mutational burden (Mod Pathol 2022;35:1791)
- NLP and pathology notes
- Current procedural terminology (CPT) code prediction: identifies instances of underbilling by serving as second check for assignment of primary CPT codes (Diagram 5) (J Pathol Inform 2022;13:3)
- Named entity recognition: extraction of relevant reporting information (e.g., staining / staging results) into a structured format for integration into electronic health records (IEEE J Biomed Health Inform 2018;22:244)
- Automated input / autocomplete of pathology reports: improves the speed of inputting information into pathology reports and can assist with scanning and structuring reports shared from other institutions (Sci Rep 2021;11:23823, Acta Neurochir Suppl 2022;134:207, arXiv: Fast, Structured Clinical Documentation via Contextual Autocomplete [Accessed 19 July 2023])
- Guidelines for development and validation of AI algorithms
- CLIA / CAP (CAP: How to Validate AI Algorithms in Anatomic Pathology [Accessed 19 July 2023])
- Using AI to preclassify tissue specimens with follow up review by the pathologist - must be integrated with FDA approved digital pathology system
- Validation on at least 60 samples is required for new diagnostic decision aids and should follow guidelines for validating whole slide imaging systems, reflecting real world clinical scenarios; additional validation is needed for changes to the system
- Pathologists cannot always claim that diagnostic overlay had misled them in instances where discrepancies arise - understanding appropriate usage of the system is crucial
- For instance, a system that is configured for diagnostic purposes (e.g., correctly classifying a benign reactive case for cervical biopsies for cervical cancer screening) cannot be used to localize cells suggestive of herpes simplex virus if that is not its intended use
- The pathologist would still be required to both affirm the benign reactive case if they are in agreement and perform manual examination for additional findings
- Devices not approved by the FDA can be used as long as the system is validated and information on the regulatory status of the device is disclosed in the pathology report
- Health care delivery science: design thinking, process improvement and implementation science, along with continuous quality control / monitoring and evaluation of technologies in realistic scenarios are essential for envisioning successful implementation of AI in the clinic (NPJ Digit Med 2020;3:107)
- Examples of checklists for design and evaluation of AI technologies
- SPIRIT-AI: trial protocols - guidelines for designing clinical trials involving the use of artificial intelligence interventions (Nat Med 2020;26:1351)
- CONSORT-AI: trial reports - guidelines for reporting clinical trials involving the use of artificial intelligence interventions (Nat Med 2020;26:1364)
- MI-CLAIM: minimum information required to evaluate a clinical AI study, involving assessment of the following components: study design, data separation, optimization and final model selection, performance evaluation, model examination and reproducible pipeline (NPJ Digit Med 2022;5:2)
- Features a tiered system of reporting standards, enabling release of different levels of information
- Enhancing diversity in biomedical AI applications (EBioMedicine 2021;67:103358, NPJ Digit Med 2022;5:2)
- Short term solution: diversify data collections and monitor AI algorithms for sources of bias
- Long term solutions: policy, regulatory changes regarding funding, education and publications (e.g., health disparities in FDA guidelines), enhancing the development of diverse teams
- Large language models authorship policies: large language models (LLM) should be used to help perform minor edits to originally drafted content to improve readability and language rather than generate new content
- Most journals do not consider large language models as satisfying authorship criteria as they are unable to assume accountability for their work
- A statement in the methods or acknowledgements section can address use of LLM for academic writing assistance
- CLIA / CAP (CAP: How to Validate AI Algorithms in Anatomic Pathology [Accessed 19 July 2023])
- Advantages: informatics approaches that can be employed in the clinical setting (Ann R Coll Surg Engl 2004;86:334, J Clin Med 2020;9:3697)
- Data driven: leverages various types of data to facilitate enhanced learning and synthesis of information from multiple sources, including but not limited to genomics, laboratory data and imaging data
- Offers distinct perspectives on a patient's health and wellness
- Technologies sift through vast amounts of data, uncovering hidden, interconnected patterns that would have been difficult to identify individually
- Flexible programming, enabling them to possess a comprehensive understanding of the abundant data generated across numerous healthcare systems
- Efficient: empower healthcare professionals to accomplish more within shorter timeframes
- Digital connectivity: algorithms can efficiently process and deliver results regardless of the data's location, providing real time insights, enabling faster, less error prone decision making and significantly reduces the burden of tedious tasks, making them more manageable and higher throughput
- Reduces barriers to entry for nonspecialists, particularly helpful within lower resourced areas around the world
- Effective: potential to translate into positive health outcomes, enhance healthcare delivery and contribute to overall better health and well being through personalized care recommendations
- Data driven: leverages various types of data to facilitate enhanced learning and synthesis of information from multiple sources, including but not limited to genomics, laboratory data and imaging data
- Disadvantages / ethical considerations
- Algorithms should complement clinical training and intuition, serving as a secondary check or to identify areas to focus on or to select high priority cases for triage; relying solely on automation can transfer the responsibility of clinical decisions to the algorithm makers, potentially resulting in erroneous decisions due to overreliance (JMIR Form Res 2022;6:e36501)
- Data ownership: the question of who owns the data (patients, departments, hospitals, research organizations) and generates the models can influence clinical decisions and inform concerns about bias, conflicts of interest and commercialization interests; collaboration between healthcare organization, researchers, patients and regulatory bodies are essential for establishing clear ethical guidelines
- Bias in AI algorithms can result in algorithmic behavior that disproportionately affects historically underserved groups, leading to higher rates of underdiagnosis and misdiagnosis in these populations, further emphasizing the need for increased representation and diversity in AI development and STEM training (Engag Sci Technol Soc 2017;3:139, PLoS Comput Biol 2022;18:e1009719)
- Data hungry AI algorithms are susceptible to security risks, which can lead to costly litigation
- Federated learning and other security / privacy preserving technologies can enable the development of AI models across multiple institutions while minimizing security / privacy risks by keeping the data hidden / encrypted (NPJ Digit Med 2020;3:119)
- Not every clinical problem can be effectively solved with AI and incorporating clinical input into development and deployment strategies can foster successful translation and adoption of medical AI technologies (BMC Med 2019;17:143)
- Focus is primarily on prediction rather than statistical inference, which may overlook important risk factors that require intervention; sometimes simpler modeling heuristics are sufficient to solve most biomedical problems (BMC Bioinformatics 2018;19:270, BMC Med Res Methodol 2020;20:171)
- Select examples for AI algorithm development include
- Scikit-image, OpenCV2: image analysis frameworks (PeerJ 2014;2:e453, Comput Biol Med 2017;84:189)
- Scikit-learn, Caret: machine learning framework (Bioinformatics 2023;39:btac829, J Open Source Softw 2019;4:1903)
- PyTorch, Keras, Tensorflow: deep learning frameworks (Mol Cancer Res 2022;20:202)
- Instructional book for developing deep learning workflows: D2L: Dive into Deep Learning [Accessed 19 July 2023]
- Detectron2, MMDetection: cell detection frameworks (Cancer Cytopathol 2023;131:19)
- Regex, Textblob, Spacy, NLTK, Gensim, Huggingface: Text processing frameworks (arXiv: HuggingFace's Transformers - State-of-the-art Natural Language Processing [Accessed 19 July 2023], Sarkar: Text Analytics with Python - A Practitioner's Guide to Natural Language Processing, 2nd Edition, 2019)
- Captum, SHAP: model interpretation frameworks (Nat Mach Intell 2020;2:56, arXiv: Captum - A Unified and Generic Model Interpretability Library for PyTorch [Accessed 19 July 2023])
- OWL: web ontology language, used for knowledge representation and reasoning (Decision Support Systems 2010;50:1)
- ROS: example of robotics operating systems (Koubaa: Robot Operating System (ROS) - The Complete Reference (Volume 2) (Studies in Computational Intelligence, 707), 1st Edition, 2017)
- DEAP: distributed evolutionary algorithms in Python, example of an evolutionary computation framework (The Journal of Machine Learning Research 2012;13:2171)
- TPOT: example of an AutoML approach (train a machine learning model with a single line of code) (Hutter: Automated Machine Learning, 1st Edition, 2019)
- Docker / Singularity and Conda: software to create reproducible, production level software for deploying machine learning algorithms (PLoS Comput Biol 2020;16:e1008316, Nat Methods 2021;18:1161)
- Introductory machine learning tutorials in R and Python (GitHub: Molecular Pathology Machine Learning Tutorial [Accessed 19 July 2023])
- Human in the loop: systems that incorporate user feedback in real time to improve predictive models
- Bayesian active learning: iteratively labeling images based on algorithmic uncertainty / mistakes (Sci Rep 2019;9:14347)
- Unsupervised clustering: sorts objects into groups and suggests groups to annotate (J Pathol Inform 2022;13:100146, Nat Commun 2012;3:1032, Am J Clin Pathol 2022;157:5)
- Point annotations: avoids need to outline objects in WSI by extrapolating from a single central point (Med Image Anal 2020;65:101771, IEEE J Biomed Health Inform 2021;25:1673, IEEE Trans Med Imaging 2020;39:3655)
- Segment anything model: deep learning approach that can generate polygonal annotations from minimal specification of points and boxes (e.g., used to quickly annotate epithelial regions in WSI or localize nuclei) (arXiv: Segment Anything Model (SAM) for Digital Pathology - Assess Zero-shot Segmentation on Whole Slide Imaging [Accessed 19 July 2023])
- Transfer learning: training models on data from a separate, related domain / tissue type (e.g., stomach cancer) and further improving / fine tuning these models on the target tissue type (e.g., colon cancer) (Nat Commun 2020;11:6367)
- Less data is needed as deep learning model populates an initial information registry from the stomach cancer set that will complement the colon cancer set
- Assumes similar domains between source and target models

Which of the following is an example of a supervised machine learning algorithm but not an unsupervised one?
- Artificial neural network
- Decision tree
- K means clustering
- Principal component analysis
Comment Here
Reference: Artificial intelligence
- Deep learning algorithm used to detect vertebral fractures from Xrays
- Hard programmed system designed by programmers and informed by domain experts, which is able to calculate the total NAS score / NAFLD activity score from a collection of pathology reports input into the electronic medical record system, helping determine a NASH diagnosis for each patient
- Manual examination of a urine cytology slide for evidence of cytological atypia for bladder cancer screening
- Multivariable logistic regression model that is able to ascertain a risk estimate for the impact of copper depletion within and around tumors on the potential for metastasis
Answer C is incorrect because it does not involve the use of any programming or computer analysis as decisions are rendered through manual assessment. Answer A is incorrect because it is an example of an artificial intelligence technique; however, the domain of application is not pathology but more likely found in a radiology setting. Answer D is incorrect because it represents a statistical analysis that was done to study an association between a specific treatment (copper depletion) and outcome (formation of metastasis). The emphasis for the employed algorithm was to study a potential risk factor or treatment of a health outcome rather than to make a prediction for diagnostic decision making.
Comment Here
Reference: Artificial intelligence
- Modified (smart) microscope with an added / attached accessory augmented reality unit / device that enables real time annotation / image analysis / artificial intelligence to be superimposed on a glass slide
- Requires an accessory augmented reality device to be attached to a conventional microscope, which converts this setup into a smart microscope
- Unit acquires images of a glass slide on the microscope stage in real time, which allows annotations to be superimposed in the microscope's ocular eyepiece or displayed on an attached computer monitor
- This avoids having to first photograph or scan slides in order to perform measurements, image analysis or run artificial intelligence (AI) based algorithms
- Augmented reality microscopy (ARM)
- Smart microscope
- Augmented reality (AR) technology combines reality with digital information by superimposing a computer generated digital image onto an object or user's view of the real world; this differs from virtual reality (VR), where a complete digital or computer generated environment gets generated (Med Ref Serv Q 2012;31:212)
- Examples of nonmicroscope wearable devices: AR (e.g. Google Glass, Microsoft HoloLens), VR (e.g. Oculus Rift, Samsung Gear VR) (Arch Pathol Lab Med 2018;142:638)
- Introduced into the literature by Chen et al. (Nat Med 2019;25:1453)
- A smart microscope with an attached AR device can augment additional computer generated digital information / analysis that gets overlain on the original microscopic field of view (FOV) in real time, without having to first digitize a glass slide or majorly alter traditional manual pathology workflow
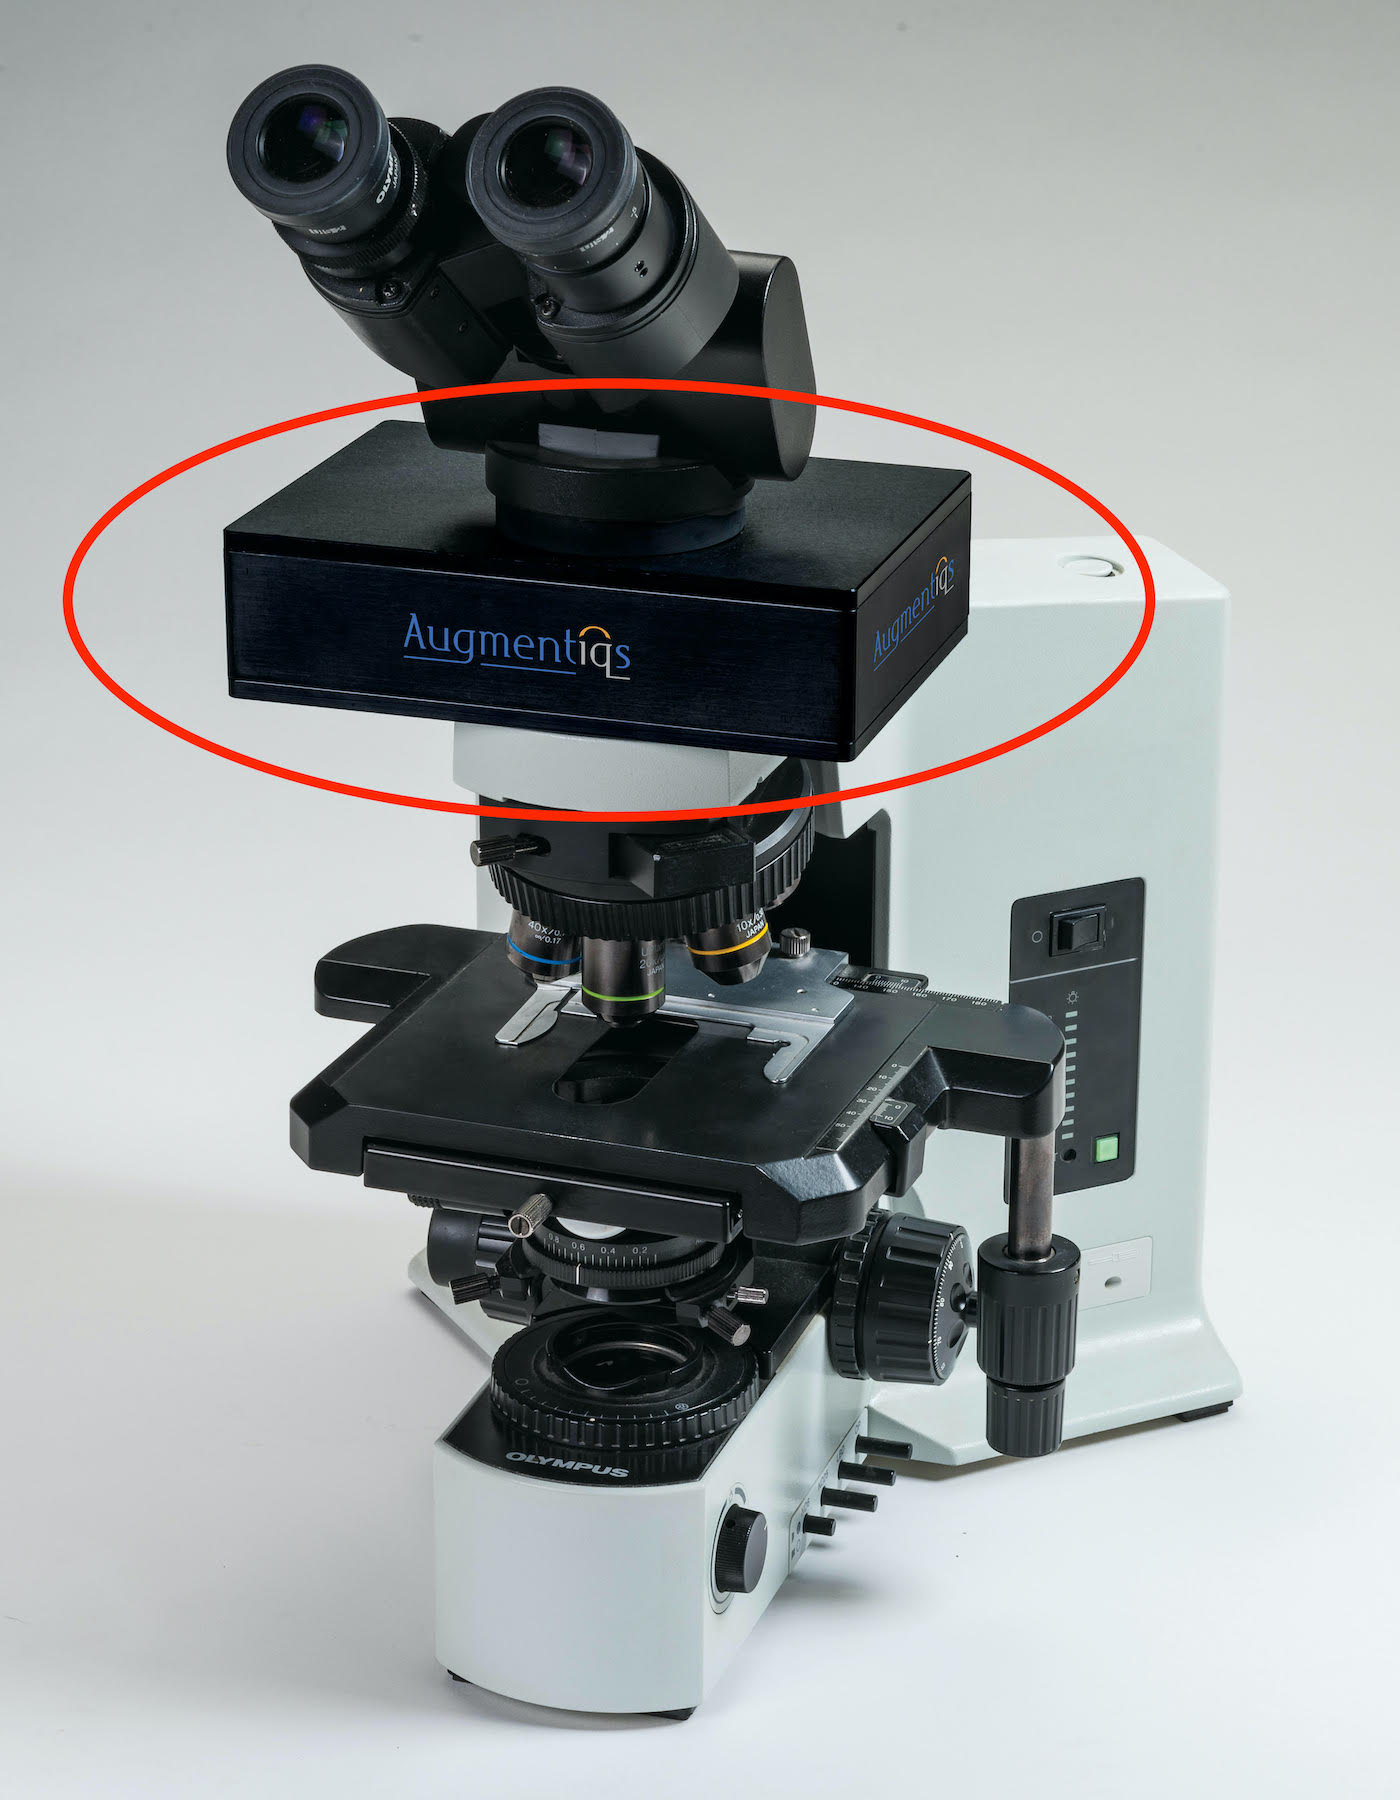
- ARM devices are commercially available from Augmentiqs
- An ARM unit can be attached to any light microscope where it is inserted between the microscope's objectives and eyepiece unit
- Computer generated images or annotations from the device get superimposed on the microscope's image visible through the ocular lens or can be displayed on an attached computer monitor
- Any compatible software application can be used to perform real time image analysis or run an AI based algorithm
Contributed by Augmentiqs
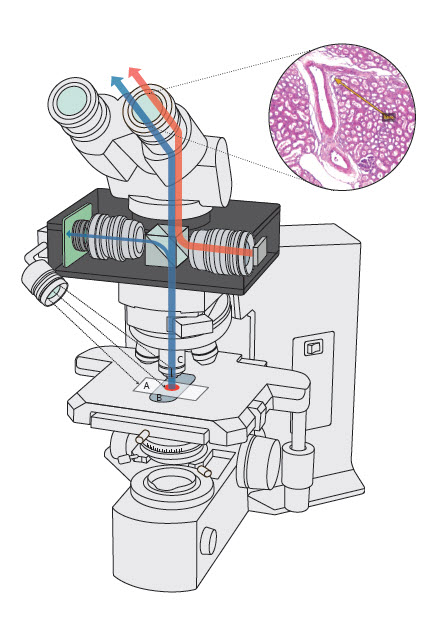
Augmented reality microscope setup
- AR device can be attached to and enhance almost any conventional light microscope
- No change to the regular function or optical quality of the microscope
- No need to digitize / photograph glass slides prior to image analysis
- Less disruption to routine workflow in a busy pathology practice
- Permits real time annotation, image analysis and AI based algorithm use
- Image overlay with AR is an advantage over conventional digital modalities
- Requires minimal technical skills to operate
- No associated simulator sickness that may occur with wearable AR / VR devices
- Possibly quicker and cheaper than a conventional whole slide scanner
- Permits real time sophisticated annotations to be superimposed on microscopic images (e.g., detection of lymph node metastases of breast carcinoma and prostate cancer detection in prostate specimens) (Nat Med 2019;25:1334)
- Enables real time image analysis and running of AI based algorithms on glass slides (e.g., Ki67 proliferation index quantification) (J Toxicol Pathol 2018;31:315, Cancer Cytopathol 2020;128:535)
- Like other traditional digital cameras attached to a microscope, the AR device can be used to acquire digital photos and transmit images (telepathology, teleconsultation, remote frozen section peer review, tumor board presentations)
- Research and teaching / education
- ARM device by Augmentiqs requires PC Windows 7 or higher and Augmentiqs software installed
- Currently, there are no standardized guidelines on validation or licensing requirements for use of ARM
Google and ARM
Augmentiqs and ARM
- Image archiving and retrieval
- Image compression
- Rapid slide scanning
- Superimposed annotation
- Z stacking
Comment Here
Reference: Augmented reality microscopy (ARM)
- Automated assessments of cytology specimens use computer algorithms to quickly and quantitatively assess cells in a cytology slide
- Assessments provide an overall estimate of atypia or locate abnormal cells
- Image recognition software, especially artificial neural networks (ANN), are often used for these assessments
- Automated assessments can reduce burden (e.g., fatigue, variability, misdiagnoses, costs) in cytology screening practices, especially in areas that use outdated methods and lack subspecialists
- Automated cytology assessments use computer vision software and artificial neural networks to quickly evaluate thousands of cells in a cytology specimen for the presence and extent of abnormal cells that may indicate atypia (J Am Soc Cytopathol 2019;8:230, Biomed Eng Comput Biol 2016;7:1)
- These assessments can improve the efficiency of cytopathology by allowing for the rapid evaluation of many cytology slides, which are traditionally time consuming and prone to error (Acta Cytol 2021;65:301)
- Accuracy of the results may be affected by factors such as the quality of the specimen, the type of specimen, the method of collection, the staining and fixation and other factors such as infections, hematuria and stones (Acta Cytol 2021;65:301)
- Techniques for automated assessment include cytometry, image recognition software and machine learning algorithms (Med Image Anal 2023;84:102691)
- Automated assessments are not meant to replace traditional cytopathology and should be reviewed by cytologists for confirmation of findings
- Whole slide image (WSI): digitized representation of tissue slide after whole slide scanning at 20x or 40x resolution (e.g., using Aperio AT2 or GT450 scanner); slide dimensionality can exceed 100,000 pixels in any given spatial dimension
- Subimage / patch: smaller, local rectangular region extracted from a WSI, often done to reduce the computational resources required for the development and deployment of machine learning algorithms (J Pathol Inform 2019;10:9)
- Z stacking: technique that combines multiple images / focus at different depths to create a 3D representation of the cells in a sample
- SurePath / ThinPrep: 2 methods for collecting and preparing cytology samples (Cytopathology 2021;32:654)
- ThinPrep imaging system: software approved by the Food and Drug Administration (FDA) for screening Pap smear slides for cervical cancer by identifying abnormal cells (Diagn Cytopathol 2021;49:559)
- Nuclear to cytoplasm ratio (N:C ratio): ratio of area of nucleus as compared to cytoplasm in cell (Cancer Cytopathol 2015;123:524)
- Higher N:C ratio suggests cellular abnormality though is dependent on cell type
- Hyperchromasia: increased pigment in nucleus of cell, causing nucleus to appear darker under microscope, suggestive of abnormality (Acta Cytol 2020;64:511)
- Frayed chromatin: refers to type of chromatin pattern in cell where chromatin is unraveled, suggestive of abnormality (Diagn Cytopathol 1986;2:76)
- Nuclear grooves: indentations in nucleus of a cell that may suggest DNA damage
- Squamous cell differentiation: refers to the degree in which a squamous cell resembles a basaloid structure; particularly important for evaluation of Pap smear specimens (Comput Methods Programs Biomed 2013;111:128)
- Cell clusters: group of cells in close arrangement (Cancer Cytopathol 2023;131:19)
- Follicular cells tend to aggregate for thyroid cytology specimens and are the primary object of interest
- Whereas in urine specimens, clusters are more likely to result from specimen type and preparation method, though fibrovascular structures and atypical clusters may factor into overall indicators of malignancy
- The Paris System (TPS): semisubjective quantitative assessment system for evaluating high grade urothelial carcinoma (J Pers Med 2022;12:170)
- Bethesda system: standardized system for interpreting cytology specimens, particularly for reporting on specimen atypia for thyroid, salivary glands and cervix cytopathology (Acta Cytol 2017;61:359)
- Fine needle aspiration: use of thin needle to collect samples of cells from tissue / organs
- Brush: use of small brush to collect cells from tissue surface
- Voided specimen: urine sample collected by urinating into a container; exfoliative
- Connected components: technique for separating individual cells or objects within an image after intensity thresholding to remove background whitespace; based on contiguous pixel elements that exceed a minimum size threshold
- Artificial intelligence: computation approaches developed to perform tasks which typically require human intelligence
- Machine learning: computational heuristics that learn patterns from data without requiring explicit programming to make decisions
- Artificial neural networks (ANN): type of machine learning algorithm that represents input data (e.g., images) as nodes
- Learns image filters (e.g., color, shapes) used to extract histomorphological / cytological features
- Comprised of multiple processing layers to represent object at multiple levels of abstraction (deep learning)
- Inspired by central nervous system (Nature 2015;521:436)
- Classification: use of computer algorithm for assigning type of object; useful for sorting out different objects in cytology specimen (e.g., debris) (Cancer Commun (Lond) 2020;40:154)
- Clustering: use of computer algorithm to group objects together, either based on similar features or spatially based on their colocalization
- Segmentation: use of a computer algorithm for pixelwise assignment of specific classes (e.g., nucleus) without specific separation of objects
- Detection: use of computer algorithm to isolate specific objects in an image and reporting of object's bounding box location (e.g., location of nuclei, cytoplasmic borders), separates conjoined nuclei, etc. (Am J Pathol 2021;191:1693)
- Generative adversarial networks (GAN): type of neural network that generates highly realistic synthetic images from input signal (e.g., noise, source image) through iterative optimization of generator, which synthesizes images and discriminator / critique which attempts to distinguish generated from real images (Mod Pathol 2021;34:808)
- Evaluation metrics: used to depict performance of automated cytology algorithm
- Accuracy: proportion of observations that were classified correctly
- Sensitivity: proportion of cases that were classified correctly at the given cutoff probability threshold
- Specificity: proportion of controls which were classified correctly at the given cutoff probability threshold
- AUC: area under the receiver operating characteristic curve, an overall measure of performance considering sensitivity / specificity reported across many cutoff thresholds
- F1 score: captures tradeoff between sensitivity / specificity
- Intersection over Union (IoU): used to evaluate accuracy of cell localization algorithm by comparing the area overlap between the predicted cell location and ground truth location to the area union between the predicted / ground truth location
- Mean average precision (mAP) averages the precision of the model across many IoU thresholds (i.e., minimum IoU between predicted / ground truth locations to indicate a true positive detection)
- Training cohort: set of cases used for training machine learning model
- Validation / test cohort: set of cases used for evaluating machine learning model
- Types of pertinent algorithms / metrics used for these assessments are denoted in the subbullet points (IEEE J Biomed Health Inform 2014;18:94, Cancer 1998;84:115, J Cytol 2011;28:98)
- Cell size: as defined by the combined cytoplasmic and nuclear area; abnormal cells may not conform to the typical cell type size
- Connected components analysis and cell detection algorithms are first used to separate cells
- Area and perimeter are common size measurements
- Cell shape: abnormal cells tend to have irregular / abnormal shapes
- Eccentricity, inferred from the major and minor axis lengths
- Other measurements that may be used to characterize cell shape include circularity, elongation, solidity and compactness, among others
- Nucleus area: see N:C ratio
- N:C ratio can be calculated using segmentation neural network or GAN, both of which can predict pixelwise presence of nucleus and cytoplasm
- Nucleus shape: see cell shape; abnormal nuclear shapes may indicate specimen atypia
- Abnormal nuclear / chromatin features: see frayed chromatin or chromatin coarseness
- Convolution or image filters may be used to identify abnormal nuclear or chromatin features
- Convolutional neural networks (CNNs) may also be used to identify and classify abnormal nuclear or chromatin features; potentially labeled by cytopathologist as present / absent or on some measurement scale
- Cytoplasmic features: examples of abnormal cytoplasmic features include presence of vacuoles / inclusions and granules where not expected
- Measures that may be used to characterize cytoplasmic features include intensity, color and texture in addition to neural network methods
- Cell / object type: useful for screening out cell types typically irrelevant for specific cytological assessment (e.g., bladder cancer - identify urothelial cells, cervical cancer - identify squamous cells, thyroid cancer - identify follicular cells, etc.)
- Machine learning algorithms or other computational techniques may be used to classify cells based on their type
- Dense / abnormal architecture: useful for identifying clusters of cells with dense overlapping cytoplasmic borders which may signify specimen atypia
- Image analysis algorithms (e.g., detection models) may be used to identify dense or abnormal cell clusters
- Subjective measure of atypia: combination of features leading to a cytopathologist determination of cytological atypia (Cancer Cytopathol 2019;127:98)
- Cytopathologists may use a combination of morphometric features, such as cell size, shape and chromatin characteristics, to subjectively evaluate the atypia of a cytology specimen
- Cell size: as defined by the combined cytoplasmic and nuclear area; abnormal cells may not conform to the typical cell type size
- Cohort selection: perform a retrospective review of cases in the institution
- Ensure diagnoses are up to date using latest cytological screening criteria; this may require reexamination from multiple cytopathologists
- Decide on patient outcome measures, usually degree of specimen atypia / diagnosis for cytology screening
- Recurrence and death as endpoints have become increasingly relevant though requires significant follow up time
- Select cases and controls based on study design type (Nephron Clin Pract 2009;113:c214, Plast Reconstr Surg 2010;126:2234)
- Retrospective cohort design: all or random subset of controls and cases are selected across a well defined study period
- Case control study: select individuals based on outcome status
- Allows for case control matching, optimal for rare events
- Cannot report negative / positive predictive value as this requires knowledge of disease prevalence
- Record relevant patient characteristics (e.g., review date, specimen type, specimen preparation, presence of slide artifact, age, sex, histological follow up, history of chemotherapy, hematuria, diagnosis, etc.)
- Divide cases and controls into training and validation cohorts
- Ensure any repeat exams / measures for specific patients are included in the same cohort to avoid endogeneity (i.e., linking information from the training to the validation / test set, reducing the capacity to generalize the study findings)
- Developing cell and cluster level algorithms (see Figure 1)
- Use connected components analysis or detection models to isolate cells and cell clusters within training cohort; randomly partition to training and validation cohorts
- Cells belonging to the same patient should be partitioned into the same cohort
- Used to calibrate cell / cluster level models / scores for external application on the test set
- Isolate individual cells from cell clusters if appropriate; this may require generating a training and validation set of clusters trained on pathologist annotations localizing cell types within adjacent / bordering cells
- Validated based on 1) IoU and mAP statistics, which assess overlap between predicted and actual cell locations; 2) cluster level metrics (e.g., correlation to ground truth based on number of cells / abnormal cells identified within each cluster)
- Train and validate several machine learning models or computer vision methods to derive cell level scores
- Requires cytopathologists to place cell types into categories if classifying / filtering cell types and outline nucleus / cytoplasm if calculating the N:C ratio
- Cell level scores can be aggregated to the cluster level to form cluster level scores
- E.g., number of abnormal cells, area of dense architecture
- E.g., essential for assessment of follicular carcinoma
- Use connected components analysis or detection models to isolate cells and cell clusters within training cohort; randomly partition to training and validation cohorts
- Form slide level scores based on aggregate cell and cluster predictors; calculate for each slide across training / validation cohorts
- May require developing thresholds for what constitutes a benign / malignant cell, etc. and either sum or calculate the proportion of cells exhibiting a specific property
- E.g., number of urothelial cells that are atypical
- Train and validate machine learning model on slide level scores to predict specimen atypia
- Incorporate patient characteristics (e.g., age, sex and medical history)
- Validate using AUC: measures the model's ability to distinguish between true positive and true negative cases
- Ensure slides within patient are partitioned to the same training / validation / test set - avoids endogeneity (i.e., linking information from the training set to the validation / test set, which can reduce the ability to generalize the study findings)
- Assess for importance of specific predictors through model interpretation
- Importance of specific predictors (e.g., cell size, shape or nuclear features) in predicting specimen atypia can be determined through feature importance, partial dependency plots or regression coefficients
- Develop web application and helpful displays to facilitate rapid and complete examination
- Highlight areas of atypia or provide other relevant information to the user
- Package software for distribution
- Making software more reproducible (PLoS Comput Biol 2017;13:e1005412, Nat Biotechnol 2017;35:342, Nat Biotechnol 2017;35:316, PLoS Comput Biol 2022;18:e1009823)
- Cell level algorithm: F1 score, sensitivity, specificity, AUC are all helpful metrics for determining whether cells and their atypia are appropriately classified (J Intern Med 2020;288:62)
- Cluster level algorithm: IoU / mAP reported within / across slides; correlate cluster level measures using correlation statistics or AUC
- Slide level algorithm: validate using the concordance statistic (e.g., AUC), comment on sensitivity / specificity for cutoff threshold; negative and positive predictive values cannot be reported for case control study designs
- Association with clinical endpoints: establish association of predicted slide level scores with specimen atypia using either hierarchical logistic or ordinal regression models; correlate each slide level feature (e.g., number of atypical cells) with these endpoints in addition to other relevant endpoints (e.g., molecular findings, etc.)
- Survival / risk stratification: how well does the overall specimen atypia estimate associate with objective markers of recurrence / survival / disease progression (e.g., transplant); is the association similar or more precise than using traditional cytological examination
- Can be assessed through Kaplan-Meier analysis or Cox proportional hazards (i.e., survival) assessment (World J Urol 2016;34:1405)
- Surveys on usability of the tool and feedback on visual displays (NPJ Digit Med 2020;3:107)
- Initial applications of computers for cellular analysis (Trans N Y Acad Sci 1955;17:250, Experientia 1955;11:163, J Pathol 2019;249:286, Best Pract Res Clin Obstet Gynaecol 2011;25:585)
- Advanced imaging techniques (Diagn Cytopathol 2019;47:5)
- Challenges developing AI systems for cytological assessment (Acta Cytol 2021;65:301)
- Reviews of digital cytology methods (Acta Cytol 2011;55:227, Med Image Anal 2023;84:102691, Cytojournal 2008;5:16, J Am Soc Cytopathol 2019;8:230, Biomed Eng Comput Biol 2016;7:1, Monogr Clin Cytol 2020;25:91)
- Whole slide imaging (Cancer Cytopathol 2017;125:701, Cytopathology 2020;31:372)
- Urine cytopathology (see Figure 1)
- AI algorithm for urine cytology (Cancer Cytopathol 2019;127:658, J Urol 1998;159:1619, Br J Urol 1998;81:574, Cytometry A 2021;99:732, BJU Int 2022;130:235, Cancer Cytopathol 2021;129:984, Cancer Cytopathol 2019;127:218)
- Examples of dataset curation (Acta Cytol 2022;66:46)
- Alignment with histological findings (Front Oncol 2022;12:901586)
- Evaluation of algorithms (Cancer Cytopathol 2022;130:872)
- Development of atypical burden score (Cancer Cytopathol 2019;127:98)
- Processing of cell clusters (Cancer Cytopathol 2023;131:19)
- Hyperchromatic nuclei (Cancer Cytopathol 2022;130:363)
- Generating synthetic images of urothelial cells (J Am Soc Cytopathol 2022;11:123, J Am Soc Cytopathol 2023;12:126)
- Thyroid cytopathology (see Figure 2)
- Machine learning applications (Arch Pathol Lab Med 2022;146:872, J Pathol Inform 2022;13:100004, J Cancer 2019;10:4876, Cancer Cytopathol 2020;128:287, Med Image Anal 2021;67:101814, J Pathol Inform 2018;9:43, Cancers (Basel) 2021;13:3891)
- Companion ancillary tool to molecular testing for indeterminate atypical cases (Cancer Cytopathol 2023;131:217)
- Cytological features (J Pathol Inform 2019;10:29)
- Review (Cytopathology 2020;31:432)
- Cervical cytopathology (see Figure 3)
- Lessons from implementing Pap test screening algorithm (Acta Cytol 2021;65:286)
- Manual versus automation assisted reading (Lancet Oncol 2011;12:56, Gynecol Oncol 2007;104:134, Diagn Cytopathol 1999;21:296, J Reprod Med 1999;44:11, Acta Cytol 2000;44:128)
- HPV screening with multiple stains (J Natl Cancer Inst 2021;113:72)
- Large scale observational / trial study with AI automation (J Natl Cancer Inst 2019;111:923, Gynecol Oncol 2020;159:171, Cancer Med 2020;9:6896, Acta Cytol 2020;64:486)
- Deep learning approaches integrating HPV information with cytology (Cancers (Basel) 2022;14:1159, Int J Med Inform 2022;159:104675, Nat Commun 2021;12:5639)
- Global health applications (JAMA Netw Open 2021;4:e211740)
- Review of automated Pap smear screening (Diagn Cytopathol 2019;47:20, NPJ Digit Med 2022;5:19, Front Oncol 2022;12:851367, Cancer Cytopathol 2022;130:402)
- Commercial systems (J Pathol Inform 2022;13:100095, Acta Cytol 2014;58:469)
- Stain normalization: standardization of staining reagents is essential for ensuring reproducibility of study findings and can be accomplished using Macenko or generative adversarial network (GAN) based methods, among others (Comput Struct Biotechnol J 2021;19:3852, Front Med (Lausanne) 2021;8:746307, Cytometry A 2022;101:1068)
- Conversion between stains for external application of stains for collaborating research institutions (Heliyon 2021;7:e06331)
- Augment dataset: provides additional, unique training samples which can improve model performance
- Data augmentation techniques: includes randomly changing stain properties, rotating / distorting images, etc. to resemble unseen cytology images (Med Image Anal 2019;58:101544)
- Neural networks that produce synthetic cytology images to increase the number of training samples (Proc Mach Learn Res 2019;116:10)
- For teaching and quality assurance (J Am Soc Cytopathol 2022;11:123, J Am Soc Cytopathol 2023;12:126)
- Transfer learning: developing a neural network on a set of related cytopathology images (e.g., thyroid), then continue to train or finetune on the specific set of related cytological images (e.g., urine) (Diagnostics (Basel) 2022;12:2477, IEEE J Biomed Health Inform 2017;21:1633)
- Methods to rapidly annotate cytology images
- Bayesian active learning: iteratively labeling images based on algorithmic uncertainty / mistakes (Sci Rep 2019;9:14347)
- Unsupervised clustering: sorts cells into groups and suggests groups to annotate (J Pathol Inform 2022;13:100146, Nat Commun 2012;3:1032, Am J Clin Pathol 2022;157:5)
- Point annotations: avoids need to outline objects in WSI (Med Image Anal 2020;65:101771, IEEE J Biomed Health Inform 2021;25:1673, IEEE Trans Med Imaging 2020;39:3655)
- Super resolution (IEEE Trans Med Imaging 2020;39:2920, IEEE Trans Med Imaging 2022;41:383 Appl Soft Comput 2022;115:108208)
- Resolve disagreements between cytopathologists or incorporate multiple ratings during model evaluation
- Consultation with biostatistician to set up multilevel modeling evaluation framework
- Interpretation techniques, such as SHAP and GradCAM, highlight important cell features and can be used to determine systematic sources of error (Nat Mach Intell 2020;2:56)
- Advantages of automated cytology assessment (Nat Rev Clin Oncol 2019;16:703, Vet Clin North Am Small Anim Pract 2023;53:73)
- Efficiency: rapid and complete analysis of large numbers of specimens
- Accuracy: less prone to error compared to manual assessment
- Objectivity: algorithms developed based on objective diagnostic criteria, reducing subjectivity and interobserver variability
- Workload: reduces workload for cytopathologists, allowing them to focus on more complex / challenging cases
- Can improve access to care in low resourced regions by either freeing up subspecialist time or reducing barriers to entry for nonspecialists
- Disadvantages of automated cytology assessment (Acta Cytol 2018;62:68, Acta Cytol 2021;65:301)
- Dependence on imaging technologies: may be prone to failure / malfunction that would require opting for the manual assessment
- May be impacted / less accurate with poor quality or abnormal specimens (e.g., deficiencies in specimen preparation or the presence of blood, imaging artifact, pixelation of cells)
- May not account for Z stacking or 3D cell modeling
- Training: likely requires time consuming and resource intensive training to familiarize use of the technology
- May not be preferred by cytopathologists unfamiliar with digital technologies as compared to analog methods, potentially leading to misuse of the technology
- Requires significant computing infrastructure investment
- False negatives: may not identify all abnormalities, potentially leading to missed diagnoses
- External application: may not be applicable to other institutions with different patient characteristics and specimen preparation methods
- Dependence on imaging technologies: may be prone to failure / malfunction that would require opting for the manual assessment
- ASAP, Qupath, ImageJ: used for annotating / isolating cytology images (Sci Rep 2017;7:16878, Comput Struct Biotechnol J 2021;19:852)
- Scikit-image, OpenCV2: image analysis frameworks (PeerJ 2014;2:e453, Comput Biol Med 2017;84:189)
- Scikit-learn: machine learning framework (J Pathol Inform 2022;13:100004)
- PyTorch, Keras, Tensorflow: deep learning frameworks (Mol Cancer Res 2022;20:202)
- Detectron2, MMDetection: cell detection frameworks (Cancer Cytopathol 2023;131:19)
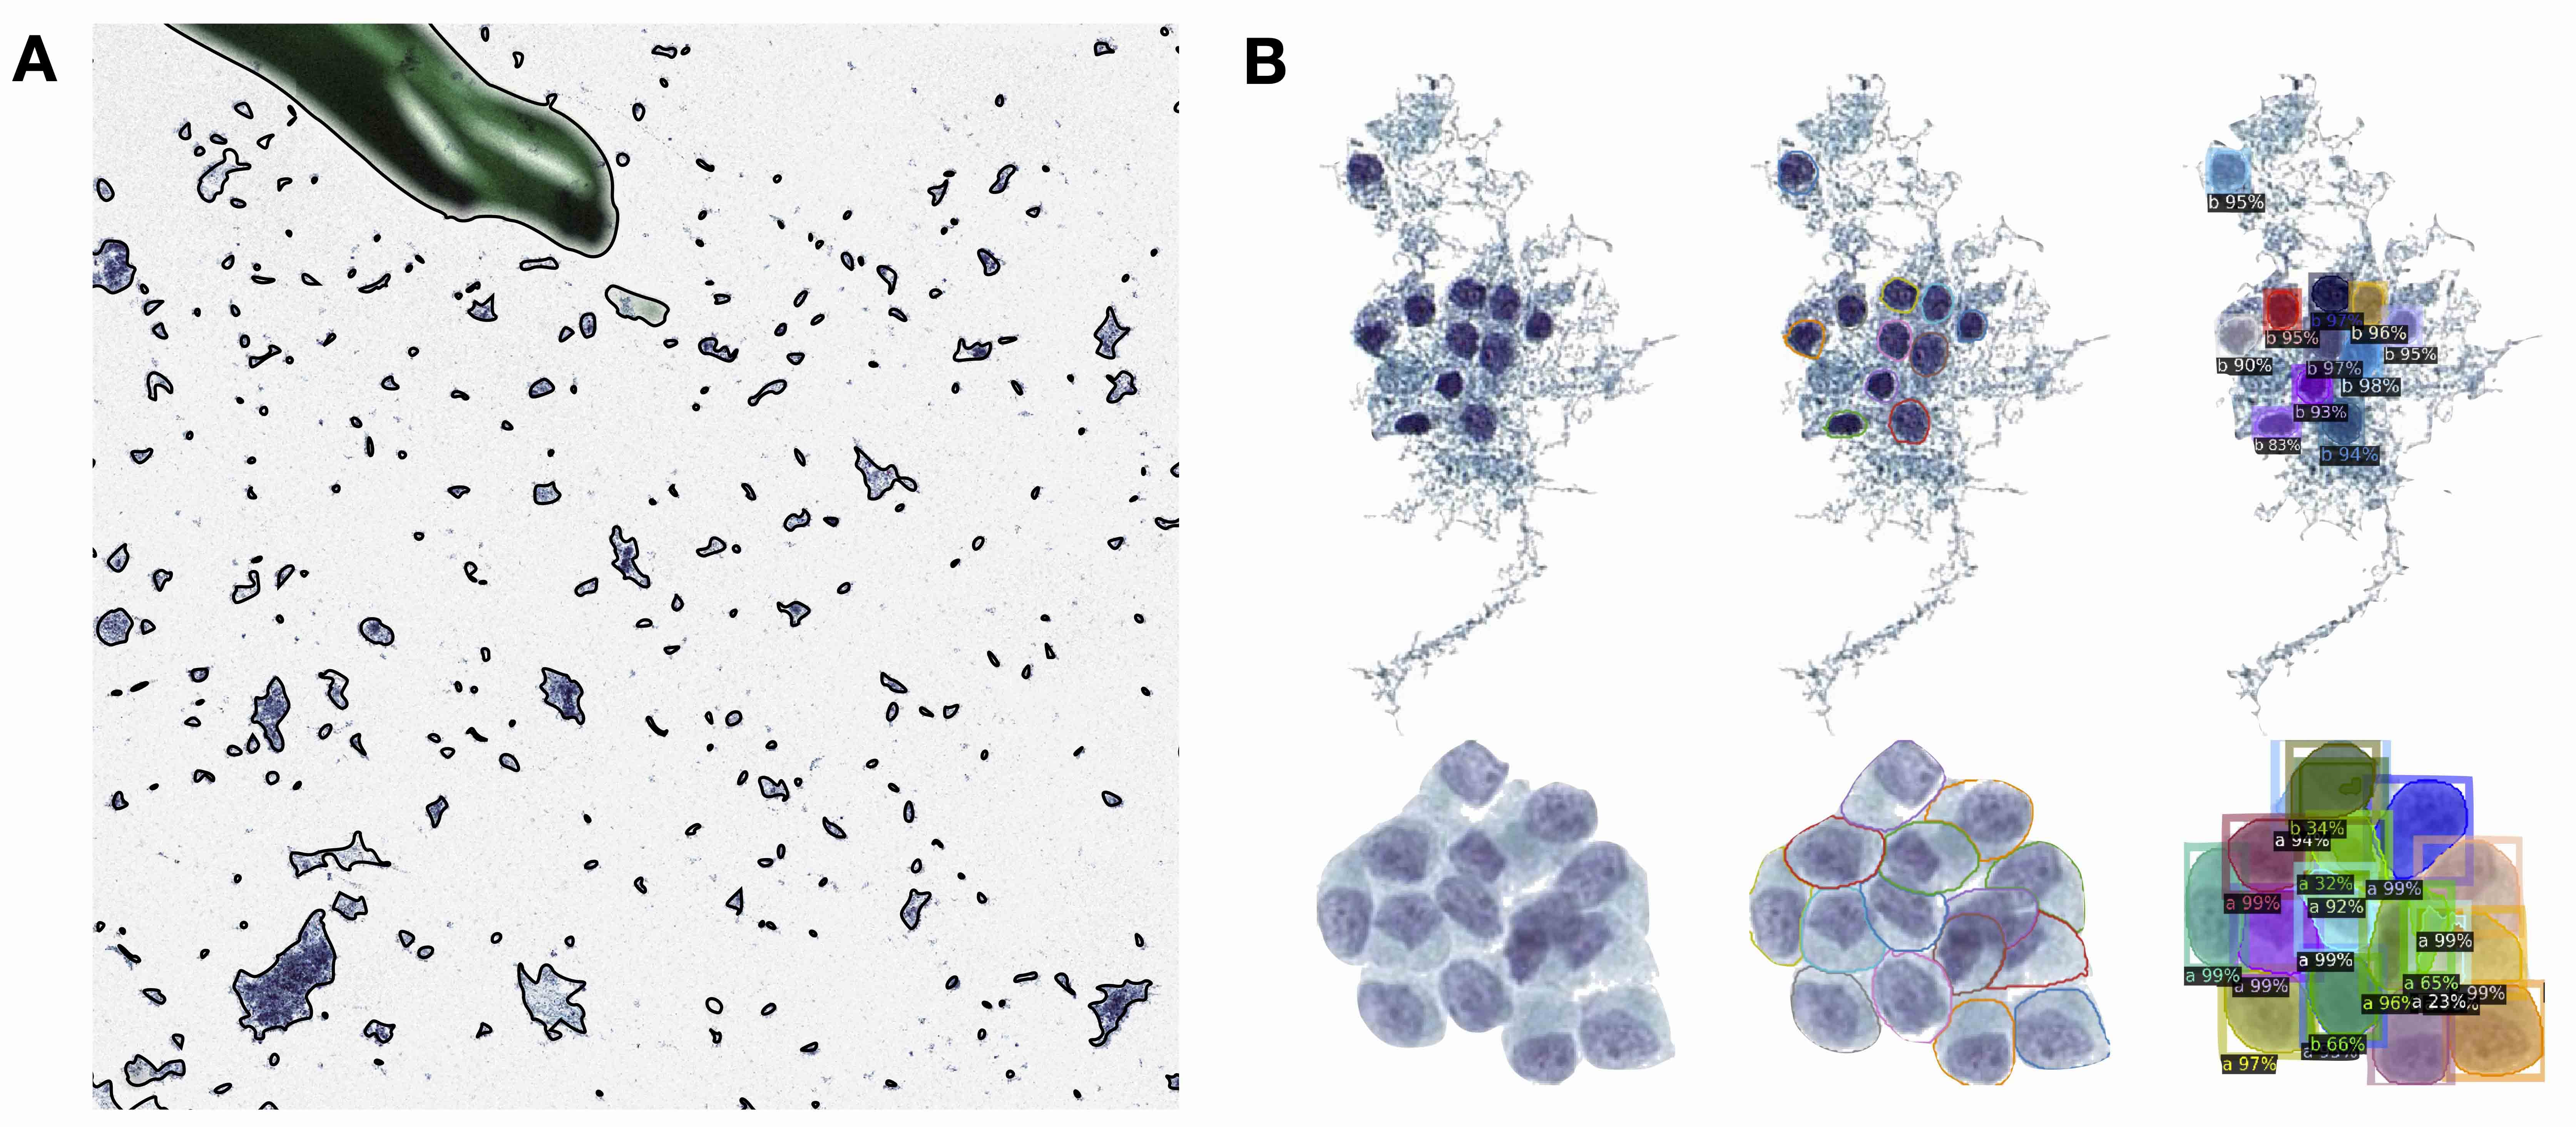
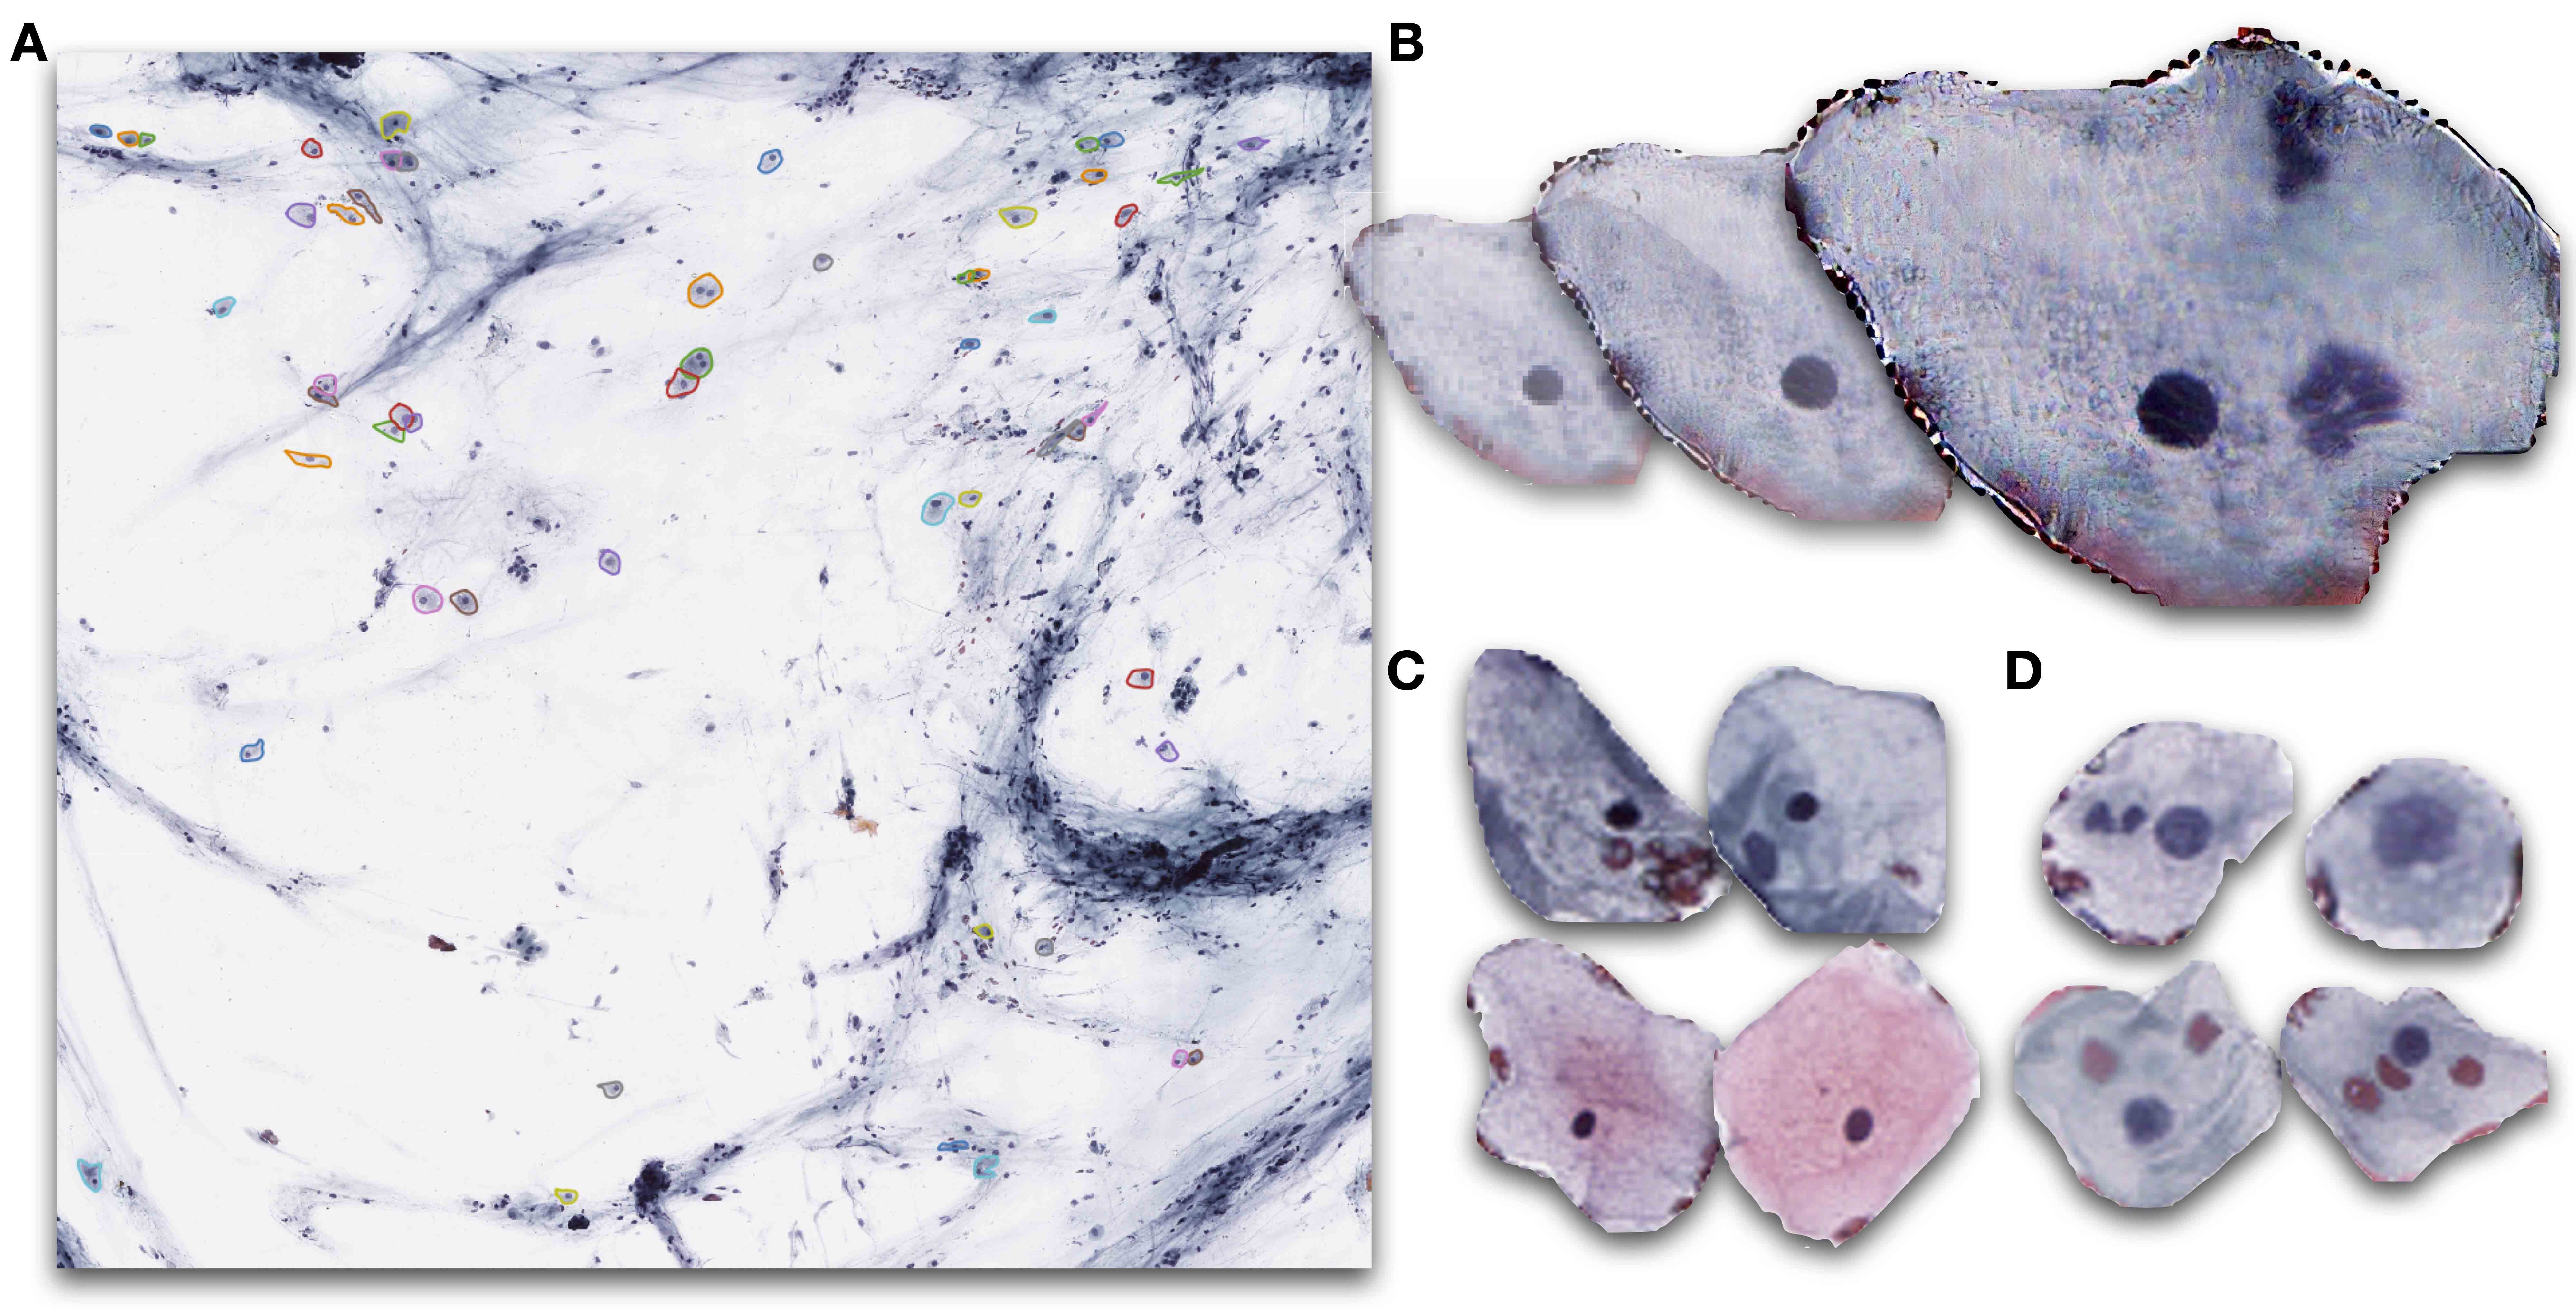
AutoParis-X Demo Tutorial
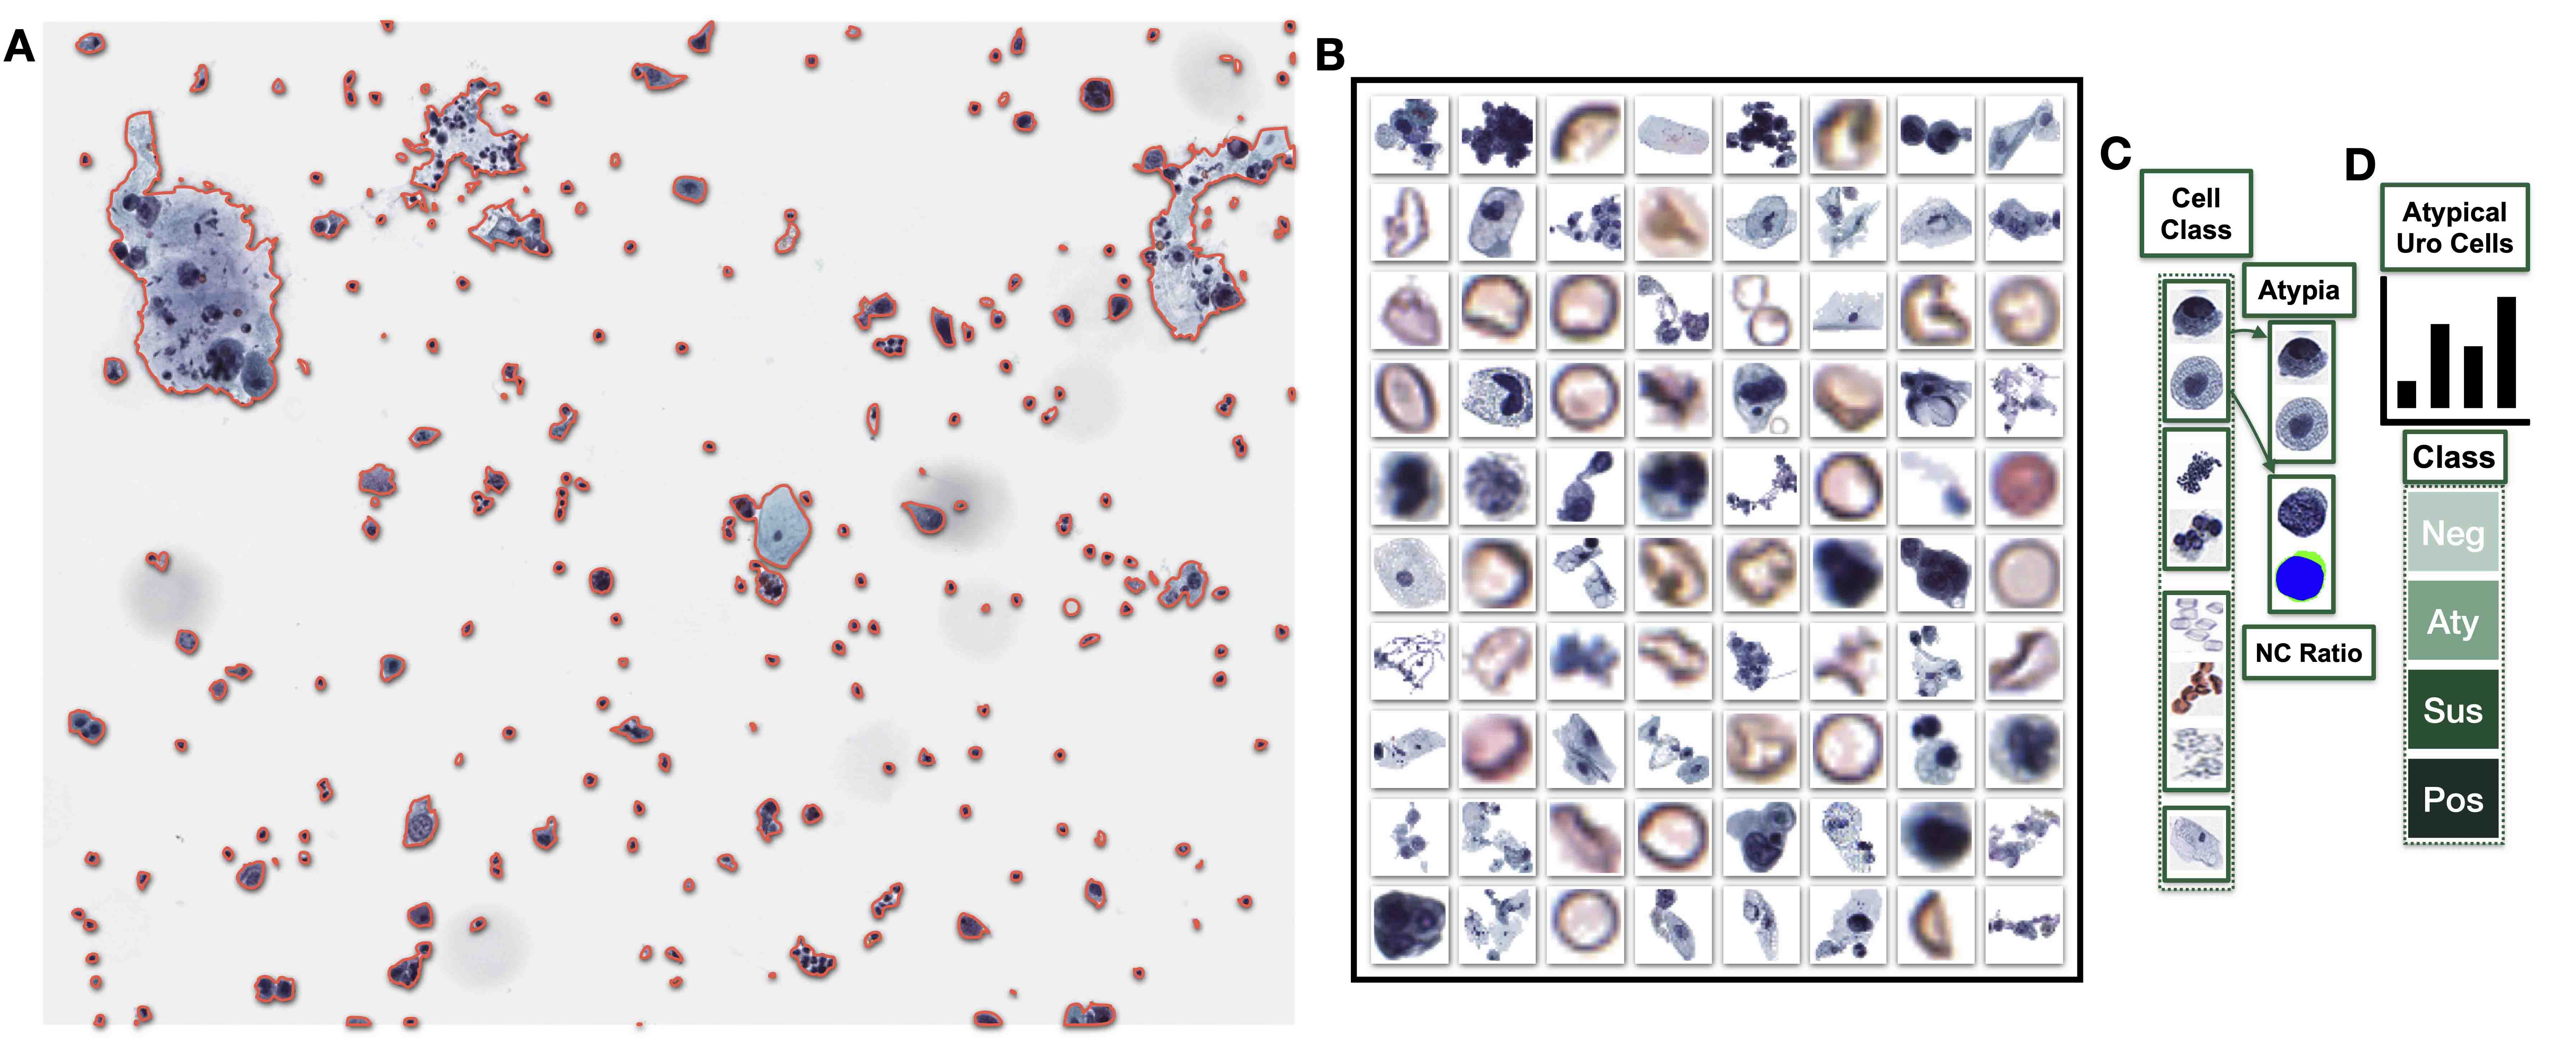
What is the primary purpose of using connected component / detection image analysis to isolate cells and cell clusters?
- To identify the location of cells within whole slide image
- To identify the number of abnormal cells within a cluster
- To identify the number of cells within a cluster
- To identify the type of cells within cluster
Comment Here
Reference: Automated assessment of cytology specimens
- To assess the overlap between predicted and actual cell locations
- To calculate the nuclear to cytoplasm (N:C) area ratio
- To determine the degree of squamous cell differentiation
- To measure the correlation between predicted and actual cluster level metrics (e.g., number of abnormal urothelial cells)
Comment Here
Reference: Automated assessment of cytology specimens
- Autoverification (AV) is the process of using computer based rules to evaluate and validate laboratory results without human interaction
- AV accomplishes 2 things
- Allows patient results to automatically flow into downstream systems that do not require intervention
- Identifies results or samples that require manual review and possible intervention by a medical laboratory technologist (MLT) (Clin Lab Med 2023;43:47)
- AV applies standard evaluation criteria with predefined rules to all results, thereby improving error rate detection and turnaround time as well as allowing staff to work at the top of their licensure and promoting operational efficiency
- Verification of laboratory test results occurs in the postanalytical phase and represents the last quality assurance measure performed before results are released into a patient data repository (Clin Biochem 2019;73:11)
- Historically, result verification was performed manually on a sample by sample and result by result basis, resulting in a tedious, repetitive, time consuming and error prone task that depends upon the experience and education of the laboratory staff
- AV is a postanalytical workflow improvement process that limits the number of test results that need to be manually reviewed by a MLT by utilizing a system of computer based rules to evaluate and validate laboratory results without human interaction
- Designing and implementing an AV system is a demanding task that requires input from several knowledge domains
- Properly designed and implemented AV systems can improve turnaround time, staff utilization, operational efficiency and error detection rates while allowing MLTs to focus on samples requiring greater human scrutiny (Clin Biochem 2019;73:11)
- Verification: method to detect and prevent reporting of errors that occur in the preanalytical, analytical or postanalytical phase
- Autoverification (AV): an automated, computer based process by which individual laboratory results are accepted or rejected for release into a patient's electronic medical record without human interaction
- AV pass rate: the percentage of analyte results that are released to the patient medical record without human intervention
- Delta checks: the process of comparing a patient's current and previous laboratory results, with specified criteria, as a quality improvement and error detection tool
- Limit checks: a predefined concentration limit established to identify samples with improbable or unlikely concentrations, at which a notification is triggered to review the result
- Consistency check: cross check of 2 or more analytes with a known correlation to identify unlikely result patterns
- Analytical measuring range (AMR)
- Laboratory information system (LIS)
- AV in the core clinical laboratory (Clin Biochem 2019;73:11)
- AV for thyroid function panels (Ann Clin Biochem 2018;55:254)
- Development and application of AV rules to urinalysis (Clin Chim Acta 2018;485:275)
- AV applied to hematology tests (Arch Pathol Lab Med 2015;139:1042, Clin Lab 2020;66, J Pathol Inform 2021;12:19)
- Application of AV in coagulation testing (Clin Lab 2014;60:143, Scand J Clin Lab Invest 2016;76:500, Int J Lab Hematol 2015;37:680)
- AV in oncology patients (J Clin Lab Anal 2019;33:e22877)
- Continuous improvement of the AV system in a single academic laboratory (J Pathol Inform 2014;5:13)
- Improvement of AV using a Six Sigma approach (Clin Biochem 2018;55:42)
- Data mining approach to AV (J Clin Lab Anal 2022;36:e24233)
- Artificial intelligence in AV (Am J Clin Pathol 2016;146:227, Clin Lab Med 2023;43:47)
- Development of an LIS based validation system for AV (BMC Med Inform Decis Mak 2021;21:174)
- AV system guidance and regulation
- CLSI AUTO10A (CLSI: Autoverification of Clinical Laboratory Test Results, 1st Edition, 2006)
- CLSI AUTO15 (CLSI: Autoverification of Medical Laboratory Results for Specific Disciplines, 1st Edition, 2019)
- CAP GEN.43875 (CAP: Checklist Requirement - GEN.43875 [Accessed 26 June 2023])
- ISO 15189 7.4.1.5 (ISO: Medical Laboratories - Requirements for Quality and Competence, 4th Edition, 2022)
- Quality control
- Calibration validity
- QC validity
- Instrument flags
- Flag information associated with results from the instrument
- Numerical verification intervals
- Limit checks
- Analyte specific concentration limits to identify results with improbable or unlikely concentrations
- Critical values
- Analyte specific concentration limits considered life threatening communicated via phone call from lab staff
- Analytical measuring range
- Analyte concentrations that may prompt repeat testing (low) or manual dilution (high)
- Limit checks
- Previous patient results
- Delta checks
- Consistency between 2 consecutive patient results evaluated for a predefined acceptable amount of change and time window between results
- Consistency checks
- Cross check evaluation of 2 or more analytes with a known correlation to identify unlikely patterns
- Delta checks
- Specimen quality
- Hemolysis check
- Icterus check
- Lipemia check
- Reference: Clin Biochem 2021;93:90
- Design of AV systems
- Select AV software (middleware / LIS)
- Assemble a multidisciplinary team that includes medical directors, supervisors, MLTs and information technology (IT) staff
- Develop AV algorithms
- Review current laboratory practices and avoid automating procedures that add no value
- Laboratories with limited experience in AV should begin with simple algorithms
- Higher AV pass rates can be achieved by implementing more complex algorithms after acquiring experience
- Rule types comprising AV algorithms can range from numerical verification intervals to cascading boolean rule sets
- Machine learning based approaches have been described; however, these approaches are unlikely to replace current practices in the near future (Clin Lab Med 2023;43:47)
- Complete AV programming and convert rules to computer code
- Validation of AV algorithms is required before implementation and occurs in 2 phases
- Wet testing
- Performed by analyzing samples meeting the desired criteria on the appropriate instruments and passing them through the AV system
- Samples meeting the criteria to test the AV rules may be difficult to obtain and can be generated by manipulating native samples (spiking, diluting, adding interferents)
- Dry testing
- Performed using simulated results or selecting results that meet the desired criteria from previously run samples
- Simulated results should be indistinguishable from those released from the instrument
- Wet testing
- Implementation
- AV systems should be intensively audited for several days following initial implementation and periodically after that
- AV algorithms require revalidation any time changes are made (CAP GEN.43875)
- Laboratories should maintain records of initial AV system validation and validation of any changes following implementation including thorough audit trails
- AV rules adopted by the lab should be readily available and understood by laboratory staff
- Results held for manual review should be identifiable for retrospective review
- Process to suspend the AV system is necessary and should be documented
- Monitor AV performance and continuously improve algorithms
- Test and report based AV pass rates should be monitored
- AV of laboratory test results occurs in the postanalytical phase and represents the last quality assurance measure performed before results are released into a patient data repository
- AV is a postanalytical workflow improvement process that applies a consistent set of criteria across all samples and limits the number of test results that need to be manually reviewed by a MLT (Clin Biochem 2019;73:11)
- AV pass rates of 50 - 60% are readily achievable upon initial implementation
- Pass rates > 95% can be achieved through continuous improvement
- AV can improve turnaround time, staff utilization, operational efficiency and error detection rates
- Once programmed, AV rules require strict version control processes to prevent inadvertent changes
- Different patient populations require unique AV rules, therefore, standardized AV rules do not exist
- Acquiring data released from the LIS is straightforward; however, data for samples held by AV rules need to be mined from other locations (i.e., middleware) and are not readily available
- Lack of data for rejected samples has precluded the development of AI based models (Clin Lab Med 2023;43:47)
- It is not possible to test all combinations of every rule during validation
- Continued auditing of the AV system to identify unintended occurrences is essential
- Little guidance exists regarding AV system quality standards, rule development or benchmarks to measure effectiveness (Clin Biochem 2019;73:11)
Images hosted on other servers:

Master algorithm template for biochemical tests
- A procedure used to verify new algorithms that are used for reporting test results
- A process related to reporting test results which is required for CLIA certification
- The process of using computer based rules to evaluate and validate laboratory results without human interaction
- The process of using patient results to verify the integrity of new reagents on high throughput chemistry analyzers
Comment Here
Reference: Autoverification in the core clinical laboratory
- Can improve the accuracy of test results in the clinical laboratory
- Can improve turnaround time, staff utilization, operational efficiency and error detection rates in the clinical laboratory
- Can reduce the reagent consumption of chemistry analyzers
- Improves staff satisfaction, result accuracy and the efficiency of reagent use
Comment Here
Reference: Autoverification in the core clinical laboratory
- Barcoding and tracking systems allow surgical pathology practices to be supported by computer readable information
- To achieve maximal laboratory efficiency, they standardize and automate work processes by encoding identification of specimen parts at accession, grossing, histology and pathology sign out areas
- Scanning ensures patient safety by reducing laboratory errors, increasing efficiency and allowing for quality management
- Main technologies involve barcode and radio frequency identification (RFID)
- 2 main technologies for scanning and tracking in surgical pathology are barcode and radio frequency identification
- These allow for surgical pathology practices to be supported by computer readable information for laboratories to be efficient, standardized and automated
- Barcodes exist as linear 1 dimensional barcode lines and matrix 2 dimensional barcode dot matrices
- RFID tags can be passive (no internal power source) or active (battery powered)
- 1D barcode = linear code
- 2D barcode = data matrix code = QR code
- Radio frequency identification (RFID)
- Laboratory information system (LIS) / laboratory management system (LMS)
- Quality assurance (QA) / quality control (QC)
- Barcodes (Am J Clin Pathol 2009;131:468, Surg Pathol Clin 2015;8:123)
- More accurately read information from small labels than human eye for fewer identification errors
- Can employ quality controls of checksums or check digits and internal control lines to ensure barcode is intact and read correctly or scan fails
- Can scan multiple slide and block labels at a time
- Linear 1D barcode lines: limited information in larger space
- Matrix 2D barcode dot matrix: more information in smaller space

Barcode

Data matrix
- Hardware
- Scanners
- Each barcode reader is connected to an individual computer at
- Accessioning
- Grossing stations
- Tissue processors
- Microtomy
- Staining
- Slide assembly
- Slide distribution
- Pathologist workstations
- Requires adequate computers and network bandwidth to support laboratory operations
- Includes
- Contact wands
- Laser barcode scanners
- Image based (camera) barcode readers
- Can be wired, wireless or fixed / mounted
- Are preferably omnidirectional, as they read symbologies in any orientation
- Each barcode reader is connected to an individual computer at
- Printers are essential for labeling specimen containers, cassettes and slides
- Labels include barcodes and other patient identification information (case accession number, patient name, slide number, etc.)
- Print on an adhesive label or directly onto the cassette or slide
- Printing technology includes impact (dot matrix) and nonimpact (ink jet, laser and thermal) printing
- Scanners
- Implementation involves
- Planning for which specimens need tracking and what the data will be used for
- Selecting appropriate label
- Determining the space available for hardware
- Developing a plan for IT downtime
- Assessing degree of IT support and finances
- Choosing a vendor whose software maintains interoperability with the laboratory's existing LIS, instruments and computers
- RFID (atlasRFIDstore: Active RFID vs. Passive RFID - What's the Difference? [Accessed 29 June 2021])
- Passive RFID
- Uses tags with no internal power source; instead, these tags are energized by the electromagnetic energy transmitted from an RFID reader
- Used for applications such as access control, specimen tracking, supply chain management and more
- Has lower price point per tag than active RFID tags
- Active RFID
- Uses battery powered RFID tags that broadcast their own signal
- Commonly used as beacons to accurately track the real time location of assets
- Provide much longer read range than passive tags

Roll of passive RFID tags

Example of active RFID tag

Passive versus active RFID tags
- Passive RFID


- Barcode or RFID on badges facilitates identification and login of staff to access rooms, equipment and software
- Barcoded paper requisitions can be scanned to file into document imaging systems
- During case accessioning, scanned requisitions and containers are positively identified and matched to the correct patients in the LIS
- Verification of relationship of requisitions to specimens, blocks and slides
- For accurate and safe handling and transfer between workflow steps
- To prevent mislabeled components and tissues
- Scanning requisitions or specimen containers at grossing bench can trigger tissue cassette engraver labeling on demand
- Only blocks labeled for the specimen being grossed are available
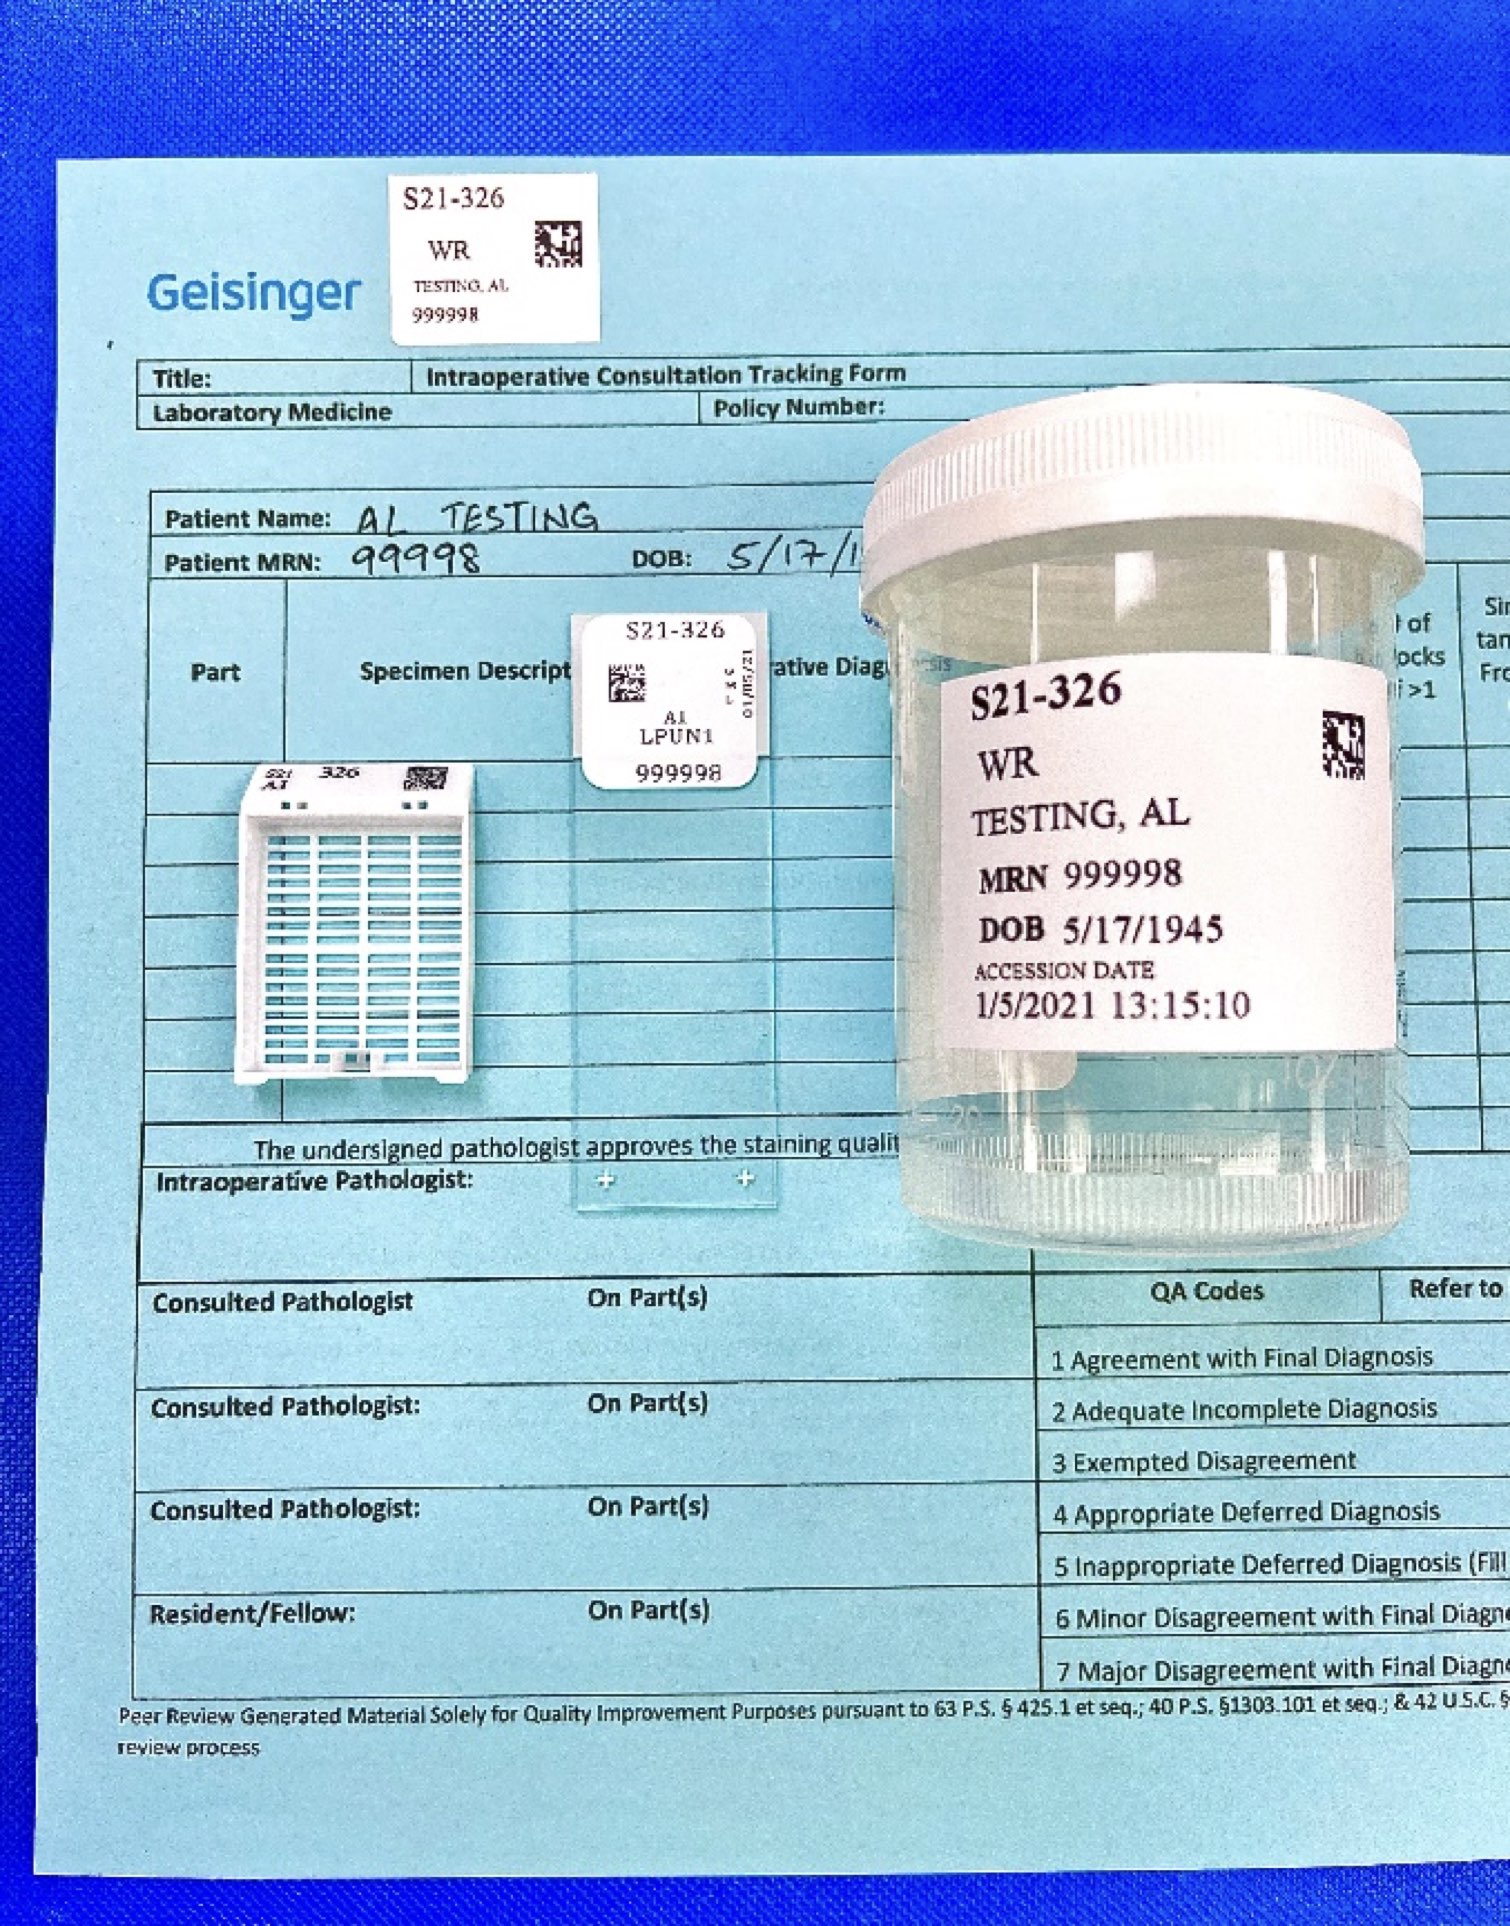
Barcoded examples
- Only blocks labeled for the specimen being grossed are available
- Scanning cassettes into tissue processing racks records
- Date and time a workflow step occurs
- Grossing staff
- Grossing station location
- Time that the fresh specimen tissue was placed in formalin
- Grouping cassettes in the racks for tracking through tissue processing
- Tissue processors and racks can be barcoded to
- Identify groups of blocks
- Specify which processor and which protocol is associated with each tissue block
- Determine appropriate handling of tissue for ancillary tests with special requirements
- Barcoding at embedding can
- Display gross description of tissue count, color and sizes
- Display gross images
- Track work unit processing
- Verify completeness of sets of slides for each case at case assembly before delivery to pathologists
- Record metrics of units worked when requisitions, specimens, blocks and slides are scanned at specific workstations under specific staff logins
- Monitor and trend time between work steps (takt time in Lean language)
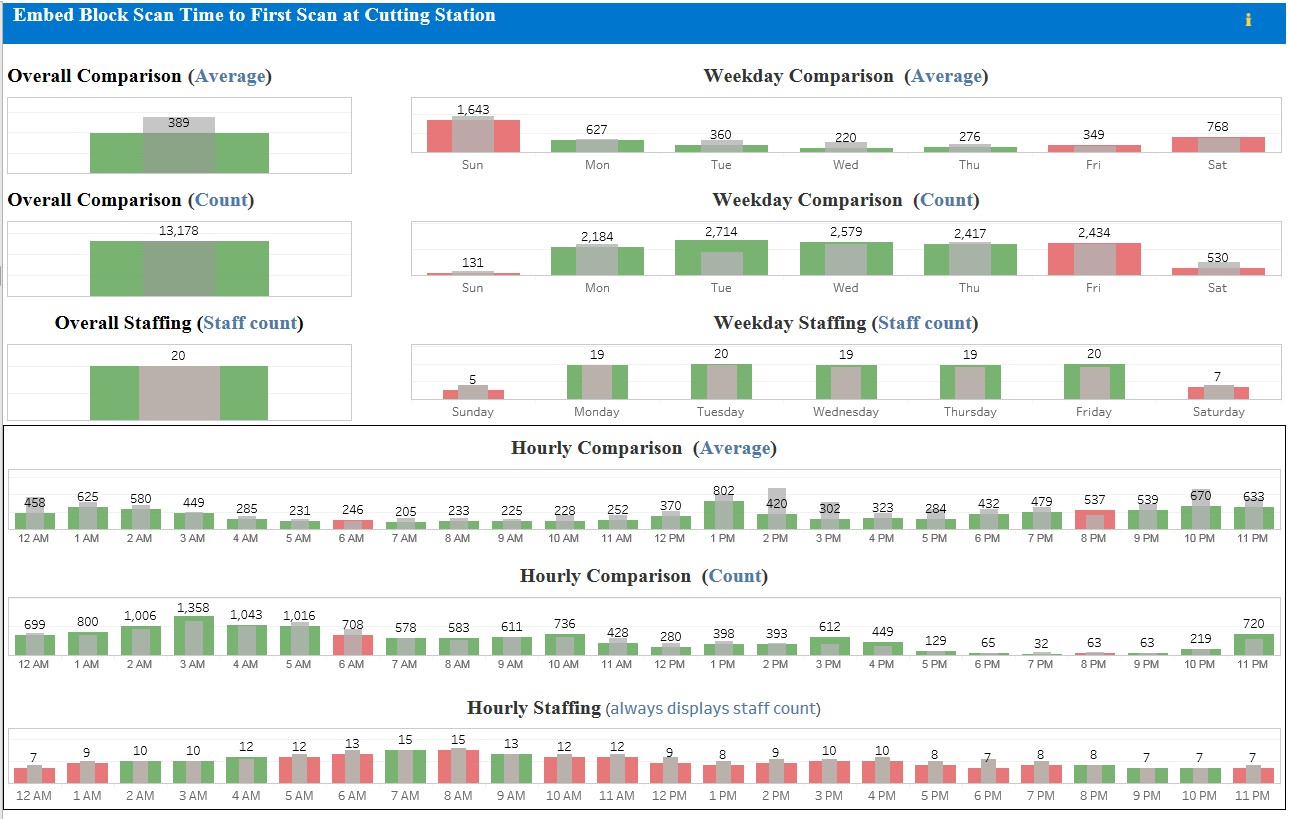
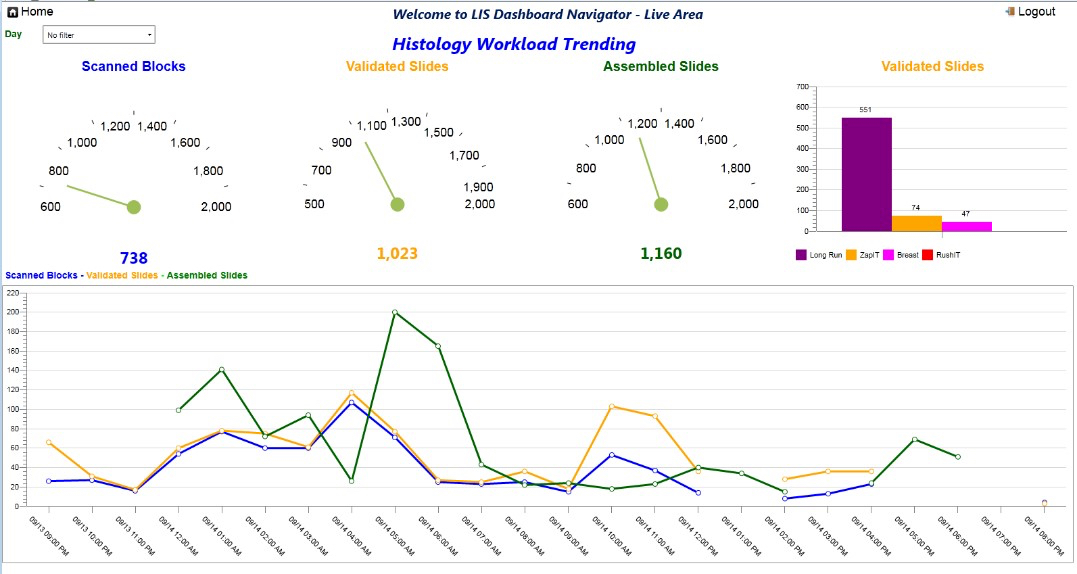
Barcode data to visualize workflow in histology
- Tablets or wall mounted monitors can facilitate visual presentation of work being done in any work area
- As graphs of barcode or RFID scans
- Visible to all staff
- Available during walkthrough by management
- Remotely accessible
- As graphs of barcode or RFID scans
- Track location for storage, retrieval and purging of specimens, blocks and slides
- Automate identification of slides for
- Assignment to pathologist
- Whole slide imaging and analysis
- Scanning a tag to open a case rather than manually typing can assure synchrony between the scanned object and the LIS context
- Reference: Clin Lab Med 2008;28:207
- Cost consideration for low volume practices
- Implementation requirements include workflow process development and modification, training, education and testing
- IT expertise for initial implementation and support
- Interoperability of the instrumentation within the AP laboratory and with the other laboratories in the same institution
- Operator error, for example, tissue mixup during grossing or embedding or slide labeling error
- Mechanical delays from poor quality label printing and label printer maintenance issues
- References: Clin Biochem 2012;45:988, Diagnostics (Basel) 2021;11:2167

What is the name of this barcode?
- Active RFID tag
- Linear 1D barcode lines
- Matrix 2D barcode dot matrix
- Passive RFID tag
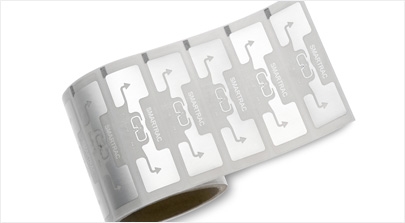
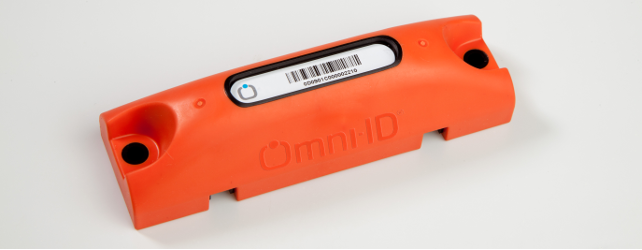
Which of the following is true about the use of RFID scanning in surgical pathology?
- Passive RFID tags are commonly used as beacons to accurately track the real time location of assets
- Passive RFID tags are more expensive than active ones
- Passive RFID tags are used for applications such as access control, specimen tracking and supply chain management
- Passive RFID tags use battery powered RFID tags that broadcast their own signal
Comment Here
Reference: Barcoding and tracking
- Human - computer interaction in the field of pathology refers to the study and application of technology and user interfaces that facilitate the interaction between pathologists and computer systems for improved diagnostic processes, data analysis and decision making in pathology
- User friendly interactive interfaces for pathology applications should provide intuitive controls, clear visual feedback and efficient navigation to maximize user satisfaction
- Usability characteristics: effective, efficient, engaging, error tolerant, easy to learn
- Digital pathology product that has high usability may be interoperable with the existing laboratory information systems (LIS); may require a minimal number of mouse clicks to operate and can improve pathologists' productivity
- Adoption of a new technology platform should involve human - computer interface considerations and assessments, such as usability testing, heuristic evaluation and cognitive walkthrough
- Interactive interface: the visual or tactile means through which a user interacts with a computer system or software application
- Usability: the ease of use and overall user experience when interacting with a system or software
- Interoperability: the ability of different software systems or devices to seamlessly exchange data or perform tasks in a collaborative manner, allowing integrated functions across various systems (e.g., LIS, electronic health records [EHR] and digital imaging systems)
- Heuristic evaluation: a process performed by usability experts to identify problems with a user interface based on a set of rules of thumb (heuristics) that makes systems easy to use
- Best practice advisory: a functionality that provides users with real time guidance, recommendations or alerts based on established best practices or clinical guidelines
- Digital pathology: technology for capturing, managing and interpreting pathology information, such as tissue samples and microscope slides, in a digital format, allowing pathologists to view and analyze high resolution images on computer screens instead of traditional microscopes and offering advanced image analysis tools for enhanced diagnostic capabilities
- Computer assisted diagnosis (CAD): the use of computer algorithms and tools to aid in the interpretation of images; systems analyze digital pathology images and provide automated assistance in identifying potential abnormalities, quantifying positive versus negative results and making diagnostic predictions
- Interactive interface design of digital products (JAMIA Open 2022;5:ooac070, Hum Factors 2017;59:101)
- Objective: a software interface that has high aesthetic quality and one which users find simple to use even for complex tasks
- Minimize the number of mouse clicks and amount of scrolling needed to complete a function
- Example: when evaluating an anatomic pathology laboratory information system (APLIS), count the number of clicks needed to electronically order an immunostain
- Streamline typing for the user
- Dropdown menu with built in options
- Autofill or autotext in word processing can automatically complete words to increase typing speed and minimize spelling errors
- Clean and minimalist graphics with appropriate use of color
- Example: green toggle for the on switch and gray toggle for the off switch
- Draw attention to key features by altering font sizes of text, bold type or weighting, italics and capitals
- Example: if there are concurrent accessions or previous pathology cases, corresponding buttons automatically change to bold font or different color to alert the pathologist
- Icons and symbols should be designed using common visual metaphors
- Can speed comprehension with intuitive design
- Enable users to pick up meanings by quick scanning
- Examples of icons of various anatomic pathology (AP) information systems (see Diagrams / tables)
- Usability (J Am Med Inform Assoc 2018;25:1197)
- Defined as the ease of use and overall user experience when interacting with a system or software; high usability can reduce errors, improve productivity and enhance user satisfaction
- 5 characteristics: effective, efficient, engaging, error tolerant, easy to learn (JAMIA Open 2022;5:ooac070)
- Examples of usability features that make an AP digital product intuitive, predictable and simple to use
- Layout should take into account the pathologist's natural workflow, which may involve entering the immunostain results prior to the diagnosis, followed by entering any flags for pending ancillary tests or second opinion and verifying the billing codes as the final step
- Use well recognized acronyms to replace complex medical terminologies to improve readability (e.g., fluorescent in situ hybridization [FISH])
- Fast and responsive interface as user moves from field to field and screen to screen
- Interaction modalities
- Besides the traditional mouse and keyboard controls, computer systems may use a variety of interaction modalities, such as touchscreen and touchless technologies (voice command and gesture based controls)
- Usability features of AP information system may include the following (Adv Anat Pathol 2012;19:81, Stud Health Technol Inform 2007;129:434)
- Interoperability: integration of the AP system with the clinical pathology laboratory information system (CPLIS) and electronic health record can facilitate pathologist workflow and care coordination
- Allows the pathologist to remain in an active window for the case while accessing one click links to previous pathology reports, surgical procedure reports, radiologic reports and clinical laboratory data
- Periodic vendor driven updates of built in synoptic templates for reporting cancer (structured, standardized style of reporting cancer data elements to ensure completeness)
- Barcode scanning of slides to ensure fast and error free patient identification
- Customizable toolbar menu and dropdown menu options that are rank ordered logically (e.g., alphabetical order or going from normal to malignant)
- Digital pathology cockpit
- Computer workstation where digitalized whole slide images can be viewed, annotated, zoomed in, shared electronically with consultants, categorized into folders for conferences or teaching and the electronic health record linked to the barcoded slides can be retrieved
- Replaces glass slides and the microscope, allowing streamlined and remote workflow (telepathology)
- Enables improved ergonomics, such as using a control console to supplement the mouse and keyboard
- Artificial intelligence can be incorporated to enhance cancer detection, automate scoring of biomarkers, etc.
- Tools for enhancing usability of CPLIS (J Pathol Inform 2017;8:40)
- Common word processing tools (such as drag and drop, cut and paste, tab to indent, etc.) can improve ease of use for pathologists reporting clinical pathology interpretations
- Customizable templates and shorthand codes that can easily be edited or added to the database
- Personalized flagging and retrieval of interesting patient results or cases warranting follow up
- Convenient and secure provider to provider communication within the LIS
- Human - computer interactive considerations for placing laboratory orders (J Am Med Inform Assoc 2018;25:1197)
- Best practice alert or advisory: popup warning that a laboratory order does not meet guidelines (e.g., ordering a genetic test for an inherited disorder more than once a lifetime)
- Hard stop (no permission to proceed with laboratory order once a built in rule is violated) versus soft stop (allowing the user to overcome an alert and proceed with the order)
- Choosing technology systems with a user friendly human - computer interface can positively impact workflow efficiency and patient safety (J Biomed Inform 2018;77:62)
- Human - computer interface is a critical factor that should be analyzed systematically before adopting a new LIS or digital pathology solution for computer assisted diagnosis
- Steps and considerations that should be taken include the following (J Biomed Inform 2004;37:56, Hum Factors 2017;59:101, Stud Health Technol Inform 2014;205:910)
- Investment in infrastructure, software, equipment and data storage
- Training and education: should include hands on exposure to promote active learning
- Interoperability with existing systems: should ideally be seamlessly integrated with the other existing LIS and electronic health record for efficient data management and sharing
- Usability testing: involves observing users as they interact with the product to identify usability issues and gather feedback; can be done through task based scenarios where users are asked to perform specific actions using the system (Stud Health Technol Inform 2011;169:915)
- Heuristic evaluation: usability experts assess the product against a set of established usability principles or rules of thumb (heuristics), identify usability issues and provide recommendations for improvements (J Med Syst 2014;38:35, BMC Med Inform Decis Mak 2022;22:157)
- Assessment may include user control and freedom, consistency and standards, recognition rather than recall and helping users recognize and recover from errors
- Cognitive walkthrough: experts evaluate the product from the perspective of the users' thought processes; evaluators simulate user interactions and systematically analyze the system's interface to identify any potential difficulties or causes for confusion (BMC Med Inform Decis Mak 2022;22:157)
- Use cognitive psychology principles with a focus on ease of learning the system
- Task analysis: breaks down complex tasks into smaller steps or actions to identify potential bottlenecks, errors or inefficiencies in the workflow, allowing for targeted improvements to enhance usability
- Data analytics: used for analyzing user interactions and usage patterns, which can provide insights into common user pathways, frequently used features and areas where users may encounter difficulties or errors; analyzing user data can help prioritize usability improvements based on real world usage patterns
- Improved diagnostic accuracy: human - computer interaction tools can enhance pathologists' ability to analyze and interpret pathology images, leading to more accurate diagnoses
- Enhanced efficiency: image analysis systems with computer assisted quantification can streamline workflow processes and speed up tedious tasks (e.g., automatic quantification of positive cells with pathologist verifying the area of interest), improving pathologists' productivity
- Access to large datasets: digital pathology systems with efficient interactive interfaces for storage, retrieval and annotation of slides provide pathologists with access to vast repositories of digitized slides, enabling research and education on a large scale
- Data driven insights: human - computer interactive tools have simplified the manipulation of complex data, allowing the pathologist to gain new insights in a more intuitive manner
- Reference: J Pathol Inform 2010;1:3
- User fatigue of best practice alerts in LIS: too many popup messages can lead to sensory overload and distraction, causing users to miss or ignore important messages (JAMIA Open 2022;5:ooac070)
- Copying and pasting patient record within the EHR for improved usability could lead to inaccuracies in documentation and should follow best practice guidelines, which may include identifying the copied text with a different font color as an alert (Appl Clin Inform 2017;8:12)
- Standardization and interoperability: ensuring compatibility and standardization across different digital pathology platforms and tools can be a challenge, hindering seamless integration and data exchange
- Learning curve and training: pathologists may require additional training to adapt to new interactive interfaces and analysis tools, potentially affecting workflow efficiency during the initial adoption phase
Examples of digital pathology platforms and their respective select usability features (Mod Pathol 2022;35:23, Hepatology 2021;74:133, Sci Rep 2017;7:16878)
| Digital pathology platform | Functionalities | Select usability features |
| PathAI | AISight: a web based, digital pathology slide viewing platform that enables algorithm driven automated analysis of whole slide images |
|
| Philips | IntelliSite Pathology Solution: slide scanner / image management and analysis system |
|
| QuPath | An open source digital pathology software that enables image analysis and annotation of digital slides using an object based model |
|


Which of the following features of a health information system is considered to be the most desirable in human - computer interactive design?
- Anatomic pathology information system that is interoperable with the digital pathology software and patient electronic health record
- Best practice popup warning when a blood transfusion order is placed showing the total number of previous blood transfusions the patient had over their lifetime
- Clinical pathology laboratory information system that allows up to 5 patient records to be opened at one time to facilitate copying and pasting of pathologist interpretation
- Surgical pathology information system that standardizes the pathologist's workflow and allows 1 field to open at a time in a predetermined order, starting with the clinical information and ending with the sign out step
Comment Here
Reference: Cognition and human - computer interaction in pathology
- Economically priced
- Intuitive icons
- Reimbursable by insurance
- Wide adoption in the market
Comment Here
Reference: Cognition and human - computer interaction in pathology
- Computational pathology is an approach to diagnosis that integrates data from numerous sources (pathology, molecular, radiology and clinical), using mathematical models to generate clinically applicable knowledge; it facilitates the best possible medical decision making by enhancing diagnostic accuracy and reduces cost by improving lab efficiency (Arch Pathol Lab Med 2014;138:1133)
- Artificial intelligence (AI): a branch of computer science dealing with the simulation of human intelligent behavior in computers; the main goal of pathology AI is to analyze digital slide images via image analysis and machine learning (Lab Invest 2021;101:412)
- Machine learning (ML): a branch of artificial intelligence where software learns to perform mathematical models by being exposed to representative data in order to generate expectations or decisions (Lab Invest 2021;101:412)
- Deep learning (DL): a class of machine learning algorithms that is composed of complex neural networks where the software trains itself to perform tasks based on unstructured or unlabeled data (Lab Invest 2021;101:412)
- Digital pathology (virtual microscopy): utilization of microscopy and digital technology to obtain images using whole slide image scanners, analyze them using image viewers (usually computer monitors) and infer digital information (Nat Rev Nephrol 2020;16:669)
- Whole slide image (WSI) (virtual slide): a high resolution copy of a glass slide that is created by a slide scanner and can be perceived on a computer screen (Nat Rev Nephrol 2020;16:669)
- Segmentation (annotation): one of the principal tasks of machine vision
- Manual segmentation (annotation) is performed by experts to define the boundaries of the object (region of interest)
- Automatic segmentation is achieved by the deep learning model that is trained to distinguish the boundaries of the object (Nat Rev Nephrol 2020;16:669)
- Supervised machine learning: analysis of labeled datasets to train or supervise algorithms to accurately predict outcomes (BMC Med Inform Decis Mak 2019;19:281)
- Unsupervised machine learning: algorithms that analyze unlabeled data sets to discover hidden patterns in data without the need for human intervention (hence, they are unsupervised) (BMC Med Inform Decis Mak 2019;19:281)
- Pathomics: the wide variety of data that results from the analysis of digitized histopathology images and generates detailed features of the entire tissue sample in whole slide images (Chin J Cancer Res 2021;33:563)
- Applications in colorectal cancer:
- Developing multiple deep learning algorithms, which can precisely categorize whole slide images of 5 types of colorectal polyps: hyperplastic, sessile serrated, traditional serrated, tubular and tubulovillous / villous polyps (J Pathol Inform 2017;8:30)
- Predicting colorectal cancer outcomes based on tissue microarray samples by a combination of convolutional neural networks and recurrent neural network architectures (Sci Rep 2018;8:3395)
- Applications in cytopathology:
- Classification of urine cytology whole slide images based on the Paris System by using morphometric algorithm and semantic segmentation network (Nat Rev Genet 2015;16:321)
- Application in prostate cancer:
- Machine learning techniques are utilized to identify either the individual genes or groups of them to predict the clinical outcome by using genomic based risk prediction models and molecular profiling (Nat Rev Genet 2015;16:321)
- Applications in breast cancer:
- Effectively analyze mitosis in a histopathological tissue sample for breast cancer grading using a convolutional neural network (CNN) and semantic segmentation (Front Bioeng Biotechnol 2019;7:145)
- Classification of breast cancer pathology images for both benign and malignant categories via convolutional neural network (Front Bioeng Biotechnol 2019;7:145)
Traditional image analysis versus computational pathology
(J Pathol 2019;249:286) |
(J Pathol Inform 2019;10:9) |
|
| Typical tasks | Detection of a morphological pattern (Lab Invest 2021;101:412) | Integration of all aspects of clinical workflow for more accurate diagnosis, prognosis and personalized treatment (Lab Invest 2021;101:412) |
| Parameter tuning | Image features / parameters are manually tuned |
Algorithm learns and extracts a large number of features automatically |
| Typical algorithm testing | Often on a few regions of the slide | Usually whole slide |
| Computer unit best suited for task | CPU (central processing unit) | GPU (graphics processing unit) |
| Number of training images required | Depending on application, may be low | Usually remarkably high |
- Standardization and normalization - inaccurate raw data and unreliable results from low quality of slide preparation, which includes
- Folding in tissue section
- Existence of air bubble
- Different sets of illumination
- Intensity discrepancy
- Average color
- Boundary intensity during scanning (Lab Invest 2021;101:412)
- Hardware limitations - requirements for precise application of computational pathology include
- Qualified big data set
- Consistent hardware and software
- Supportive network environment (Lab Invest 2021;101:412)
- Ethical issues:
- Transfer of a massive amount of health data among clinics, laboratories and data banks raise security vulnerability (Lab Invest 2021;101:412, J Med Ethics 2022;48:278)
- Inadequate transparency and inaccessibility to significant patients' data set characteristics, including race and ethnicity, which affect generalizability of the of the model (Nat Med 2020;26:1364)
- Some pathological disease classifications are highly tedious, as several categories may require pathologists to reach the decision (Lab Invest 2021;101:412)
- Inability to detect specific criteria may lead to errors in diagnosis (Lab Invest 2021;101:412)
- The strength of interobserver agreement is often average or even poor for some lesions, despite carefully explained classifications (Lab Invest 2021;101:412)
- It can segment and classify objects in H&E images
- It uses handcrafted image features, such as cell shape, to classify objects
- It learns by extracting important image features automatically from examples
- It can measure staining intensity of labeled objects from IHC images
Comment Here
Reference: Computational pathology fundamentals & applications
- Images used for training must be representative of the images that the algorithm is designed to be applied to
- To reduce bias, images used to train algorithms should be carefully selected to contain minimal artifacts
- Only a small number of images is typically required for training
- Trained algorithms should be tested in datasets that were also used for training
Comment Here
Reference: Computational pathology fundamentals & applications
- System to assist with locating histologic or cytologic findings of interest
- May be particularly relevant for
- Small or sparse pathologic findings that could potentially be missed
- Quantitation tasks in which miscounting may be likely
- By contrast, a computer aided diagnosis system is meant to help with diagnostic interpretation, such as tumor grading or subtyping a histologic or cytologic feature (i.e., "what" as opposed to "where")
- System that assists with detection or localization of findings of interest
- Requires an algorithm to detect findings and a user interface to assist the pathologist in the diagnosis
- Typically is most useful for increasing sensitivity, efficiency or quantitation
- To be effective, it typically requires
- Accurate detection algorithm
- Thoughtful user interface
- Selection of meaningful operating point(s)
- Integration with existing workflows
- Algorithm: typically a machine learning approach or more recently, convolutional neural networks (a specific type of machine learning)
- Implementation requirements
- Digital images and digital pathology workflow
- Slide digitization using whole slide scanners (Am J Surg Pathol 2018;42:39)
- Digital microscopes
- Microscope systems integrated with a computer to apply algorithms to the microscope field of view (Cornell University: Microscope 2.0 - An Augmented Reality Microscope with Real-time Artificial Intelligence Integration [Accessed 1 March 2023], Methods Cell Biol 1998;56:185)
- Potentially less change to existing clinical workflows
- Digital images and digital pathology workflow
- Computer aided detection (CADe): technology or system that detects findings of interest on medical images, typically with the goal of reducing the false negative rate
- Computer aided diagnosis (CADx): technology or system that characterizes or interprets findings on medical images (such as tumor grade)
- Model: the machine learning algorithm underlying the CADe system
- Receiver operating characteristic (ROC) curve: a plot that represents the tradeoffs between sensitivity and specificity across a range of decision thresholds
- Operating point: a specific point along a receiver operating characteristic curve, thus representing the specific diagnostic tradeoff of sensitivity and specificity at that point
- Human diagnostic performance is often represented as a single operating point for each individual
- Diagnostic algorithms often have continuous output (for example, a number between 0 and 1)
- Thus, a threshold corresponding to a specific operating point must be chosen in order to decide which regions to highlight
- Pap smear screening
- Clinical task: classification of cervical smears as negative or needing further review
- Algorithm methodology: multiple existing algorithms including convolution neural networks (Lancet 1999;353:1381, Acta Cytol 1998;42:233, Acta Cytol 1998;42:253, Cancer Lett 1994;77:155, Am J Clin Pathol 1994;101:220)
- Evaluation: extensive validation studies including FDA approval for some technologies (Comput Math Methods Med 2014;2014:842037)
- Peripheral blood smear counting
- One of the original CADe applications in pathology (Ann N Y Acad Sci 1966;128:1035)
- Clinical task: differential cell count of peripheral blood smear slides
- Algorithm methodology: convolutional neural networks, artificial neural networks (Clin Lab Haematol 2003;25:139, Am J Clin Pathol 2005;124:770)
- Evaluation: comparison of classification accuracy between automated systems (CellaVision DiffMaster Octavia and DM96) and manual differential cell counts (J Clin Pathol 2007;60:72, Clin Lab Med 2002;22:299)
- Both systems correlated well with manual counts
- Shortened review time compared with an experienced clinical laboratory scientist
- Both automated systems met the hematological lab requirements in terms of reliability and efficiency
- Mitotic counting in breast cancer
- Clinical task: mitotic counting for the histological review of breast cancer specimens
- Algorithm methodology: decision trees that distinguish between mitosis and nonmitosis using image based statistical and morphological features (J Pathol Inform 2013;4:10)
- Evaluation: automated versus manual and relabeling of manual reads (Med Image Anal 2015;20:237)
- Error rate comparable to interobserver pathologist agreement
- Classification of follicular lymphoma
- Clinical task: centroblast counting for the histological grading of follicular lymphoma
- Algorithm methodology: k-nearest neighbor classifier identifies high power fields of interest and classifies low versus high risk categories using a color coded map (BMC Med Inform Decis Mak 2015;15:115)
- Evaluation: comparison of accuracy and interrater variability with and without model assistance
- Improved accuracy, especially among residents
- Improved consistency (reduced variability) across both experts and residents
- Residents were more likely to change scores after using the computer system
- Metastatic cancer detection in lymph nodes
- Clinical task: finding metastatic breast cancer in sentinel lymph node biopsies
- Algorithm methodology: convolutional neural network identifies and highlights tumor cells in lymph nodes (Arch Pathol Lab Med 2019;143:859, JAMA 2017;318:2199)
- Evaluation: board certified pathologists digitally reviewed slides in assisted versus unassisted modes (Am J Surg Pathol 2018;42:1636)
- Increased sensitivity for micrometastases
- Shorter review time per image for micrometastases and negative images
- Image review of micrometastases is considered to be easier with assistance
- Prostate cancer detection in biopsy specimens
- Clinical task: identifying prostate cancer in needle core biopsies
- Algorithm methodology: convolutional neural network identifies tumor
- Evaluation: pathologists review biopsies, initially without assistance and immediately after with algorithm assistance that provides binary classification of suspicious or benign and with location most likely to be cancer according to the algorithm (Arch Pathol Lab Med 2023;147:1178)
- Increased sensitivity, small increase in specificity
- Small increase in efficiency
- PDL1 immunohistochemistry quantitation in lung cancer
- Clinical task: quantifying PDL1 staining in lung cancer
- Algorithm methodology: convolutional neural network to identify individual PDL1 positive cells on IHC image, followed by quantitation of positive cells
- Evaluation: assisted and unassisted concordance of tumor proportion score (TPS) performed by 3 pathologists (Eur J Cancer 2022;170:17)
- Additional evaluation against clinical outcome upon immune checkpoint inhibitor treatment and in additional cancer types (Mod Pathol 2022;35:1529)
- Increased concordance with algorithm assistance and moderately improved prediction of response to treatment associated with the algorithm provided scoring subgroups
- Development: develop a computer algorithm to accurately identify a finding of interest, which typically involves
- Collecting data: slides / images with expert labels for the findings of interest
- Training model: supervised learning if expert labels provided
- Evaluating model: using a set of images not used for training
- Inference: application of the algorithm to the images of interest (i.e., running the algorithm on the image)
- Requires digitized slides or computer integration with a microscope
- Operating points (thresholds for algorithm output) are applied to determine which finding(s) should be highlighted (typically based on validation data)
- Integration: integration with the clinical workflow is often a key challenge for an effective system and is likely unique for different uses
- Evaluation: an accurate computer algorithm may not translate directly into a useful system; its effectiveness in improving clinical workflows or patient outcomes must be evaluated
- Reference: Med Phys 2013;40:087001
- Improving efficiency: by highlighting regions of interest and reducing review time
- Improving accuracy: by highlighting small or rare lesions or cells that are easily missed
- Improving consistency: by helping to count histologic features of interest, such as immunohistochemistry quantitation, mitoses or centroblasts
- Reference: Cancer Imaging 2005;5:17
Contributed by David F. Steiner, M.D., Ph.D.

Detection of metastatic tumor in lymph nodes
Which of the following is an example of computer aided detection (CADe) in pathology?
- An algorithm that can accurately grade prostate cancer
- Comparison of algorithm performance to pathologist performance for classification of follicular lymphoma
- A system that uses an algorithm to identify mitoses on a digital pathology image and highlights those regions for review by a pathologist
- A tool that uses a machine learning algorithm to identify and report lymph node metastases without review by a pathologist
Comment Here
Reference: Computer aided detection
- The ability to apply an algorithm to pathology images
- An algorithm that can identify all possible features of interest for a given image
- Choosing an operating point for the model that is superior to pathologists for both sensitivity and specificity
- A convolutional neural network (CNN) trained to classify pathology images
Comment Here
Reference: Computer aided detection
- A computer aided diagnosis (CADx) tool in pathology is a system meant to assist with interpreting histologic or cytologic findings of interest
- May be particularly relevant in improving the reproducibility of diagnostic tasks with high subjectivity and inter-rater variability, such as histologic grading of lesions or quantitative characterization of lesion attributes (Arch Pathol Lab Med 2020;144:869, Histochem Cell Biol 2008;130:447)
- May also be helpful in assisting trainees or nonsubspecialty pathologists and allow them to make a determination of whether a referral to a more experienced pathologist or subspecialist is warranted (NPJ Digit Med 2019;2:48)
- Differs from computer aided detection (CADe), which focuses on aiding the detection and localization of lesions (FDA: Considerations for Computer-Assisted Detection Devices Applied to Radiology Images and Radiology Device Data [Accessed 1 March 2023])
- Computer aided diagnosis algorithms that interpret histologic findings need to be validated using rigorous reference standards
- A thoughtfully designed user interface is needed to effectively assist in diagnosis
- Systems need to be seamlessly integrated into the diagnostic workflow
- An effective computer aided diagnosis tool typically requires (Am J Surg Pathol 2018;42:1636)
- An accurate classification algorithm
- Thoughtful user interface that may be quite different than that for a computer aided detection tool
- Integration with existing workflows
- Algorithm: typically a machine learning approach based on feature engineering or more recently, convolutional neural networks (CNNs)
- User interface: due to the subjective nature of image interpretation and imperfections in models, an effective user interface may leverage
- Explanations: why the algorithm interpreted an image in a certain way
- Interactive tools: to allow a pathologist to correct algorithm predictions while benefiting from other features, such as quantitation
- Computer aided diagnosis: refers to a technology or system that interprets findings on medical images, such as tumor grade
- Computer aided detection: refers to a technology or system to detect findings of interest on medical images, typically with the goal of reducing the false negative rate, improving efficiency or reducing fatigue
- Model: the machine learning algorithm underlying the computer aided diagnosis system
- Reference standard: the standard against which the model is evaluated (JAMA 2019;322:1806)
- Calibration: in addition to categorizations such as yes / no, computer systems generally also produce continuous probabilities
- Calibration refers to whether these probabilities match real world rates
- For example: among 100 examples predicted to be cancer with a probability of 0.2, are ~20% of them actually cancer? (JAMA 2017;318:1377)
- While comparison of automated system accuracy to pathologist accuracy has been promising, more work describing integration into pathologist workflows and impact on diagnosis is necessary
- Breast carcinoma: classification of grade, ER status, histologic subtype and intrinsic subtype (NPJ Breast Cancer 2018;4:30)
- Key takeaway: convolutional neural network based automated system achieved > 75% accuracy at each of these tasks
- Reference standard: central pathologic review, with immunohistochemical staining for determination of ER status
- Colon polyps: classification of polyps (hyperplastic, sessile serrated, traditional serrated, tubular or tubulovillious / villious) (J Pathol Inform 2017;8:30)
- Key takeaway: convolutional neural network based automated system achieved > 90% accuracy in these classifications
- Reference standard: initial review by 2 pathologists and adjudication with a third senior pathologist in cases of disagreement
- Lung carcinoma: classification of histological subtype (Nat Med 2018;24:1559)
- Key takeaway: convolutional neural network based automated system trended toward greater accuracy than pathologists in classifying lung cancer resections as adenocarcinoma or squamous cell carcinoma
- Reference standard: diagnostic review with central pathologic confirmation
- Prostate adenocarcinoma: Gleason grading (Nat Med 2022;28:154, Lancet Oncol 2020;21:233, Lancet Oncol 2020;21:222, JAMA Oncol 2020;6:1372)
- Key takeaway: convolutional neural network based system graded resections or tissue microarrays with similar or greater accuracy than general or expert pathologists and trended toward better risk stratification
- Use of algorithm as an assistive tool resulted in higher interpathologist agreement and high concordance with urologic pathologist reference standard (JAMA Netw Open 2020;3:e2023267, Mod Pathol 2021;34:660)
- Reference standard: subspecialist provided grades and clinical outcomes
- Lymphoma: evaluation of automated systems for lymphoma classification and several other tasks (J Pathol Inform 2016;7:29)
- Key takeaway: convolutional neural network based automated system achieved 97% accuracy in distinguishing between chronic lymphocytic leukemia, follicular lymphoma and mantle cell lymphoma for region subsections of whole slide images
- Reference standard: curated dataset provided by expert pathologists
- Skin lesions: 3 classification tasks as basal cell carcinoma, dermal nevi and seborrheic keratosis (J Pathol Inform 2018;9:32)
- Key takeaway: convolutional neural network based automated system achieved > 0.99 area under the curve (AUC) in diagnosing the class of interest versus distractors
- Reference standard: prior diagnoses by pathologists
- Renal cell carcinoma: nuclear grading for clear cell renal cell carcinoma (J Pathol Inform 2014;5:23)
- Key takeaway: support vector machine (SVM) based system can help distinguish low and high grade tumors with an AUC of 0.97
- Reference standard: grades from an experienced subspecialty pathologist
- Liver cancer classification
- Key takeaway: deep learning system for liver cancer classification used as an assistant tool improved agreement with subspecialists, with a notable finding that when the model's prediction was incorrect, assistance had a negative impact on accuracy (NPJ Digit Med 2020;3:23)
- Similar to computer aided detection, use of systems for computer aided diagnosis requires algorithm development, inference and integration into pathology workflows (Arch Pathol Lab Med 2020;144:221)
- Evaluation of computer aided diagnosis systems can present challenges relative to computer aided detection due to the inherent subjectivity of image interpretation
- Algorithms can be evaluated against
- Pathologist provided annotations
- Independent gold standard (such as a molecular test)
- Clinical outcomes
- If pathologist provided annotations are used as the reference standard, steps should be taken to reduce variability from subjective interpretation and improve reproducibility of the study (Cancer 2001;91:1284, Arch Pathol Lab Med 2001;125:736, Eur Urol 2013;64:199)
- Having experienced experts with subspecialist training and substantial clinical experience provide annotations
- Using the consensus opinion of multiple experts
- Subanalyses may be useful to evaluate performance differences based on
- Characteristics of the population being evaluated, such as patient population or disease subtype
- Sensitivity to preanalytic variables such as surgical or staining protocol, imaging hardware and software postprocessing such as image compression (Nat Med 2019;25:1301, Arch Pathol Lab Med 2019;143:859)
- Improves accuracy or consistency by classifying findings in a way that is more concordant with a rigorous reference standard
- Reduces the workload of technicians and pathologists by flagging suspicious slides for review (Clin Transl Sci 2021;14:86, Med Phys 2013;40:087001)
- Evaluation of computer aided diagnosis systems can present challenges relative to computer aided detection due to the inherent subjectivity of image interpretation
- Algorithms can be evaluated against
- Pathologist provided annotations
- Independent gold standard (such as a molecular test)
- Clinical outcomes
- If pathologist provided annotations are used as the reference standard, steps should be taken to reduce variability from subjective interpretation and improve reproducibility of the study (Cancer 2001;91:1284, Arch Pathol Lab Med 2001;125:736, Eur Urol 2013;64:199)
- Having experienced experts with subspecialist training and substantial clinical experience provide annotations
- Using the consensus opinion of multiple experts
- There are many promising image analysis algorithms, as briefly and nonexhaustively summarized above
- The key next steps are
- Reference standard improvements: though much of the work so far has focused on classification compared to an existing grading system or molecular test, future work will need to focus on directly predicting clinical outcomes in order to improve patient risk stratification (Med Phys 2013;40:087001)
- Workflow integration: better understanding of how to integrate artificial intelligence algorithms into the actual workflow
- User interface: thoughtful optimization of the user interface such that pathologists can effectively integrate insights from algorithm predictions to improve diagnostic accuracy
- Measuring impact: studies to quantify the benefits of using computer aided diagnosis devices in pathology and to assess if there are negative consequences such as overdiagnosis or underdiagnosis
- Continuous monitoring: similar to postmarketing safety surveillance for approved drugs, computer aided diagnosis systems should be monitored in real use for quality control purposes
- Which of the following is a difference between computer aided detection (CADe) systems and computer aided diagnosis systems?
- CADe systems require a thoughtful user interface and integration pathology workflow, while computer aided diagnosis systems run in an automated manner
- Computer aided diagnosis systems assist in characterization or interpretation of histology, while computer aided detection systems assist in detection of findings
- Computer aided diagnosis systems need to be validated against rigorous reference standards, while CADe systems do not
- Computer aided diagnosis systems require an algorithm to assist with diagnosis, while computer aided detection systems do not
Comment Here
Reference: Computer aided diagnosis
- Which of the following is a typical goal in application of computer aided diagnosis in pathology?
- Improve consistency by making reproducible classifications on subjective tasks
- Improve consistency by showing the current grading guidelines
- Improve exhaustive review by classifying all diagnostic features of histopathology images
- Remind a pathologist of workflow tasks
Comment Here
Reference: Computer aided diagnosis
- Also referred to as ConvNet
- Convolutional neural network (CNN) is a machine learning method that is inspired by the way our visual cortex processes images through receptive fields, whereby individual retinal neurons receive stimuli from different regions of the visual field; information from multiple retinal neurons is subsequently passed on to neurons further down the chain (The Data Science Blog: A Quick Introduction to Neural Networks [Accessed 2 March 2022])
- Likewise, many CNN architectures have a feed forward neural network architecture composed of convolution and pooling (downsampling) layers, followed by 1 or more fully connected layers (J Cancer 2019;10:4876)
- Mainly used for image classification, object detection with classification, semantic segmentation and natural language processing
- Generative adversarial network (GAN): pits 2 neural networks (generator and discriminator) against each other to create realistic looking fake images; many GANs have CNNs as part of their architecture but other types of neural networks may also be used in GANs
- In machine learning, a convolutional neural network is a class of deep, feed forward artificial neural networks, most commonly applied in pathology to image classification and semantic segmentation (Wikipedia: Convolutional Neural Network [Accessed 2 March 2022])
- GANs have been used for stain normalization, virtual staining, ink dot removal, image data augmentation and synthesis of pathology images
- Neural networks, like other supervised machine learning methods, are trained using a dataset with an expected outcome and other parameters that contribute to the prediction of the outcome
- For instance, a dataset for predicting the presence of hemolysis would have entries for the patient's sex, hemoglobin levels, serum lactate dehydrogenase, serum haptoglobin, indirect bilirubin and the presence or absence of hemolysis as the target feature
- Variables that contribute to the prediction include laboratory values and parameter values called weights
- Weight values are adjusted in an iterative manner called backpropagation, where the accuracy of the neural network is assessed through a formula (loss function) and the weights are updated until it arrives at the weight values that give the best prediction accuracy
- In convolutional neural networks involving images, weights are often in the form of 3 dimensional matrices; the target feature is the class an image belongs to (e.g., benign versus malignant) and the variables that contribute to the prediction are data from the image itself
- Feed forward: refers to how the data flows from 1 layer of the network to a subsequent layer of the network; it is then further passed on to the next layer of the network after calculations are made in the preceding layer
- Transfer learning: machine learning models trained to solve 1 type of problem can be reused to solve a problem with different subject matter (e.g., a machine learning model trained on a nonhistopathological dataset like ImageNet may be utilized to categorize benign and malignant pathology images with some fine tuning or addition of another machine learning layer)
- Semantic segmentation: a pixelwise classification of objects based on image class (e.g., some CNNs may be used to highlight cancerous and stromal regions in an image with different colors) (Am J Pathol 2019;189:1686)
- The figure below illustrates the type of calculations that image data goes through in convolution and pooling operations
- Convolution operations involve an elementwise product between the filter and different segments of equal dimensions from the input matrix
- Pooling operations perform an aggregate operation (e.g., maximum or average) on a region
- In the example below, the maximum value was returned from 2 x 2 regions of the input matrix
Contributed by Jerome Cheng, M.D.
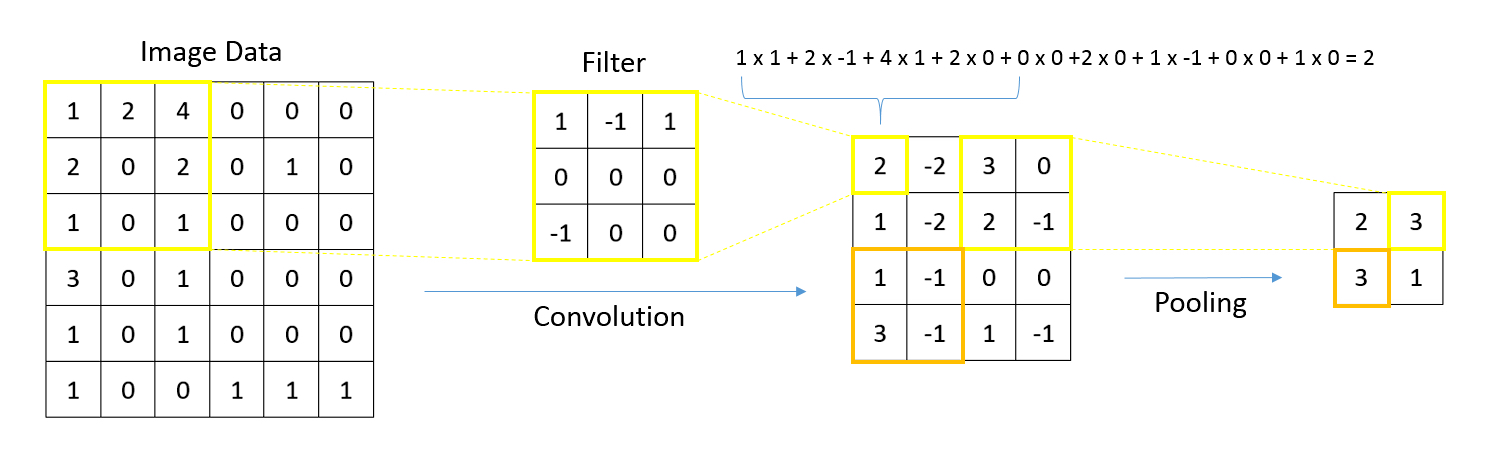
Convolution and pooling
Images hosted on other servers:

Typical CNN architecture

CNN layers in 3D

Neurons of convolutional layer connected to receptive field
- Convolution or pooling operations are carried out on information from 1 layer and the results are passed on to a deeper layer of the network
- Calculations involved in a convolutional neural network (CNN) are complex
- Fortunately, with all the tools available to us, we do not need to write a program specifying all of the mathematical operations involved
- Machine learning frameworks, such as TensorFlow and PyTorch, simplify the process of designing and training CNN models
- Reference: Nature 2015;521:436
- Image analysis through convolutional neural network (CNN) is usually performed on digital slides obtained from a whole slide scanner or an image taken through a digital camera mounted to a microscope
- Convolutional neural network architecture can be built from scratch or pretrained models can be used for image classification
- Several pretrained CNN models, such as those based on VGG-16, VGG-19, Inception v3, ResNet50, MobileNet and Efficient, are freely available on the internet and were trained on a 1,000 category subset of the ImageNet dataset
- ImageNet image database comprises over a million images belonging to thousands of classes of real world objects, such as animals, cars and tables
- Despite being trained on nonhistological images, these can still be used for analysis of pathology based image datasets, due to an overlap of low level image features (color, lines, dots, curves) in both types of images
- Training a new CNN model with a purely histopathological image dataset should further improve prediction accuracy but it would take considerable effort to collect millions of images; additionally, model training is expected to take several days to complete
- Through a process referred to as transfer learning, pretrained CNN models can produce results in minutes; in contrast, training a CNN model from scratch with a large image dataset can take days, even with the aid of a powerful GPU (graphical processing unit)
- CNNs are widely regarded as black boxes, due to the millions of parameters (weights) involved in calculations and difficulty in understanding how these arrive at a prediction; however, in some types of CNNs, class activation maps can highlight which regions in an image contributed most to the prediction (Diagnostics (Basel) 2019;9:38)
- With the increasing adoption of whole slide digital imaging solutions in pathology departments for research, education and clinical practice, CNN may be used on digital slides to aid in identifying histological structures, such as mitosis, nuclei, cancerous tissue and regions with cancer metastasis in lymph nodes
- Identification of tumor regions in digital slides / images and prediction of survival outcome based on tumor shape (Sci Rep 2018;8:10393)
- Nuclei segmentation (AMIA Jt Summits Transl Sci Proc 2018;2017:227)
- Cancer detection (PLoS One 2018;13:e0196828)
- Mitosis detection (J Med Imaging (Bellingham) 2014;1:034003)
- Automated detection of Mycobacterium tuberculosis (J Thorac Dis 2018;10:1936)
- Automated interpretation of blood culture Gram stains (J Clin Microbiol 2018;56:e01521)
- Hepatocellular carcinoma nuclei grading (Comput Biol Med 2017;84:156)
- Malaria parasite detection in blood smear images (PeerJ 2019;7:e6977)
- Lymphoma classification (Ann Clin Lab Sci 2019;49:153)
- Natural language processing (JCO Clin Cancer Inform 2019;3:1)
- Stain normalization (Sci Rep 2020;10:14398)
- Data augmentation (Math Biosci Eng 2021;18:1740)
- Virtual staining (e.g., H&E to trichrome) (Mod Pathol 2021;34:808)
- Virtually removing ink dots from digital slides (J Pathol Inform 2021;12:43)
- Synthesis of diagnostic quality images (J Pathol 2020;252:178)
- Python (programming language):
- Currently the most popular language used for machine learning
- Has several libraries for convolutional neural network (CNN)
- Orange (Biolab):
- Includes an image analysis add-on that can extract features from images using 1 of 7 pretrained CNN models: VGG-16, VGG-19, Inception v3, OpenFace, DeepLoc, Painters, SqueezeNet
- Extracted features can be combined with machine learning algorithms, such as Random Forest, to create an image classifier (e.g., benign versus malignant lesions)
- TensorFlow:
- Open source machine learning library developed by Google
- Can be used along with Python to develop a CNN architecture for classifying images
- Keras:
- High level neural network library that works on top of TensorFlow, providing a simpler programming framework for developing deep learning models
- PyTorch:
- Open source machine learning framework popular in research
- PyHIST:
- Splits a digital slide into separate tiles; whole slide images are very large so these have to be tiled into smaller and uniformly sized images before they can be processed by a CNN for training or classification
- QuPath:
- Good for whole slide image annotation (e.g., draw an outline or rectangle around cancer regions) and tiling
- Also has image analysis capabilities
- Google Colab:
- Provides a preconfigured interactive Python environment (web based) for deep learning
- Useful for running deep learning experiments with TensorFlow or PyTorch
- Convolutional neural network (CNN)
- Logistic regression
- Random Forest
- Support vector machine
Comment Here
Reference: Convolutional neural networks
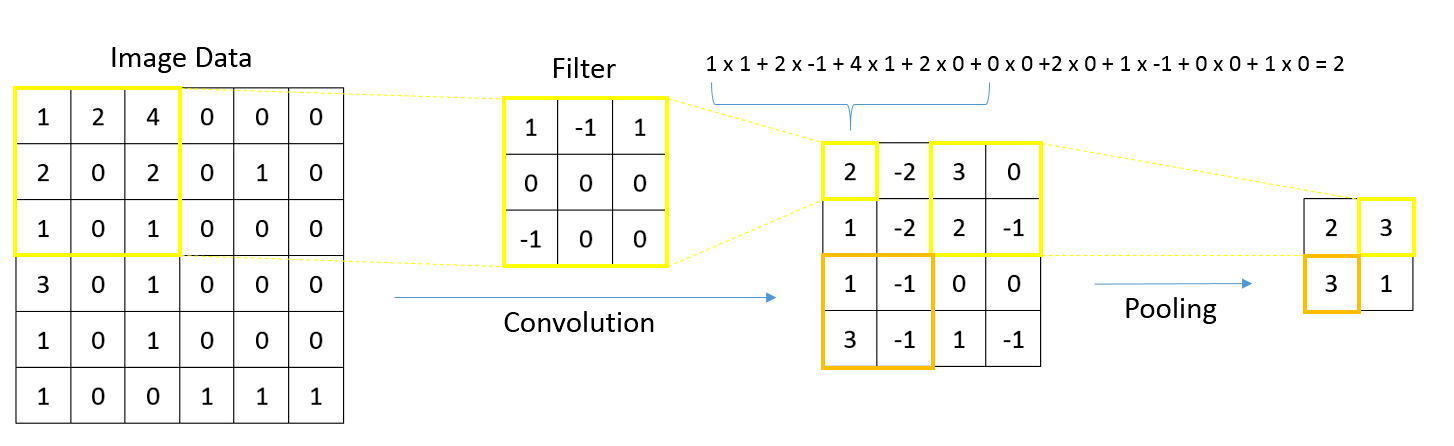
Which layer of a convolutional neural network performs a downsampling operation?
- Convolutional layer
- Fully connected layer
- Pooling layer
- ReLU layer
Comment Here
Reference: Convolutional neural networks
- Cybersecurity in pathology and laboratory medicine refers to the protection of digital systems, networks and data from cyber threats and attacks, ensuring the confidentiality, integrity and availability of patient data
- Healthcare is an attractive target for cyberattacks for potential financial gain or malicious intent since patient records contain sensitive and private information and cyber defenses are generally vulnerable (Maturitas 2018;113:48)
- Pathologists and clinical laboratory leaders should be proactive about network security, safeguarding patient information and preventing unauthorized access
- Cybersecurity strategies include implementing robust firewalls, intrusion detection / prevention systems and encryption protocols (J Appl Lab Med 2023;8:145)
- Remote access of patient information via mobile devices should involve data encryption, including for pathology reports and diagnostic images, to prevent unauthorized disclosure
- Regular system updates can ensure all software and systems used in pathology practice are up to date with the latest security patches to address known vulnerabilities
- Train pathologists and staff on cybersecurity best practices, including how to recognize phishing attempts and how to follow secure data handling protocols (Am J Clin Pathol 2022;157:814)
- Information security: involves protecting patient data and digital records from unauthorized access, ensuring confidentiality, integrity and availability
- Data breach: unauthorized access or disclosure of patient information, which compromises patient confidentiality
- Phishing link: an internet link sent by cyberattackers that downloads malware when clicked or induces victims to disclose passwords or private information
- Ransomware: a malicious software that unlawfully restricts access to computer systems or locks data and demands a ransom payment to restore access, often spread by phishing links
- Malware: encompasses various harmful software designed to damage computer systems or steal electronic information
- Cyber threat intelligence: gathering and analyzing information about cybersecurity threats to proactively implement preventive measures and respond effectively to potential risks
- Healthcare is a vulnerable industry with a high average cost per data breach due to the sensitive nature of patient records, which contain personal data and financial information (see Diagrams / tables)
- In 2019, the U.S. Food and Drug Administration (FDA) identified 11 areas of vulnerability whereby a cybercriminal could remotely control medical devices, such as changing or removing laboratory data (Digit Health 2021;7:20552076211059366)
- Hospitals and medical practices have generally lagged behind other industries in cyber defenses, making them an attractive target for cybercriminals
- WannaCry ransomware attack (AHA: Ransomware Attacks on Hospitals Have Changed [Accessed 30 August 2023])
- Global cyberattack on hospitals, medical practices and various diagnostic devices in 2017
- First ransomware to mass target medical devices, affecting 150 countries on the first day
- 1,200 devices affected and 19,000 medical appointments canceled
- Thought to be a politically motivated act of international terrorism
- Other recent incidents of cyberattack on health institutions are listed in the table below (J Med Ethics 2023;49:121, Am J Clin Pathol 2022;157:510, Int Cybersecur Law Rev 2022;3:147)
Institution Cyberattack incident Year Approximate downtime Comment 5 hospitals in the Waikato District Health Board (New Zealand) Ransomware 2021 Several weeks Attackers posted stolen data from 4,200 patients when ransom was not paid University of Vermont Medical Center Ryuk Ransomware 2020 Several weeks Malware infected 5,000 computers; disrupted elective procedures, laboratory data and medical appointments; financial loss estimated at > $63 million Dusseldorf University Hospital DoppelPaymer Ransomware 2020 Nearly 2 weeks Corrupted 30 servers and shut down emergency department, leading to fatality when patient had to be redirected to a more distant hospital LabCorp SamSam Ransomware 2018 1 week Affected multiple laboratories in the United States; impacted 7,000 systems and 1,900 servers; disrupted laboratory operations
- Defending against cyber threats
- Cybersecurity measures help pathologists and healthcare institutions defend against cyberattacks, e.g., ransomware, malware and data breaches, thus reducing potential disruption to patient care services and essential operations
- Protecting patient data
- Cyber defense strategies can safeguard patient health records and pathology data, preventing unauthorized access, theft or tampering with sensitive information
- Securing telepathology systems
- COVID pandemic has accelerated adoption of digital technologies and telepathology, creating a platform for potential security breaches
- Encrypted patient data and protected communication channels can allow pathologists to securely collaborate and share digital pathology images remotely
- Reference: Sensors (Basel) 2021;21:5119
- See figure 2 in Diagrams / tables
- Security risk assessment
- Conduct a comprehensive assessment of the pathology practice's digital infrastructure to proactively identify vulnerabilities and potential risks
- Establish cybersecurity governance
- Develop and implement policies that outline security procedures, data handling guidelines and incident response protocols
- Employee training
- Adequate training for pathologists and laboratory staff, emphasizing the importance of cybersecurity best practices
- Password management, recognizing phishing attempts, responsible use of social media and personal mobile devices and reporting security incidents (Am J Clin Pathol 2022;157:814)
- Adequate training for pathologists and laboratory staff, emphasizing the importance of cybersecurity best practices
- Network and system protection
- Regular system updates and patching to ensure all software and systems used in pathology practice contain the latest security patches to address known vulnerabilities
- A zero trust security control strategy involves performing preimplementation due diligence on all new software and network connected medical devices (J Appl Lab Med 2023;8:145)
- Deploy firewalls, intrusion detection / prevention systems and antivirus software to safeguard networks and devices
- Firewall is the first line of digital defense for protecting healthcare network from the public internet, aimed at blocking malware from being installed and preventing unauthorized access of protected health information
- Implement access controls of pathology information: employing role based remote access privileges (specific to pathologists, administrative staff and technical staff) and multifactor authentication can limit potential breaches
- Incident response plan
- Develop a clear incident response plan to rapidly address and contain cybersecurity breaches
- Data protection
- Cybersecurity measures safeguard patient data, preserving patient privacy and confidentiality of personal information
- Laboratories and hospitals have a social responsibility to proactively deter and block cyberattacks by hackers
- Continuity of services
- By preventing cyberattacks and data breaches, healthcare organizations can ensure uninterrupted access to their information systems and medical devices essential for providing patient care
- Cyberattack related downtime in pathology and laboratory information systems is associated with operational inefficiency, service disruption and an elevated risk of medical errors related to manual processes
- Regulatory and standard compliance
- Adhering to cybersecurity standards helps the pathology practice comply with data protection laws and healthcare regulations, such as the Healthcare Insurance Accountability and Portability Act of 1996 (HIPAA)
- References: J Appl Lab Med 2023;8:145, J Clin Monit Comput 2023 Apr 24 [Epub ahead of print]
- Practical issues related to cost, resources and expertise
- Implementing comprehensive cybersecurity measures may involve significant initial costs and ongoing maintenance expenses; however, cyber breaches due to inadequate security can cause even more financial damage as well as loss of patient trust (Technol Health Care 2017;25:1)
- Inadequate access to cybersecurity experts knowledgeable in healthcare may be a source of vulnerability
- Human errors
- Despite security measures, human errors, such as insecure data handling and falling victim to phishing attacks, can still be a source of security risk
- Paying ransom does not guarantee easier recovery
- 80% of small to medium companies that paid the ransom historically did not receive the decryption key as promised (Digit Health 2021;7:20552076211059366)
- Evolving threats
- As cyber threats continue to evolve, staying ahead of attacks requires continuous updates and improvements to cybersecurity protocols (Technol Health Care 2017;25:1)
- Symantec Endpoint Security
- Comprehensive cybersecurity solution that offers antivirus, firewall and intrusion prevention capabilities to protect against various threats
- McAfee Total Protection
- Provides antivirus, antimalware and encryption features to safeguard data and devices from cyber threat
- Cisco Umbrella
- Cloud delivered security service that offers protection against threats, such as malware, ransomware and phishing attacks


Which of the following shows the correct definition of a term related to cybersecurity or cyberattack?
- Data encryption: harmful software designed to steal sensitive electronic information
- Firewall: a security measure that automatically triggers a police report when a cyber threat is detected
- Phishing: the practice of sending email messages to alert patients that laboratory results are available in the patient portal
- Ransomware: malicious software that locks or encrypts data, restricts access to computer systems or devices and demands a ransom payment to restore access
Comment Here
Reference: Cybersecurity
- Adopt a zero trust security control strategy that mandates due diligence conducted on all new software
- Increase staff's awareness of potential phishing attempts on their work email
- Delay implementation of software updates of the laboratory information system
- Deploy firewalls, intrusion detection / prevention systems and antivirus software
Comment Here
Reference: Cybersecurity
- Database infrastructure that compiles, manages and gives access to data and associated metadata and documentation (Ghent University: Using a Data Repository [Accessed 14 March 2024])
- Place to hold, organize logically and make data available (Harvard Medical School: Data Management Terminology [Accessed 14 March 2024])
- Tool to share, preserve and discover research outputs (NNLM: Data Glossary [Accessed 14 March 2024])
- Most healthcare data are unstructured (e.g., freeform text and images) (Healthc Inform Res 2019;25:1)
- Database management system (DBMS) is software for creating and maintaining databases
- Traditional relational databases may be inadequate for applications and analyses of high volume healthcare data
- Data warehouses and data lakes are commonly used to improve the organization and accessibility of healthcare data
- Data: refers to values; its meaning depends on the context (e.g., numbers, text, audio, images, video) (Frisse: Essentials of Clinical Informatics, Illustrated Edition, 2019, NNLM: Data Glossary [Accessed 14 March 2024])
- Data types
- Structured: follows a predefined schema (organization)
- Semistructured (i.e., schema-less or self describing data): contains elements of structured and unstructured data
- Unstructured: has no identifiable structure (Inform Med Unlocked 2023;39:101270)
- Data types
- Dataset: a collection of related data (NNLM: Data Glossary [Accessed 14 March 2024])
- Big data: refers to datasets that are too large to process on a personal computer or "high volume, high velocity or high variety information"; however, a precise definition is lacking (NNLM: Data Glossary [Accessed 14 March 2024], Gartner: Big Data [Accessed 14 March 2024], J Big Data 2022;9:3, Front Big Data 2023;6:1271639, Int J Med Inform 2018;114:57, PLoS One 2020;15:e0228987)
- Most healthcare big data are unstructured (e.g., freeform text from clinical notes and clinical images) (Healthc Inform Res 2019;25:1)
- Database (electronic or computerized database): a structured, organized collection of data stored and accessed electronically (NNLM: Data Glossary [Accessed 14 March 2024])
- Can have different structures (hierarchical, flat, object oriented, relational, graph and NoSQL databases) (see Database fundamentals)
- Database management system (DBMS): software used to create and maintain databases; it facilitates the following processes
- Database definition
- Describes the types, structures and constraints of the data to be stored (metadata)
- DBMS stores this information in the form of a database catalog or dictionary
- Database construction: storing the data on some controlled storage medium
- Database manipulation: this includes querying to retrieve data, updating the database and generating reports
- Database sharing
- By allowing multiple users and programs to access it simultaneously
- A database can be accessed with an application program
- To retrieve data, it sends queries to the DBMS
- To read, insert, delete or update data, it uses transactions
- DBMS can be centralized (i.e., 1 information storage site) or distributed (i.e., many information storage sites connected by a computer network) (Elmasri: Fundamentals of Database Systems, 7th Edition, 2015)
- Relational database management system (RDBMS)
- DBMS based on a relational data model (i.e., data stored as an ordered sequence of values [touples] and information about the relationship between data elements)
- Structured query language (SQL) is the standard computer language to interact with RDBMS (Elmasri: Fundamentals of Database Systems, 7th Edition, 2015)
- Usually focused on data consistency and structured data storage (Elmasri: Fundamentals of Database Systems, 7th Edition, 2015)
- Cannot handle most current big data applications (Laurent: Data Lakes, 1st Edition, 2020)
- DBMS based on a relational data model (i.e., data stored as an ordered sequence of values [touples] and information about the relationship between data elements)
- NoSQL database management system (NoSQL DBMS)
- Can use various data models: document based (e.g., MongoDB and CouchDB), key value stores (e.g., DynamoDB), column based (e.g., BigTable) and graph based (e.g., Neo4J and GraphBase) or hybrid (such as Cassandra, which use concepts from both key value stores and column based systems)
- Often massively distributed and focused on performance, data availability, replication and scalability
- Commonly employed for big data (Elmasri: Fundamentals of Database Systems, 7th Edition, 2015)
- Database system: composed of a database and a DBMS (Elmasri: Fundamentals of Database Systems, 7th Edition, 2015)
- Database definition
- Data warehouse: centralized data repository designed to support data analytics and business intelligence; it usually stores large amounts of historical data from different sources in an organized manner (Boddeda: Cloud Data Architectures Demystified, 2023)
- Fundamental features are (Frisse: Essentials of Clinical Informatics, Illustrated Edition, 2019)
- Subject oriented: designed with a potential question(s) in mind (Frisse: Essentials of Clinical Informatics, Illustrated Edition, 2019)
- Integrated: data extracted from different sources may need to be transformed (e.g., cleaned or reformatted) to make it comparable (Elmasri: Fundamentals of Database Systems, 7th Edition, 2015)
- Nonvolatile: loaded data should not be removed or modified (Frisse: Essentials of Clinical Informatics, Illustrated Edition, 2019)
- Time variant: data are stored for an extended time; historical data can be analyzed and used to produce trends reports (Frisse: Essentials of Clinical Informatics, Illustrated Edition, 2019, Domdouzis: Concise Guide to Databases - A Practical Introduction, 2nd Edition, 2021)
- Acronym ETL (extract, transform, load) describes how data are moved into a data warehouse (Frisse: Essentials of Clinical Informatics, Illustrated Edition, 2019)
- Tools used to handle these processes are known as ETL tools (Elmasri: Fundamentals of Database Systems, 7th Edition, 2015)
- Fundamental features are (Frisse: Essentials of Clinical Informatics, Illustrated Edition, 2019)
- Data lake: a set of centralized repositories for vast amounts of raw data (structured, semistructured or unstructured), organized into identifiable datasets, described by metadata and available on demand (Laurent: Data Lakes, 1st Edition, 2020)
- As opposed to data warehouses, data lakes
- Are not subject oriented (i.e., store data without a defined purpose) (Frisse: Essentials of Clinical Informatics, Illustrated Edition, 2019)
- Load data in their native format (i.e., store raw data) (Front Big Data 2022;5:945720)
- Transform data on demand (i.e., when needed) (Laurent: Data Lakes, 1st Edition, 2020)
- Acronym ELT (extract, load, transform) describes how data are moved into data lakes (Laurent: Data Lakes, 1st Edition, 2020)
- As opposed to data warehouses, data lakes
- Other architectures
- Data marts: similar to data warehouses but with a restricted scope (Elmasri: Fundamentals of Database Systems, 7th Edition, 2015)
- Frequently used to provide targeted views of the data to specific groups of an organization (Boddeda: Cloud Data Architectures Demystified, 2023)
- Data lakehouse: a repository that stores structured and unstructured raw data (with the scalability and flexibility of a data lake) but includes built in features to analyze data in real time (with the performance and reliability of a data warehouse) (Boddeda: Cloud Data Architectures Demystified, 2023)
- Data hub: refers to a centralized point to manage data and provide access across the organization (Boddeda: Cloud Data Architectures Demystified, 2023)
- Data mesh: distributes data ownership and governance across different teams or domains; each of them is responsible for the quality and accessibility of their data (Boddeda: Cloud Data Architectures Demystified, 2023)
- Data fabric: provides a unified data view across different systems and applications; it enables data integration and management (Boddeda: Cloud Data Architectures Demystified, 2023)
- Data marts: similar to data warehouses but with a restricted scope (Elmasri: Fundamentals of Database Systems, 7th Edition, 2015)
- To store and manage digital pathology images and associated data so they can
- Be easily accessed, reviewed and shared with other pathologists
- Be utilized for research (see Digital imaging fundamentals & standards) or educational purposes (see Education)
- To store other laboratory data
- For billing and quality control purposes (see Database fundamentals) (Semin Diagn Pathol 2019;36:294)
- To integrate laboratory data with other healthcare data
- For data analytics and artificial intelligence (AI) based decision support tools (Nat Methods 2023;20:475, Trends Cancer 2024;10:147, J Pathol Inform 2023;15:100347)
- Integrating data from heterogeneous sources, achieving regulatory compliance and protecting data quality and privacy can be challenging (Big Data Cogn Comput 2022;6:132, Inform Med Unlocked 2023;39:101270)
- Storing large amounts of data may not be affordable or profitable for some institutions (J Clin Pathol 2021;74:409)
- Hadoop and Spark are common open source big data infrastructure frameworks to store and process large datasets (Big Data Cogn Comput 2022;6:132)
- Popular data warehousing tools and services include (Big Data Cogn Comput 2022;6:132)
- Amazon Web Services (AWS)
- Microsoft Azure
- Oracle
- Snowflake platform
- IBM
- Popular data lake / lakehouse tools and services are (Big Data Cogn Comput 2022;6:132)
- Other relevant software can be found at
Data management playlist - IBM Technology
Data storage essentials playlist - IBM Technology
- PathLAKE: Pathology Image Data Lake for Analytics Knowledge & Education [Accessed 14 March 2024], Memorial Sloan Kettering Library: Artificial Intelligence - Datasets and Repositories [Accessed 14 March 2024], JMIR Form Res 2020;4:e17687, Mayo Clinic Platform: Products & Services [Accessed 14 March 2024], Springer Nature: Data Repository Guidance [Accessed 14 March 2024]
- ELT (extract, load, transform)
- ETL (extract, transform, load)
- ITE (import, transform, export)
- LTE (load, transform, export)
Comment Here
Reference: Data repositories
- Are subject oriented
- Cannot be used with healthcare data
- Cannot store raw data
- Can store unstructured data
Comment Here
Reference: Data repositories
- Laboratory information is stored and transferred using a variety of formats and standards
- Forethought about what information is captured, the format used to capture data and how it is organized can help maximize the future value of laboratory information
- Capturing information as structured data, utilizing common code sets when possible, facilitates future research, analysis and collaboration (PLoS Comput Biol 2016;12:e1005097)
- Laboratory instrumentation and information systems are increasingly operating within the larger ecosystems of enterprise information systems, increasing the complexity of networking and connectivity
- Health Level Seven (HL7) is the common messaging standard used for intralaboratory and interlaboratory communication, as well as healthcare information exchange at the enterprise level
- Binary data: the native data representation for digital systems as a collection of 1s and 0s
- String: a series of binary data representing alphanumeric characters, such as a, b, c, etc.
- Transmission Control Protocol (TCP) / Internet Protocol (IP): a collection of protocols that govern how data is transferred across the internet
- American Society for Testing and Materials (ASTM): in the context of pathology, ASTM generally refers to the E1381 and E1394 standards that define the interface used by laboratory instruments
- HL7: a collection of standards designed specifically for the exchange of healthcare information
- Structured data: data stored in an organized and unambiguous format, generally machine readable
- Unstructured data: data stored as blocks of text, human readable but not easily interpreted by a machine and may be difficult to use for analytics
- Binary data
- 1s and 0s
- Values stored in computers as electronic signals that are either on (having value 1) or off (having value 0)
- These 2 digits, 1 and 0, well represent this 2 state electronic system
- Bits / bytes:
- Each 0 or 1 is a bit (binary digit)
- Byte is a set of 8 bits or a storage measurement equal to 8 bits
- Bytes have no inherent context but must be interpreted by the computer as instructions, numeric data, textual data, etc.
- i.e. the byte 011110 0001 can represent a variety of concepts including the decimal value 97 or the letter a
- 1s and 0s
- Numeric data
- Integers: whole numbers without fractional parts; can be positive, negative or zero (e.g. -3, 0, 202)
- Unsigned: an unsigned number is always positive and can include zero (e.g. age)
- Signed: a signed number can be positive or negative (e.g. -7.2, 13)
- Floating point: contains a decimal point (e.g. 1.034, 9.81)
- Numbers can be represented by varying number of bytes, depending on the range of values required
- Textual data
- American Standard Code for Information Interchange (ASCII)
- 8 bit character coding scheme originally developed for use with teletype machines
- Typical computer code, used in most personal computers
- Example: this byte, 0010 1011, represents a decimal number of 43 and an ASCII character of a plus sign (+)
- However, ASCII (256 values) does not have enough codes to represent characters from many international alphabets, while Unicode, using 16 bits or more, can accommodate much larger character sets
- UTF-8 is a Unicode codeset that is backward compatible with ASCII and the most commonly encountered encoding in many applications
- American Standard Code for Information Interchange (ASCII)
- Unstructured data
- Is not structured via predefined data formats or is not stored in a fixed record length format
- Examples: free text comments or notes in pathology reports, free style diagnosis texts, paper based test orders
- Can be nontextual data, such as specimen images, microscopic images or data charts (e.g. flow cytometry)
- Can be mined for research purposes using natural language processing but searches may be difficult to construct, results may be unreliable and processing large data sets can be computationally intensive
- Structured data
- Data is confined to a predefined, constrained vocabulary
- May be numeric or textual data, often stored as unsigned integers (machine readable) that are mapped to text labels (human readable)
- Facilitates sharing information between information systems, acts as a shared vocabulary (see Coding) (PLoS Comput Biol 2016;12:e1005097)
- Facilitates searching for research purposes, queries are user friendly and large data sets can be searched quickly and reliably
- Data structures
- It is often necessary to aggregate numerous observations for analysis
- Organization or lack thereof may greatly influence what type of analysis may be performed and the efficiency of processing (Int J Med Inform 2017;97:293)
- Data may need to be transformed prior to processing into a format defined by the target algorithm
- Common structures include:
- Arrays
- Simple series of data of the same data type
- Often a collection of primitive data types
- i.e. strings, numeric, Boolean etc.
- Often 1 dimensional but may have 2 or more dimensions
- Objects
- Data points composed of multiple constituent elements
- Elements may be primitive data types, arrays or even other objects
- Series of objects may also be collected into an array of objects
- Arrays
- Pixel (or picture element)
- Fundamental, constituent element of a digital image
- Represents the color and intensity of light at each location within an image
- Typically described by a value 0 - 255 (1 byte) for a red, green and blue channel
- Optional alpha channel may be included for each pixel in image formats that support translucency (resulting in 4 bytes/pixel in an image)
- Arrays of pixels (J Pathol Inform 2020;11:23)
- Digital image is represented by a 2 dimensional array of pixels
- Higher pixels counts, i.e. 800 x 600 (SVGA) versus 1360 x 768 (HD), provides higher resolution
- Higher resolution comes with the tradeoff of higher storage and bandwidth requirements
- Compression
- Images can be compressed to a fraction of their original size with compression algorithms for storage and transfer and then uncompressed as needed for display (J Am Med Inform Assoc 2008;15:794)
- Compression can result in a file size less than 1% of the original
- Lossy compression
- Sacrifices quality to achieve maximal compression
- Uncompressing the image results in a similar, although not exact, representation of the original
- Degree of compression may be adjusted based on needed quality
- JPEG is the ubiquitous lossy format most often encountered
- Lossless compression
- Uncompressing from a lossless format results in an exact bitwise copy of the original image
- Compression ratios are less substantial than comparable lossy algorithms
- PNG, TIFF, GIF and JPEG 2000 are examples of lossless formats
- Whole slide image formats generally use lossless compression to maintain fidelity
- Images intended for image analysis should likely be stored with lossless formats, compression artifact could potentially affect algorithm performance
Contributed by Chris Williams, M.D.

Highlighting pixels

PNG (lossless)
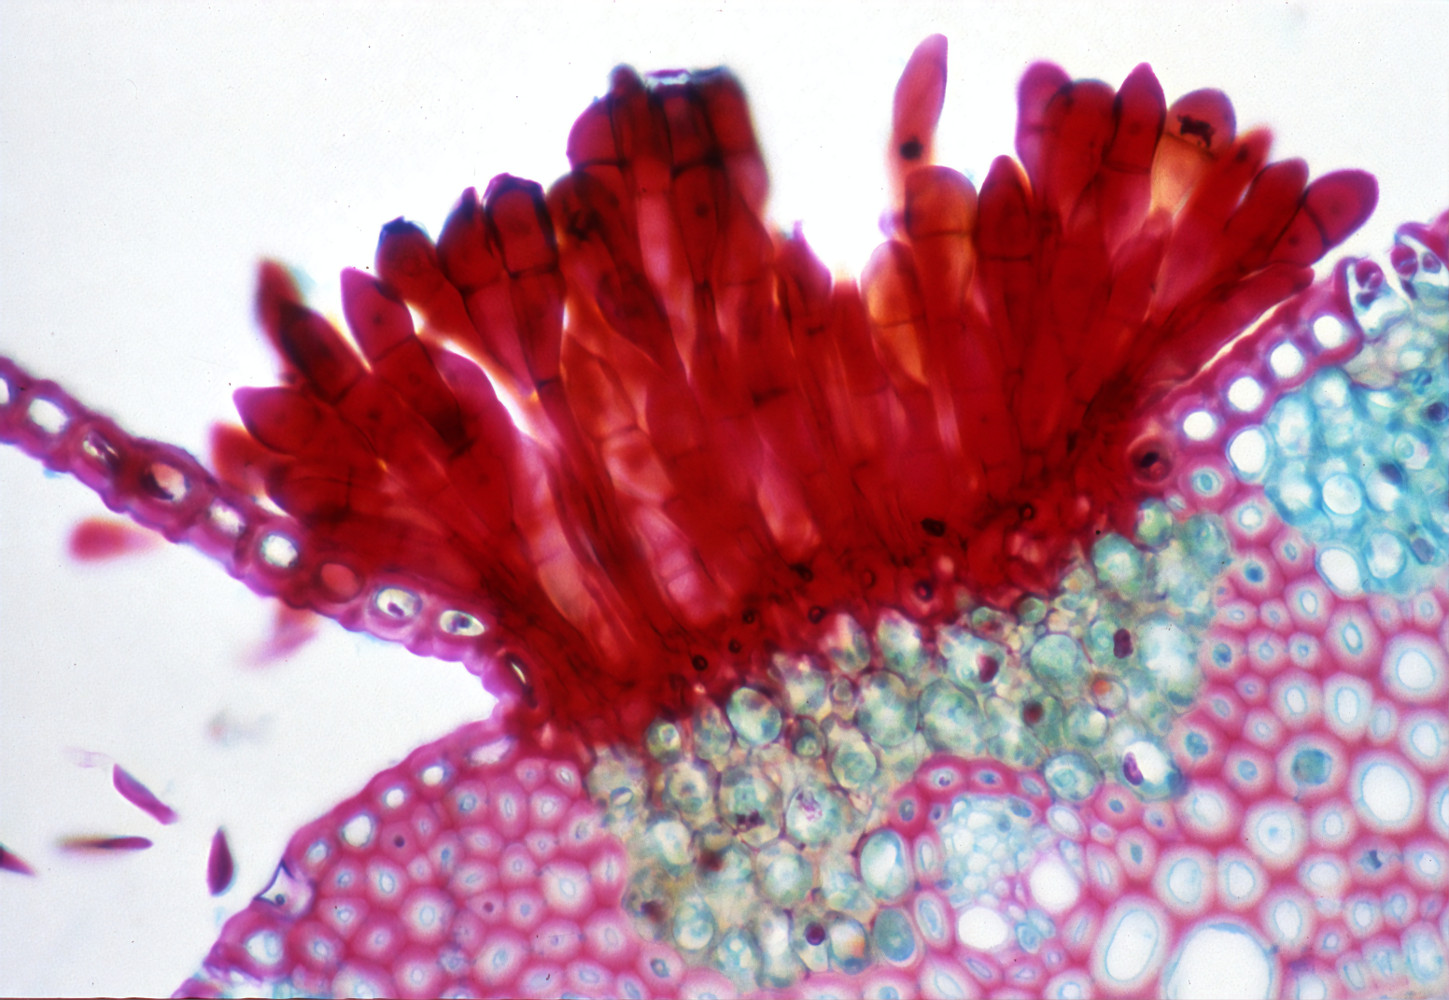
JPG (lossy) high quality
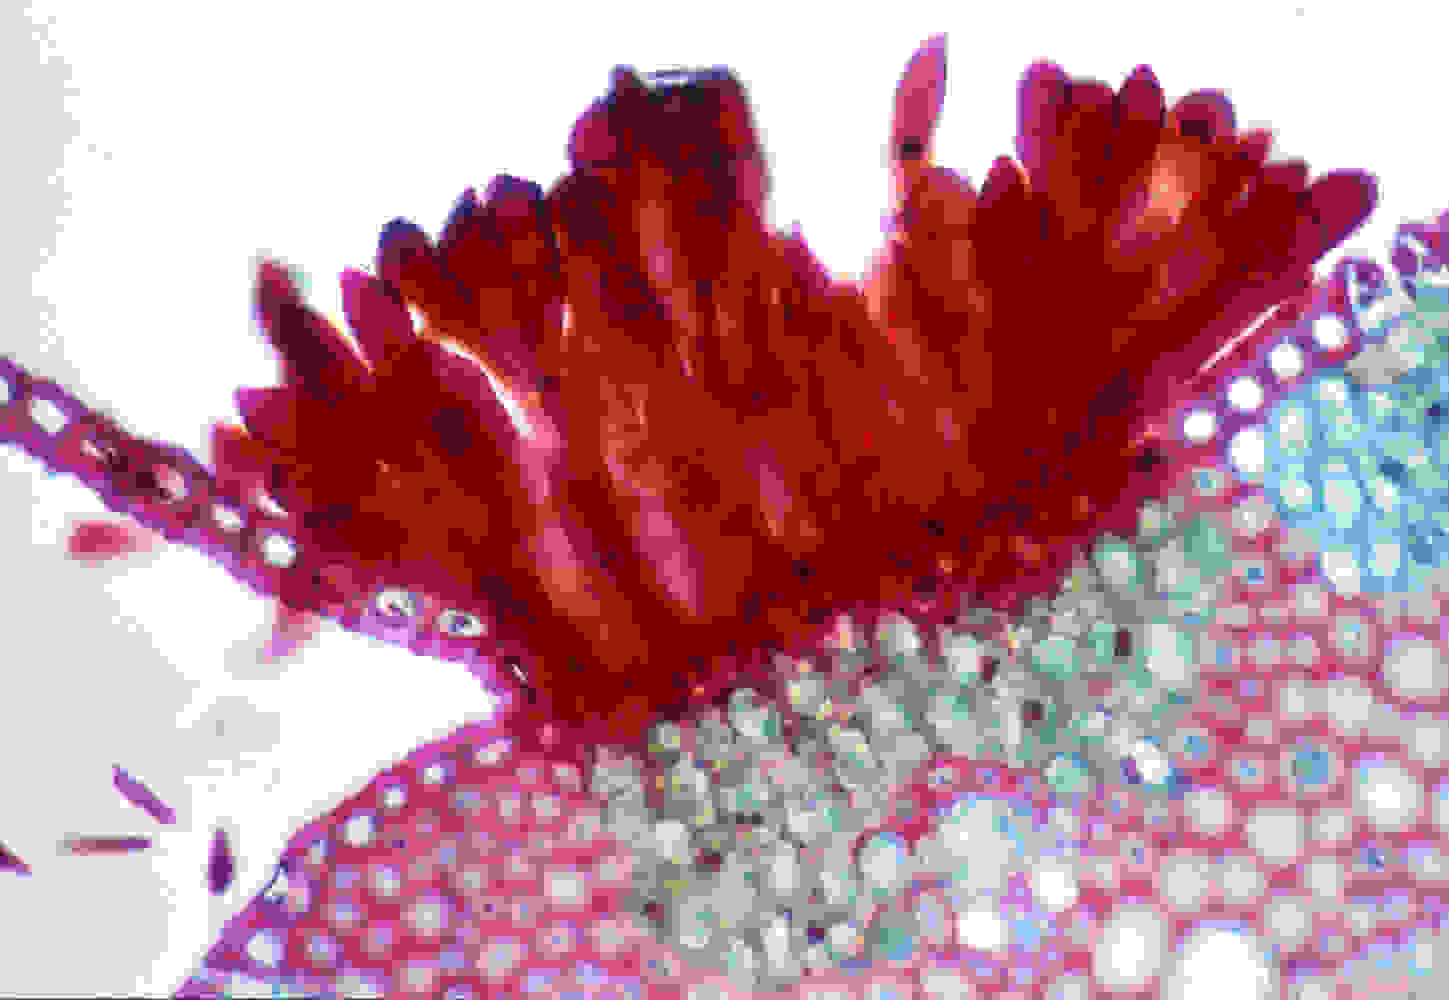
JPG (lossy) low quality
Images hosted on other servers:

Tagged diagnostic data within CCD

Untidy dataset and tidy equivalent

Relative pixel density and size of display resolution
- Coding systems are common examples of structured data in healthcare
- Systematized Nomenclature of Medicine Clinical Terms (SNOMED CT) and Logical Observation Identifiers Names and Codes (LOINC) are particularly useful for searching data in the Laboratory Information System (LIS), if available
- International Classification of Diseases (ICD)
- Coding scheme to capture diagnoses (ICD-10-CM) (AJNR Am J Neuroradiol 2016;37:596)
- Also can capture procedures performed in the healthcare setting (ICD-10-PCS)
- Generally used for billing but can also aid the laboratory by providing context as to why a test is being performed
- ICD-10 was first used in 1994, has had many versions and will be replaced by ICD-11, which is fully electronic, easier to implement and effective on 01/01/2022 (WHO: International Statistical Classification of Diseases and Related Health Problems [Accessed 6 April 2021])
- ICD for oncology (ICD-O):
- Primarily used in tumor and cancer registries
- ICD-O-3.2 is the latest version
- Morphology section of ICD-O is incorporated into SNOMED
- ICDs are managed and published by WHO
- SNOMED CT (SNOMED International [Accessed 6 April 2021])
- Originally developed by the College of American Pathologists, now maintained by the International Health Terminology Standards Development Organization (IHTSDO)
- Hierarchical ontology classifying diseases, clinical findings, procedures and more
- Multilingual
- Key feature is compositional approach, making SNOMED CT easily extensible
- Terms can be combined
- Modifiers can be added
- One of the most comprehensive medical terminology systems (> 1 million terms)
- Current Procedural Terminology (CPT) (AMA: CPT [Accessed 6 April 2021])
- Classification of procedures performed by physicians
- Required for reimbursement by government and health insurance companies in the U.S.
- Developed and maintained by the American Medical Association (AMA)
- LOINC (Arch Pathol Lab Med 2020;144:478)
- “A common language (a set of identifiers, names and codes) for identifying health measurements, observations and documents” (LOINC: About LOINC [Accessed 6 April 2021])
- Has 6 parts: component, property, time, specimen, scale and method
- Examples:
- Blood glucose → GLUCOSE:MCNC:PT:BLD:QN:
- Serum glucose → GLUCOSE:MCNC:PT:SER:QN:
- Urine glucose concentration → GLUCOSE:MCNC:PT:UR:QN:
- Urine glucose by dipstick → GLUCOSE:MCNC:PT:UR:SQ:TEST STRIP
- Developed and maintained by Regenstrief Institute
- Diagnosis Related Groups (DRG)
- Set of patient classes that relate a patient’s case mix complexity to the resource demands and hospital associated costs (Centers for Medicare & Medicaid Services: Design and development of the Diagnosis Related Group (DRG) [Accessed 6 April 2021])
- Basic unit of payment in Medicare’s hospital reimbursement system
- Some health insurance companies also have adopted the DRG system
- Medicare reimburses hospitals a flat fee based on the assigned Medicare severity DRG (MS-DRG) in order to encourage cost savings by hospitals
- MS-DRG are assigned based on the ICD diagnosis and procedure codes
- DRG system initially developed at Yale University in the 1970s for statistical classification of hospital cases
- Due to the financial implications, getting an accurate DRG, supported by the appropriate ICD codes, is of critical importance
- Undercoding an admission results is lost revenue
- Upcoding of an admission puts the institution at risk for financial penalties
- Networking
- Transmission Control Protocol and the Internet Protocol (TCP / IP)
- Foundational protocols used to transmit data across the internet
- Describes an end to end communication channel capable of spanning numerous, disparate networks, including encoding and packetizing of data, addressing, routing, transmittal and acknowledgement of recipient of each packet
- Many, if not all, newly installed laboratory instruments will come with a Network Interface Card (NIC) to be connected directly to a network or will need to be attached to a computer for network connectivity of some kind
- Digital pathology is an emerging area where networking requirements should be considered carefully during planning and implementation
- Potential networking needs include admit / discharge / transfer (ADT), orders and results feeds, quality control (QC) monitoring and direct vendor connections for monitoring and remote support
- IP address / ports
- Each device attached to computer networks, both wired and wireless, must have a unique IP address in order to transmit or receive information
- This IP address is analogous to a post office box and is required to ensure information is delivered to the intended recipient
- In order to facilitate multiple simultaneous connections from the same IP address, each application can communicate using a unique port number, 1-65535
- Commonly used ports include port 80 for Hypertext Transfer Protocol (HTTP) and port 443 for Hypertext Transfer Protocol Secure (HTTPS) communication
- During the implementation phase of new projects with networked devices, it is often helpful to create a network diagram to visually depict the various devices with the IP address and required ports for each service
- Firewalls
- May be either a physical device or a software application that monitors network traffic and is capable of filtering or blocking unwanted network traffic
- May be configured to let all traffic through by default and block only user identified traffic
- Conversely, a firewall may be configured to block all traffic by default and allow only specifically designated traffic
- Firewall rules are generally configured to filter traffic based on IP or port addresses; however, deep packet inspection to allow finer granularity is possible
- Laboratory will often need to work with information technology (IT) when installing new systems to ensure firewalls are configured correctly to allow required communication in a secure manner
- Virtual private network (VPN)
- Creates a "secure tunnel" to access resources, across the internet, located on an otherwise inaccessible private network
- Uses encryption to protect information traversing public networks
- May be used for remote access for individual users, such as accessing the hospital network from home
- Can be used to link multiple geographically diverse buildings, clinics, etc. onto a single, unified virtual network for securely sharing and accessing information resources
- Accessing a network via a VPN bypasses many firewall protections, which is intended for authorized users but may be detrimental if unauthorized users are able to gain access to the VPN
- Transmission Control Protocol and the Internet Protocol (TCP / IP)
- Interfaces
- Internal: information systems within a laboratory or within a healthcare system require the ability to exchange information (Am J Clin Pathol 1996;105:S48)
- American Society for Testing and Materials (ASTM)
- In the context of laboratory instrument communication, refers to standards maintained by ASTM international (ASTM International [Accessed 6 April 2021])
- Standards E1381 and E1394 describe low level communication protocols that could be used to transfer information between clinical laboratory equipment and computer systems
- These standard have been superseded by Clinical & Laboratory Standards Institute (CLSI) LAB01 (CLSI [Accessed 6 April 2021])
- Originally used to connect instruments directly to an LIS and later to middleware over a serial connection
- Standards have been adopted to function over a TCP / IP network connection
- While no longer the preferred interface for newer instruments, this interface may be encountered in legacy hardware and many interfaces still support this as an option to maintain backward compatibility
- HL7
- Please refer to the HL7 topic for more detail
- HL7 messaging can be exchanged via TCP / IP networking, serial connections and file transfer
- Adopted by healthcare IT vendors, both within and outside the laboratory
- Specific message types of note:
- Admit / discharge / transfer (ADT)
- Most common message type found on the message bus
- Tracks and updates patient, demographic and billing information as patients enter and transverse the system
- Required functionality for most information systems to ensure patient information remains current
- Orders / results
- Order message (ORM) and observation result - unsolicited (ORU) are HL7 orders and results message types, respectively and of particular interest to the LIS
- Order messages are matched to patient information received via ADT
- Following testing, the result message will be returned to the originating system, as well as any other system listening for the result message type
- Admit / discharge / transfer (ADT)
- Digital imaging and communications in medicine (DICOM)
- A standard for storage and transmitting medical images, most commonly in radiology
- Universally supported by picture archiving and communication systems vendors
- DICOM Supplements 122 and 145 have been added to accommodate whole slide imaging (J Pathol Inform 2018 Nov;9:37)
- Wide scale adoption of DICOM within the digital pathology ecosystem has been slow but vendor support is increasing and demand to consolidate medical imaging into a single repository is likely to drive further adoption
- Enterprise message bus
- Many organizations have a single messaging bus or integration engine, similar to middleware in the laboratory, connecting the various information systems, as opposed to point to point connections
- Usually exchanges HL7 messages; however, other communication can be accommodated
- Facilitates adding new systems to the existing milieu with minimal effort
- American Society for Testing and Materials (ASTM)
- External: in addition to internal communication, the need also exists and is now federally mandated to exchange healthcare information with the government and among healthcare systems electronically
- Continuity of Care Document (CCD) (Am J Public Health 2012;102:e1)
- Extensible Markup Language (XML) based standard and a joint effort of HL7 and ASTM
- Promotes interoperability of clinical data
- Physicians can send electronic health information to other providers without loss of meaning
- Improvement of patient care
- HL7 2.5 reportable conditions
- HL7 version 2.5.1 is widely used as a messaging standard protocol that helps transmit laboratory results and clinical information from one party to another
- Transmitting reportable conditions from the laboratory to public health agencies is primarily accomplished via HL7 2.5.1
- HL7 version 2.5.1 is widely used as a messaging standard protocol that helps transmit laboratory results and clinical information from one party to another
- College of American Pathologists (CAP) checklists / cancer registries / cancer staging, etc.
- CAP checklists used in 3 formats, including dictation from the case summary template, the use of Word macros and the use of the computer readable XML case summary format known as CAP electronic Cancer Checklists (eCCs) used before 2019 and replaced by Structure Data Capture (SDC) in 2019) (CAP: electronic Cancer Checklists (eCCs) [Accessed 6 April 2021])
- SDC based pathology reports can be transmitted automatically to registries in a well defined structure and computer readable format that does not require manual parsing or the use of natural language processing approach
- Each section, question and answer in an SDC template has a unique identifier (the ID known as a Ckey or composite key)
- SDC IDs are mapped to ICD-O-3 codes, to the North American Association of Central Cancer Registries (NAACCR) data item fields and codes and to SNOMED codes (NAACCR: Laboratory Electronic Reporting for Pathology [Accessed 6 April 2021])
- This mapping work enables interoperability between registries and clinical research; this interoperability will be unavailable for text based reports because of not being readily transformed into registry conformant codes
- Continuity of Care Document (CCD) (Am J Public Health 2012;102:e1)
- Internal: information systems within a laboratory or within a healthcare system require the ability to exchange information (Am J Clin Pathol 1996;105:S48)
- Security
- All information sets containing protected health information are governed by HIPAA (CDC: Health Insurance Portability and Accountability Act of 1996 (HIPAA) [Accessed 6 April 2021])
- Information systems should encompass access controls, such as authentication, authorization (role based access) and audit capture
- In addition to other safeguards, data should be protected in transit between information systems
- Specific encryption schemes are not mandated but any encryption used should meet the Federal Information Processing Standard (FIPS) 140 standard (CSRC: FIPS 140-3 - Security Requirements for Cryptographic Modules [Accessed 6 April 2021])
- Firewalls, as described above, are another secure measure to prevent or at least deter unauthorized access of data in transit
- Healthcare IT vendors should be able to provide proof, preferably independent third party verification, that their solutions meet the current applicable standards
- Security should be an initial concern when considering new laboratory initiatives
Healthcare data standards
HL7
- Comment or note in a pathology report
- CPT code
- Paper based test order
- Specimen barcode
- Specimen gross description
- ASTM
- CSV
- Excel
- HL7
- HTML
- Database fundamentals involve the principles and techniques for designing, creating and managing structured data in a centralized repository to allow for efficient data management, analysis and retrieval
- Data modeling involves designing the database structure and defining the relationships between tables and fields
- Data normalization is a process that involves organizing data to minimize redundancy and ensure data consistency
- Data storage and retrieval involves storing and retrieving data in a way that is efficient and reliable while ensuring data security and integrity
- Database management system (DBMS) software allows users to create, manage and manipulate databases; it provides tools for data storage, retrieval and analysis, as well as data security and backup features
- Data querying and reporting involves using tools and languages like SQL to retrieve data from the database and generate reports and visualizations
- An entity refers to a distinct object or concept represented in a database, such as a patient, an order or a laboratory test
- An attribute is a characteristic of an entity represented in a database, such as a patient's name, date of birth or laboratory test result
- A table is a collection of related entities organized in a structured manner in a database
- A record is a single instance of an entity stored in a table
- A primary key is a unique identifier for each record in a table to ensure that records can be uniquely identified and accessed
- A foreign key is a field in a table that refers to the primary key of another table and is used to establish a relationship between the 2 tables
- A query is a request to retrieve data from a database, usually using a language like SQL
- An index is a data structure used to improve the performance of queries by allowing data to be searched more efficiently
- Atomicity ensures that all operations within a transaction are completed or none of them are completed, preserving the consistency of the database
- Consistency ensures that the database is always valid, with all constraints and rules applied correctly
- Isolation ensures that multiple transactions can be executed concurrently without interfering with each other
- Durability ensures that once a transaction is committed, its changes are permanent and will survive system failures
- Normalization is the process of organizing data in a database in a way that minimizes redundancy and improves data consistency and integrity
- Reference: Pantanowitz: Pathology Informatics - Theory & Practice, 1st Edition, 2012
- A hierarchical database model organizes data in a tree-like structure, where each record has 1 parent and multiple children; this model helps manage data with a fixed structure and superficial relationships but it may not be ideal for more complex data
- In a flat database model, data are stored in a single table with a list of records without any relationship or structure; this model is simple and easy to understand but can be less efficient for managing large amounts of data
- A network database model organizes data in a network-like structure, where each record can have multiple parents and children; this model helps manage complex relationships but may be less intuitive and more complicated to implement than the hierarchical model
- A relational database model organizes data into tables, each representing a specific entity or relationship; relationships between tables are established through keys, such as primary keys and foreign keys
- This model is the most widely used and is well suited for managing large amounts of data and complex relationships
- In an object oriented database model, data are organized into objects, which are instances of classes and can include methods and properties; this model helps store complex and dynamic data structures but can be more challenging to implement and manage than relational databases
- In a graph database model, data are organized as nodes and edges, where nodes represent entities and edges represent relationships between them; this model helps manage data with complex relationships, such as social networks, recommendation systems or knowledge graphs
- NoSQL database model refers to any database management system that does not use a traditional relational database model; instead, NoSQL databases use a variety of data models (such as key value, document, column family or graph) to store and retrieve data
- NoSQL databases are often used for managing large volumes of unstructured or semistructured data and for handling high levels of traffic and scalability (IBM: What Are NoSQL Databases? [Accessed 5 June 2023])
- Laboratory information management
- Databases can manage laboratory information, such as patient demographics, test orders, results and billing information
- Quality control and assurance
- Databases can be used to track and manage quality control and assurance data, such as instrument calibration data, proficiency testing results and corrective actions (Ann Lab Med 2023;43:418)
- Clinical decision support
- Databases can provide pathologists and clinicians with decision support tools that integrate patient data, laboratory test results and other clinical information to help guide diagnosis and treatment decisions (J Pathol Inform 2023;14:100303, Clin Biochem 2023;113:70)
- Digital pathology image management
- Databases can store and manage digital pathology images, allowing pathologists to easily access and share images with colleagues (J Pathol Inform 2011;2:32)
- Research and data analysis
- Databases can store and analyze large amounts of pathology data, such as tissue sample characteristics, diagnostic criteria and treatment outcomes, to support research and inform clinical decision making (Mod Pathol 2022;35:23)
- Biobanking and specimen tracking
- Databases can track biobank specimens, including information about specimen collection, storage and distribution (Cell Genome 2022;2:100192)
- Identify the need
- Determine the specific area(s) in pathology where a database could be helpful (e.g., you may want to create a database to store and manage digital images, track laboratory testing or facilitate research collaborations)
- Choose a database management system (DBMS)
- Once you have identified the need, choose a DBMS appropriate for your requirements; some commonly used DBMSs in pathology include MySQL, Microsoft SQL Server, Oracle and PostgreSQL
- Define data requirements
- Determine the specific data elements that will be included in the database (e.g., if you are creating a database to store digital images, you may need to include information such as patient demographics, sample type, staining method and imaging modality)
- Design the database schema
- Create a schema that defines the database structure and how the data elements will be organized and related
- Develop the database
- Using the chosen DBMS, create and populate the database with data; this process may involve importing data from existing systems or entering data manually
- Test the database
- Thoroughly test it to ensure that it functions as expected and that data can be accessed and manipulated accurately
- Train users
- Provide training and support to users accessing and using the database, including pathologists, laboratory technicians and other healthcare professionals
- Monitor and maintain the database
- Regularly monitor the database for errors and performance and perform routine maintenance tasks such as backing up data and optimizing database performance
- Reference: PLoS Comput Biol 2016;12:e1005097
- Improved efficiency
- Databases can help streamline pathology workflows by making it easier to access and analyze patient and laboratory data; this functionality can help reduce the time and resources required to perform pathology tasks and improve turnaround times for laboratory test results (Singapore Med J 2018;59:597)
- Increased accuracy
- Databases can help reduce errors in pathology by providing a centralized location for data that can be easily accessed and validated; this ability can help improve the accuracy of laboratory test results and reduce the risk of misdiagnosis or treatment error (J Am Med Inform Assoc 2001;8:527)
- Better collaboration
- Databases can facilitate collaboration between pathologists and other healthcare professionals by providing a platform for sharing patient data and laboratory test results; this function can help improve communication and coordination of care
- Improved patient outcomes
- By providing access to accurate and up to date patient data, databases can help pathologists make more informed diagnostic and treatment decisions, improving patient outcomes (NPJ Digit Med 2020;3:17)
- Enhanced research
- Databases can store and manage large volumes of research data, which can be analyzed to identify patterns and relationships that may be useful in diagnosis, treatment or research; this process can help advance the field of pathology and improve patient outcomes (Diabetes Technol Ther 2011;13:343)
- Data quality
- Databases are only as good as the quality of their data; pathologists must ensure that data entered into the database are accurate, complete and up to date, which may require additional resources and training
- Data privacy and security
- Patient data stored in databases are subject to privacy and security concerns, including unauthorized access and potential breaches; pathologists must ensure proper security measures are in place to protect patient data
- Complexity
- Databases can be complex and require specialized skills and expertise to manage and maintain; pathologists may need additional training or support to use and manage a database effectively
- Compatibility
- Databases may not be compatible with all pathology information systems or laboratory equipment, making integrating data from multiple sources challenging
- Cost
- Developing and maintaining a database can be costly, requiring significant resources for hardware, software and personnel
- Legal and regulatory compliance
- Pathologists must ensure that their use of databases complies with legal and regulatory requirements, including data privacy laws such as HIPAA and data sharing agreements (CDC: Health Insurance Portability and Accountability Act of 1996 (HIPAA) [Accessed 5 June 2023])
- MySQL is an open source relational database management system (RDBMS) widely used in pathology and healthcare applications; it is popular for managing large volumes of structured data, such as laboratory test results and patient information
- Microsoft SQL Server is a commercial RDBMS commonly used in healthcare and pathology settings; it provides tools for managing large volumes of data and can be used to store and analyze laboratory test results, medical images and patient records
- Oracle Database is a commercial RDBMS widely used in healthcare and pathology applications; it provides data management, analysis and security features and can store and manage large volumes of structured data
- PostgreSQL is an open source RDBMS commonly used in pathology and healthcare settings; it is designed to handle large volumes of data and provides data management, analysis and security features
- SQLite is an open source embedded database management system commonly used in mobile and web applications; it is lightweight and easy to use, making it a popular choice for managing small to medium sized pathology research and development datasets
- Create a replica of the data in a database
- Ensure the accuracy and consistency of data
- Improve the efficiency of data storage
- Increase the speed of data processing
Comment Here
Reference: Database fundamentals
- Ability to ensure that a transaction either succeeds ultimately or fails completely
- Ability to ensure that only authorized users can access the database
- Ability to handle multiple transactions simultaneously
- Ability to store and retrieve large amounts of data quickly
Comment Here
Reference: Database fundamentals
- Dynamic, image based environment that enables the acquisition, management and interpretation of pathology information generated from a digitized glass slide
- Specialized field of pathology involved with data management based on information generated from digitized specimen slides
- Glass slides are converted into digital images with the aid of specialized scanning machines (glass slide scanners); slides can then be viewed, managed, shared and analyzed utilizing computer based technology
- Digital images can be viewed locally or can be made accessible for viewing remotely via viewing software and internet
- Digital images can be archived and maintained in an information management system, which allows for archival and intelligent retrieval
- These computer based systems can be potentially trained in deep learning (DL) exercises to perform pattern recognition based tasks (artificial intelligence)
- Image analysis tools can be utilized to derive objective quantification measures from digital slides and deep learning neural networks can be of use to identify certain regions and objects on the digital slides (e.g. Ki67 labeling cells)
- Digital images allow information sharing for diagnostics, prognosis, education and research
- 2 main types:
- Static: utilizes still images
- Interactive / dynamic digital pathology: utilizes real time images
- Often used interchangeably with virtual microscopy, digital pathology, telepathology
- Scanner (image acquisition)
- Image management (data and messages, including integration in laboratory information system [LIS])
- Viewing software
- Image storage system
- Image evaluation and analysis systems (Pathobiology 2016;83:99)
- Frozen section diagnosis in remote areas
- Primary diagnosis of pathology specimens in clinical use
- Assessment of immunohistochemistry and in situ hybridization
- Telepathology expert consultation
- Requesting second opinion
- Remote working
- Insourcing and outsourcing of the work
- Multidisciplinary team tumor board
- Cytology screening
- Quality assurance
- Diagnostic validations for clinical trials
- Quantitation of hormone receptor (e.g. HER2 studies in breast cancer)
- 3 dimensional visualization of anatomical structures
- Education
- Research
- Continuing medical education in pathology (Arch Pathol Lab Med 2021 May 18 [Epub ahead of print], J Biophotonics 2012;5:327)
- Imaging technology: find the imaging scanner for the size and requirements of your lab, taking the intended use into consideration
- Information technology infrastructure: determine all the infrastructure that you will need to accommodate a digital pathology system, including network, storage and security
- Digital workflow: define the workflow stages, personnel carrying out each task and quality control parameters (Pathology 2019;51:1)
- Validation of the system: for the validation process, utilize the guidelines published by the College of American Pathologists (see below)
- Train the staff
- Compare the new and old systems
- Evaluate the new system
- Once digitalized, images can be read anywhere, which facilitates flexibility and remote working
- Digital images can be archived for reviewing, teaching and research
- Better use of professional time
- Ability to annotate the images for presentation, sharing and collaboration
- Reduced loss of mailed pathology material
- Viewing multiple digital images at the same time and the ability to perform synchronous viewing
- Easy image portability and retrieval
- Allows faster diagnosis of urgent cases and faster access to ancillary studies
- Allows outsourcing for research
- Facilitates faster second opinions and consults
- Reduced risk of patient / slide misidentification errors
- Rapid case retrievals, decreased slide damage and loss
- Allows automatic and compressive diagnostic audits
- Facilitates more accurate and convenient cancer staging
- Ergonomic advantage, as it allows various working positions and reduces musculoskeletal problems
- Financial benefits include reduced locum cost, travel costs, reduced archival and retrieval cost and increased productivity by consultants and pathologists
- Research and development opportunities and improves collaboration (J Clin Pathol 2017;70:1010)
- Reference: Pathol Lab Med Intl 2015;2015:23
- Expensive instrument
- Unstable technology: possibility of network, software and hardware failure
- Requires high speed internet
- Image quality: requires high magnification scanners
- Lack of a universal format for virtual slide data
- Storage of the digital data
- Lack of standards / regulatory barriers
- Cost effectiveness
- Acceptance by pathologists
- Lab information systems that are not yet ready to handle digital imaging (inability to handle high throughput routine work) (Histopathology 2017;70:134)
- Reference: Pathol Lab Med Intl 2015;2015:23
Images hosted on other servers:

Comparison of digital pathology and traditional workflow
- Difficult to define a standard for pathology images due to various imaging and nonimaging parameters
- Need for established guidelines for digital imaging
- Standards discussed here are more relevant for whole slide imaging (WSI) and clinical practice of pathology
- Digital Pathology Association has published a set of guidelines for WSI in clinical practice and various organizations have made an effort to define the guidelines for the standardization of digital; below are technical recommendations for digital imaging system implementation and optimal use
- Reference: J Pathol Inform 2017;8:51
- Architecture
- Can be any of these 3 types: client server solution, web application or service oriented architecture
- Should be suitable to all personnel who are doing pathology related work
- Should be able to incorporate into other information systems, such as LIS, electronic medical record and patient database (Pathobiology 2016;83:99, J Pathol Inform 2017;8:51)
- Communication network
- Should have capacity to transmit the images in a timely manner without degradation or distortion
- Estimated internet speed at the main site should be able to dedicate at least 175 Mbps network capacity for digital imaging and dedicate 1 Gbps full duplex connection between scanner and cloud archive to ensure appropriate performance
- For optimal viewing performance, recommended minimum bandwidth of 2 Mbps (Pathobiology 2016;83:99, J Pathol Inform 2017;8:51)
- Scanner capacity and design
- Scanners vary not only by their scanning modality but also by scanning time and slide loading capacity
- High throughput scanners can load up to 400 slides (Arch Pathol Lab Med 2019;143:222)
- Scanners should:
- Be designed in such a way that ensures safety of the glass slides throughout the process of scanning
- Have identification function in order to identify the barcodes associated with the glass slides
- Be equipped with an autofocus function
- Provide details to user about the quality of the scanned image
- Z axis scanning function will lower the rescanning rates and allow the creation of:
- 3D images that allow navigation in the z axis
- Enhanced / extended focusing mode to create the best single slide
- Before implantation, the scanner type, performance and quality must be assessed based on institutional needs, such as sample size, sample type, anticipated turnaround time, etc. (Arch Pathol Lab Med 2019;143:222, J Pathol Inform 2017;8:51)
- Scanning speed:
- Affected by image compression, network bandwidth, scanning magnification and storage; all these parameters should be of matching capacity so that the scanner can work at its fullest potential
- Other tasks, such as slide loading, calibration, image transmission and storage should be added to the scanning time to give a fair estimate of when the image will be available
- Standard scanner takes around 10 minutes to scan an area of 1.5 cm2 using 40x objective (J Pathol Inform 2014;5:15)
- Storage / data archive
- There should be defined policies and procedures for adequate short term and long term storage of the archived slide data, depending on the relevant laws and regulations and particular situations
- Guidelines by CAP (USA), RCP (UK), and FAGP (Germany) recommend data preservation for at least 10 years
- Guidelines from the JSP (Japan) recommend permanent preservation of the WSI data for a minimum of 5 years
- Digital Pathology Association (DPA) recommends redundant storage systems
- 2 storage approaches: selective image storage or every image storage
- Hot storage for more recent slides, versus cold storage for older slides (Pathobiology 2016;83:99, J Pathol Inform 2017;8:51)
- JSP (Japan) guidelines recommends that data from the past 5 years be preserved in hot storage for immediate reference of recent cases
- Hybrid solutions, such as local and cloud based storage (Arch Pathol Lab Med 2021 May 18 [Epub ahead of print])
- Multisite organization may utilize hub and spoke models (Arch Pathol Lab Med 2021 May 18 [Epub ahead of print])
- Image quality for optimal viewing
- Image resolution of 0.5 μm/pixel (effective viewing magnification: 20x) or better
- Rescanned slides should be < 5%
- Reference: J Clin Pathol 2015;68:499
- Image compression
- JPEG2000 is a very efficient compression method with better image quality and smaller image file but it requires more computation power and may increase the scanning time (Virchows Arch 2011;458:237, Pathobiology 2016;83:99, J Pathol Inform 2017;8:51)
- Compression type: lossy compression
- Compression ratio: this information should be provided with the data; a compression ratio between 20:1 and 32:1 is optimal for primary diagnosis but may vary, depending on the purpose of utilization
- Compression method: wavelet based JPEG2000 compression standard or TIFF
- Systems that are compatible with Digital Imaging and Communications in Medicine (DICOM) should be accompanied by DICOM compatibility report (FDA: Technical Performance Assessment of Digital Pathology Whole Slide Imaging Devices [Accessed 1 September 2021])
- Image format
- There are no established image standards or technical specifications for image capture, storage and transmission
- Scanner should be able to generate universal file formats which can be shared (Pathobiology 2016;83:99, J Pathol Inform 2017;8:51)
- Can be JPEG, TIFF or proprietary formats only accessible with vender specific viewers (FDA: Technical Performance Assessment of Digital Pathology Whole Slide Imaging Devices [Accessed 1 September 2021])
- Digital slide viewer and human interface
- Slide viewer must have the ability to load and navigate the images and should support annotation and side by side visualization (J Pathol Inform 2014;5:14)
- Display devices can be flat screen monitors or tablet PCs for telepathology utilization
- Elements taken into consideration while selecting the display devices are: type of display, light source, resolution of the display, contrast ratio, color temperature and profile, speed and capacity of the graphic memory cards
- Other factors, such as room lighting, window placements and distance from the viewer's eye levels should be kept in mind
- These display devices should be validated at regular intervals to monitor and maintain performance
- Display device characteristics:
- Horizontal resolution: ≥ 1,280 - 2,560 pixels
- Screen size (diagonal): ≥ 17 - 27 inches
- Luminance: ≥ 170 - 300 cd/m2
- Luminance ratio: ≥ 250 - 1,600:1
- Pixel pitch: ≤ 0.33 mm
- Minimum luminance: ≥ 0.5 cd/m2
- Image viewing software should allow observation field display (macro images), annotation function, screen capture functionality and side by side viewing capability
- Must be fast enough to support the daily workflow of the pathologists by creating a worklist
- Viewer must support multiple file formats from different sources
- Telepathology refresh time of 1 second (J Pathol Transl Med 2020;54:437, Pathobiology 2016;83:99, J Pathol Inform 2017;8:51)
- Monitor / display
- Display devices should be compatible with the file formats generated by the scanner and should support the network operations available in any given institute
- Display devices with horizontal resolution of approximately 2,000 pixels (2K) is optimal (for example, a 24 inch monitor with 1,920 × 1,200 pixels and 0.27 pixel pitch is the minimum recommended resolution)
- As per the current guidelines, pathologists should determine if the image or monitor is satisfactory for the purpose of its intended use
- Some technical specifications are:
- Diagonal dimension of the display distance should be about 80% of the viewing distance
- Screen should be able to display the image at the originally acquired spatial resolution
- Viewing devices should be color calibrated
- Actual contrast (still images) should be 1,000 - 1,600:1
- Brightness of the display device should be with a luminance of 300 candela (cd)/m2 or higher (Pathobiology 2016;83:99, J Pathol Inform 2017;8:51)
- Mobile device use
- ATA guidelines allow the use of mobile devices for telepathology if they can securely display acceptable quality images; mobile devices such as tablets and iPads have been found to be less suitable when compared with the monitor but can be utilized in urgent cases
- Although various applications for WSI evaluations of frozen sections and telepathology consultations are available, HTML5 is excellent for utilization of the cross platform applications and dedicated HTML percentage WSI viewers are available now (College of American Pathologists: Digital Pathology Resource Guide [Accessed 1 September 2021], Pathobiology 2016;83:99, J Pathol Inform 2017;8:51)
- Security and privacy
- Security and privacy safeguards should be set in accordance with federal, state, local and hospital guidelines to maintain data integrity
- Bar coding of the slides is recommended to maintain and ensure the valid electronic chain of custody (Pathobiology 2016;83:99, J Pathol Inform 2017;8:51)
- Interoperability
- Will allow exchange of information between different systems
- Digital imaging systems should be integrated not only with LIS but with other clinical systems, such as medical imaging system, dermatology, radiology and clinical images in a patient encounter LIS via accepted standards, such as HL7 and IHE (Integrating Healthcare Enterprise)
- Digital pathology system should follow standards defined by DICOM and below is the list of international standards:
- IHE: Anatomic Pathology Technical Framework
- DICOM Supplement 122: Specimen Module and Revised Pathology SOP Classes
- DICOM Supplement 145: Whole Slide Microscopic Image IOD and SOP Classes (Pathobiology 2016;83:99, J Pathol Inform 2017;8:51)
- Laboratories must validate the WSI systems before use
- The College of American Pathologists has proposed guidelines for validation of the WSI; the recommendations are below:
- Validation process should include a sample set of at least 60 cases for 1 application or use cases (e.g. H&E stained sections of fixed tissue, frozen sections, hematology) that reflect the spectrum and complexity of specimen types and diagnoses likely to be encountered during routine practice; the validation should include another 20 cases to cover additional applications, such as immunohistochemistry or other special stains if these applications are relevant to an intended use and were not included in the 60 cases mentioned above
- Validation study should establish diagnostic concordance between digital and glass slides for the same observer (i.e. intraobserver variability); if concordance is less than 95%, laboratories should investigate and attempt to remedy the cause
- Washout period of at least 2 weeks should occur between viewing digital and glass slides
- If using a previously validated scanner for a new, materially different use case, a full validation for the new use case with documentation is needed
- If replacing a scanner of the same make / model for previously validated applications, calibration of images for same slides scanned with each scanner with documentation is acceptable (also known as a function check)
- If deploying scanners of the same make / model as previously validated at multiple sites across a hospital network, assess applications, network and histology issues at each site to determine if full validation is required for each new scanner with documentation
- If replacing a scanner with different make / model, full validation with documentation is needed
- If introducing scanners of different make / model to multiple sites across a hospital network, full validation with documentation for at least 1 site with assessment of applications, network and histology issues at additional sites to determine if full validation is required for each new scanner
- If introducing completely different viewing software, including software from the same vendor where legacy software has been sunset, start with calibration of images between old and new software to determine if full validation is required with documentation; if employing an upgrade of software from the same vendor, calibration of images between old and upgraded software with documentation potential function check or partial validation is dependent upon the criticality and extent of the upgrade
- If replacing / upgrading displays at pathologist workstations, calibrate image quality between old and new displays with or without documentation
- Remote locations / change in network: if allowing primary diagnosis to be remotely performed outside the hospital network (e.g. pathologist’s home), a full validation with documentation is needed
- If there is a change in pathology or hospital network, calibrate archived images immediately before and after the network changes are made, either with or without documentation (Arch Pathol Lab Med 2021 May 18 [Epub ahead of print])
- 1 Mbps
- 2 Mbps
- 3 Mbps
- 5 Mbps
- < 1%
- < 5%
- < 7%
- < 10%
- Convergence of digitization, artificial intelligence and precision medicine methodologies to extract meaningful, actionable insights from histological imaging and subsequent analysis, enhancing quality of cancer detection, quantification, classification (e.g., tumor group and type) and prognostic capabilities
- Increased productivity of expert pathology teams via accelerated digital slide review and analysis for enhanced research and patient care purposes
- Capability to hold large scale digital slide libraries that can be beneficial for extracting meaningful insights for future clinical research and accessed by expert pathologists regardless of location
- Discovery and presentation of insights that validate prescribed oncology treatments or support a change in treatment course based on an individual's diagnostic data, facilitating improved care through genomic and proteomic characterization and spatial profiling
- Creating new approaches for cancer detection, screening, diagnosis and categorization
- Potential for expanded development of modeling approaches to better understand biological cause of cancer
- Often used interchangeably with digital pathology, artificial intelligence (AI), machine learning, deep learning and computational pathology
- Decentralized pathologic review
- Mining of subvisual morphometric phenotypes (Nat Rev Clin Oncol 2019;16:703)
- Mitosis detection and quantification for grading and prognostication of tumors
- Extract insights from pathologic images using AI driven algorithms and machine learning techniques (World J Transl Med 2021;9:1)
- Improving the cancer diagnostic workflow, including diagnosis, grading, staging, prognosis and treatment response predictive outcomes for cancer subtypes
- Automated calculation and quantification of diagnostic, proliferation and immune biomarkers, which help in stratification and prognostication of cancer patients (Mod Pathol 2022;35:23)
- Quick detection of mutations directly from digital histology
- Quantifying and localizing proteins in the tumor microenvironment
- Predict treatment response of particular drug, including immunotherapy and targeted therapy, from biomarkers or even directly from pathology slides
- Predict established treatment response markers including microsatellite instability for cancers such as gastric, colorectal and endometrial and gene expression signatures in immunotherapies
- Predict patient survival in multiple tumor types based on histology slide analysis
- Capability to predict patient outcomes or phenotypes based on comprehensive analysis leveraging multiple data, including multiomics and imaging (Nat Cancer 2022;3:1026)
- Expert insights and oversight, including pathologists, imaging scientists, data scientists, data management experts, technologists, clinical trial leaders, lab service providers and regulatory experts (Nat Rev Clin Oncol 2019;16:703)
- Imaging technology, including scanners, image management systems and imaging systems to quantify data
- Technology infrastructure, including network, storage and security strategy
- Digital workflow strategy, including clear outline of roles and responsibilities of full team
- Regulatory compliance, including adhering to imaging system validation guidelines set by College of American Pathologists and other professional pathology associations and regulatory authorities, including the U.S. Food and Drug Administration (FDA), to secure certification of system quality and reliability (Nat Rev Clin Oncol 2019;16:703)
- Training staff, including histotechnicians, histotechnologists, pathology assistants, cytotechnologists, cytogenetic technologists and pathologists
- Collaboration among healthcare professionals and industry to share best practices and key learnings in digital pathology imaging system use and integration, enhancing interoperability (Healthcare in Europe: Unleashing the Power of Digital Pathology for Precision Medicine [Accessed 13 September 2023])
- Tumor boards, interdisciplinary clinical conferences focusing discussion on individual patient cases
- May aid in the discovery and presentation of insights that validate prescribed oncology treatments or highlight the need for changes to treatment regimens for improved personalized care (Br J Cancer 2022;126:4)
- Early detection of cancer or risk predictors
- Capability to derive new phenotypes from real world data sources and high throughput genotyping
- Classification of cancers with unknown primary origin (Br J Cancer 2022;126:4)
- Supports the use of a singular test, regardless of tissue type, to secure richer data insights on a granular level, allowing for a wider range of potential treatments and related care plans
- Potential to develop new diagnostics, prognostics and companion diagnostics to reference for existing or emerging health conditions (Br J Cancer 2022;126:4)
- Rapid automated collection, processing, storage and interpretation of both large sets of structured and unstructured data, allowing pathologists to further understand treatment entities, relationships, dosage and more with evidence based insights
- Ability to collect and store a large scale digital imaging repository with rapid accessibility regardless of location, reducing process delays and glass slide damage
- Reducing pathologist workload (Nat Rev Clin Oncol 2019;16:703)
- Potential cost savings based on less time and resources to retrieve archived slides for reference and reduced time in image analysis given parallel pathologist reviews
- Evolving class of modeling techniques that can build future models that optimize clinical applications for oncology and other therapeutic areas
- Growing use cases for digital pathology and slide analysis as a biomarker of genomic data (Br J Cancer 2022;126:4)
- Ability to examine diverse tumor properties on a highly molecular level with deeper context on tumor characterization and microenvironment (Nat Cancer 2022;3:1026)
- Data sources may be invalid, subject to biased evaluation or not representative for AI based model design (Nat Rev Clin Oncol 2019;16:703)
- Potential for inaccurate or unfair diagnosis for some patients if datasets used in training AI model are not diverse
- AI powered models can be difficult to interpret, leading to challenges for pathologists to understand how diagnosis was decided and potential reduced trust in AI based result
- Digitized model needs performance validation regardless of patient variability (Mod Pathol 2022;35:23)
- Enabling appropriate implementation as digitization requires advanced instruments, equipment and networks to effectively connect to centralized server
- Need for technologies to be supported by appropriate expertise, including data scientists, technologists, clinical trial experts and pathologists, to interpret outputs of complex models and oncology experts who understand the science behind the disease
- Requires assurance that AI models are validated, accredited by regulatory authorities and compliant with data protection standards before clinical use
- Potential for lack of access to large amounts of high quality datasets in precision oncology (Br J Cancer 2022;126:4)
- Current lack of industry standard of value determination and reimbursement structures for digital pathology use
- Concerns relative to reproducibility, interpretability, accuracy of competing devices, financial burden of image processing hardware and regulatory approvals necessary for clinical trials
- Variability in histological data due to differing laboratory sources and operational processes, including methods of slide preparation (e.g., sectioning, fixation, staining and mounting), scoring algorithms and inherent observer variability (Mod Pathol 2022;35:23)
- Select products with which the authors have experience
- Proscia: AI powered software platform to improve precision care and help pathologists overcome diagnostic challenges (Mod Pathol 2022;35:23)
- Paige AI: Paige Prostate, a clinical grade AI solution for prostate cancer detection, was the first AI based pathology product to receive de novo approval from the FDA, allowing in vitro diagnostic (IVD) use via Paige's FDA cleared FullFocus digital pathology viewer (Mod Pathol 2020;33:2058)
- PathAI: includes AI powered panel of histopathology features that spatially characterizes tumor microenvironment and automated and reproducible digital HER2 scoring (J Pathol 2023;260:564)
- Aiforia: deep learning and cloud based technology to advance image analysis tasks and workflows for oncology and other therapeutic fields; the platform offers automated scoring of PDL1 in lung cancers, Ki67 quantification in cancers, tumor grading and mitoses counting applications (J Pathol Inform 2022:13:100144)
- MindPeak (J Coll Physicians Surg Pak 2023;33:544)
- Lunit (Sci Rep 2021;11:17363)
- Indica / Halo (Mod Pathol 2022;35:23)
- Visiopharm (Mod Pathol 2023;36:100216)
- Corista (J Pathol Inform 2020;11:37)
- DeePathology (J Neurosci Methods 2021;364:109371)
- Roche (Navify and uPath) (JCO Clin Cancer Inform 2020;4:757)
- Flagship Biosciences (Sci Rep 2022;12:9745)
- OracleBio (Oncology 2022;100:419)
- Ibex (NPJ Breast Cancer 2022;8:129)
- It aids in detecting biases in the data during algorithm training
- It aids in detection, quantification and classification of tumor group and type
- It aids in protecting sensitive patient information
- It will replace the pathologist
Comment Here
Reference: Digitization and precision oncology
- Combining clinical and genomic information
- Combining data acquisition and data inclusion
- Combining diversity data and predictive data
- Combining quality control and image acquisition data
Comment Here
Reference: Digitization and precision oncology
- The acquisition, management, sharing and interpretation of pathology information in a digital environment for the purposes of education (Leica Biosystems: Digital Pathology [Accessed 17 February 2020])
- Use of digital images in formal classroom training offers many benefits
- Technology allows for the creation of a variety of learning resources that learners at all stages of education can utilize
- Digital pathology allows for ease of teaching to clinical colleagues
- There are many resources for professionals wishing to increase their competency in digital pathology
- Roadblocks to implementation do exist and are outlined here
- In 2009, 50% of surveyed pathology courses in the United States and around the world incorporated or had immediate plans to incorporate virtual microscopy and since then that number has only risen (Hum Pathol 2009;40:1112)
- Digital images have been used in the classroom at all levels of training including undergraduate, graduate (medical, veterinary, dental, cytology technician, podiatry and physician assistant) training and pathology resident training
- Benefits of whole slide images in student training
- Accessible to any standard browser at any time of day
- Standardizes education, ensuring every student sees the same high quality image
- Reduces costs through decreased microscope needs, elimination of the need for a traditional lab space to teach in and less technical staff required to assist
- One teacher instructs several people at the same time
- Image quality does not degrade over time
- Allows for group learning as students view images simultaneously
- Are easily incorporated into student exams
- Allows for maintenance of orientation within the specimen with the use of thumbnails
- Creation of online virtual microscopy courses as well as student self study at home
- Allows students and teachers to make annotations on images (BMC Med Educ 2016;16:311)
- No change to significant improvement was found in the exam performance of medical students trained with virtual microscopy compared with those trained with traditional glass slides (Clin Anat 2007;20:565, J Taibah Univ Med Sci 2016;12:183, Adv Physiol Educ 2012;36:158)
- Many reports of implementation of digital pathology in student training are available as resources
- Use of annotations and e-learning modules (BMC Med Educ 2016;16:311, J Pathol Inform 2019;10:18)
- Transition to virtual microscopy in medical undergraduate pathology education (Turk Patoloji Derg 2015;31:175)
- Cytopathology virtual microscopy adaptive tutorials for medical students (Diagn Pathol 2016;11:1)
- American Board of Pathology accreditation and continuing certification exams
- Study materials for continuing certification, such as modules and practice tests
- Webinars
- Conferences
- Certification programs
- Programs to increase digital pathology competency include DPA: Digital Pathology Certification Program and ASCP: University of Pathology Informatics Certificate Program
- Websites
- The Digital Pathology Association website is available as a resource for those wishing to learn more about digital pathology
- Many digital pathology resources exist and can be used either in conjunction with classroom teaching or for independent learning
- Pathology and histology quizzes facilitate independent learning through testing of knowledge
- Virtual slide libraries provide thousands of high quality images representative of specific diagnoses
- Digital Anatomic Pathology Academy (DAPA) is a cloud based whole slide image educational platform that is free to members of the Digital Pathology Association with features such as:
- My Slide Box: cloud based storage space for whole slide images, easily shareable via a link
- My Presentations: facilitates management of presentations on the cloud
- Slide Library: provides access to institutional and public histologic images and includes image processing features such as freehand drawing, filters and snapshots
- High Yield Cases: features whole slide images with associated clinical history, annotated microscopic features of interest, immune profile and diagnosis
- Quiz and Assessments: allows user to create and store exams using digital images
- Path Presenter provides similar features as those listed above for DAPA but is free to all who register and contains different high yield cases and images in its slide library
- Interesting cases: includes digital histology images with associated history and test questions to improve understanding
- Educational phone apps are easily accessible tools for independent learning that are available with varying quality and costs
- Social media platforms allow followers to stay up to date with the latest innovations by individuals and institutions, such as USCAP, the DPA or CAP
- Facebook groups and pages
- YouTube channels
- Live video streaming (Periscope, Facebook Live, YouTube Live)
- Webinars, blogs, e-learning modules, e-books, classroom wikis, screencasts, etc.
- Initial costs of implementation
- Acquisition of high resolution whole slide scanners
- Extra time must be taken to scan in slides in addition to regular workflow
- Optimization of the scanner
- Additional training of staff to use digital software for teaching
- Must pay for digital storage space for long term storage of large image files
- Thought that use of digital images decreases ability of students to use microscopes, although comfort level with microscopes may or may not be relevant to student professional goals
- Poor interoperability between vendors such that images scanned in with the scanner from one company sometimes cannot be viewed with the software from a different company
- Resistance by faculty and staff who feel they have inadequate training in this new technology
Benefits of digital pathology
Digital pathology advances medical education and training
Social media in pathology education
- Which of the following is true about the use of digital images for teaching?
- Difficult to implement
- Doesn’t facilitate international teaching
- Increases accessibility to students
- Is expensive
Comment Here
Reference: Education
- Which of the following is true about the use of whole slide images?
- Cannot be accessed anytime
- Cannot be accessed anywhere
- Decreases the use of microscopes
- Doesn’t allow image annotations
Comment Here
Reference: Education
- Noninvasive form of optical imaging which applies the principle of fluorescence in the diagnostic / investigative study of organic and inorganic components of the specimen
- Enables multiantigen detection and permits live cell imaging (Arch Pathol Lab Med 2011;135:255)
- Some structures and organisms naturally exhibit fluorescence (autofluorescence), e.g. mitochondria, lysosomes, amino acids
- Set up can be simple, such as an epifluorescence microscope or complicated, such as a confocal microscope
- Microscope consists of a light source (xenon arc lamp or mercury vapor lamp, LEDs and lasers), an excitation filter, a dichroic mirror (or dichroic beam splitter) and the emission filter (Cold Spring Harb Protoc 2014;2014:pdb.top071795, Genetics 2019;211:15)
- Principle is to shine light of a particular wavelength (known as excitation) onto a specimen containing a fluorophore and then visualize emitted light (known as emission) at a longer wavelength
- Fluorescent in situ hybridization (FISH), a powerful diagnostic tool, can detect both structural (translocation / inversion) and numerical (deletion / gain) genetic aberrations
- Lehman, in 1914, described the first fluorescent microscope
- Haitinger, in 1935, stained a histological preparation of tissue / smear with fluorescent dyes for the first time (Genetics 2019;211:15)
- Hageman, in 1937, stained the acid fast bacilli microorganism using fluorescent dyes
- Microscope consists of a light source (xenon arc lamp or mercury vapor lamp, LEDs and lasers), an excitation filter, a dichroic mirror (or dichroic beam splitter) and the emission filter (Cold Spring Harb Protoc 2014;2014:pdb.top071795, Genetics 2019;211:15)
- Principle is to shine light of a particular wavelength (known as excitation) onto a specimen containing a fluorophore and then visualize emitted light (known as emission) at a longer wavelength
- Fluorophores can be biological (green fluorescent protein or GFP), organic dyes (rhodamine, fluorescein, cyanine, etc.) or quantum dots
- Fluorophore absorbs light energy from a filtered shorter wavelength light, which causes molecules to excite; after excitation, the molecules ultimately lose the absorbed energy and return to the ground state; this releases fluorescence in the emission spectrum
- 2 types are most common: epifluorescence and confocal microscopes (Proteintech: IF Imaging - Widefield Versus Confocal Microscopy [Accessed 19 March 2021])
- In the epifluorescence microscopes, the excitation and emission is done through the same light path
- Confocal microscopes reject out of focus light from the image with a pinhole aperture (J Cell Sci 2007;120:1703, Cold Spring Harb Protoc 2014;2014:pdb.top071795)
- By changing the focal plane in a confocal microscope, sections can be imaged at different depths in the specimen and a 3D representation can be reconstructed (Arch Pathol Lab Med 2011;135:255)
- Light (or photon) hits fluorophore, which excites electrons
- The excited electron (high energy, short wavelength) loses energy which translates into emission of light (low energy, long wavelength)
- Strokes shift: difference between the excitation and emission maxima
- Fluorescent dyes: chemical compounds ( DAPI, Hoechst, Phalloidin) which bind to a biological molecule of interest and re-emit light upon excitation (Genetics 2019;211:15)
- Light source: lasers for complex microscopy; xenon lamps, mercury lamps and LEDs with dichroic excitation filters for epifluorescence microscopes
- Excitation filter: a bandpass filter which allows only the wavelengths absorbed by the fluorophore, minimizing excitation of other sources of fluorescence
- Dichroic mirror: highly specific color filter allowing only a small range of colors while reflecting other colors
- Emission filter: a bandpass filter allows only wavelengths emitted by fluorophore and blocks all other undesired light, especially excitation light, ensuring the darkest background
- Epifluorescence microscopy: transmitted and emitted light travel through the same objective lens
- Confocal microscopy: incorporates optical sectioning, specialized for thick 3D samples
- Point Scanning: focuses excitation light to a point in the sample
- Parallelized (spinning disk): more than one hole illuminated at a time, hence faster image formation
- Total internal reflection fluorescence (TIRF): to excite a very thin layer of fluorescent molecules, lying just under the coverslip
- Light sheet microscopy: creates a thin sheet of excitation light by using two or more objectives, reduces photo bleaching and helps in 3D imaging (Cardiovasc Res 2021;117:520)
- Super resolution microscopy: to image below the resolution (diffraction) limit of a light microscope (Nat Cell Biol 2019;21:72)
Images hosted on other servers:
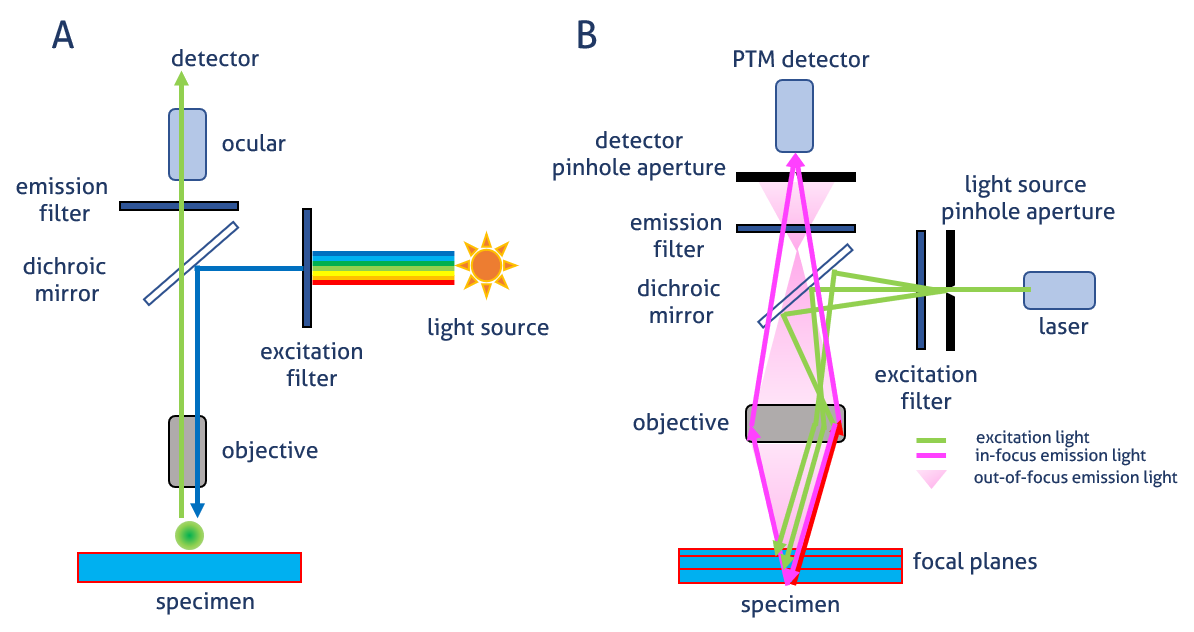
Image generation
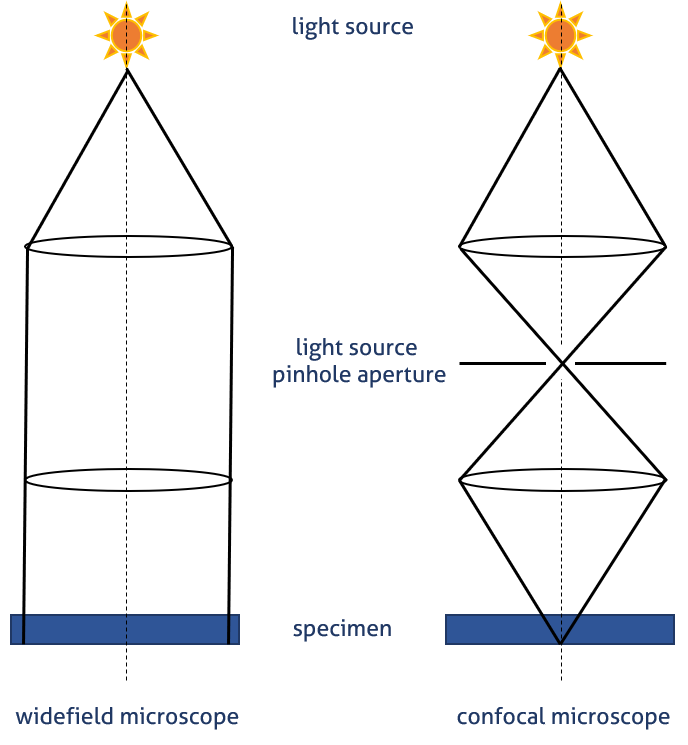
Visualization of pinhole principle
- Rapid diagnosis of different fungi, such as yeast, Microsporum, Trichophyton, etc., especially in immune compromised patients
- When using culture optical brighteners (ANS) as agar medium additives, the gram negative bacteria are more fluorogenic than gram positive bacteria
- Determining the location of an antigen or antibody in a tissue section or smear by the pattern of fluorescence, using specific antibody or antigen labeled with a fluorochrome (immunofluorescence)
- Diagnostic and prognostic tool in autoimmune and vesiculobullous lesions of the skin and mucosa (J Oral Maxillofac Pathol 2017;21:402)
- Particulate antigens, such as bacteria or protozoa, soluble toxins (staphylococcal enterotoxin) and viruses can be demonstrated in tissues or specimens (Front Immunol 2018 Mar 21;9:598)
- Identify and titrate host antibodies to infective agents and autoantibodies against self through indirect fluorescent antibody (immunofluorescence) test; distinct pattern specific to the disease is seen
- Diagnosis of invasive carcinomas, which present as bright masses with irregular borders composed of fluorescent neoplastic nuclei with surrounding hypofluorescent fibroadipose tissue (Mod Pathol 2014;27:460)
- In high grade invasive carcinomas, nuclear pleomorphism can be distinguished as irregularly shaped bright dots larger than those observed in well differentiated carcinomas
- Determines margin status in small breast tumors, thyroid lesions (< 1 cm) and lymph nodes, where the preservation of tissue integrity is important and frozen sections are not feasible
- Fluorescent in situ hybridization (FISH):
- Effective for analysis of interphase nuclei (see image below), transcription, genes, chromosomal translocation and small chromosomal aberrations; aids in the diagnosis of multiple myeloma and leukemia
- Vital tool in selecting a targeted therapy in leukemia by providing reliable biomarker information
- Immunohistochemistry (IHC) using FISH detects protein overexpression and gene amplification (HER2 status in breast cancer)
- See also Methods chapter
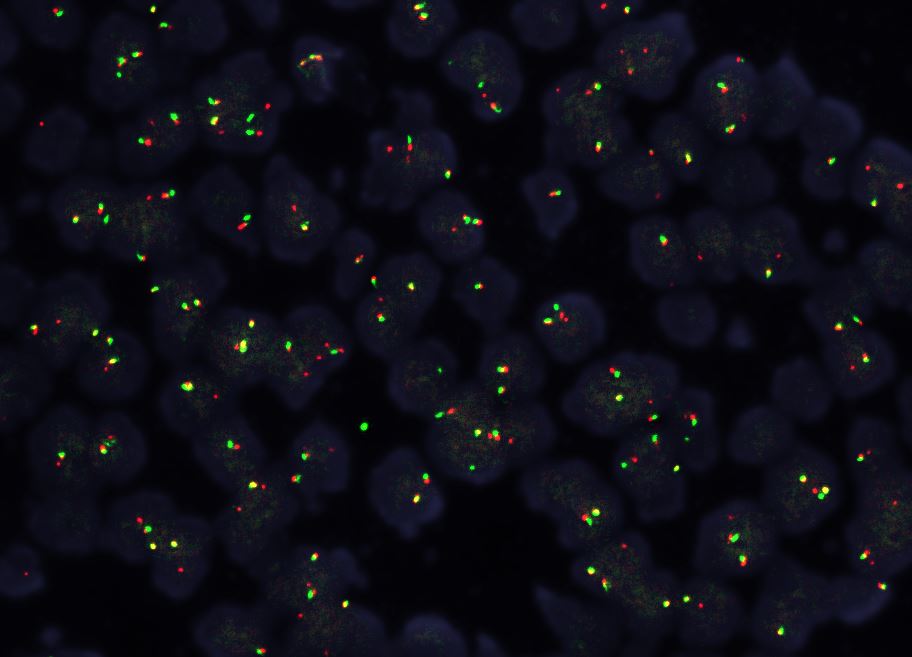
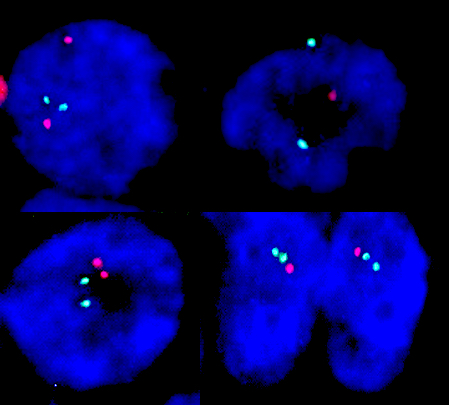
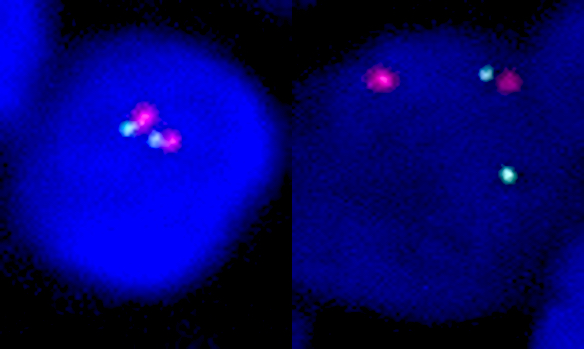
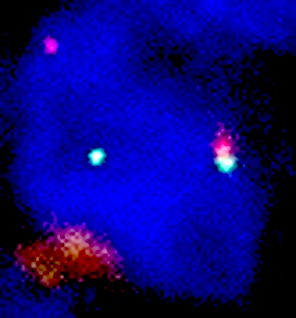
- Analysis of intracellular distribution of the nucleus, cell membranes and various intracellular structures, such as cytoskeletal filaments, mitochondria, golgi apparatus
- Studying living cells and measuring pH, free calcium and NAD(P)H concentration in the cytoplasm
- Visualizing DNA and RNA sequences in molecular cytogenetics by using fluorescent probes, which bind to segments of nucleic acid showing high degree of sequence complementarity
- Visualizing molecular processes in relation to bone remodeling in metastasized cancers (J Bone Oncol 2019;17:100249)
- Monitoring viral attachment process and different steps in the virus replication cycle by analysis of tryptophan emission spectra (Viruses 2018;10:250)
- Studying various receptor binding affinities of viruses
- Studying different stages of cell replication, most commonly interphase versus metaphase
- Suitable for rapid tumor detection due to the possibility of enhancing visibility of nuclei
- No frozen section related artifacts are present, thus better evaluation of surgical margins
- Shorter turnaround time
- Preservation of tissue integrity for routine histological examination and easy detection of adipose tissue (Mod Pathol 2014;27:460)
- Remarkable morphological correspondence to conventional H&E stained light microscopy
- Plane of imaging can be precisely chosen without wasting tissue, especially useful for small specimens (Arch Pathol Lab Med 2011;135:255)
- Signals from fluorescence probes are qualitative and lack accurate quantitative information due to varying permeability of fluorescence dyes
- Limited repeated measurements due to photobleaching and phototoxicity (Yale J Biol Med 2018;91:267)
- Requires training in imaging interpretation, especially for black and white images (Mod Pathol 2014;27:460)
- FISH whole slide imaging
- Highly sensitive method for interpreting FISH slides with break apart probes, as it can detect a significantly smaller quantity of cells with aberrant or no signals
- Split signals are easily detected with a better image definition in cells containing MYC rearrangement (Hum Pathol 2013;44:1544)
- Multiplex immunofluorescence (mIF)
- Powerful tool for immune profiling to achieve a targeted therapy
- Fluorescent opal dyes are conjugated with tyramide molecules to produce enzymatic amplification
- The emergence of slide scanners that can capture fluorescent whole slide images and advancements in autostainers capable of automating mIF protocols helped in measuring several biomarkers (even those infrequently expressed) concomitantly without cross reactivity (Sci Rep 2017;7:13380)
- Intraoperative real time cancer detection with an integrated lensless fluorescence contact imager to reduce minimal residual disease (MRD) (Biomed Opt Express 2018;9:3607)
- In vivo optical imaging of cancer cell function and tumor microenvironment (Cancer Sci 2018;109:912)
- Pathway of metastasis of cancer cells through angiotropism using confocal fluorescence microscopy
- Intravital microscopy and fluorescent protein based genetically encoded biosensors (Pathol Int 2020;70:379)
Fluorescence microscopy animation
Intro to fluorescence microscopy
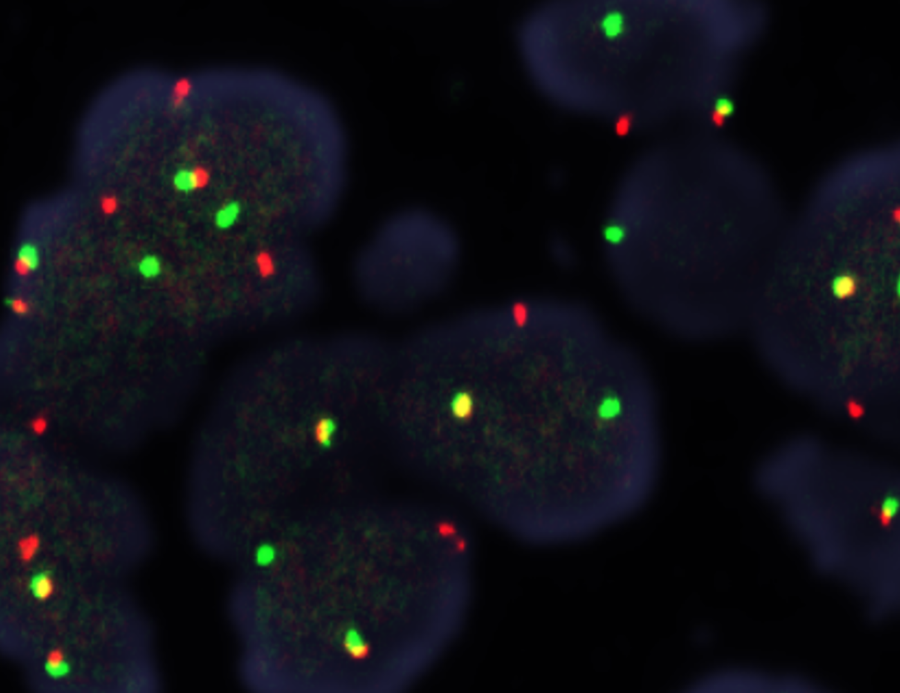
Which technique is shown in the image above?
- Electron microscopy
- Enzyme linked immunosorbent assay
- Fluorescent in situ hybridization
- Immunofluorescence
Comment Here
Reference: Fluorescent microscopy applications
- Absorption and radiation
- Excitation and emission
- Series of glass lenses magnifying the image
- Transmission of electrons
Comment Here
Reference: Fluorescent microscopy applications
- Confocal fluorescent microscope
- Digital imaging
- Electron microscope
- Epifluorescent microscope
Comment Here
Reference: Fluorescent microscopy applications
- Digital pathology (DP) is an up and coming branch of pathology that does the following:
- Converts histopathology glass slides into digital images using specialized computer scanners
- Makes use of a computer workstation to access these digital images, instead of a microscope
- Views digital slides / images using any magnification (like a microscope)
- Hematopathology is a branch of pathology that studies the diseases and disorders affecting:
- All blood cells and their production
- Tissues and organs involved in hematopoiesis, such as:
- Bone marrow
- Spleen
- Thymus
- References: J Hepatol 2019;70:1016, University of Toronto: Hematopathology [Accessed 12 September 2022]
- Diagnostic application of digital microscopy on peripheral blood (PB) elements
- Digital pathology application in the diagnosis of acute and chronic leukemias in peripheral blood and bone marrow
- Applications of digital pathology in the diagnosis and grading of lymphomas
- Limitations of the use of digital pathology in hematopathology
- Emerging areas of digital and computational pathology involves the following:
- Machine learning (ML): a branch of artificial intelligence (AI) that uses algorithms and statistical models to predict future data from previously archived data; machine learning makes use of the following tools:
- Support vector machine (SVM)
- Neural network (NN)
- Logistic regression (LR)
- Random forest (RF)
- Naïve Bayes (NB)
- Deep learning (DL) also belongs to the family of machine learning; however, it makes use of algorithms based on the artificial neural network principle, which closely resembles the structure and function of human brain neurons (Cancers (Basel) 2020;12:797):
- Deep learning makes use of the following tools:
- Convolutional neural networks (CNN or ConvNet)
- Recursive neural networks
- Deep belief networks
- Convolutional deep belief networks
- Boltzmann machines
- Stacked autoencoders
- Tensor deep stacking networks
- Spike and slab RBMs
- Compound hierarchical deep models
- Deep coding networks
- Deep q networks
- Encoder - decoder networks
- Multilayer kernel machine
- Operating principle of deep learning:
- Deep learning makes use of neural networks
- Neural networks consist of several layers of neurons stacked on top of each other in a hierarchical manner
- Inputs are then generated and transmitted from the bottom up
- These inputs generated can be trained using supervised, semisupervised and unsupervised learning techniques, thus enabling these inputs to detect certain characteristics and pathognomonic features; the new features are then stacked together and fine tuned to generate new outputs that are then transmitted to the next / higher neural network layer until a final output is produced (see figure 1 and video 1 below) (Cancers (Basel) 2020;12:797)
- Deep learning makes use of the following tools:
- Whole slide imaging (WSI) involves imaging whole slides and using artificial intelligence to:
- Diagnose the conditions on the slide
- Classify and grade lesions and tumors
- Interpret stains on slides
- Machine learning (ML): a branch of artificial intelligence (AI) that uses algorithms and statistical models to predict future data from previously archived data; machine learning makes use of the following tools:


- Automated morphology based peripheral blood elements image analyzers do the following:
- Reduce the analysis time of leukocytes (detection, counting and classification) on peripheral blood smears using convolutional neural networks with a precision rate of 93% for mononuclear cells and 88% for polynuclear cells
- Quantify different red cell morphologies allowing quantitative based diagnoses of certain red cell disorders, such as hereditary hemolytic anemia
- Improve the automatic classification of normal and mature B cell neoplasms like chronic cell leukemia (CLL), hairy cell leukemia (HCL), mantle cell lymphoma (MCL), reactive lymphocytes, normal lymphocytes and abnormal lymphoid cells
- This involves the use of automated digital microscopy systems and support vector algorithms to produce results with an accuracy of 98% (Cancers (Basel) 2020;12:797)
- Rapid real time detection of normal and abnormal leukocytes (e.g., blasts and mature cells using Single Shot Multibox Detector [SSD] and You Only Look Once [YOLO] pipelines with a mean average precision [mAP] of 93% and 92%, respectively)
- Automated detection and classification of teardrop cells with digital microscopy has yielded good outcomes (Int J Lab Hematol 2015;37:e153)
- 100% detection rate of Plasmodium and Babesia parasites using conventional microscopic scanning when parasitemia is ≥ 2.5% and detection rate of 63% when parasitemia is < 0.1% (J Clin Microbiol 2015;53:167)
- Hematology analyzers were one of the first clinical applications of digital pathology to find wide use
- DiffMaster OctaviaTM received FDA approval in 2001 as a device capable of recognizing peripheral blood elements using image analysis (GlobeNewswire: CellaVision, Lund, Sweden has obtained FDA clearance to introduce its DiffMaster(TM) Octavia, an in-vitro diagnostic device, on the U.S. market [Accessed 12 September 2022])
- CellaVision DM96 automatic hematology analyzer was introduced in 2004 (Cancers (Basel) 2020;12:797)
- CellaVision DM1200 was introduced in 2009
- The latest version of CellaVision DM9600 was first launched in 2014 (CAP TODAY: 32 analyzers in focus, from menu to special features [Accessed 12 September 2022])
- In the same vein, the cellSens app is an imaging software for digital imaging acquisition, documentation and analysis; it is especially useful for teaching (see video 2 below)
- Several applications of digital pathology in the diagnosis of acute and chronic leukemias have emerged:
- Bayesian based algorithm software has been successfully used in the quantitation of lymphocyte aggregates in Sjögren biopsies, with an accuracy of 100% (J Pathol Inform 2019;10;S2)
- Machine learning algorithms are increasingly being applied in the diagnosis of acute lymphocytic leukemia (ALL), chronic lymphocytic leukemia, acute myeloid leukemia (AML) and chronic myeloid leukemia (CML) (Int J Lab Hematol 2019;41:717)
- Using generalized matrix relevance learning vector quantization and nonparametric Bayesian algorithms of deep learning have increased the detection of acute myeloid leukemia by flow cytometry with an accuracy of 98 - 100% (Cancers (Basel) 2020;12:797)
- The same method was used for chronic lymphocytic leukemia detection with an accuracy of 99.6%
- Support vector machine method has been used to identify the immunophenotypic patterns of malignant myeloid cells of chronic myeloid leukemia and the normal / reactive neutrophils (Comput Biol Med 2013;43:1192)
- Deep convolutional neural network applied to peripheral blood smears demonstrated sensitivity and specificity between 97 - 100% for detection of acute lymphocytic leukemia and its subclassification into L1, L2, L3, and distinction from normal (Technol Cancer Res Treat 2018;17:1533033818802789)
- Artificial intelligence algorithms using the phenotypic personalized medicine digital health platform have been used to carefully adjust the dose of combination therapy for acute lymphocytic leukemia and in so doing improve treatment and maintenance therapy outcomes as well as decrease side effects (SLAS Technol 2017;22:276)
- Supervised algorithms, along with support vector machine classifiers, have been used to detect acute myeloid leukemia myeloblasts; the same algorithm could also distinguish the French American British (FAB) subtypes of acute myeloid leukemia and diagnose M2, M3 and M5 subtypes of acute myeloid leukemia with an accuracy of 100% (PLoS One 2013;8:e72932)
- Recent advancements in digital blood image processing and analysis have been used with an accuracy of 98% to screen for normal lymphocytes, abnormal lymphoid cells and reactive lymphocytes
- The same process was also used for the classification of abnormal lymphoid cells into specific disease entities with an accuracy of 91% (Am J Clin Pathol 2015;143:168)
- Digital whole slide viewing with selected high power fields (HPFs) has been shown to have significantly decreased interobserver variations among pathologists, from ~41% to 6% (J Pathol Inform 2013;4:30)
- Using iterative watershed, automated segmentation of follicles in follicular lymphoma (FL) showed an accuracy of 87% when compared to manual segmentation
- This method detects neoplastic follicles based on Immunohistochemistry (IHC) for B cell markers (e.g., CD10, CD20) in a lymph node (IEEE Trans Biomed Eng 2010;57:2609)
- Computer aided analysis tools have been used to improve the detection and grading of follicular lymphomas in malignant follicles
- This system is automated and detects follicles in virtual slide images (VSI) of lymphoid tissues
- For high accuracy, the system works on low resolution CD20 images and maps the follicle boundaries on high resolution H&E images (Comput Med Imaging Graph 2012;36:442)
- Follicular lymphoma grading system (FLAGS) has been developed to correctly identify multiple (> 10) candidate fields in tissue sections of follicular lymphoma suitable for grading using a combination of H&E and CD20 stains
- Identified field was further categorized into high or low grade based on the number of centroblasts detected
- Overall accuracy of FLAGS was 80% (BMC Med Inform Decis Mak 2015;15:115)
- Using Model Based Intermediate Representation (MBIR) and color texture for histopathological image analysis, researchers have been able to correctly identify the most aggressive follicular lymphoma (grade 3) with ~99% sensitivity and ~99% specificity; and an overall accuracy of ~86% for the classification of follicular lymphoma (J Signal Process Syst 2008;55:169)
- Using machine learning method J48 and an IHC automated classification algorithm, IHC based classification of diffuse large B cell lymphoma (DLBCL) can correctly delineate cases into germinal center based (GCB) and non-germinal center based (non-GCB) with an accuracy of ~92%
- This method also has a high concordance rate with gene expression profiles (GEP) and is of significant prognostic value
- In addition, machine learning based methods of classifying diffuse large B cell lymphoma into GCB and non-GCB subtypes provides avenues for exploring the efficacy of different chemotherapy regimens for each subcategory
- 2D and 3D computed tomography (CT) radiographic analysis with machine learning techniques based on random forest and support vector machine have been used to successfully provide high prediction accuracy for treatment resistance to R-CHOP (rituximab, cyclophosphamide, doxorubicin, vincristine and prednisone) (Blood 2019;134:4136)
- Thus, artificial intelligence based techniques can now identify diffuse large B cell lymphoma patients that might have treatment resistance and help them avoid toxicity from ineffective drugs
- Convolutional neural network algorithms have lymphoma diagnostic models capable of classifying lymphoma into categories such as benign lymph nodes, diffuse large B cell lymphoma, Burkitt lymphoma (BL) and small lymphocytic lymphoma (SLL), all based on H&E images
- Outcomes of this method showed an accurate diagnostic accuracy of 100% (Ann Clin Lab Sci 2019;49:153)
- See figure 2
- Clear and neat staining and scanning techniques are of utmost importance for better analysis of tissue specimens (J Cancer Treatment Diagn 2017;2:53)
- This is even more applicable to small core biopsies
- Table 2 presents a summary of artificial intelligence / digital pathology / machine learning applications in lymphoma diagnosis
- Numerous automated scanning machines abound in the market, including the following:
- AxioVision MosaiX
- Multiplexed ion beam imaging
- MALDI TOF mass spectrometry (Cancers (Basel) 2020;12:797)
- 76 year old woman presented with left cervical lymphadenopathy (Am J Clin Pathol 2018;150:S99)
- 77 year old woman presented with cervical adenopathy (Blood 2014;124:2748)
- Some limitations of using digital pathology in hematopathology include
- Most of the studies on digital pathology application in hematopathology are limited
- Challenges of z stacking have impeded digital pathology application to bone marrow smears, a major modality in hematopathology
- This is because z stacking does not perform well for feature oriented detection of images, a necessary tool for analyzing bone marrow smears (J Pathol Inform 2018;9:48, Lindeberg: Wiley Encyclopedia of Computer Science and Engineering, 1st Edition, 2009)
- However, attempts have been successfully made to overcome these limitations using image alignments, Gaussian smoothing and Laplacian filtering to construct a final super resolution image from multiple images
- The above methodology yielded a 24% increase in the sharpness and focus of images (J Pathol Inform 2018;9:48)
- Most of the applications are in their infancy and needs more development
- Automated interpretation of flow cytometry needs large numbers of abnormal cases
- Digital microscopy can detect schistocytes with high sensitivity but low specificity
- This necessitates reclassification of test results by expert laboratory staff (Int J Lab Hematol 2015;37:588)
- Digital microscopy can misclassify atypical cells as plasma cells, myelocytes or blasts, leading to the risk of misdiagnosis (Am J Clin Pathol 2018;150;S98)
- Future of digital pathology in hematopathology practice looks promising
- Many studies done on digital pathology application in hematopathology achieved high accuracy results
- Outcomes of any digitization systems will still require supervision by a pathologist
- Primary aim of digital pathology should be to facilitate and standardize the diagnostic process
- Digital pathology used in hematopathology creates potential methods for telecommunication between different institutions for:
- Second opinions
- Better patient care (Cancers (Basel) 2020;12:797)

Which of the following impacts the diagnostic accuracy of whole slide imaging (WSI) and analysis of small biopsies the most?
- Clear, neat staining and scanning techniques of slides
- Convolutional neural network based algorithms integrated into digital pathology machines
- Manual confirmation of the diagnosis by a pathologist
- Use of recursive neural networks by digital pathology machines
Comment Here
Reference: Informatics, digital & computational pathology - Hematopathology
- For French American British (FAB) based classification of acute myeloid leukemia
- To decrease interobserver bias in the grading of lymphomas
- To enable the classification and grading of lymphomas with a high degree of accuracy
- To enhance telecommunication between institutions for second opinions
Comment Here
Reference: Informatics, digital & computational pathology - Hematopathology
- Developed by Health Level Seven International (HL7.org); HL7 version 2.x (V2) is currently the most widely used messaging standard for electronic transmission of information across health enterprises and health information systems
- HL7 V2 has been in use for over 3 decades due to its simplicity and ease of understanding (relative to HL7 V3)
- When an order or result is transmitted electronically from one hospital to another institution or clinic, the receiving institution interprets the message and loads the data into its own laboratory information system or EHR (electronic health record)
- Acknowledgement message (ACK) is sent back to the originating institution to inform that the message was sent successfully; in cases where there was a problem in processing the message, a negative acknowledgement is sent back instead (NACK)
- HL7 V2 has several message types, e.g., ADT (admit discharge transfer), ORM (order), ORU (observation result - unsolicited)
- Each message is composed of several segments, e.g., MSH (message header), ORC (common order), OBR (observation request) or NTE (notes and comments)
- Different types of messages contain a different combination of message segments
- Complete HL7 specifications can be downloaded from HL7.org
- Middleware solutions can serve as a translator between 2 incompatible HL7 messaging systems (J Med Syst 2013;37:9986)
- Within health institutions, HL7 V2 is the most common interface messaging standard used for electronic transmission of orders, results and other types of patient data
- There are several HL7 message types, e.g., ADT (patient administration), ORU (results), ORM (orders)
- Setting up an interface between 2 medical institutions requires sharing of HL7 specifications, either an HL7 interface engine or custom built software and numerous steps of testing and validation
- Interface: connection that enables transfer of data between instruments or computer systems; in healthcare, this usually involves HL7 messages but the data can be formatted in other ways
- HL7 interface engine: computer program dedicated to monitoring, translating and transmitting HL7 messages between health information systems
- ADT (admit discharge transfer / patient administration) does more than its name implies; it is also used for changing and merging records
- The following are some types of ADT messages:
- A01: admit patient
- A02: patient transfer
- A03: patient discharge
- A04: register patient
- A05: preadmit patient
- A06: change outpatient to inpatient
- A07: change inpatient to outpatient
- A08: update patient information
- The following are some types of ADT messages:
- ORU (unsolicited observation result)
- ORM (order message)
- ACK (acknowledgement)
- NACK (negative acknowledgement)
- HL7.org has a comprehensive list of all message types
- The first 3 characters identify the type of segment, e.g., MSH (message header), PID (patient identifier), OBR (observation request)
- Data elements are separated by the pipe character "|" and each element is referred to by the 3 character name of the segment, followed by a dash and the numerical order in which the data element occurs
- Example of a PID (patient identifier) segment
- PID|1||MEDICALRECORDNUMBER||LASTNAME^FIRSTNAME||19550922|F|999888004|||||||||A55555||||||||||||||||
- PID-5 pertains to the patient's name ("LASTNAME^FIRSTNAME" in the example)
- PID-6 is empty
- PID-7 refers to the patient's birthday ("19550922" in the example)
- PID|1||MEDICALRECORDNUMBER||LASTNAME^FIRSTNAME||19550922|F|999888004|||||||||A55555||||||||||||||||
- MSH (message header): included in every message and describes the contents of the message, including the time it was sent, the sender and recipient and the purpose of the message, e.g., order, result or a type of ADT (admit discharge transfer) message
- Example: MSH|^~\\&|SENDAPP|SENDFACILITY|RECEIVEAPP|RECFACILITY|201906140836||ORM^O01|586 60050-20190614083|D|2.4
- The value for MSH-9 "ORM^O01" tells us it is the header for an ORM (order message)
- MSH-1 defines the field separator "|", which technically can be any character but "|" is normally used in practice
- Example: MSH|^~\\&|SENDAPP|SENDFACILITY|RECEIVEAPP|RECFACILITY|201906140836||ORM^O01|586 60050-20190614083|D|2.4
- MSA (message acknowledgement)
- OBR (observation request)
- Contains information about a test being ordered or resulted
- Component of ORU (unsolicited observation result) and ORM (order message)
- OBX (observation / result segment): contains test result data
- NTE (notes and comments segment)
- Reference: HL7: Data Definition Tables [Accessed 26 May 2022]
- Each interface project presents its own unique set of challenges; oftentimes, a large amount of effort is needed to set up the interface due to unique requirements on each side
- If properly implemented, interfaces reduce errors, repetition and provide considerable work and time savings over a manual workflow (Stud Health Technol Inform 2017;234:188)
- Not every HL7 message is formatted exactly the same way
- Escape sequences - certain characters within message fields, such as the field separator (usually "|") - have to be replaced by a set of characters ("\F\") for an HL7 parser to interpret the message correctly (HL7 V2+: Control [Accessed 17 May 2022])
- \F\ |
- \S\ ^
- \T\ &
- \R\ ~
- \E\ \
- Test codes may not match between 2 places; dictionaries are created to map the test codes of one institution to another
- LOINC (Logical Observation Identifiers Names and Codes), which has standardized codes for laboratory and clinical observations, is one solution to this problem but presents its own set of challenges, since 2 places may also use different LOINC codes for the same test (Clin Chem 2003;49:624)
- Example LOINC code: 2339-0 for blood glucose
- LOINC (Logical Observation Identifiers Names and Codes), which has standardized codes for laboratory and clinical observations, is one solution to this problem but presents its own set of challenges, since 2 places may also use different LOINC codes for the same test (Clin Chem 2003;49:624)
- Before 2 parties start building an interface, an interface specification has to be shared; this specifies what each field in the message contains
- Minor differences, such as the location of a particular field, must be taken into account and either the sender or receiver must perform the necessary transformations to the message to maintain compatibility
- Messages are reformatted to meet specifications by using an HL7 interface engine or through custom programming development
- GUI (graphical user interface) based interface engines are helpful to people with no programming background; these can be used to map equivalent data elements from multiple sources (Healthc Inform Res 2011;17:214)
- Transmitting PDFs: it is possible to transmit files such as PDFs within an HL7 message
- File will have to be converted to Base64 format and inserted into a message segment location specified by the receiving party
- Testing: a lot of testing will have to be done using different scenarios and types of tests to make sure the interface is working properly and to uncover any interface defects
- Acknowledgement message (ACK)
- MSH|^~\\&|SENDAPP|SENDFACILITY|RECEIVEAPP|RECFACILITY|||ACK|18659670-2019061408
- MSA|AA|18659670-20190614083
- AA in the MSA (message acknowledgement) segment stands for application accept; other potential values are AE (application error) and AR (application reject)
- 18659670-20190614083 is the ID of the message that was received, which can be found in the MSH (message header) segment of every message
- MSH|^~\\&|SENDAPP|SENDFACILITY|RECEIVEAPP|RECFACILITY|||ACK|18659670-2019061408
- Order message (ORM)
- MSH|^~\\&|SENDAPP|SENDFACILITY|RECEIVEAPP|RECFACILITY|201906140836||ORM^O01|586 60050-20190614083|D|2.4
- PID|1||MEDICALRECORDNUMBER||LASTNAME^FIRSTNAME||19550922|F|999888004|||||||||A55555||||||||||||||||PV1||C|TEST||||ATTENDINGDOCTOR |||||||||||||||||||||||||||||||||||||201906140534
- ORC|SC|00235501|51400000|61500000^LAB|||^^^201906140834^^R||201906140824|ENTEREDBYNAME||^2552^ORDERING^PROVIDER^MD| LOCATION
- OBR|1|00235501|51400000|GLUC^GlucoseLevel^^23457|||201906140824|||ENTEREDBYNAME||||||^2552^ORDERING^PROVIDER^MD|||||||| DXSECID|||1^^^201906140824
- An order for a glucose level test
- Made up of 4 segments: MSH (message header), PID (patient identifier), ORC (common order), OBR (observation request)
- MSH|^~\\&|SENDAPP|SENDFACILITY|RECEIVEAPP|RECFACILITY|201906140836||ORM^O01|586 60050-20190614083|D|2.4
- HL7 V3
- Based on RIM (Reference Information Model) that specifies how data should be represented using 3 main classes (Act, Role, Entity) and 3 association classes (Participation, ActRelationship, RoleLink)
- Encoded in XML (Extensible Markup Language)
- FHIR (Fast Healthcare Interoperability Resources)
- In 2011, it was recognized that HL7 version 3 was being minimally adopted, which led to the creation of a new task force and eventually the development of FHIR, HL7's latest approach to interoperability (J Am Med Inform Assoc 2016;23:899)
- Uses RESTful methods to transmit data, which are made up of resources
- Components of resources:
- Human readable narrative
- Specified data types
- Metadata
- Components of resources:
- Formatted in XML or JSON (JavaScript Object Notation), both of which are human readable

What is the standard most commonly used to transmit data between health information systems?
- HL7
- LOINC
- RxNorm
- SNOMED
Comment Here
Reference: HL7 V2
- MSH
- NTE
- OBX
- PID
- Computerized analysis of digital images is rapidly becoming an important adjuvant tool for the practicing pathologist in the context of diagnosis or clinical trial work (Arch Pathol Lab Med 2019;143:222)
- Computers can assist the pathologist by providing objective, precise and reproducible measurements that generate difficult or pathologist impossible cellular endpoints, while the pathologist provides the clinical oversight (J Pathol Clin Res 2019;5:81)
- There are 2 styles of image analysis within pathology: pixel based image analysis (provides simples endpoints) and cell based image analysis (provides simple and complex endpoints) (Nat Methods 2017;14:849)
- Digital methods can assist the pathologist by providing objective, precise and repeatable measurements, generating multiple digital scores and paradigms simultaneously and measuring cellular details that are difficult or impossible for the pathologist to generate (J Pathol Clin Res 2019;5:81)
- Complex analytical workflows can be validated via pathologist review if the pathologist can distinguish the end results
- For pathologist impossible endpoints, focused studies which demonstrate the robustness of the analysis must be performed and documented to ensure quality data (Nat Methods 2017;14:849)
- Image analysis has been successfully applied in the areas of immune oncology, muscular dystrophy and liver disease (J Pathol Clin Res 2019;5:81, Arch Pathol Lab Med 2019;143:197)
- Computational pathology
- Digital pathology
- Pixel based image analysis
- Cell based image analysis
- Pathologist impossible endpoints
- There are 2 styles of image analysis within pathology: pixel based image analysis and cell based image analysis (Nat Methods 2017;14:849)
- Pixel based image analysis:
- Each pixel examined by itself or with its neighbors
- Leads to simple and robust algorithms
- Provides simple endpoints
- Example: collagen stained for Masson trichrome
- Finds pixels that represents tissues
- Finds pixels within tissue with staining
- Percentage of stained area
- Cell based image analysis:
- Cells are identified in the image
- Each cell is represented by its coordinates and properties:
- Morphology (size and shape) properties
- Nucleus area
- Cell area
- Nucleus elongation
- Cell roundness
- Staining properties
- E.g. Strength of Ki67 staining in the nucleus
- E.g. Strength of PDL1 staining in the membrane
- E.g. Total amount of PDL1 staining in the cytoplasm
- Localization of staining within the cytoplasm
- Structural properties
- Locating cells in the tumor region
- Size of tumor region cell is in
- Locating cells in an epithelium layer
- Local density of cells
- Morphology (size and shape) properties
- Provides simple (e.g. cell counts) and complex (e.g. identify different cell types) endpoints
- Pixel based image analysis:
- Computers can optimally perform repetitive and tedious tasks (e.g. cell counting) but are suboptimal at higher level functions (e.g. reasoning, understanding, clinical context)
- Humans outperform computers in higher level functions but struggle with objective quantification
- Computers can assist the pathologist by providing objective, precise and repeatable measurements, for example (J Pathol Clin Res 2019;5:81):
- Estimating the percentage of positive cells across a tissue leads to large variation between pathologists and for the same pathologist on different days; the computer will produce the same count every time
- Intra and interpathologist discrepancies increase as the complexity of the scoring criteria increases (e.g. H scoring in only the tumor compartment or in specific cellular subtypes)
- Digital methods can generate multiple digital scores and paradigms simultaneously, allowing for review of multiple assay parameters, which a pathologist would have to continuously rescore to create
- Complex analytical workflows (e.g. machine learning) can be validated via pathologist review if the pathologist can distinguish the end results (e.g. identifying tumor versus stromal tissue compartments)
- Computers can measure cellular details that are difficult or impossible for the pathologist to generate (Nat Methods 2017;14:849)
- Examples of difficult measures:
- Cellular density in an area
- Quantification of biomarker heterogeneity
- Quantification of staining in and counting of distinguishable cellular subtypes (e.g. lymphocytes)
- Examples of pathologist impossible measures:
- Spatial distances between cells (e.g. nearest PD-1 positive cell to nearest PDL1 positive cell)
- Quantification of fluorescent signal
- Identification of nearly indistinguishable cellular subtypes (e.g. distinguish tumor and lymphocyte cells from macrophages)
- Statistical analysis of staining patterns (e.g. staining completeness, staining skewness)
- Examples of difficult measures:
- For pathologist impossible endpoints, focused studies that demonstrate the robustness of analysis are required to ensure data validity since it is challenging for a pathologist to review and accept the data
- Pathologists are often required to provide accurate and precise quantitative information in the context of diagnosis or clinical trial work wherein the scoring schemes are increasing in complexity (JAMA Oncol 2017;3:1051)
- Immune oncology is a field that has benefited from the application of image analysis
- Characterization of the immune landscape and checkpoint inhibitor statis is an essential component to plan novel immunotherapy which computational pathology has been able to assist with (JAMA Oncol 2017;3:1051)
- Digital pathology has recently been applied to multiple disease types including muscular dystrophy and liver disease (Arch Pathol Lab Med 2019;143:197)
Contributed by Charles Caldwell, Ph.D., Vitria Adisetiyo, Ph.D., Cris Luengo, Ph.D., Roberto Gianani, M.D.
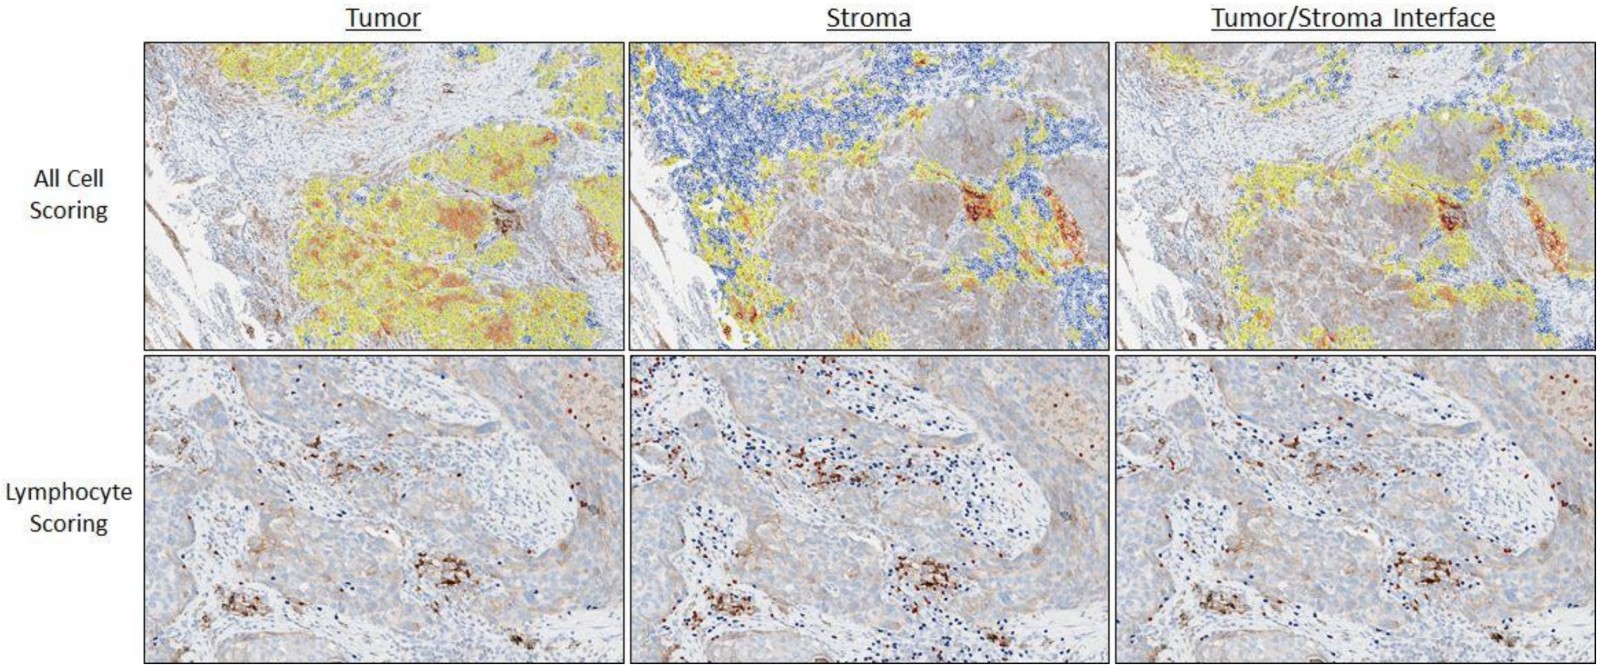
Image analysis of PDL1 in NSCLC
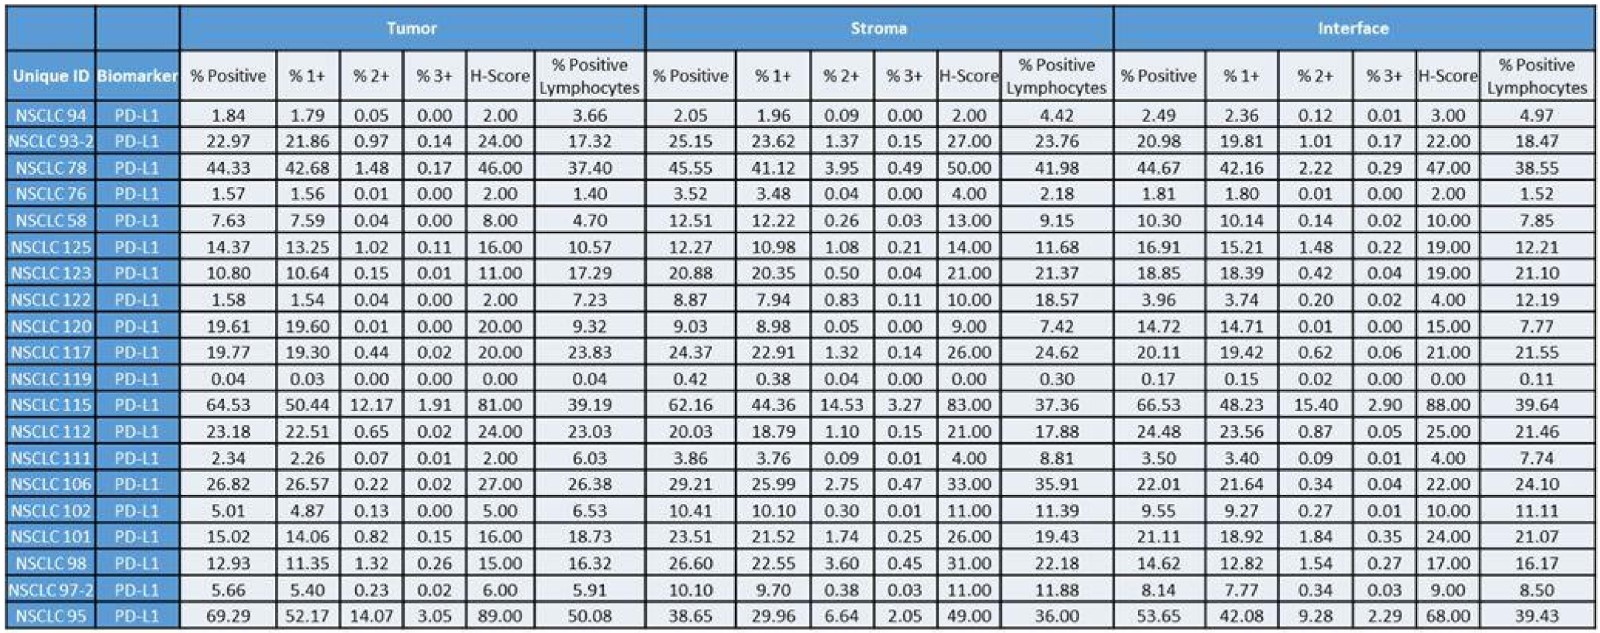
Image analysis pathology endpoint measures
Example of image analysis workflow: evaluation of PDL1 IHC staining in non small cell lung cancer
- How can image analysis serve as a pathologist’s tool?
- Generate pathology endpoints that do not require clinical oversight
- Make clinical diagnosis decisions
- Provide objective and reproducible measurements and generate difficult and pathologist impossible cellular endpoints
- Provide reasoning, understanding and clinical context
Comment Here
Reference: Image analysis applications
- What is the main difference between pixel based and cell based image analysis?
- Cell based image analysis provides simple endpoints while pixel based image analysis provides complex endpoints
- In pixel based image analysis, each pixel is examined by itself or with its neighbors whereas in cell based image analysis, cells are represented by their coordinates and properties
- Only cell based image analysis is affected by the image quality
- Pixel based image analysis uses pixels to identify cells in an image
Comment Here
Reference: Image analysis applications
- Extraction of useful information from virtual slides and other digital images, commonly acquired through a whole slide scanner or camera
- Tools, such as ImageJ, may be used to characterize the nuclei in a histological image of a soft tissue tumor; further analysis of the differences in nuclear shape, color and texture can aid in the classification of the type of lesion present in a specimen (Zentralbl Pathol 1994;140:351)
- Digital images are composed of pixels arranged in a grid-like manner, with each pixel assigned x and y coordinates
- Below is an image of a neutrophil magnified to emphasize each pixel; these pixels appear as square blocks of different colors
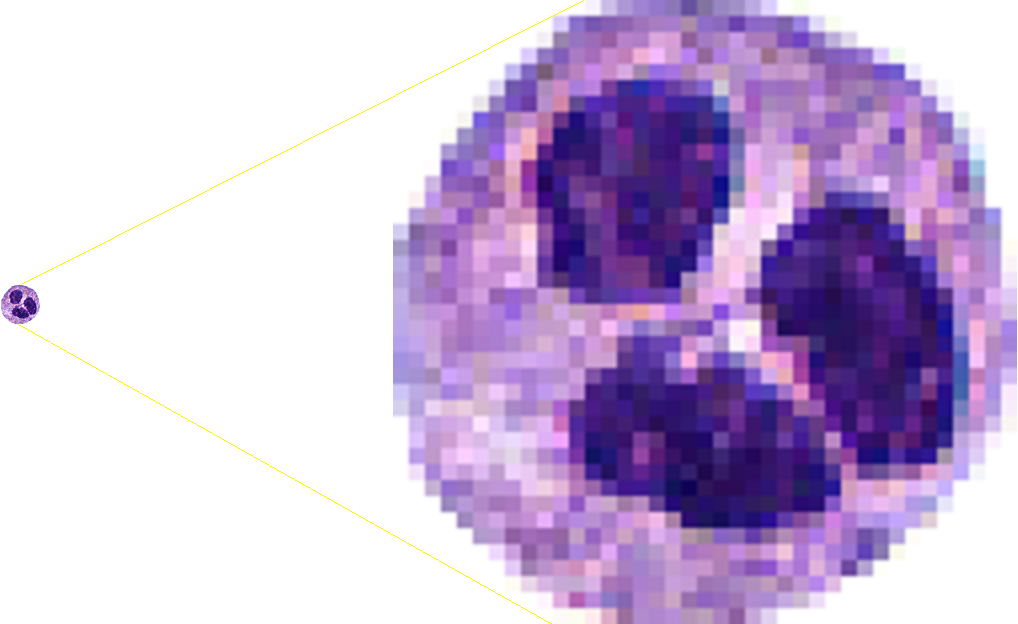
- Typical high definition computer monitors have 1920 columns and 1080 rows of pixels, making up a total of 1920 x 1080 = 2,073,600 pixels; 4K computer displays have 3840 x 2160 = 8,294,400 pixels
- Colors in a digital image are commonly based on the RGB color model, with an image depth of 24 bits (8 bits for each color: red, green and blue); in this color representation, the pixels that make up an image are composed of varying intensities of the 3 colors; each color has an intensity value ranging from 0 to 255 and the combination of these 3 color intensities will produce a specific color, giving a possibility of 16,777,216 colors (256 x 256 x 256 = 16,777,216)
- In image processing and analysis, the data are analyzed by performing various mathematical operations on numeric data derived from an image
- Image analysis techniques generally fall in the realm of traditional (hand crafted) and deep learning approaches
- Traditional methods require more manual work to identify features, while deep learning methods (e.g., convolutional neural networks) discover image features automatically during the training process
- For more details, see Computational pathology fundamentals & applications
- Image processing steps to modify and enhance image attributes are frequently involved to facilitate further processing or analysis of images
- Combination of different image processing techniques are usually needed to perform a particular type of analysis
- Image features, acquired through image processing techniques, can be combined with machine learning and statistical methods to categorize different types of cells, nuclei or cancer; dimensional reduction techniques, like principal component analysis (PCA) and t-distributed stochastic neighbor embedding (t-SNE), may be used to visualize the differences in classes through a 2 dimensional or 3 dimensional graph (e.g., type of cell) based on feature characteristics
- Image processing: application of a set of mathematical operations or computer algorithms to a digital image to alter the image or derive useful information from it
- Structuring element: defines the region / shape surrounding a pixel for morphologic operation
- 3 x 3 square structuring element is often used by default, if no structuring element is specified
- Below is a diamond shaped structuring element with a radius of 3; when used with a morphologic operation, every white region in the structuring element contributes to calculations that will determine the final value of the pixel that overlaps with the center of the structuring element (3,3)
- Image of the structuring element was created using Octave
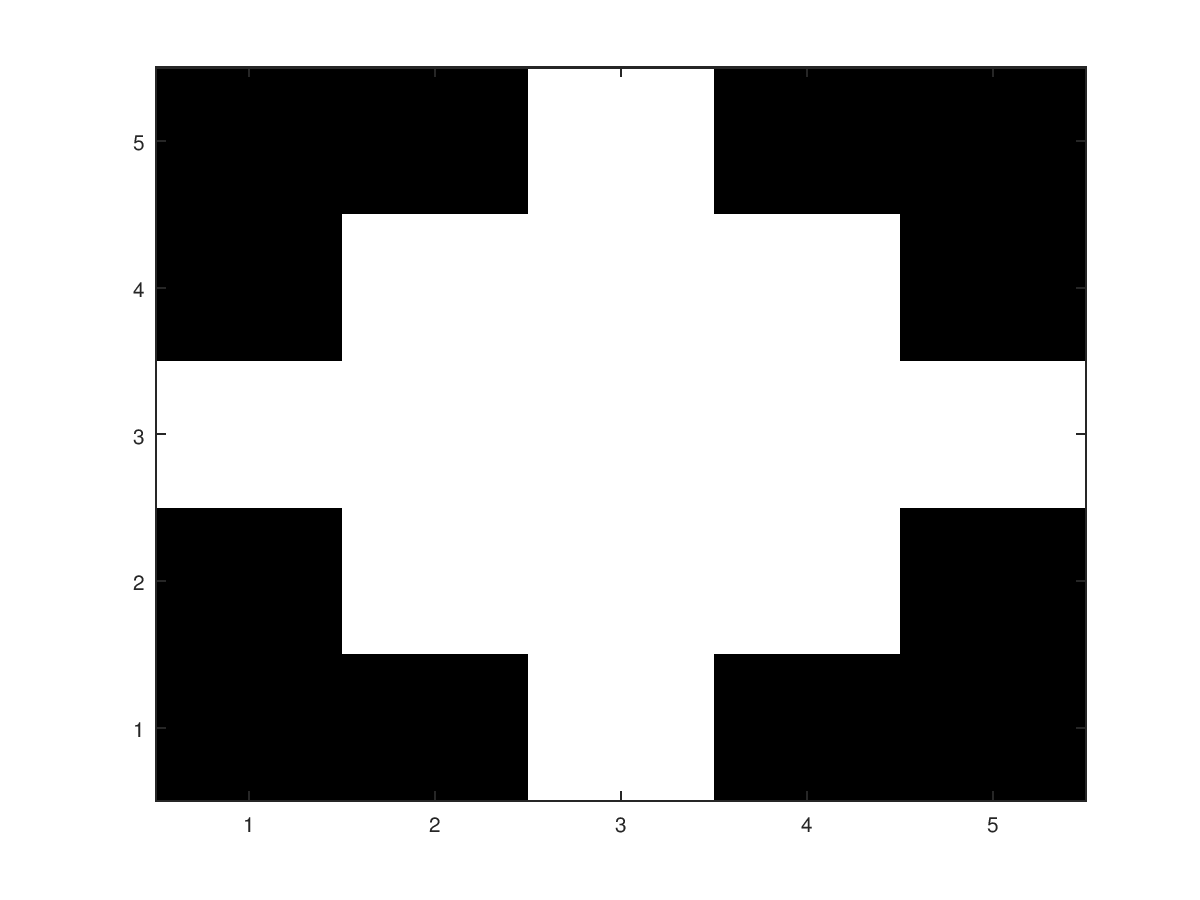
- Examples and methods shown below can be replicated using readily available tools such as ImageJ, GIMP and OpenCV and other open source software
- Grayscale operation: averages the value from each color channel to produce a black and white image
- Example of RGB image converted to grayscale
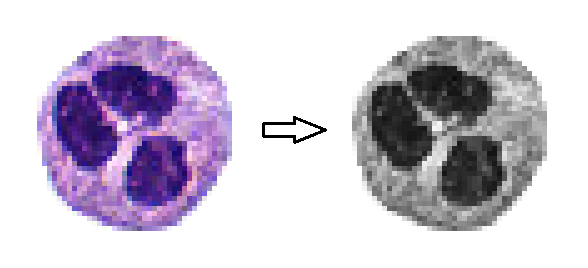
- To perform a grayscale operation using GIMP: load the image; then under the image menu, select "mode" and choose the grayscale option
- Example of RGB image converted to grayscale
- Histogram: shows the frequency of each color in a graph, with each color intensity arranged left to right from lowest to highest intensity
- ImageJ: analyze menu → histogram
- Histogram of the neutrophil above (red channel); analysis was performed using ImageJ

- Geometric transformations: rotation, scaling, cropping and shifting (these are often used in image augmentation for deep learning studies)
- Morphologic operations: erosion, dilation, opening, closing
- Dilation: enlarges objects
- Can be used to fill holes or for edge detection

- Note: diamond shaped structuring element illustrated above was used in this dilation operation
- Binary dilation at a pixel coordinate, returns a white pixel (value of 1) if any pixels within the vicinity of the pixel are positive (white); the vicinity is defined by a structuring element
- Grayscale dilation returns the maximum value (brightest pixel) in the vicinity of a pixel coordinate
- Erosion: shrinks objects

- Binary erosion at a pixel coordinate, returns a black pixel (value of 0) if any pixels within the vicinity of the pixel are zero (black)
- Grayscale erosion returns the minimum value (darkest pixel) in the vicinity of a pixel coordinate
- Opening: erosion followed by dilation
- Closing: dilation followed by erosion
- Dilation: enlarges objects
- Thresholding: excludes colors belonging to a specified range
- Helpful in identifying structures with distinct colors, like nuclei
- ImageJ: image menu → adjust → color threshold
- Below, the nuclei (in a case of clear cell adenocarcinoma) were highlighted using a thresholding operation, facilitating other image analysis procedures like morphometry, counting or segmentation of nuclei

- Edge detection: creates outlines of objects and can facilitate its separation from the surrounding background or other objects
- Convolution matrix: for edge detection, sharpening or blurring
- Most common: 3 x 3 matrix
- GIMP: filter menu → generic → convolution matrix
- Example: applying a 3 x 3 matrix composed of 1s will blur an image

- Normalization: increases the contrast of an image
- Contrast stretching
- Histogram equalization
- Watershed algorithm: useful for separating overlapping cells in an image so they can be counted properly
- Contour tracing: draws the boundaries of an object or region of interest
- E.g., drawing an outline around tumor regions to direct a laser microdissection machine to the appropriate regions for operation (J Pathol Inform 2018;9:45)
- Fourier transform: converts an image into a series of 2 dimensional sinusoidal (sine and cosine) waves
- Can be used to remove noise or smoothen an image
- Histogram of oriented gradients (HOG): can extract features from image regions and combine with machine learning methods to identify lesions (Biomed Signal Process Control 2022;74:103530)
- Augmentation: shifting, cropping, rotation, zoom, shear, color shift
- Often used in deep learning to improve model performance and reduce overfitting
- Convolutional neural networks (CNN): became popular in recent years for image classification tasks due to its ease of use, accuracy and increasing availability of computational power needed to run CNN experiments
- Transformers: a type of neural network originally designed for natural language processing; it has recently shown promise in medical image cancer identification, with performance rivaling that of CNNs (Biomed Res Int 2021;2021:6207964)
- Cell counting
- Mitosis detection
- Cancer / tissue segmentation
- Deep learning methods (J Pathol Inform 2016;7:29)
- Color thresholding
- Edge detection
- Color / texture based (J Pathol Inform 2011;2:13)
- Morphometry: measures the circularity, solidity, shape, volume, size, area and perimeter of objects (example: cells)
- These measurements may be used to train machine learning algorithms to classify objects (example: cells or nuclei)
- Dimensional reduction methods such as PCA or t-SNE can be used to visualize the differences between object classes based on the measurements
- Cancer identification
- Differential diagnosis engine
- Area detection
- Area measurement
- Colocalization: looks for color signals that are close to one another
- Can identify fluorescent signals that originate from the same region / cell
- Object tracking
- Volumetric processing of 3D images (PLoS Biol 2018;16:e2005970)
- Karyotyping
- Serum protein electrophoresis (SPEP) densitometry plot intensity measurement (Electrophoresis 2013;34:1148)
- Optical character recognition (OCR)
- Automatically extract text from images and scanned documents, which can save time compared to manual transcription (Gastrointest Endosc 2021;93:750)
- ImageJ
- GNU Image Manipulation Program (GIMP)
- Matlab / Octave
- Open Source Computer Vision Library (OpenCV): has interfaces for C++, Python and Java
- Scikit-image: Python image processing library
- OpenSlide: can extract image regions from several digital slide formats; libraries are available for C++ and Python
- CellProfiler: for cell morphometry, can extract numerous cell / nuclei features, which may be used for statistical analysis / machine learning with CellProfiler Analyst or other machine learning software
- Ilastik: interactivate segmentation and classification software where the user labels positive regions by drawing on them
- Stardist: Python object detection library, has Tensorflow dependency

Which image processing method can separate overlapping red blood cells?
- Grayscale operation
- Histogram equalization
- Rotation
- Watershed
- Closing
- Dilation
- Histogram equalization
- Watershed
- Also known as frozen section via telepathology
- Transmission of images to a remotely located pathologist during intraoperative consultation / frozen section
- Broadly classified into static, dynamic, robotic, whole slide imaging and hybrid (J Pathol Inform 2014;5:39, J Pathol Inform 2016;7:26)
- Static image telepathology with still photographs (snapshots)
- Advantages: low bandwidth requirement and quick image transmission with small image files, digital cameras (including cell phones) widely available, low cost and no complex software needed (Hum Pathol 2007;38:1330)
- Disadvantages: skilled person is required onsite to take photos, image quality depends on the experience of the photographer and only limited portion of tissue / slide examined (Anal Cell Pathol 2000;21:201)
- Dynamic telepathology with transmission of a video stream
- Advantages: low bandwidth requirement, remote pathologist can view more regions of a slide, overcomes focus issues and relatively low cost (Hum Pathol 2008;39:56)
- Disadvantages: skilled person is required onsite to examine (drive) slide, may have lag in video transmission and video files infrequently archived
- Robotic telepathology with remote pathologist controlling a remote microscope
- Advantages: no dependence on a person with microscopy skills to drive a stage, no delayed scan time, lower bandwidth requirements, access to freely navigate the entire slide, ability to select different magnification, real time control of focus
- Disadvantages: someone still needs to load a slide on the device, high cost, more complex software and IT setup
- Whole slide imaging (WSI) involves scanning a glass slide to generate a digital (whole slide) image (J Pathol Inform 2015;6:49)
- Advantages: high resolution image, access to the entire slide and WSI can be archived (Hum Pathol 2009;40:1070)
- Disadvantages: someone still needs to load a slide on the device to be scanned, relatively more expensive, larger footprint of device, high bandwidth requirements, longer time to scan whole slide and transmit large files, small tissue fragments or individual cells may fail to scan, inability to focus in Z axis (unless Z stack scanned) and proprietary file formats may need dedicated image viewers
- Hybrid (multimodal) uses a combination of the other techniques (e.g. WSI and robotic live microscopy) (J Pathol Inform 2016;7:26)
- Panoramic imaging uses a digital camera to stitch together a whole slide image in real time while a user examines slides on a conventional microscope
- Gross telepathology for transmitting images of intraoperatively removed specimens (macroscopy)
Contributed by Liron Pantanowitz, M.D.
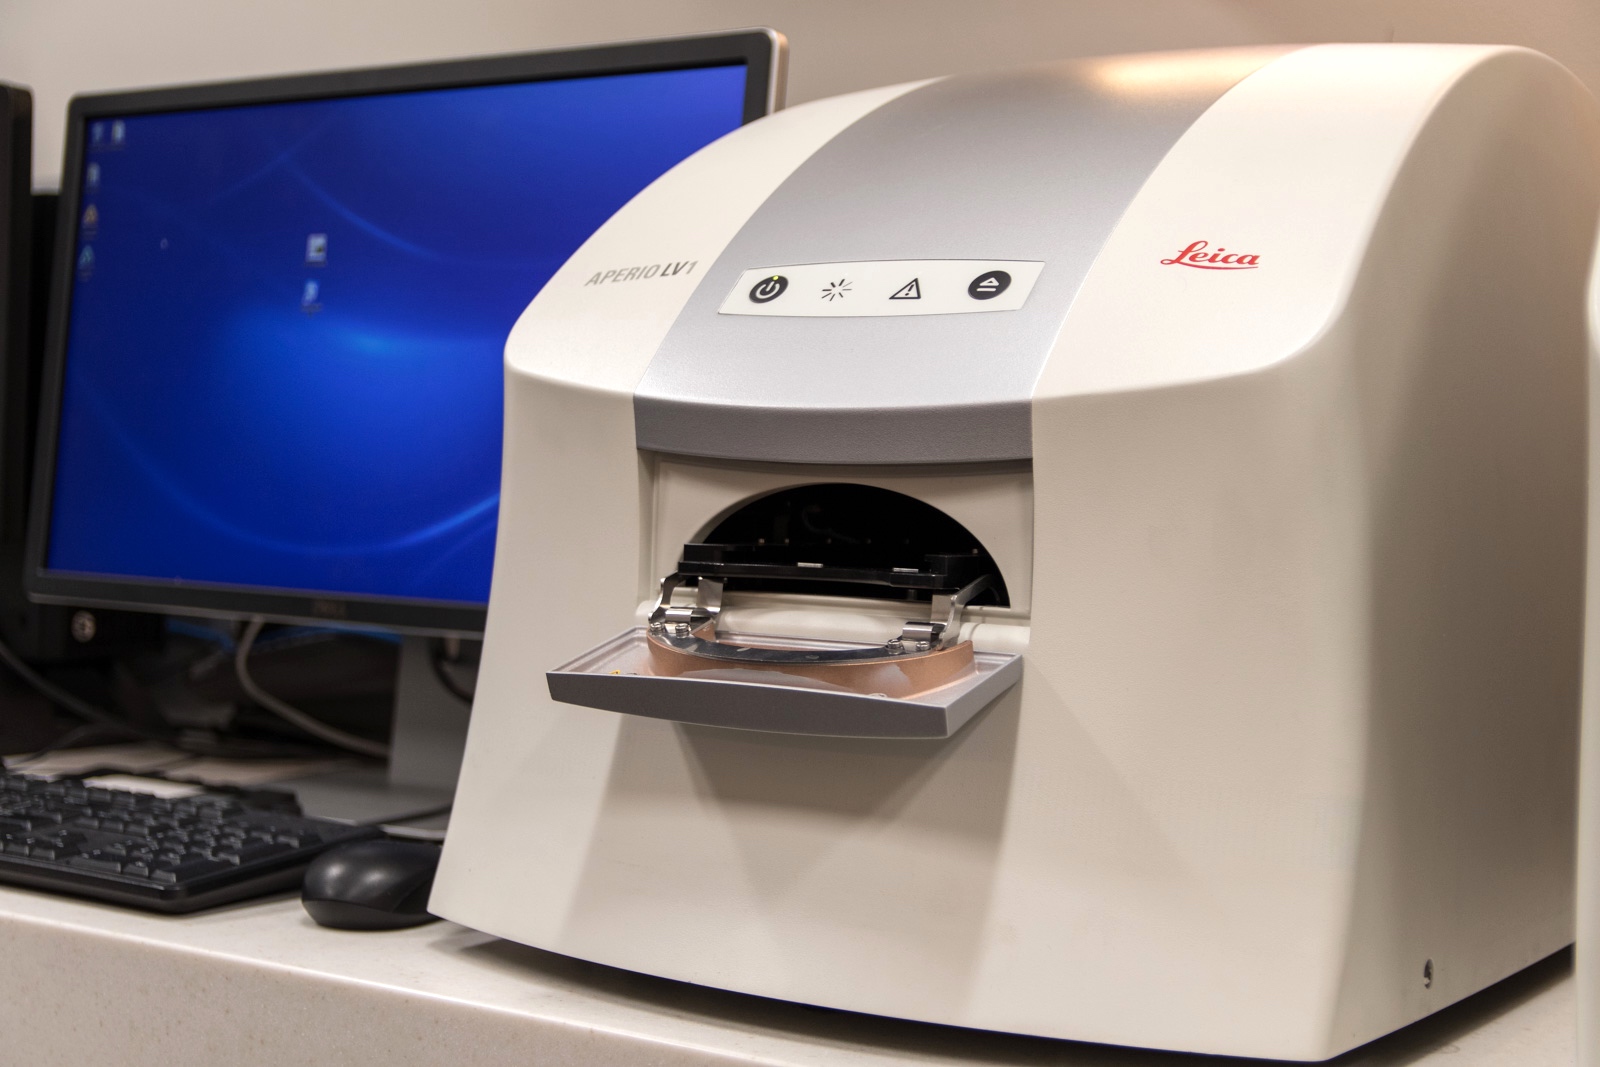
Hybrid WSI / robotic scanner
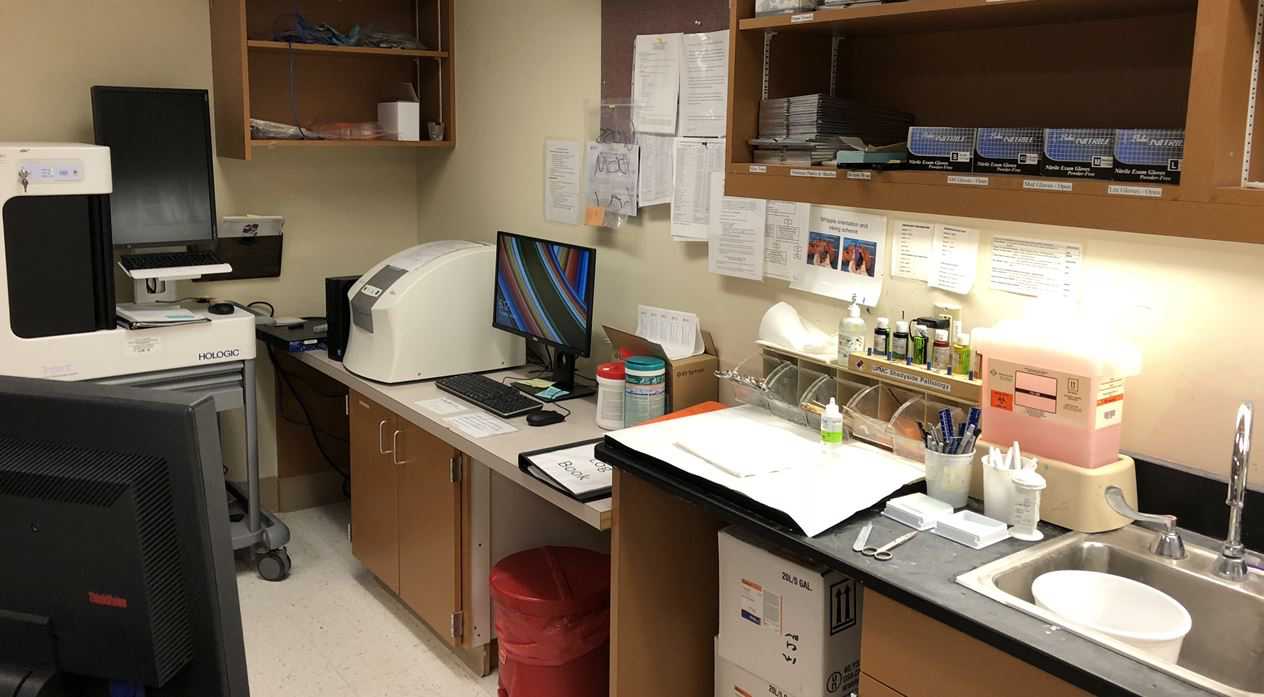
Frozen section suite
Images hosted on other servers:

Network topology
for interinstitutional
frozen section
telepathology
- Telepathology during intraoperative consultation (remote frozen section reads), especially for access to expert subspecialists (e.g. neuropathologists) and during nonbusiness hours (e.g. on call at night and weekends) with comparable accuracy to glass slides (J Pathol Inform 2015;6:55, Am J Clin Pathol 2020;153:198)
- Teleconsultation for a second opinion among pathologists
- Nonclinical use cases (e.g. education, proficiency testing, quality assurance, archiving)
- Decreased travel time for pathologists covering multiple locations and taking call at home (Hum Pathol 1991;22:514, Stud Health Technol Inform 2000;77:1127)
- Comparable accuracy to glass slides (Am J Clin Pathol 2020;153:198)
- General pathologists can have backup from off site pathologists for difficult frozen sections (J Clin Pathol 1999;52:761)
- Fewer subspecialized pathologists are needed at each location (J Pathol Inform 2015;6:55, Histopathology 2019;74:902)
- Preanalytical factors:
- Improper tissue sampling (Pathol Int 1996;46:436)
- Slide artifacts (tissue folds, air bubbles, excess mounting medium) (Anal Cell Pathol 2000;21:201, J Pathol Inform 2016;7:26)
- No access to view gross specimens (Anal Cell Pathol 2000;21:201, Mod Pathol 2002;15:1197)
- Handling multiple frozen sections and multiple specimens simultaneously
- Depending on the mode of technology, limited access to examine the entire slide (Gen Diagn Pathol 1995;141:105, Hum Pathol 1997;28:30)
- Image related problems: poor focus, limited resolution, color discrepancy and corrupt image file (Anal Cell Pathol 2000;21:169)
- End user unfamiliarity with the telepathology system (Zentralbl Pathol 1992;138:413)
- Difficult / borderline pathology cases (e.g. dysplasia, screening for microorganisms)
- Higher deferral rate (Pathol Oncol Res 2000;6:197, Am J Clin Pathol 2001;116:744)
- Potential delayed turnaround times (Anal Cell Pathol 2000;21:169, Diagn Pathol 2016;2:1)
- Downtime (e.g. telepathology system failure) (Histopathology 2019;74:902)
- Pathologist mindset (technophobia, reluctance, fear of making an error)
- System selection to match telepathology system with clinical need and available resources
- Deployment with appropriate IT infrastructure (sufficient network bandwidth, HIPAA security)
- Validation according to CAP guidelines (e.g. 60 cases for glass versus digital with 2 week washout)
- Downtime policy and procedure
- Documentation (e.g. state that telepathology was performed in the pathology report)
- Maintenance (regular IT checks that the system is online and operational)
- Quality assurance program (monitor frozen final discrepancy and deferral rates)
- Business operations (hospital privileges, malpractice coverage, avoid Stark law antikickback violations)
- Dynamic
- Panoramic
- Robotic
- Static
- Whole slide imaging
Comment Here
Reference: Intraoperative consultation telepathology
- Computer programming or coding involves sending a sequence of instructions (sometimes in the form of human readable codes), called programs, to electronic machines in order to
- Perform tasks
- Solve problems
- Provide human interactivity
- Programming languages are the building blocks for all software development, ranging from the simplest to the most advanced applications
- For a programming language to be effective, it must satisfy certain fundamental properties, such as reliability, efficiency, security, maintainability and robustness
- Readability of source code can affect the quality of a program, including its portability, usability and maintainability
- When effectively utilized, good programming methodologies can solve real world problems, such as inventory management, payroll processing, etc.
- Bugs can significantly hamper the software development process by introducing defects into a program and reducing its usability, hence the need for debugging
- One of the most significant tools for software development is the integrated development environment (IDE)
- IDEs are software development tools used by developers to simplify their programming and design experiences
- IDEs consist of a(n)
- Integrated user interface
- Code editor
- Debugger
- Code compiler
- Additional tools for automating certain parts of the software development process (TechRepublic: The 12 Best IDEs for Programming [Accessed 21 November 2023])
- IDEs can be classified into the following categories
- Multilanguage IDE
- This supports multiple programming languages
- Example: Visual Studio IDE
- Mobile development IDE
- These IDEs help software developers to build efficient mobile apps
- Examples include Android Studio and Xcode
- Web / cloud based IDE
- This type of IDE can be used to run heavy projects without occupying
- It is also platform independent, making it easy to connect to many cloud development providers
- Specific language IDE
- Multilanguage IDE
Images hosted on other servers:

Most popular programming languages
- 9th century AD: the Bhanu Musa brothers described an automated mechanical flute (Mech Mach Theory 2001;36:589)
- 1206 AD: Arab engineer Al-Jazari invented a programmable automated music drum machine capable of playing different rhythms and drum patterns via pegs and cams (MEJ 1967;54:45)
- In 1837, Charles Babbage wrote his first program for the analytical engine (arXiv: The First Computer Program [Accessed 21 November 2023])
- 1843: Ada Lovelace published an algorithm to calculate a sequence of Bernoulli numbers using Charles Babbage's Analytical Engine (IEEE Xplore: Lovelace & Babbage and the Creation of the 1843 'Notes' [Accessed 21 November 2023])
- 1880s: Herman Hollerith introduced the concept of storing data in machine readable form (Columbia: Herman Hollerith [Accessed 21 November 2023])
- 1949: a stored program computer capable of operating with a memory was introduced (Computer History Museum: Timeline of Computer History [Accessed 21 November 2023])
- 1952: Grace Hopper developed the first compiler related tool, the A - 0 system
- 1957: the first widely used high level language to have a functional implementation, known as Fortran, was released (Software Preservation Group: FORTRAN Session [Accessed 21 November 2023])
- Many other programming languages were developed afterward, including COBOL
- A programming language is a system of notation for writing code; it includes
- Computational model
- Syntax and semantics of the program
- Pragmatic considerations that shape the language
- There are hundreds of programming languages in existence (Wikipedia: List of Programming Languages [Accessed 21 November 2023])
- Programming languages are the building blocks for all software development, ranging from the simplest to the most advanced applications
- Computer programmers select programming languages based on their needs; below are a few popular programming languages
- Python
- Python can be used for data analysis, machine learning and web development
- JavaScript
- JavaScript is primarily used in web development and is usually the first programming language learned by beginner web developers
- It can also be used for mobile devices and game development
- C / C++
- Java
- C#
- Ruby
- PHP (freeCodeCamp: What is Computer Programming? [Accessed 21 November 2023)
- Python
- Despite the differences in programming languages, a few basic instructions appear in just about every language
- Input: gathers data from the keyboard, a file or some other device
- Output: displays data on the screen or sends data to a file or other device
- Arithmetic: performs basic arithmetical operations like addition and multiplication
- Conditional execution: checks for certain conditions and executes the appropriate sequence of statements
- Repetition: performs some actions repeatedly, with some degree of variation occasionally (Green Tea Press: How to Think Like a Computer Scientist [Accessed 21 November 2023])
- Choice of programming language depends on a lot of factors, including
- Company policy
- Suitability to task
- Availability of third party packages
- Individual preference
- Programming languages exist on a spectrum of low level to high level languages
- Low level languages are typically more machine oriented and faster to execute
- High level languages are more abstract and easier to use but slower to execute
- Developers find it easier to code in high level languages than in low level ones
- Categories of programming languages (freeCodeCamp: What is Computer Programming? [Accessed 21 November 2023)
- Machine language (MA)
- MA is a low level language that consists of zeros and ones (binary)
- High level languages are compiled into machine codes, which are in turn executed by a computer
- Assembly language (AL)
- AL is a low level language that is compiled by an assembler, which translates human codes to machine codes
- Procedural language (PL)
- PL goes through a series of procedures after which a program is executed on a computer (e.g., Go and Julia)
- Scripting languages (SLs)
- SLs are languages that require interpretation rather than compilation; an interpreter will usually read and execute the code instead of compiling the SL into machine code (e.g., JavaScript and PHP)
- Functional languages (FLs)
- FLs work by building complex programs through a collection of smaller functions (e.g., Haskell and Scala)
- Object oriented languages
- This language model builds programs around a collection of objects (e.g., Python and Java)
- Machine language (MA)
- For a programming language to be effective, it must satisfy certain fundamental properties
- Such properties include reliability, efficiency, security, maintainability, robustness, etc.
- Reliability
- Reliability refers to how often the results of a program are correct
- Poor reliability often results from noncompliance with good architectural and coding practices
- Reliability can be estimated by measuring the static quality attributes of an application
- Reliability of a program provides an estimate of the business risk associated with putting such programs into operational use
- To assess reliability, the following software engineering best practices should be evaluated
- Application architecture practices
- Coding practices
- Complexity of algorithms
- Complexity of programming practices
- Compliance with object oriented and structured programming best practices (when applicable)
- Component or pattern reuse ratio
- Dirty programming
- Error and exception handling (for all layers - GUI, logic and data)
- Multilayer design compliance
- Resource bounds management
- Software patterns that will lead to unexpected behaviors
- Software data integrity and consistency
- Transaction complexity level (Pham: Software Reliability, 2000 Edition, 2000)
- Efficiency / performance
- Efficiency measures the number of resources required by a program to yield an optimum outcome
- Such resources include the following
- Processor time
- Memory space
- Slow devices such as disks
- Network bandwidth
- User interaction
- The fewer resources consumed by a program, the better its efficiency / performance
- Other attributes of a good program include its ability to
- Clean up temporary files
- Eliminate memory leaks
- To assess efficiency, the following software engineering best practices should be evaluated
- Application architecture practices
- Appropriate interactions with expensive or remote resources
- Data access performance and data management
- Memory, network and disk space management
- Compliance with coding practices (best coding practices) (Techopedia: Code Efficiency [Accessed 21 November 2023])
- Security
- Good programming languages must possess quality software security (Synopsys: How Are Code Quality and Code Security Related? [Accessed 21 November 2023])
- Security vulnerabilities result from poor coding and architectural practices, such as
- Structured query language (SQL) injection
- Cross site scripting (IBM: Cost of a Data Breach Report 2023 [Accessed 21 November 2023], Bluefin: Key Takeaways from IBM and Ponemon’s 2020 Cost of a Data Breach Report [Accessed 21 November 2023])
- To assess the security apparatus of a program, the following software engineering best practices and technical attributes should be checked
- Implementation, management of a security aware and hardening development process (e.g., Security Development Lifecycle [Microsoft]) or IBM's Secure Engineering Framework (IBM: Security in Development - The IBM Secure Engineering Framework [Accessed 21 November 2023])
- Secure application architecture practices (IBM: Enterprise Security Architecture Using IBM Tivoli Security Solutions [Accessed 21 November 2023])
- Multilayer design compliance
- Security best practices (input validation, SQL injection, cross site scripting, access control, etc.) (SANS: CWE TOP 25 Most Dangerous Software Errors [Accessed 21 November 2023])
- Secure and good programming practices (Carnegie Mellon University: Top 10 Secure Coding Practices [Accessed 21 November 2023])
- Error and exception handling (CWE: 2023 CWE Top 25 Most Dangerous Software Weaknesses [Accessed 21 November 2023])
- Maintainability
- Maintainability refers to the ease with which a program can be modified by its present or future developers to
- Make improvements
- Customize it to varying needs
- Fix bugs and security holes
- Adapt it to new environments
- Good maintainability is best integrated into a program during its initial development phase (Wisdom Geek: Programming 101 - Tips to Become a Good Programmer [Accessed 21 November 2023])
- Maintainability concepts involve the following
- Modularity
- Understandability
- Changeability
- Testability
- Reusability
- Transferability from one development team to another
- Poor maintainability results from thousands of minor violations with
- Best practices in documentation
- Complexity avoidance strategy
- Basic programming practices
- This refers to practices that make the difference between clean, easy to read code and unorganized, difficult to read code (IfSQ: A Foundation-Level Standard for Computer Program Source Code [Accessed 21 November 2023])
- To assess maintainability, the following software engineering best practices and technical attributes should be checked regularly
- Application architecture practices
- Architecture, programs and code documentation embedded in source code
- Code readability
- Code smells
- Complexity level of transactions
- Complexity of algorithms
- Complexity of programming practices
- Compliance with object oriented and structured programming best practices (when applicable)
- Component or pattern reuse ratio
- Controlled level of dynamic coding
- Coupling ratio
- Dirty programming
- Documentation
- Hardware, OS, middleware, software components and database independence
- Multilayer design compliance
- Portability
- Programming practices (code level)
- Reduced duplicate code and functions
- Source code file organization cleanliness (Blanchard: Maintainability - A Key to Effective Serviceability and Maintenance Management, 1st Edition, 1995)
- Maintainability refers to the ease with which a program can be modified by its present or future developers to
- Robustness
- Robustness in computer science refers to the ability of a computer system to cope with errors during execution as well as its ability to cope with erroneous input (IFIP: A Model-Based Approach for Robustness Testing [Accessed 21 November 2023])
- In computer programming, robustness entails how well a program anticipates problems due to errors (not bugs); such problems include
- Incorrect, inappropriate or corrupt data
- Unavailability of needed resources such as
- Memory
- Operating system services
- Network connections
- User error
- Unexpected power outages
- A robust program differs from a nonrobust (or fragile) program by its adherence to the following 4 programming principles
- Paranoia: programmers should expect users to be able to break their codes and render them inefficient
- Stupidity: programmers should endeavor to write their codes in the most unambiguous way possible to enable even uniformed users to utilize their codes well
- Dangerous implements: programmers should hide their libraries and data structures from users to prevent them from modifying them with the intent of introducing a bug in the code
- Can't happen: developers should write their codes with the possibility of unlikely scenarios in mind and how to tackle such scenarios should they arise (UC Davis: Robust Programming [Accessed 21 November 2023])
- Usability
- Usability refers to the ergonomics of a computer program
- It is the ease with which an individual can use a program for its intended purpose or in some cases, even unexpected purposes
- Usability of a program can make or break its success irrespective of other issues
- Usability of a program can be designed using about 5 quality components
- Learnability: how easy it is for end users to carry out required tasks at their first encounter with the design
- Efficiency: the speed with which users can perform their tasks after they have become acquainted with the program design
- Memorability: the ease with which users can reestablish proficiency after a break from using the program
- Errors: how often users make errors and how easily they recover from the errors
- Satisfaction: how pleasant the design is to users (NN/g: Usability 101 - Introduction to Usability [Accessed 21 November 2023])
- Portability
- A computer software program is said to be portable if it requires very low effort to make it run on different platforms
- Thus, portability refers to the range of computer hardware and operating system (OS) platforms on which the source code of a program can be compiled / interpreted and run
- Factors influencing portability include
- Differences in the programming facilities provided by the different platforms, such as hardware and OS resources
- Expected behavior of the hardware and OS
- Availability of platform specific compilers (and sometimes libraries) for the language of the source code (TechTarget: What Is Software Portability? [Accessed 21 November 2023])
- Readability of a program is the ease with which a human reader can understand its purpose, control flow and operation of its source code
- Readability can affect the quality of a program such as its portability, usability and especially its maintainability
- Importance of readability boils down to the fact that programmers invest a great deal of time
- Reading codes
- Trying to understand codes
- Modifying existing source code
- Programmers would rather modify the source code than write a new one
- Unreadable codes are often plagued with bugs, inefficiencies and duplicate codes
- Simple transformations to make codes readable have been shown to shorten the codes and significantly reduce the time needed to understand them (CACM 1982;25:512)
- Several factors can influence the readability of codes, some of which include the following
- Consistency in programming style
- Different indent styles (whitespace)
- Comments
- Decomposition
- Naming conventions for objects (such as variables, classes, functions, procedures, etc.)
- Programmer's talents and skills in regard to content creation
- Use of integrated development environments (IDEs) to integrate various visual programming languages (IONOS: Source Code - What Exactly Is It? [Accessed 21 November 2023])
- Employing techniques, like code refactoring
- Programming methodology refers to the approach used by developers to analyze complex problems, plan and control the software development process needed to tackle such problems
- When effectively utilized, programming methodologies can solve real world problems such as
- Inventory management
- Payroll processing
- Student admissions
- Examination results processing
- To develop a formal software, the following step by step approach is utilized by some developers
- Requirements analysis
- Testing to determine value modelling
- Implementation
- Failure elimination (debugging)
- Each of the steps above can be approached in different ways
- For instance, a popular approach to requirements analysis is use case analysis
- Lots of programmers also use agile software development
- In agile software development, various stages of formal software development are integrated together into short cycles that take a few weeks rather than years (Developer.com: Top 10 Programming Methodologies [Accessed 21 November 2023])
- Lots of programmers also use agile software development
- Popular modeling techniques include
- Object oriented analysis and design (OOAD)
- Model driven architecture (MDA)
- Unified modeling language (UML) (a notation used for both OOAD and MDA)
- Popular implementation techniques employed by developers including the following
- Procedural programming: breaks down problems into blocks of code or procedures that perform 1 task each
- It is suitable for small programs with a low level of complexity
- Object oriented programming (OOP): in OOP, solutions to a problem are derived from objects that form part of the problem, especially from how the objects behave relative to one another
- Functional programming: functional programming does the following to solve problems
- Breaks down problems into functional units
- Ensures that each functional unit performs its own task and is self sufficient
- Units are then coupled together to form the complete solution
- Logical programming: in this method, problems are broken down into logical units rather than functional units
- Procedural programming: breaks down problems into blocks of code or procedures that perform 1 task each
- Note that developers may employ a combination of any of the above units in developing a software geared toward certain needs or purposes (Tutorials Point: Programming Methodologies - Introduction [Accessed 21 November 2023])
- Failure elimination (debugging) is discussed under a separate subsection below
- In programming, debugging refers to the process of finding and resolving bugs within computer programs, software or systems (Arrow: Debugging in Programming - Basics, Features & IDEs [Accessed 21 November 2023])
- Bugs are defects or problems that prevent the correct operation of a program
- Bugs can significantly hamper the software development process by introducing defects into a program to reduce its usability
- Some programming languages are more prone to bugs than others because their design does not allow multiple checks for bugs as other languages do
- Common coding errors include the following
- Syntax error
- Runtime error
- Semantic error
- Logic error
- Disregarding adopted conventions in the coding standard
- Calling the wrong function
- Using the wrong variable name in the wrong place
- Failing to initialize a variable when absolutely required
- Skipping a check for an error return (TechTarget: What Is Debugging? [Accessed 21 November 2023])
- Debugging is a multistep process that
- Detects possible problems, sometimes with the use of static code analysis
- Attempts to reproduce the problems, using static code analysis for instance
- Corrects problems or determines a way to work around them
- Tests corrections or workarounds and makes sure that they work (TechTarget: What Is Debugging? [Accessed 21 November 2023])
- Debugging strategies include the following
- Static code analysis: the developer analyzes the code without executing the program
- Print debugging (tracing): involves watching live or recorded print statements and monitoring flow
- Remote debugging: involves debugging a program running on a system different from the debugger (TechTarget: What Is Debugging? [Accessed 21 November 2023])
- Postmortem debugging: involves debugging a program after it has already crashed (Dr. Dobb's: Postmortem Debugging [Accessed 21 November 2023])
- Saff squeeze: involves isolating failure within the test using progressive inlining of parts of the failing test
- Time travel debugging or time traveling debugging: involves stepping back in time through source code to understand what is happening during execution of a computer program (Microsoft: Time Travel Debugging in WinDbg Preview! [Accessed 21 November 2023])
- Delta debugging: uses a technique of automating test case simplification (Zeller: Why Programs Fail - A Guide to Systematic Debugging, 1st Edition, 2005)
- Record and replay debugging: involves recording the execution of a software program so that it may be played back within a debugger to help diagnose and resolve defects (Wikipedia: Debugger [Accessed 21 November 2023], arXiv: Engineering Record And Replay For Deployability - Extended Technical Report [Accessed 21 November 2023])
- Relevant software for debugging
- Integrated development environments (IDEs) are often used for debugging
- IDEs can be either standalone products or they may be coupled with development hardware for a particular microcontroller (Arrow: Debugging in Programming - Basics, Features & IDEs [Accessed 21 November 2023])
- GNU debugger (GDB) is a portable debugger that makes use of a command line for debugging (Sourceware: Summary of GDB [Accessed 21 November 2023])
What a computer program is
Programming languages
Integrated development environment (IDE)
Debugging
Source code
- Emacs
- GNU debugger
- Integrated development environment (IDE)
- Python
Comment Here
Reference: Introduction to programming
- Maintainability
- Portability
- Readability
- Reliability
Comment Here
Reference: Introduction to programming
- A laboratory information system (LIS) is computer software that processes, stores and manages data from all stages of medical processes and tests (TechTarget: Laboratory Information System [Accessed 7 August 2023])
- A great deal of LISs are utilized by physicians and laboratory technicians to coordinate a wide variety of inpatient and outpatient medical testing, including microbiology, chemistry, hematology, transfusion medicine, immunology, etc.
- For a more comprehensive review and understanding, read through our previous Laboratory information systems (LIS) topic
- An ideal LIS should be able to improve the quality and cost efficiency of clinical laboratories and most importantly, improve the interface between healthcare providers and clinical laboratories (Arch Pathol Lab Med 2013;137:1129)
- The goal of an LIS should be to properly package the information produced by clinical laboratories for optimal use by clinical healthcare providers
- LIS should be able to replace humans in most activities that are predisposed to human error
- To arrive at a comprehensive, fully functional, user friendly and clinically useful LIS, all stakeholders should be willing to incorporate any combinations of the following into the current LIS
- Artificial intelligence
- Expert systems
- Advance database
- Data mining
- State of the art information technologies

- LIS should be capable of incorporating hyperlinks to test results (Arch Pathol Lab Med 2013;137:1129)
- These hyperlinks should lead to pages containing additional textual information regarding the test; such information may include any of the following
- Analytic parameters
- Half life of toxins
- Drugs
- Information on analytes
- Calculators
- Clinical guidelines
- Suggested follow up
- Literature references
- The information above will equip healthcare providers with the relevant data to interpret the results for clinical use
- These hyperlinks should lead to pages containing additional textual information regarding the test; such information may include any of the following
- An ideal LIS should be able to link pretest and posttest diagnostic data
- Such linkage will enable the LIS to display positive and negative likelihood ratios for selected diagnoses based on either the hospital information systems (HIS) or user input
- When a diagnosis is eventually selected, the LIS should display the following with appropriate references
- Sensitivity
- Specificity
- Accuracy
- Positive predictive value
- Negative predictive value
- Receiver - operator curves
- LIS should readily display possible significant interferences as well as causes of abnormal test results, such as
- Diseases
- Herbal supplements
- Medications (Arch Intern Med 2003;163:893)
- Relevant information extracted from the HIS by the LIS should be flagged for possible review
- LIS should be equipped with a discharge alert system aimed at preventing inadvertent hospital discharges before addressing unidentified or unaddressed abnormal clinically significant laboratory results (J Patient Saf 2012;8:69)
- LIS should be equipped with an expert system that allows the appending of interpretative comments on test results (Clin Microbiol Rev 2011;24:515, Clin Chem 1997;43:134, Stud Health Technol Inform 2004;107:89)
- Such systems should take note of pertinent clinical information of patients available in the HIS
- Should also possess a knowledge database that can be updated with local information, such as disease prevalence
- The table above shows useful flags that can be associated with test results (Arch Pathol Lab Med 2013;137:1129)
- LIS notification system should be governed by
- Institutional policy for certain results (e.g., critical results)
- User selected notification for routine reports using mechanisms, such as printout, fax, email, HIS alert
- Appropriate mechanism and timing for user notification should be selected using a rule based system (Arch Pathol Lab Med 2013;137:1129)
- Notification system for significant results in the LIS should be sophisticated
- There should be multiple tiers of urgency for significant results notifications
- One example of the above is the Massachusetts Coalition for the Prevention of Medical Errors, which established 3 levels of notification: red, orange and yellow (Jt Comm J Qual Patient Saf 2005;31:68)
- Red results imply an immediate danger of mortality or morbidity if immediate action is not taken
- Such results correspond to the Joint Commission's and College of American Pathologists's (CAP) definition of critical test results
- Consequently, the laboratory in such cases is mandated to directly notify a healthcare provider with the ability to intervene in patient care
- In addition, such notifications must be carried out within a given maximum timeframe determined by institutional policy (e.g., within 15 - 60 minutes)
- Such notifications also require acknowledgment of the receipt of the information by the healthcare provider or read back process
- Typical example of the above is when the patient's potassium level is 7 mEq/L (7 mmol/L)
- Orange results are highly significant results that must be acknowledged but are not immediately life threatening
- Such results are not usually life threatening and may wait several hours (e.g., 6 - 8 hours) before notification
- Examples of orange results include highly elevated creatinine, amylase, lipase and aminotransferase levels
- Provider in these circumstances should be notified by a high priority HIS alert
- Recipient is also required to acknowledge receipt of the information and possibly document steps taken following afterward
- There should be a cascading process of surrogate notification if the appropriate provider is unavailable
- Yellow level results may be associated with significant morbidity or mortality if diagnosis and treatment are delayed but are usually not immediately life threatening
- Yellow results require notification within 3 days
- Notifications can be made using passive methods, such as a HIS alert or chart note
- There should also be mandatory acknowledgment and tracking of the result
- Examples of yellow results include a high thyroid stimulating hormone (TSH), high lead level, a new diagnosis of cancer or human immunodeficiency virus infection
- Red results imply an immediate danger of mortality or morbidity if immediate action is not taken
- Notification of significant results should be done using artificial intelligence and expert decision making support systems to enable better identification of true positive signals (e.g., life threatening results) and minimize false positive signals (e.g., expected results)
- Expert system should also employ the various inputs previously described for order entry and autovalidation systems
- Dynamic rules should be employed to determine the criticality of results
- For example, using a single threshold to determine a low hemoglobin level is inadequate as chronic anemia is usually much better tolerated than acute anemia
- Thus, a dynamic threshold to detect a rapid rate of hemoglobin decline will be more clinically relevant in identifying at risk patients (Clin Lab Med 2008;28:83, J Am Med Inform Assoc 2007;14:674, Jt Comm J Qual Patient Saf 2005;31:68)
- LIS should be capable of notifying appropriate third parties using a rule based system
- These third parties include infection control and public health departments
- Notifications should depend on the laboratory result findings
- In addition, LIS should allow for rapid communication of changes or corrections made to the laboratory results
- These changes should be communicated to the providers and promptly updated on the interface of the HIS systems
- LIS should enable end users to inquire about laboratory testing, receipt of specimens and availability of results
- Links to appropriate online information should be available in the LIS
- Laboratory staff should also be readily contacted via the LIS should more information be needed
- LIS search engines should be fitted with state of the art technologies allowing for synonyms, misspellings and advanced Boolean combination of search terms (Am J Clin Pathol 2006;126:208)
- Users' activity should be made available to laboratory managers to enable them to improve the process
- Data mining here refers to the ability to perform queries into the laboratory and clinical databases (Arch Pathol Lab Med 2013;137:1129)
- Such inquiries help to maximize the efficiency and quality of laboratory operations
- Provides means of identifying clinical issues affecting a specified population
- Data mining enables epidemiologic and public health studies
- Also allows case finding for the purpose of clinical and research purposes
- An ideal LIS should possess advanced data warehouse and mining capabilities
- LIS should have search functions for combinations of laboratory and clinical information; such search functions should make use of Boolean logic and include things like diagnoses, medications and treating specialty
- LIS should produce reports with user customizable fields like patient demographics, specimen accession data and location
- Reports generated by the LIS should be exportable to spreadsheet programs for further analysis
- LIS should be capable of producing laboratory testing turnaround time reports that can be further split into the following categories
- Order to collection
- Collection to receipt in the laboratory
- Receipt in the laboratory to testing
- Testing to reporting
- LIS should also be able to group test results based on the following
- Accession areas
- Individual tests
- Test groups
- Hours or shifts
- Employee
- Patient location
- Clinics
- Providers, etc.
- LIS should be capable of reporting online surveillance data to public health agencies
- Such reporting should be done using the agencies required format as well as appropriate standards
- LIS should be able to track nosocomial infections and antibiograms
- Should also be capable of reporting the frequency distribution of microbial susceptibility to antimicrobial agents
- Should properly interface with pharmacy records and possess the ability to monitor antimicrobial utilization versus susceptibility
- LIS should contain laboratory utilization reports that can be grouped by the following parameters
- Providers
- Provider groups
- Specialties
- Clinics
- Wards
- Patient types
- Diagnoses and diagnostic groups
- ICD-9 / 10 codes, etc.
- Test types
- Test volumes
- Test costs per case
- LIS should provide appropriate real time feedback on utilization data to providers, especially at the time of the patient discharge
- LIS should employ data mining capabilities and clinical data extracted from the HIS to determine patient outcome analysis
- Example of useful clinical data that could be correlated with laboratory testing results in this regard includes mortality, morbidity, length of stay in the hospital and cost of care
- Further analysis of the parameters above can be done by stratifying patients based on diagnostic groups
- Method validation is used to assess the stability of assay systems and compliance with regulatory and accrediting agencies (Arch Pathol Lab Med 2013;137:1129)
- Usually precedes the implementation of new assays in the clinical laboratory
- Can also be done periodically usually in a summarized mode
- LIS module for method validation should possess the ability to guide and record the following studies using appropriate statistics and graphic displays
- Assay linearity and calibration verification
- Assay intra run and between run precision
- Comparison with the established methods or between analyzers
- Reference range validation
- Interference and recovery studies (Westgard: Basic Method Validation and Verfication, 4th Edition, 2020)
- LIS should alert laboratory staff on the need to perform validation procedures, such as biannual linearity checks and instrument correlations, whenever necessary
- LIS should be able to assist institutions to achieve the following goals
- Improved quality of healthcare delivery
- Improved outcomes of patient care
- Enhanced financial stability
- Competitive advantages (Arch Pathol Lab Med 2013;137:1129)
- LIS quality management system (QMS) should allow for enhanced quality throughout all the aspects of clinical laboratories operation
- Thus, the LIS should make provisions for quality control (QC) in the laboratory
- Quality control is the periodic assaying of samples with known reactivity or analyte concentrations to estimate assay accuracy and precision
- LIS QC should aim at improving the accuracy and reliability of laboratory results by maximizing error detection and minimizing false rejections of test runs (Clin Chim Acta 2004;346:3)
- LIS quality management module should support the following accreditation requirements
- College of American Pathologists (CAP)
- Clinical Laboratory Improvement Amendments of 1988 (CLIA) (Centers for Medicare & Medicaid Services: Clinical Laboratory Improvement Amendments (CLIA) [Accessed 21 July 2023])
- International Organization for Standardization (ISO) 15189:2003 standards (Clin Chem Lab Med 2006;44:733)
- LIS quality control protocols and alerting mechanisms should be based on the concept of total acceptable error derived from biological variation and regulatory requirements (Clin Chem 2022;48:395, Scand J Clin Lab Invest 1993;53:8, Clin Chem 2011;57:1334)
- LIS users should be able to customize the QC protocol based on
- Built in databases of biological variability
- Measured imprecision of the various tests at relevant clinical decision points
- Specific analyzer used to perform the test
- LIS quality control files for each assay system should contain
- Information about a particular quality control material, such as test components, lot number, expiration date
- Manufacturer
- Laboratory assigned control values for each relevant testing system
- Serial quality control test results associated with each control material and each analyzer
- Each patient test result should be linked to the relevant quality control results in an easily retrievable record
- System should schedule automated running of quality control and also alert appropriate staff to perform QC tasks
- LIS system should guide the user in QC rule selection; this should take into consideration the total acceptable error and analytic performance (precision and bias) of the testing system (Clin Chim Acta 2004;346:3)
- LIS should be able to customize active QC rules and reports based on
- Tests
- Test groups
- Analyzer types
- Laboratory location
- Work shifts
- LIS should be able to present QC results using sophisticated user definable displays including Levey-Jennings plots and interactive display of violations of user selected rules, such as Westgard rules
- QC reports should be easy to interpret
- Easy interpretation of reports allow staff to quickly make critical decisions about test acceptability
- Users should be able to access corrective guidelines for QC violations as well as troubleshoot QC related issues
- LIS users should be able to customize
- Date intervals
- Time scales and aggregate
- Split or compare multiple QC levels
- QC lot numbers
- Test groups
- Reagent cartridge
- Reagent lot number
- Analyzers
- Laboratory sections
- Multiple laboratories
- LIS should reliably interface with third party vendors for automated upload of QC data and real time download of peer performance data
- LIS should allow for real time documentation of corrective actions arising from QC failure
- LIS should allow for the removal of erroneous results and outliers from QC calculations based on appropriate statistical parameters and user input
- LIS should be capable of allowing a user guided assurance of quality on certain test runs by
- Allowing the system to automatically interrupt analysis or perform autoverification in case of QC failure
- Guiding staff into proper investigations and decision choices in case of QC failure
- LIS should be able to batch hold QC results so that users do not have to regularly switch screens to verify QC
- LIS should contain peer comparison statistics involving the following
- Range
- Mean
- Median
- Standard deviations
- Coefficient of variation ratio
- Youden charts
- Time based plots
- Histograms
- LIS should be able to import the parameters above from external interlaboratory programs
- LIS should allow for alternative means of quality control including moving averages of normal values of all results or by user defined criteria
- If all results are used, a median value should be presented
- Display of histogram results by test and various patient characteristics will provide valuable reports for quality monitoring
- These displays can be done with definable flags highlighting deviations from the historical frequency distributions
- LIS should provide user definable QC summary reports for review by supervisory and appropriate management staff
- LIS should have functionalities to interface with
- Instrument performance data
- Temperature monitoring systems
- Water quality parameters
- Environmental measurements
- Other data pertinent to good laboratory practice
- Accreditation requiring periodic documentation
- LIS should manage proficiency testing (PT) programs, such as
- Inventory control of PT materials
- Documentation of PT results
- Investigation of PT failures
- Online review and certification of PT results by appropriate management staff
- In addition, interfacing with external PT program providers should allow seamless transmission of PT data
- LIS should be able to manage accreditation requirements online, such as
- Preparation of appropriate documents, e.g.,
- Incorporation of checklists and questionnaires from accrediting agencies in a database allowing for tracking and documenting answers to checklist questions and inspection findings
- Containing links to relevant policies, procedures and other electronic documents as evidence of compliance
- LIS should be able to capture and manipulate data required for accreditation agencies, such as CAP or ISO 15189
- Preparation of appropriate documents, e.g.,
- LIS should possess a user friendly incident, error and process improvement tracking mechanism
- Tracking system should come with sophisticated database, querying and reporting functionalities (Clin Chim Acta 2009;404:28)
- LIS should also allow users to initiate reporting of errors and incidents in real time with an option of anonymity
- LIS should be capable of incorporating advanced administrative and financial functionalities as detailed below (Arch Pathol Lab Med 2013;137:1129)
- LIS should be able to generate and transmit the necessary forms and notifications for reimbursement of tests
- This should be done using the appropriate test codes selected, such as
- Current Procedural Terminology (CPT)
- Systemized Nomenclature of Medicine (SNOMED)
- ICD-9 or ICD-10
- This should be done using the appropriate test codes selected, such as
- LIS should be capable of intelligent generation of online and printed regulatory forms associated with laboratory testing, billing, compliance and accreditation
- Health Insurance Portability and Accountability Act of 1996 (HIPAA) standard transaction formats
- Medicare Waiver / Advance Beneficiary Notice forms
- These forms can be used at the point of care as well as in administrative locations
- Health Insurance Portability and Accountability Act of 1996 (HIPAA) standard transaction formats
- LIS should be able to track costs of laboratory operation, such as consumables, labor, amortization and other fixed costs
- LIS should carry out the following analysis
- Pricing
- Profitability
- Make or buy decision tools
- Outreach client management capabilities
- LIS workload statistics should be based on system variables, such as
- Time logged in
- Number of tests verified
- Instrument raw test counts
- User inputs
- LIS should be able to produce periodic reports of laboratory productivity and management efficiency using aggregate numbers (such as the following) for top down analysis
- Number of total and billable tests and interpretations (and who performed the interpretations)
- Number of full time employee equivalents (FTEE) (FTEEs are classified as technical, nontechnical and scientists / pathologists)
- Hours worked
- Laboratory costs (broken down by section, variable versus fixed, etc.)
- Number of patients (outpatient visits, discharges, bed days, etc.)
- LIS should be able to carry out individual cost and productivity analysis per test and per laboratory work group for bottom up financial and productivity analyses
- LIS should be able to help with user definable financial and productivity calculations, such as
- Costs per billable test
- Costs per FTEE
- Paid hours per FTEE
- Number of tests
- Costs per patient (different categories)
- Comparison with benchmarks
- Ability to customize granularity (e.g., whole laboratory, laboratory section, accession group, individual test)
- LIS should be equipped with inventory and materials management, such as functionalities for automated ordering from selected suppliers and real time tracking of budget
- LIS should possess a document management system (DMS) with readily accessible procedure manuals from testing information menus
- DMS should also contain mechanisms for periodic notification, review and certification by appropriate parties
- DMS should equally allow scanning and proper linking of pertinent documents, such as reagent and QC package inserts, test requisitions and reports from outside laboratories
- LIS personnel management capabilities should contain
- Interfacing with human resource databases
- Labor costing accounting
- Tracking of credentials
- Competency
- Continuing education training
- Performance appraisals
- LIS should provide an interface to online continuing education and role based competency training modules
- LIS should have the capacity to record large datasets and interface with legacy systems (in real time or through import functions) to capture historical laboratory data
- Goal of these is to store lifelong results of patients
- LIS should be capable of
- Handling large genomic data sets
- Providing meaningful reports
- Providing just in time education to clinical providers (Hum Genet 2011;130:33)
- LIS should capture industry appropriate standards for coding, billing, document generation and interface formats, such as
- CDC
- HL7 CDA1/2
- XML
- ASC X12
- LOINC
- SNOMED-CT
- ICD-9
- ICD-10
- LIS should also be able to map dictionaries for interconversion between the different standards
- LIS user interface and navigation should be intuitive and user friendly
- LIS should be able to minimize the number of keystrokes required for all activities and use automatic return where necessary
- LIS should have uniformity for similar tasks within the software (e.g., using enter for all programs rather than clicking OK for some and double clicking for others)
- LIS should print and export all screens and reports in appropriate document text, spreadsheet or graphic formats
- LIS should possess a fully functional text editor in text entry fields with rich text and common word processing functionalities
- LIS should be able to appropriately capture and retain data with rapid retrieval in the event of system failure
- LIS auditing capabilities should track changes in all data made by the user; such changes include results, QC, patient information, etc.
- LIS interface with single or multiple HIS systems should be flexible in data formats and fully functional; in addition, it should also contain appropriate routines for testing the functionality of the interfaces before use to meet end user expectations
- LIS interface with HIS should allow real time updating of the LIS with pertinent information like patient location and provider
- In addition, laboratory data should be rapidly available in all interfaced HIS systems
- Of particular interest should be the interface between the LIS and the following pharmacy software
- Drug and test selection
- Detection and prevention of drug reactions
- Drug - laboratory interactions
- Monitoring of drug levels (Arch Intern Med 2003;163:893)
- LIS should integrate the following to enhance communication among laboratorians and laboratory users
- Instant messaging
- Forums
- Online meetings
- Social networking capabilities
- LIS should be able to perform multiple functions simultaneously with imperceptible impact on its speed
- In laboratory areas where manual activities are carried out, the LIS should be able to
- Minimize the number of keystrokes used
- Minimize the waste of time and energy
- Retain LIS overall performance regardless of workload (Arch Pathol Lab Med 2013;137:1129)
- Improve the interface between healthcare providers and clinical laboratories
- Improve the quality and cost efficiency of clinical laboratories
- Incorporate advanced administrative and financial functionalities into the hospital information system and overall function of clinical laboratories
- Replace humans in most activities that are predisposed to human error
Comment Here
Reference: LIS additional features
- A laboratory information system (LIS) is computer software that processes, stores and manages data from all stages of medical processes and tests (TechTarget: Laboratory Information System [Accessed 10 May 2023])
- LIS manages the following systems
- Patient check in
- Order entry
- Specimen processing
- Results entry and patient demographics
- In summary, the LIS tracks and records the entire patient's encounter with the laboratory and stores such records in a database for future reference
- Data captured and processed in an LIS reduces the turnaround time of laboratory tests and significantly decreases the errors associated with the manual clinical data transcribing process
- Laboratory information systems possess the following notable features
- Sample registration and monitoring
- Quality control assessments
- Workflow management
- Detailed reports and analytics
- Inventory tracking
- Equipment integrations
- Data management and storage
- Strict compliance with standard operating procedure (SOP) guidelines (see Videos)
- Reference: TrustRadius: Laboratory Information Management Systems [Accessed 10 May 2023]
- LIS is only certified to be of functional capacity when it meets the meaningful use program criteria of the 2009 Health Information Technology for Economic and Clinical Health (HITECH) Act (athenahealth: What is Meaningful Use? [Accessed 10 May 2023])
- Such certified LIS is usually referred to as an electronic health record [EHR] module
- Some of the meaningful use program measures include the
- Electronic submission of lab test results to public health agencies
- Incorporation of clinical lab test results into a certified EHR system
- Optimal functionality of an ideal LIS will depend on the modules in figure 1 (see Diagrams / tables)

- Components of an ideal LIS include
- Information security
- Test ordering
- Specimen collection, accessioning and processing
- Analytic phase
- Result entry and validation
- Result reporting
- Notification management
- Data mining and cross sectional reports
- Method validation
- Quality management
- Administrative and financial issues
- Operational issues (Arch Pathol Lab Med 2013;137:1129)
- Ideal LIS will prevent unauthorized access from internal and external threats (Arch Pathol Lab Med 2013;137:1129)
- This in turn will preserve the confidentiality of health records
- It also ensures that only legitimate users can be granted access to the system
- Physicians can access the information of their patients but are restricted from accessing information of other patients outside their care
- Quality assurance experts are allowed access only to certain information on all the patients
- Multistrata security system should be adopted, just as shown in table 1 below

Categories of LIS users
- LIS should be fitted with secured interfaces and advanced capabilities (e.g., biometric recognition, radiofrequency identification devices [RFIDs])
- These capabilities will minimize keystrokes and login time
- They also provide quick automated logout upon leaving the workstation
- LIS should be capable of tracking and displaying the testing process live to minimize multiple login requirements by the management team
- Healthcare providers should be able to login remotely into the system using a secure web browser and from mobile and handheld devices (J Pathol Inform 2012;3:15, Clin Exp Med 2008;8:117)
- System should allow for the authentication of data and documents using efficient electronic signatures
- Test ordering (TO) is one of the laboratory steps that can benefit most from the LIS (Arch Pathol Lab Med 2013;137:1129)
- If managed by the LIS, TO will significantly improve laboratory utilization
- TO systems, when synchronized with intelligent decision support systems, will reduce turnaround times, decrease patient's length of stay and optimize test utilization among care providers (Stud Health Technol Inform 2009;150:527, J Pathol Inform 2011;2:35)
- For the TO system to be effective, immediate feedback must be relayed to the user
- Effective LIS allow providers to enter their test orders using the computerized provider order entry (CPOE) systems
- Computerized provider order entry systems must match the routine work processes of healthcare providers as well (Stud Health Technol Inform 2011;169:487)
- LIS should contain the following information from the ordering provider
- Ordering provider information
- Name (mandatory)
- Specialty
- Address (for providers in a different / remote location)
- Contact media (e.g., email addresses, mobile and desk telephone numbers, pagers, etc.) for routine feedback from the laboratory (mandatory)
- Additional recipients of patients' results (e.g., additional healthcare providers and other legally authorized individuals)
- Efficient notification protocols, such as
- Notifying providers when results are available
- Notifying providers when results exceed the reference range or custom threshold limit
- Ability to use multiple notification media effectively, such as
- Health information systems (HIS) overriding alert
- HIS alert on patient records
- Emails
- Short message service (SMS) text messages
- Automated phone calls
- Beeper
- Telefax, etc.
- Failsafe features must be built into important notifications (e.g., critical results)
- Providers should be able to provide acknowledgments of receipt of information from the laboratory
- Unacknowledged information should be escalated by the system using predetermined protocols (Clin Chem 2010;56:417)
- Patient information
- Patient identification
- Last and first names
- Institutional or social security number
- Unique coded audit trails for research or environmental specimens
- Patient demographics
- Date of birth
- Age
- Sex
- Race
- Ethnicity
- Prior names
- Patient address
- Permanent address
- Current location for hospitalized patients
- Codified diagnosis
- Preliminary diagnosis by the International Classification of Diseases (ICD)-9 or ICD-10
- Additional clinically relevant data (e.g., reason for the study)
- Codified results of nonlaboratory results
- Vital signs, height and weight
- Medications, including
- Dose of medication
- Date of prescription
- Mode and timing of administration
- Use of herbal medications and other supplements
- Diet and mealtimes to determine if the patient was fasting at the time of test order
- History of medical procedures (e.g., surgical procedures, radiologic procedures)
- Obstetric and gynecologic history
- Additional pertinent patient clinical information
- Patient identification
- Order information
- Requested test(s)
- Sources of requested specimen(s)
- Date and time of order
- Day and time of specimen collection including when specimen collection began and when it ended
- Test order repeat frequency (usually done for standing orders)
- Special patient preparation instructions prior to specimen collection
- Urgency of the test
- Those responsible for the test collection (e.g., patient mail in, point of care, ward or nursing unit, routine phlebotomy rounds, laboratory collection)
- Free text comments and instructions to the laboratory
- Ordering provider information
- LIS should be fitted with automated systems capable of harvesting patient information, previous test results and clinician’s input (including differential diagnosis) to suggest appropriate tests, test frequency and interpretative data (Stud Health Technol Inform 2011;169:487, Ann Intern Med 2001;134:274)
- LIS should contain a user friendly display of test catalog, which includes
- Tests performed by external reference laboratories
- Ability to group results in alternate ways (e.g., alphabetically, by laboratory discipline, by clinical situation)
- Menus on the interface must be consistent, complete and regularly updated
- Standard nomenclatures consistent with all HIS should be employed
- Items to be included in test catalog's entry should consist of those listed in table 2 below

Items to be included in test catalog entry
- LIS should be able to restrict certain test ordering based on
- Location
- Diagnosis
- Healthcare provider’s specialty, etc.
- LIS should be able to specify tests that need approval from specialized health providers such as clinical or laboratory specialists
- This approval system should be able to automictically notify the approver
- It should be able to inform the ordering provider of pending tests needing approval
- LIS should be able to differentiate research specimens from patient care specimens
- It should enable different billing procedures
- Research orders should be attached to research management systems
- LIS should operate on an order appropriateness expert system as outlined in table 3 below

Desirable functionalities
of order appropriateness
expert system
- LIS ordering system should be capable of relaying orders to different interfaced systems
- LIS at different institutions should be able to relay relevant information to one another without manual intervention
- Tests ordered at one institution should enable specimens to be collected and accessioned in another
- Reference laboratories should list their laboratory catalog online for easy access to ordering providers
- LIS should also enable participating institutions to implement institution specific restrictions and approval processes for ordering, testing and reporting
- For outgoing tests, LIS should be able to handle all information related to shipping the specimen (AMIA Annu Symp Proc 2010;2010:76)
- Ordering providers should have access to real time feedback from the ordering system of the LIS about each step of the process
- Real time progress can be reported as follows
- Order acknowledged by laboratory
- Specimen(s) collected
- Specimen(s) accessioned
- Accession(s) activated in laboratory
- Analysis completed
- Results verified
- Results reported; order completed
- LIS TO system should be able to split the laboratory orders such that one order can consist of multiple tests requiring multiple specimens and accessions
- Each component of an order should be tracked separately in real time as well
- Real time progress can be reported as follows
- Quality of laboratory results is significantly determined by standard and appropriate specimen collection and processing (Arch Pathol Lab Med 2013;137:1129)
- Specimen collection produced by the LIS should meet institutional requirements (e.g., the LIS should produce preprinted accession labels using the appropriate list of patients for phlebotomy)
- List should indicate to patients the location and time of their phlebotomy (phlebotomy routes) in the most efficient manner possible
- LIS should provide the specimen collector with an online or printed display of specimen collection instructions in an accessible step by step format
- Relevant online links containing a complete procedure guide should also be provided
- LIS should provide the specimen collector with a list of pending laboratory orders
- It should be capable of generating unique barcoded or RFID labels at patients' bedside upon scanning patients' identification wristband (J Med Syst 2011;35:1403, Ann Emerg Med 2010;56:630)
- Labels generated at the point of collection should include
- Minimum of 2 patient identifiers
- Date and time of specimen collection
- Collector identity
- Urgency of the order
- Abbreviated names of tests requested
- 2 dimensional bar codes or RFID labels should be used to allow for more significant amounts of information to be attached to the specimen
- After arriving at the laboratory, the LIS should be able to recognize specimens by scanning the labels attached to such specimen containers
- LIS in the laboratory should also initiate testing once a specimen arrives in the laboratory in a robotic specimen processing automation line where applicable
- LIS should allow the collector to enter pertinent patient information in codified or free text form to allow for proper interpretation of certain laboratory tests (see table 4 below)

Free text information for specimens
- LIS should support bidirectional interfaces with portable devices for patient identification, specimen accessioning and point of care testing
- Point of care testing should be integrated with those from main analyzers
- Sources of test results should be identifiable as well
- LIS should also interface with a point of care management system to track instruments, reagents, quality control, user identity, training and competency records
- LIS should be able to record the accessioning of specimens separately (e.g., it should be capable of matching an order with a physical specimen)
- It should be able to acknowledge receipt of the specimen at the laboratory
- It should also be able to activate the specimen for analysis
- Mode of operation listed above can be summarized in the example below (adapted from Arch Pathol Lab Med 2013;137:1129)
- Phlebotomist scans the patient barcoded wristband and chooses an appropriate pending order
- System records the collection time and accessions the specimen
- Portable device carried by the phlebotomist prints an accession label
- Specimen is collected and labels are affixed to the specimen container in the presence of the patient
- Specimen is then sent to the laboratory
- Specimen accession labels are scanned at the laboratory reception desk upon arrival to confirm receipt by the lab
- They are then transported to the analytic section of the laboratory
- Labels are once more scanned when the specimen is placed in an automated robotic specimen processing line and the accession is then activated for analysis
- Entire process can be divided into order to collection to accession to receipt to activation to report
- Last component (activation to report) is referred to as the analytic time
- Previous components are referred to as the preanalytic time
- It is important to note that only the receipt to report processes are under complete control of the laboratory
- Using these time points, troubleshooting of the system can be efficiently done to resolve specimen collection, accessioning and processing issues
- LIS should allow institutions to customize their specimen processing systems in ways that are different from the processes outlined above; e.g.,
- Specimens received in the laboratory without an order but with appropriate patient identifiers should be acknowledged by the system pending the arrival of an appropriate corresponding order
- LIS should also allow the laboratory staff to enter a paper or verbal order into the system in certain cases
- When properly identified specimens without accession labels arrive at the laboratory with either a paper or electronic order, the laboratory should be able to verify the order and specimen
- Lab can then proceed to accession the specimen and apply appropriate labels or RFID tags to it
- LIS should be able to accession and process nonpatient specimens such as
- Animal specimens
- Research specimens
- Environmental specimens not associated with a patient
- Quality control and validation materials
- Proficiency testing materials
- LIS should also be able to codify and deidentify specimens for research purposes
- It should also be able to contain database management capabilities for biobanks and tissue repositories
- LIS should interface with the laboratory automation management software to enable the preanalytic requirements specified in the ordering process to be transmitted to the specimen processing system; examples of such preanalytic requirements include
- Centrifugation speed
- Time
- Number of aliquots
- Reflexive testing
- LIS should track the specimen location throughout the preanalytic, analytic and postanalytic phases of the specimen testing
- Transportation to various aspects of the laboratory and to external sites should also be tracked
- LIS should also keep track of the specimen storage management (J Med Syst 1998;22:137)
- Storage management should include the ability to easily retrieve the precise specimen storage location
- It should also include periodic reports to facilitate batch disposal of specimens
- LIS should be able to generate multiple specimen aliquot labels
- These labels can then be scanned to execute the appropriate testing associated with each aliquot
- System should also be capable of tracking the management and storing of multiple aliquots or slides derived from 1 specimen
- Analytic phase of the LIS has the most technological advancement in terms of clinical laboratory science and is hence least prone to errors in the clinical laboratory (Arch Pathol Lab Med 2013;137:1129)
- LIS can be interfaced with the analytic instrumentation software (also known as middleware) for the following processes
- Streamlining the processing of analytic requests
- Directing testing to the appropriate instruments
- Recalling specimens for repeated testing
- Directing specimen dilutions
- Performing reflexive testing
- Processing add on requests for additional tests
- Record test results and appropriate comments
- LIS should be able to track, record and store all the relevant information associated testing and assays as shown in table 5 below

Analytic phase relevant data
- LIS should enable the analyst display on the screen or print out appropriate standardized testing procedure for each test (especially for manual assays)
- LIS should be able to oversee the maintenance of the testing instrument in the following ways
- Testing instruments record should be updated with each patient test
- Analyzer record should include all the information in table 6 below
- Analyzer should provide links to online preventive maintenance and service records
- In specified cases, the instrument manufacturer should be automatically notified of the instrument's functional status

Laboratory analyzers relevant data
- LIS should produce laboratory specific worklists capable of
- Facilitating batch processing
- Facilitating the production of manual and automated test results
- Tracking orders that are yet to be completed
- Expanding worklist after additional specimens are added by scanning the specimen's barcodes or RFID tags
- LIS should be able to display lists of accessioned but uncompleted tests, especially when such tests have exceeded their allotted time
- Display can either be live on the computer screen or on demand
- LIS should also be able to pinpoint at which point the failure occurred
- Incomplete lists should include tests that were sent to reference laboratories
- Displays can be done on large screens for instance in the emergency room
- Color coding can be added to the displays to bring attention to tests that have exceeded their allotted predefined time limit
- List should be able to be sorted by age of request and other demographic parameters
- Goal of such displayed lists is to alert staff to ensure that such test failures are quickly rectified and in so doing, improve the test turnaround time for patients
- LIS should guide analysts into providing high quality results that are accurate, reproducible and appropriate for the clinical situation (Arch Pathol Lab Med 2013;137:1129)
- LIS should allow for high quality results entry and validation
- It should be able to record results in various data formats (e.g., numbers, text with extended characters, images; the LIS data storage system should be flexible enough to avoid constraining limits on data size)
- Interfaced and noninterfaced analyzers as well as manual tests should allow for
- Automated entry of results
- Manual entry of results
- Application of standard security levels to results entry and reporting
- Options should be available for the following types of result entry
- Individual result entry
- Batch results entry
- Batch entry by exception
- Amended results
- Appended results
- Intermediate and final results
- Results can also be entered as individual tests or by panels with user definable panel configuration
- LIS should allow for different levels of results certification such as the ability to withhold release of results until approval is gotten from a higher level user (e.g., a supervisor)
- LIS should be able to receive results in different formats such as
- In the form of tables and graphs from other laboratories
- Via electronic interfaces for easy integration of the results into existing electronic records
- Receiving results from multiple laboratories in multiple formats will help diagnosis of diseases, like leukemia
- Diagnosis of leukemia requires clinical information, hematology, hematopathology, molecular and flow data reports
- LIS should have the ability to engage advanced expert decision support for autovalidation of results (Clin Chem 2000;46:1811, Eur J Clin Chem Clin Biochem 1997;35:711)
- Autovalidation significantly improves the efficient running of the laboratory by bypassing human intervention in the certification of laboratory results (Accredit Qual Assur 2002;7:431)
- System employed to perform autovalidation must be sophisticated enough to significantly reduce the probability of reporting erroneous results
- It should also allow adequate time for human specialists to examine exceptional results
- Artificial intelligence inputs needed to provide an autovalidation of test results involves
- Comparing the results with patients' previous test results the system's record in or database (temporal delta checks)
- Comparing the results with results of other related tests in the same or closely related specimens (cross sectional check) (e.g., creatinine versus urea)
- Examining specimens for predefined limits of hemolysis, lipemia or icterus
- Making use of clinically relevant demographic information such as location (inpatient versus outpatient), type of clinic, diagnoses, medications, procedures
- Making use of internal and external quality control results
- Making use of statistical data on result distribution (Clin Chem 2000;46:1811)
- LIS temporal delta checks abilities should include
- Analysis of temporal data
- Calculation of rates of change and absolute changes in reference to predetermined limits subject to variations based on patient demographics, diagnoses, therapies and other relevant patients' clinical records (Clin Lab Med 2008;28:83, J Am Med Inform Assoc 2007;14:674)
- LIS expert system should possess the ability to order reflexive testing based on results analysis and clinical data
- Policies regarding such reflexive testing should be set by the institution or laboratory
- Reflexible testing should also be customizable by the ordering provider
- It should also interface with the specimen processing and analytic systems
- In addition, the LIS should be able to append appropriate codes or comments to the results (Arch Pathol Lab Med 2013;137:1129)
- LIS should be capable of providing a variety of test results that can be organized as follows
- Test
- Test group
- Date
- Date range
- Ordering provider
- Provider group
- Clinic or specialty
- Sequential worksheets
- Tabulated cumulative worksheets (Arch Pathol Lab Med 2013;137:1129)
- LIS should measure the actual value of test results and display numeric values in the following format
- Units of measurement
- Reference interval of the appropriate patient population such as ambulatory patients, recumbent patients, sex, age, race, body mass, gestational age, menstrual cycle phase
- Above reference populations should be user configurable when used as clinical inputs
- There should be a measure of individuality to guide the interpretation of reference ranges (Clin Chem 2002;48:395)
- Tests with high individuality usually have a within subject variability that is much lower than between subject variability
- In such cases, an appendage should be provided highlighting the fact that individual based reference changes are more appropriate than population based reference intervals
- In reference ranges with individuality coupled with enough recorded data of the patient, the system should be able to calculate and display individual specific reference ranges
- E.g., the system could plot a normal distribution curve based the patient's previous results to enable the healthcare provider to identify outliers
- LIS should put into consideration the confidence interval of the results based on analytical variability observed at a corresponding level
- LIS should also be capable of displaying reference change values (RCV)
- Reference change value refers how much a test result has changed from the patient's known usual or basal value
- RCV may help pick up patients with rapidly rising levels of creatinine for instance (from 0.3 mg/dL to 0.9 mg/dL within 48 hours) even when the new value is within the reference range of the general population (0.4 - 1.4 mg/dL) (Lablogatory: Reference Intervals vs. Reference Change Values [Accessed 10 May 2023])
- Factors that may be affecting the RCV include analytic imprecision, within subject biologic variability, number of repeated tests performed (Clin Chem 2002;48:395, Arch Pathol Lab Med 2010;134:81, Clin Chem 2011;57:1635)
- Users should be allowed to customize the RCV by selecting any of the following
- Confidence threshold (e.g., 95%)
- Appropriate Z value for decisions that involve 1 sided (e.g., increase) versus 2 sided (either increase or decrease) changes
- LIS should also be able to display results associated flags with user predefined thresholds as shown in table 7 below

Laboratory results useful flags
- LIS should also display relevant comments appended by result analysts
- Report generation by the LIS should have the following qualities
- Flexibility
- Configurable by users of the test information, such as report producers like the laboratorians and report recipients like the healthcare providers and their patients
- LIS should endeavor to make reports available by a variety of options such as
- User configurable automated secure faxing
- Emailing and other electronic text transmission mechanisms
- LIS should allow for sophisticated graphing of laboratory results with the integration of the following clinical information
- Vital signs
- Biometrics
- Medication dose / timing (Clin Chem 2003;49:41, Methods Inf Med 2000;39:88, J Am Med Inform Assoc 2010;17:416)
- Graphing dynamics should also allow for
- Dynamic changes in axis and scales
- Histograms
- Conditional formatting
- Color coding
- User definable formulas for calculated results
- Display of multidimensional data
- Colored displays
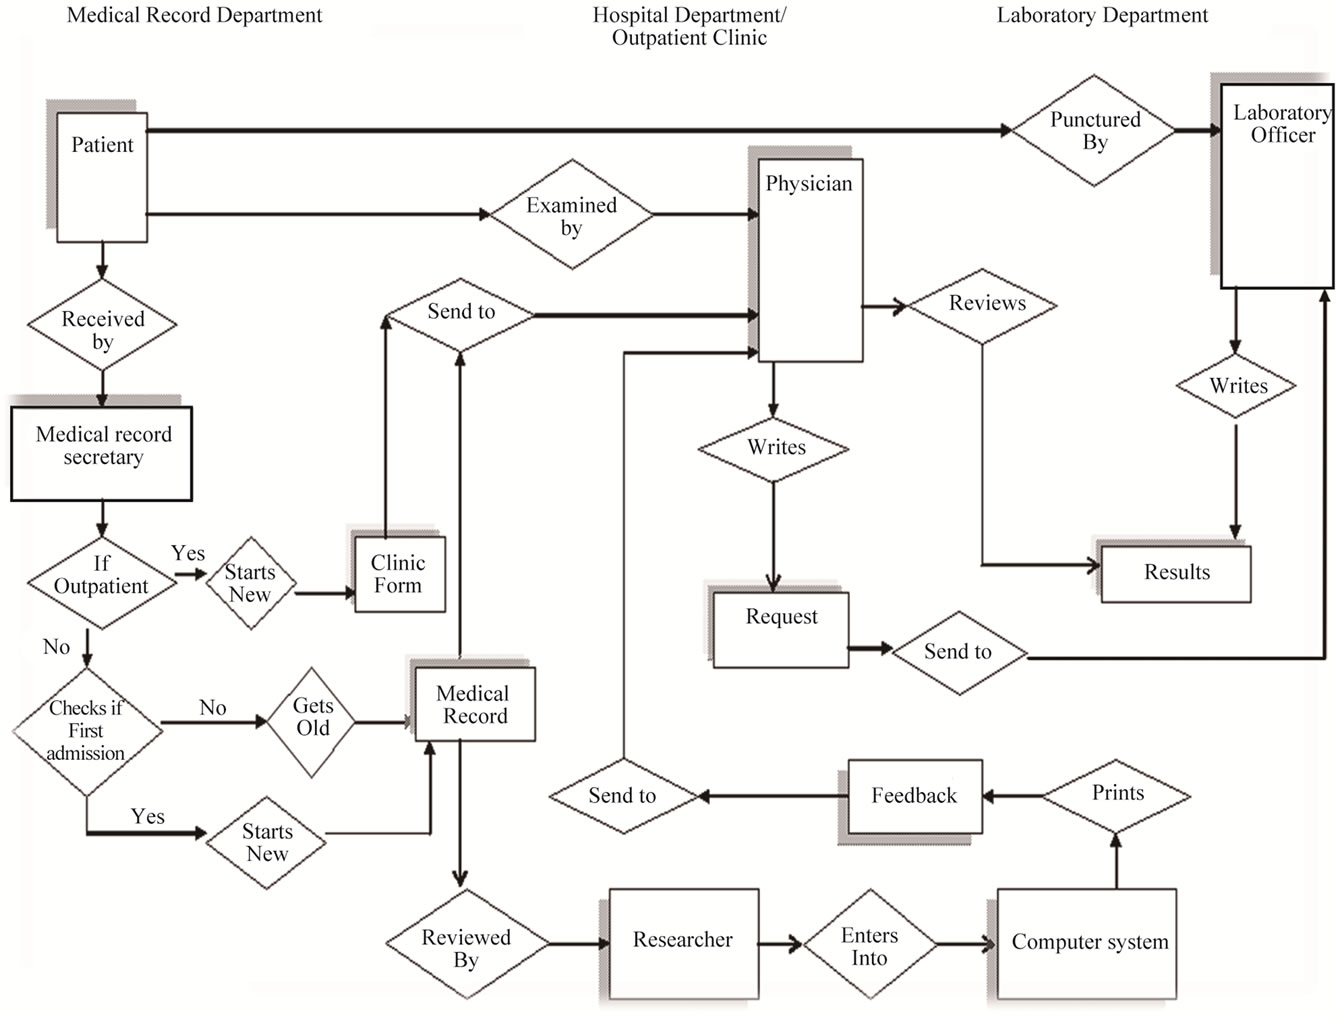
What component of the laboratory information system (LIS) has the tremendous potential of reducing test turnaround times for patients, decreasing their length of stay and optimizing test utilization by healthcare providers?
- Analytic phase
- Information security
- Result entry and validation
- Specimen collection, accessioning and processing
- Test ordering system (TOS)
Answer A is incorrect because the analytic phase of the LIS is the least error prone part of the LIS. It is highly automated and would not significantly impact the turnaround time of test results compared to the test ordering system. Answer B is incorrect because although good information security integrated into the LIS will minimize internal and external threats, the test ordering system (a part of the preanalytical phase of laboratory testing) remains one of the steps that if properly utilized will cut down the turnaround times of a test. Answer C is incorrect because while an integral part of the LIS, result entry and validation do not influence test turnaround times compared to the test ordering system. Answer D is incorrect because specimen collection, accessioning and processing is a useful part of LIS but does not contribute to the overall reduction in test turnaround time when compared to the test ordering system.
Comment Here
Reference: LIS fundamentals
- Acute lymphoblastic leukemias
- Acute pancreatitis
- Gonococcal urethritis
- Helminthiasis
- Non-ST elevation myocardial infarction (NSTEMI)
Answer B is incorrect because acute pancreatitis can easily be confidently diagnosed using clinical history and elevated serum amylase and lipase levels without the need for multiple complex result formats and interpretations like leukemias. Answer C is incorrect because gonococcal urethritis diagnosis is based on clinical history and a urethral swab and not a series of complex test results in need of multiple formats of reporting and interpretation like acute lymphoblastic leukemias. Answer D is incorrect because a simple gross and microscopic stool ova and parasite examination will easily diagnose helminthiasis. Answer E is incorrect because NSTEMI can be easily diagnosed using ECG findings, clinical history and elevated cardiac enzyme levels without the need for multiple complex result formats and interpretations like leukemias.
Comment Here
Reference: LIS fundamentals
- A laboratory information system (LIS) is a type of healthcare software that records, manages and stores patient data from all stages of testing for clinical laboratories
- Collection of software, operating systems and hardware designed to serve the operational processes of a laboratory
- A LIS processes, stores and manages data from all stages of medical processes and tests, including hematology, chemistry, immunology and microbiology
- Process of choosing and implementing a LIS involves 8 steps or phases
- Project definition
- Functional requirements
- Functional design
- Implementation plan
- System integration
- System evaluation (end user feedback)
- Final documentation
- Go live
- Laboratory information management system (LIMS)
Contributed by Harsh Batra, M.B.B.S., D.C.P., D.N.B. and Anil Parwani, M.D., Ph.D., M.B.A.
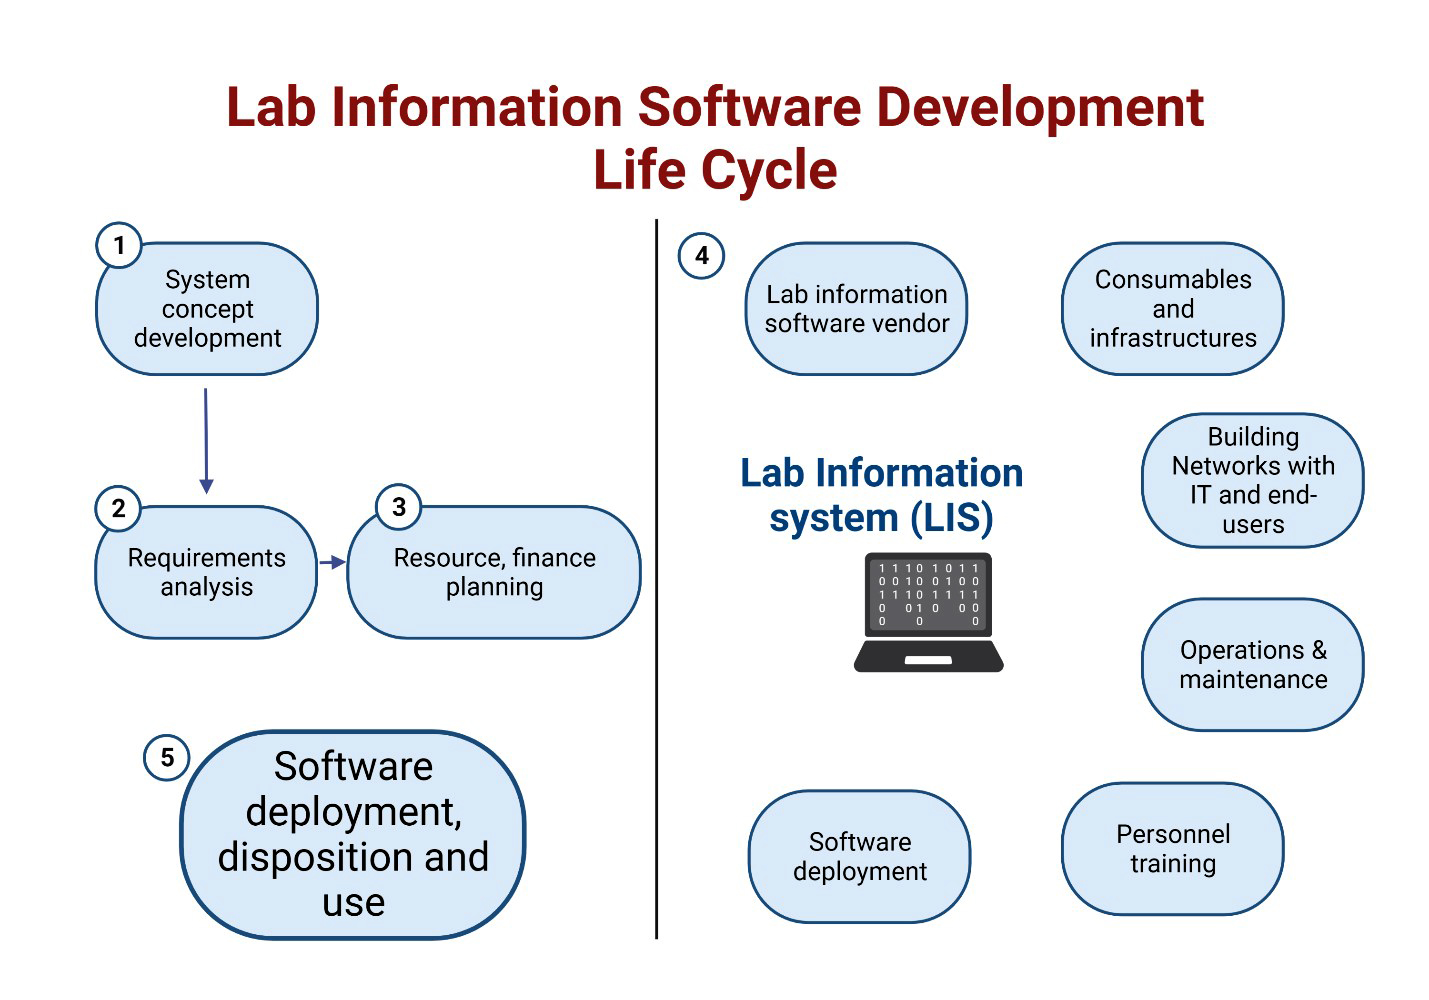
Lifecycle of LIS
- Define governance structure
- Project sponsor
- Initiates the project
- Provides strategic direction
- High level goals
- Funding and project approval
- Is almost always the final decision making authority
- Technical working group
- Overlooks the process
- Promotes communication among stakeholders
- Makes strategic planning and important policy decisions
- Laboratory leadership and policy makers, key staff of laboratory, information technologists, partners
- Project management teams
- Implement the LIS while coordinating budgets, tasks, human and financial resources and managing for risks
- Maintain a communication bridge between involved personnel
- Should have key people who are versed in information technology and possess laboratory technical expertise
- Lab technical advisor / supervisor
- This step is usually a part of enterprise resource planning (ERP)
- References: Computational Collective Intelligence 2015;9330:377, Am J Clin Pathol 2017;147:261
- What is to be achieved and by whom, when and why
- Foundation for the project; typically 1 page long
- Plan integration with other systems (such as ERP, financial, etc.), instrument integration for automatic data acquisition and longterm maintenance and growth (future data migration)
- ERP systems support laboratories by (PLoS One 2021;16:e0260798)
- Reducing costs and improving productivity
- Standardizing business; integrating and improving business processes
- Increasing flexibility
- Integrating acquisitions
- Key features of ERP include
- Global financial capabilities
- Advanced planning and scheduling
- Product configurators
- Supply chain management
- Customer relationship management
- Business intelligence
- Component (object oriented) architecture
- Vendors of ERP: SAP, PeopleSoft, J.D. Edwards, Oracle, among others
- Gathering of several groups or teams to understand their needs and agree on the required features for a successful project outcome
- Crucial step for defining the specific requirements for your LIS
- Serves as the proposal to send to potential bidders, minus the budget information and any proprietary information
- Each lab is unique
- Examples of functional requirements and design
- Technical specifications, such as
- Data storage capacity
- Networking capabilities
- Processing speed
- Security features
- Functional requirements
- Workflow management (types of tests, types of samples, etc.)
- Reporting capabilities
- User management (needs to be defined based on lab)
- Typical list to include would be
- Sample login
- Sample tracking / barcode support / quoting / billing
- Scheduling
- Biometric identification
- Chain of custody
- Instrument integration
- Result entry / audit trail
- Quality assurance (QA) / quality control (QC) / specification checking
- Result reporting
- Web integration / links to enterprise software
- Archiving and data warehousing
- Backup of the data with well tested storing and scheduled maintenance
- Technical specifications, such as
- Reference: J Eval Clin Pract 2019;25:788
- LIS vendors and products: points to consider while selecting a vendor should include (but are not limited to)
- Different strengths and weaknesses
- Validity of the final, detailed proposal: has anything in the laboratory changed?
- Compliance of proposed system to the specific requirements of the laboratory; check for key features like Health Level Seven (HL7) support for integration with other systems, configurable user roles, customizable workflows, QC management and robust reporting capabilities
- Review of the Gantt chart (a project management tool): realistic timeline and potential shortcomings
- Review of the cost proposal, contract, license agreements and implementation plan
- Final review with the vendor for clear understanding of project goals for seamless integration and progression
- References: Biopreserv Biobank 2017;15:111, Environ Health Prev Med 2015;20:338
- This stage depends heavily on selected software's requirements
- General considerations include
- Number of concurrent users
- Number of data records
- Archive requirements
- External loads on the system from non-LIS applications
- Hardware to be installed for a LIS are usually the following
- Computer hardware
- Central processing unit (CPU): quad core CPU or better (for most present day systems)
- System memory (random access memory [RAM]): 8 GB of RAM and above (for most present day systems)
- Hard drive, tape drives, optical drives and cloud systems
- Recommended standard 232 (RS232) or transmission control protocol / internet protocol (TCP / IP) instrument interfacing
- Although the above are minimum requirements, most present day LIS use the following hardware
- High performance server (e.g., a Dell PowerEdge Server) with a robust processor (e.g., Intel Xeon), sufficient RAM (e.g., 32 GB and above) and storage capacity (e.g., 1 TB solid state drive [SSD] and above)
- Workstations: standard personal computers (PCs) with the latest operating system (OS) (e.g., Windows 10, Windows 11)
- Network equipment: supports fast data transmission (e.g., gigabit ethernet switches) and WiFi for mobile devices if required
- Computer networks: local area networks (LAN) and wide area networks (WAN); consideration for Open Systems Interconnect (OSI) model, which is a uniform standard introduced in 1978 by the International Organization for Standardization (ISO) to facilitate data communication among the disparate equipment from different vendors (Finnell: Clinical Informatics Study Guide - Text and Review, 2nd Edition, 2022)
- Physical layer: most common standard at this level is RS232C
- Data link layer: layer 2 switches, bridges network interface cards (NICs)
- Network layer: hubs and routers
- Transport layer: common transport protocols include TCP / IP and sequence packet exchange / internet packet exchange (SPX / IX)
- Computer hardware
- Installation begins with setting up the server OS, then the database management system (DBMS)
- For example, Oracle or SQL Server could be the chosen DBMS for the LIS
- Then, install the LIS server application, followed by the client application on each workstation
- Ensure all components are correctly networked and that security features, such as firewalls and antivirus software, are installed and properly configured
- Sample software installation for a DBMS using Oracle and SQL Server (Acad Radiol 2015;22:527)
- Operating system: Windows Server 2008 or higher
- Database management system: Oracle (11g or higher) or SQL Server (2012 or higher)
- Java Development Kit (JDK) 1.5 or higher
- Oracle SQL Developer or SQL Server Management Studio
- ERP software such as SAP, PeopleSoft, J.D. Edwards or Oracle
- Hardware and software requirements may vary depending on the specific needs of the laboratory and the LIS being used; it is recommended to consult with the vendor or manufacturer for specific requirements before installation
- Computing models
- Single processing: used by 1 user; currently impractical and obsolete
- Shared processing: allows multiple users to use 1 machine, usually a mainframe, simultaneously; multiple terminals are connected to a mainframe computer
- File server computing: Terminal Services is an example of file server computing in LIS; all application execution, data processing and data storage take place on the server (Microsc Microanal 2021 Apr 28 [Epub ahead of print])
- Client / server computing: distributed application structure that partitions tasks or workload between the providers of a resource or service (called servers) and service requesters (called clients); examples of client - server model are email, world wide web, etc. (Comb Chem High Throughput Screen 2011;14:742)
- Ruby on Rails based platform: QTREDS is a Ruby on Rails based platform for Omics Lab that helps researchers to have a complete knowledge of the laboratory activities at each step (BMC Bioinformatics 2014;15:S13)
- Cloud based LIS: organizes all sample information (metadata, workflows, samples, results and instruments) at all times
- SaaS LIS platforms provide flexibility to present sample data clearly and concisely for a variety of stakeholders; most widely used (Comb Chem High Throughput Screen 2011;14:742)
- Electronic lab notebook (ELN): ELNs are used for organizing lab experiments; the 2 systems can track samples through their processes
- ELNs are more specific for individual experiments, whereas a LIS will center around collecting and reporting aggregate sample data (EMBO Rep 2020;21:e49862)
- Configure the LIS according to lab's workflow
- Setting up a workflow that includes order entry, sample tracking, result entry and report generation
- User roles might include technologist (can enter results), pathologist (can approve results) and clerk (can enter orders)
- LIS might be configured to print barcodes for samples, to apply certain QC rules or to generate specific report formats
- Customization might include developing a specific data input form or report template
- Reference: Opie: Cannabis Laboratory Fundamentals, 1st Edition, 2021
- Connect medical instruments with the LIS; vendor solutions are typically classified into
- Instrument vendors who wrote output files from their instruments to function only with their LIS (thus providing a sales advantage)
- Vendors using proprietary software that usually require vendor involvement to interface instrument to the LIS
- Vendors who attempted to provide some standardization with a generic output
- Common output formats: comma separated values (CSV), Microsoft Access or Excel spreadsheets
- Example: integration of an automated 5 part hematology analyzer
- This would involve setting up an interface using HL7 or American Society for Testing and Materials (ASTM) standards, possibly involving a middleware, such as Data Innovations's Instrument Manager
- Goal is to automate the flow of information from the instrument to the LIS so results can be recorded automatically without manual data entry
- Questions to ask the vendor: format of the output file, the ability to interface the instrument to a LIS and if any additional software must be purchased
- Reference: Opie: Cannabis Laboratory Fundamentals, 1st Edition, 2021
- Transitioning from an old system; involves writing scripts to export data from the old system and import it into the new one, keeping in mind that the data structures might be different
- E.g., might need to map different types of hematology results from the old to the new system, considering various factors, such as test codes and units
- Every user role needs training on the new system
- Train staff on how to enter orders
- Train technologists on how to enter results
- Train pathologists on how to approve results and generate reports
- Training should also cover data security and privacy regulations, such as the Health Insurance Portability and Accountability Act (HIPAA)
- Reference: Opie: Cannabis Laboratory Fundamentals, 1st Edition, 2021
- System evaluation
- Checklist to compare before and after the installation of the system to ensure that all needs have been met
- LIS software is adaptable and able to accommodate change
- Integration testing would test the HL7 interfaces with other systems, such as an electronic medical record (EMR) system or the medical instruments in the lab
- Coordinated and continuous update of functional requirements phase and system evaluation documentation
- QC: operational techniques and tests required to maintain and improve the quality of a product or service
- QA: activities that monitor and evaluate the performance of QC procedures employed in the manufacture of products and services
- QC / QA role of LIS: user warnings, graph (control charts and trend analysis) and report generation, full audit trail, automatic calculations, automated sample tracking, online standard operating procedures (SOPs), maintenance of standards, instrument calibration, tracking training records and much more
- System validation
- Validation scripts, which allow end users to run through a series of functions, input a known value and make sure that the output is what was expected, based on the input
- Validation is a very tedious process and differs from testing; testing evaluates if the software meets the design specifications
- References: Opie: Cannabis Laboratory Fundamentals, 1st Edition, 2021, Qual Assur 2001;9:217
- System security
- Responsibility of the database administrator
- Maintaining the static tables of the LIS
- Usernames and passwords
- Regular backups
- Modifying report templates
- Application security
- Can be done effectively by segregating roles of users as view only, make changes and validation
- Regular password change prompts
- 2 or 3 factor security if the application can be accessed over virtual private network (VPN)
- Network security
- Network administrator typically assigns permissions to individuals or groups to access the network and its modification rights
- Reference: Bioinformatics and Biomedical Engineering 2017;10208:602
- After thorough testing, the LIS can be deployed
- Go live day is selected and users start using the new system
- Support team should be ready to address any issues
- Regular monitoring should be conducted to ensure system performance, security and user satisfaction
- Reference: J Pathol Inform 2017;8:47
- Client - server model
- Electronic lab notebook (ELN)
- Ruby on Rails based platform
- Virtual reality integration
Comment Here
Reference: LIS installation & implementation
- HL7 facilitates the exchange of standardized information between different healthcare systems, enabling interoperability and seamless communication in the laboratory
- HL7 is a programming language used for writing custom scripts to automate laboratory workflows and data analysis processes, ensuring efficiency in LIS operations
- HL7 is primarily used for tracking the movement of laboratory equipment within a healthcare facility, ensuring efficient utilization
- HL7 provides a platform for creating virtual reality simulations within the laboratory, enhancing training for laboratory staff
Comment Here
Reference: LIS installation & implementation
- Science of using computer algorithms to learn from patterns present in data and making predictions based on the learned patterns
- Machine learning algorithm is used to create a model from a dataset from which predictions are made
- Machine learning model can be built without any knowledge of computer programming; for beginners, Orange software is a good starting point (GitHub: Orange - Interactive Data Analysis [Accessed 3 April 2024])
- Applications in pathology / laboratory medicine include molecular subtyping of cancer, image recognition / segmentation and identification of lesions in digital slides, digital slide stain normalization, information extraction from pathology reports
- Publicly available datasets applicable to machine learning can be found on the internet
- AutoML (automated machine learning): these are tools / software libraries that build, choose and optimize machine learning models with minimal user input; in some cases, all you have to do is provide the dataset and set the target feature and it will start building machine learning models for you
- Deep learning: refers to neural networks with many layers; transformers and convolutional neural networks fall under that category due to the large number of layers (e.g., convolution or pooling layers)
- Other types of neural networks with multiple layers (such as artificial neural networks with several hidden layers) also fall under this classification
- Overfitting: the machine learning model memorizes the training data and corresponding outcome it was given and performs poorly on data it has never seen before
- Supervised machine learning: discovers relationships between feature variables and the target feature (label); the label has to be provided before the machine learning model can be trained to build a predictive model
- Target / outcome variable (label): value predicted based on the values of other variables in a dataset; it is analogous to the dependent variable in statistics
- Features that contribute towards making the prediction are equivalent to the independent variables in statistics
- Feature and variable are terms that are used interchangeably
- Unsupervised machine learning: unlike supervised machine learning, the data label is not needed to find patterns in a dataset (e.g., similar sets of data points forming unique clusters in a t-SNE plot or groups formed through k-means clustering)
- Orange
- Knime
- Python + scikit-learn
- R
- AutoKeras - autoML library based on Keras
- Weka
- Teachable Machine
- TensorFlow
- PyTorch
- fast.ai
- Linear regression
- Given a set of points x and y, it finds the best fit line that goes through each pair of x and y points
- Used in laboratories to validate a new method for a particular test by comparing the results between the new method and the reference method (Clin Chem 1998;44:2340)
- Various software tools such as R and Python with scikit-learn simplify the process by performing all the necessary calculations
- Logistic regression (Ann Biol Clin (Paris) 1994;52:277)
- Statistical method for solving classification problems
- Equation based on the sigmoid function demonstrates the relationship between the target variable and 1 or more variables
- Predicts the probability of an outcome occurring
- Naïve Bayes
- Based on Bayes theorem, with the assumption that the variables involved contribute independently to the outcome variable; this assumption may be wrong, hence the description naïve
- Decision trees
- Optimal decision tree is constructed to fit the dataset
- Each node in the tree consists of a feature variable and each node splits into branches based on the value of the variable
- End of a branch is the value predicted for the target variable
- Outside of machine learning, decision trees are often used in diagnosis and treatment guidelines
- Random forest
- Versatile machine learning method
- Results from multiple decision trees are pooled together to arrive at the final prediction; each tree is generated using a random subset of the input dataset along with a random subset of the feature variables
- Gradient boosted trees
- Like random forests, it also involves multiple decision trees
- Applied to nonimage datasets, it has been able to achieve better predictive accuracy than random forests and other machine learning methods in most cases
- Support vector machines
- Line, plane or hyperplane separates points in a dataset, separating them into classes
- K-means clustering
- Unsupervised machine learning algorithm that groups similar sets of data together
- Dimensional reduction methods
- E.g., PCA, t-SNE, autoencoders
- Reduces number of feature dimensions for easier interpretation or visualization
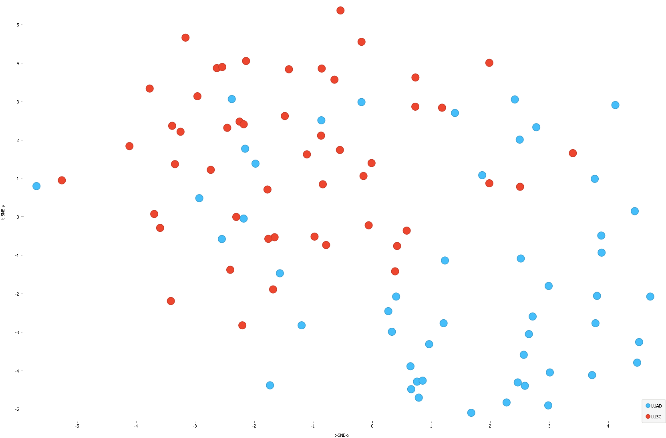
- Neural networks (Psychol Rev 1958;65:386)
- Inspired by interconnections between neurons in biological neural networks
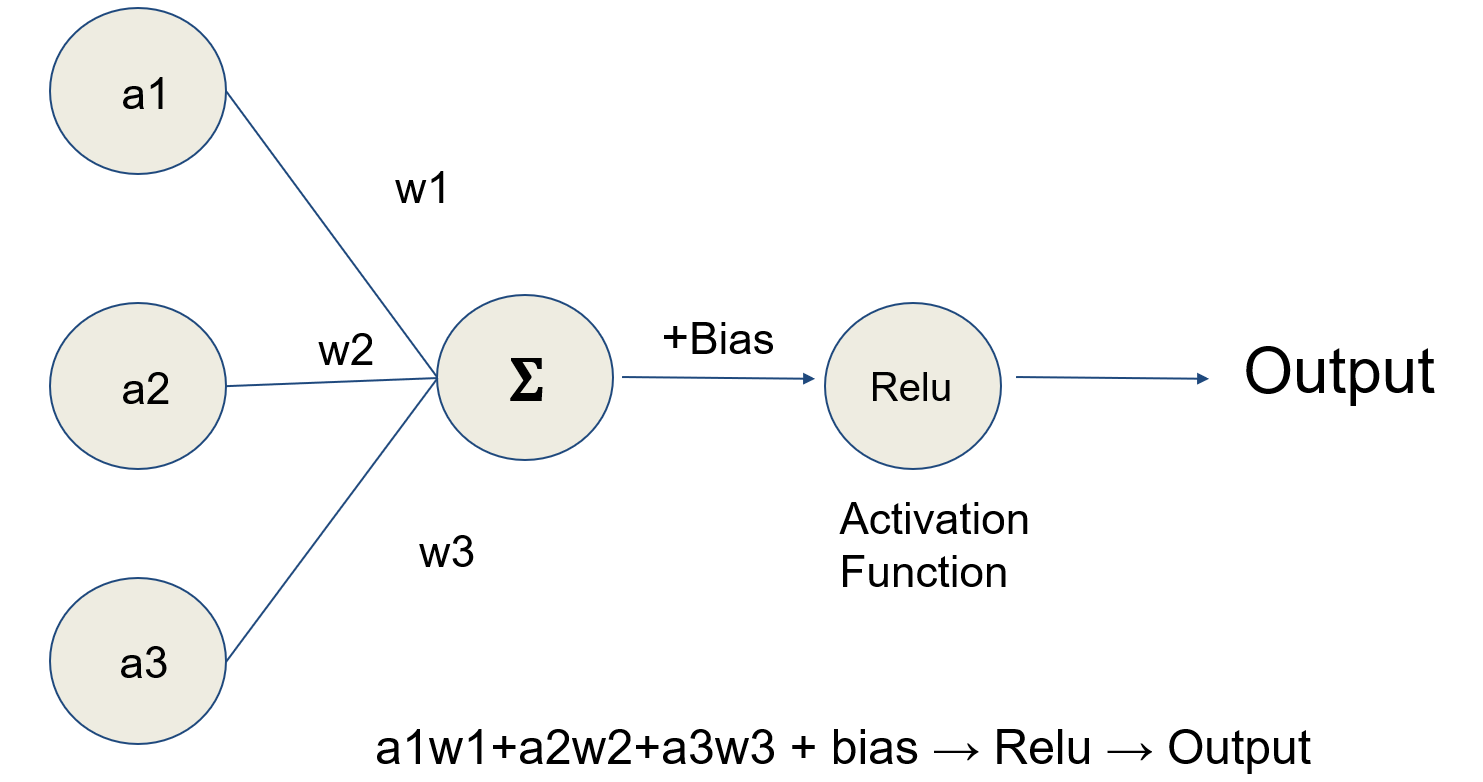
- Convolutional neural network
- Type of neural network often used for image classification (e.g., cancer subtype or benign versus malignant) (Urol Clin North Am 2024;51:15)
- Also used for semantic segmentation, object detection with classification, generation of fake images and style transfer (generative adversarial network), natural language processing
- Generative adversarial network
- Involves 2 neural networks
- Generator: creates fake data
- Discriminator: distinguishes real from fake data
- Goal of training is for the generator to become better at creating images that look real to the discriminator
- Involves 2 neural networks
- Autoencoders
- Type of neural network that transforms an input into an intermediate representation, from which the original input is recreated
- Transformers
- Deep learning architecture based on the self attention mechanism (Korean J Radiol 2024;25:113)
- Used for computer vision (vision transformer) and natural language processing
- Includes large language models (e.g., GPT-4, Llama2, Mistral) that can provide human-like responses to questions / instructions (prompts)
- Natural language processing
- Text may be converted to a numerical matrix though word embeddings or bag of words representations; these embeddings or bag of words representations may be combined with other machine learning algorithms to make predictions from textual data (Stud Health Technol Inform 2017;235:256)
- Word and sentence embedding techniques
- Data collection and preparation
- Usually the most time consuming process in building models
- Data can come from a variety of sources including questionnaires, internet searches, databases and images
- CSV (comma separated values) file format, as well as other spreadsheet style formats are commonly used for training machine learning models; each feature is designated by a column and each row represents a record
- Choose a programming language or machine learning platform
- Python is currently the most popular programming language used in machine learning; the Python scikit-learn library includes many commonly used machine learning algorithms
- Orange and Knime are open source GUI (graphical user interface) based machine learning platforms; these are easy to use and require no programming experience
- Choose a machine learning algorithm
- Set the hyperparameters for the model
- Split the data into training, validation and holdout sets
- Validation set
- During the process of training, the model is tested on the validation set to assess its performance (e.g., accuracy or AUC ROC); hyperparameters of the model may be altered during training process to improve the performance of the model
- Training accuracy much higher than the validation accuracy is a sign of overfitting
- Also referred to as the development set
- During the process of training, the model is tested on the validation set to assess its performance (e.g., accuracy or AUC ROC); hyperparameters of the model may be altered during training process to improve the performance of the model
- Holdout dataset
- Used to assess the performance of the final model on unseen data after it has been fully trained; unlike the validation set, it is never exposed to the trained model and should give a better measure of performance
- For smaller datasets, the holdout set may be omitted and model accuracy can be assessed using cross validation methods
- Commonly used ratios for training, validation and holdout sets
- 70/15/15
- 60/20/20
- Very large datasets can have a larger proportion of the data in the training set (e.g., 80/10/10 or 90/5/5)
- Validation set
- Train and test the model
- Test the performance of the model on the validation set
- Commonly used metrics
- Accuracy
- Log loss
- AUC (area under ROC curve)
- Precision
- Recall
- F1 score
- For smaller sample sizes
- K-fold cross validation: entire dataset is subdivided into K subsets; each subset acts as the validation / test set once and the rest of the data are used for training the model; model performance is assessed by averaging the results attained from each subset
- Leave-one-out cross validation: model is trained using the entire dataset except for one data point and the model is validated with the data point that was left out; process is repeated until every data point has been used as the test data point
- Random stratification: set percentage of the dataset is randomly assigned to the training set and the remaining become the test set
- Optimize the model
- Fine tune the model parameters
- Add new data to the dataset
- Change the features in the dataset
- Add additional features
- Image augmentation (for convolutional neural networks)
- Test the performance of the final model on the holdout set
- Gives a better measure of real world model performance
- Creating machine learning models with GUI based platforms like Orange is quick and easy
- Download and install Orange through the following link (GitHub: Orange - Interactive Data Analysis [Accessed 3 April 2024])
- Launch the program and a welcome screen will appear
- Select the New option
- In Orange, various tasks are done through widgets, which are represented by various icons on the left side of the user interface
- Click on the Datasets widget found on the left side of the screen and drag it into the canvas (the empty portion of the screen on the right side); double click on it and choose a dataset from the list that appears; click on the Send Data button
- Add the Test & Score widget to the canvas
- Add the Random Forest widget to the canvas
- Another machine learning algorithm instead of Random Forest can be chosen
- Connect the Test & Score widget to the Datasets widget by clicking on it and connecting the line that appears to the Datasets widget
- Connect the Random Forest widget to Test & Score
- Canvas should look something like

Double click on Test & Score and the performance of the newly built model will be displayed
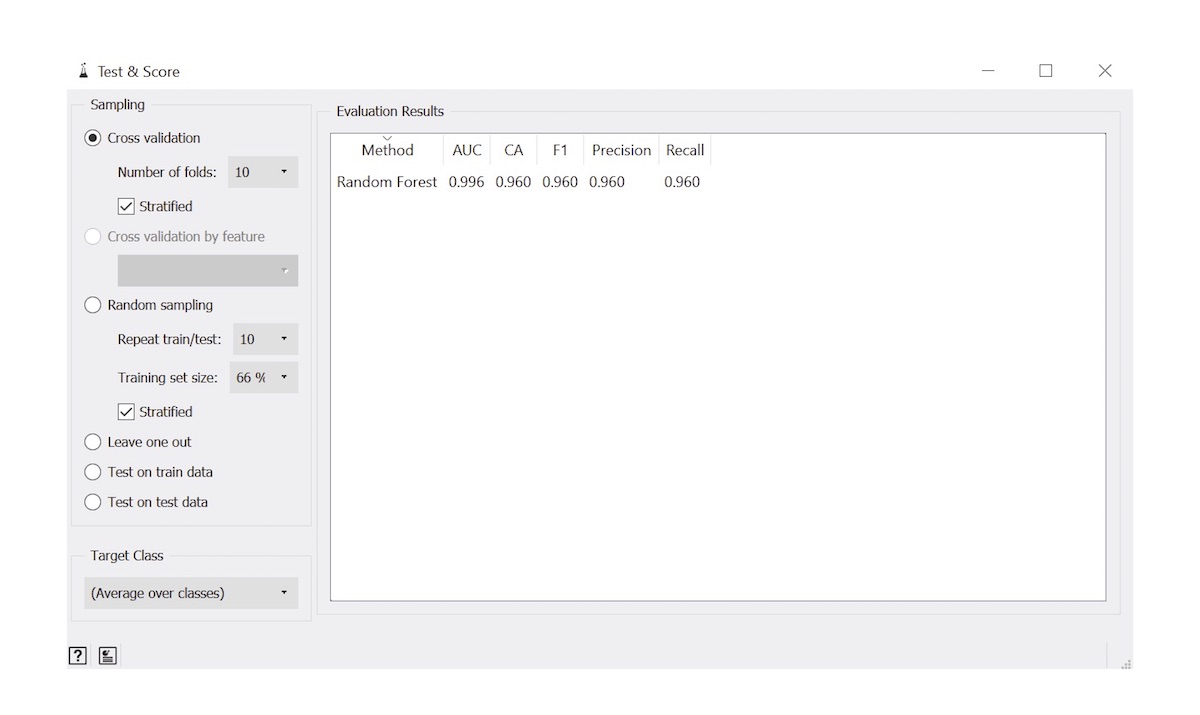
- Applications of machine learning in medicine are vast and include
- Risk stratification (Infect Control Hosp Epidemiol 2018;39:425)
- Predicting drug response (Clin Gastroenterol Hepatol 2010;8:143)
- Cancer metastases detection in lymph nodes (JAMA 2017;318:2199)
- Molecular subtyping of cancer (Brief Bioinform 2019;20:572)
- Prediction of susceptibility to Vibrio cholerae infection (J Infect Dis 2018;218:645)
- Blood pressure estimation using electrocardiogram (ECG) signals (Sensors (Basel) 2018;18:1160)
- Histopathology image stain normalization (Conf Proc IEEE Eng Med Biol Soc 2014;2014:194)
- Mitosis counting (Med Image Anal 2024;94:103155)
- Prostate cancer diagnosis (Adv Anat Pathol 2024;31:136)
- Breast cancer detection (NPJ Breast Cancer 2022;8:129)
- Whole slide image quality control (J Pathol Inform 2023;14:100306)
- Ki67 quantification (Histopathology 2023;83:981)
- Deidentification of pathology reports (J Med Internet Res 2023;25:e48145)
- Information extraction from pathology reports (J Am Med Inform Assoc 2020;27:89)
- J Mach Learn Res 2013;14:2349, Wikipedia: Machine Learning [Accessed 3 April 2024], Wikipedia: Cross-Validation (Statistics) [Accessed 3 April 2024], Chollet: Deep Learning with Python, 1st Edition, 2017, Lane: Natural Language Processing in Action - Understanding, Analyzing, and Generating Text with Python, 1st Edition, 2019

Which machine learning algorithm predicts an outcome by combining results from multiple decision trees?
- Linear regression
- Neural networks
- Random forest
- Support vector machines
Comment Here
Reference: Machine learning fundamentals
- Convolutional neural networks
- Linear regression
- Neural networks
- Random forest
Comment Here
Reference: Machine learning fundamentals
- Software that connects various health information systems (HISs) or instruments / devices (either within the laboratory or throughout the enterprise), sometimes referred to as software glue
- In addition to handling interfacing, it oftentimes fills functional gaps of primary health information systems
- May also refer to secondary specialized information systems (e.g., point of care testing, core lab automation, HLA)
- Middleware is software that interfaces 2 or more information systems together, often providing additional functionality that would be otherwise lacking
- Laboratory middleware can reduce both the complexity and number of connections required when interfacing laboratory instrumentation, software and health information systems (e.g., laboratory information systems [LIS] and electronic health records [EHR])
- Contemporary middleware solutions can ingest multiple data feeds to provide value added analysis and insights for laboratory management dashboards
- Interface: method to transfer data; typically refers to 1 or more of the following
- Machine to machine communication
- Machine to software system communication
- Software system to software system communication
- LIS: may be standalone or a module integrated within an EHR; LISs can be composed of 1 or more modules and may be laboratory discipline specific
- Health level seven (HL7): messaging standard for the exchange of healthcare information; most common version used today is HL7 v2.x all types of interfaces; however, more are now moving towards the recent HL7 FHIR standard
- Admit / discharge / transfer (ADT): ubiquitous HL7 message type providing demographic information and updates on patients (also known as ADT interface or ADT feed)
- ASTM: a standards organization
- When used in the laboratory medicine context, ASTM generally refers to one of the earliest bidirectional interface types to connect instruments to the LIS
- While many information technology (IT) vendors currently prefer HL7, it is common for instruments to support both types of interfaces for backward compatibility
- Driver: software program that enables a specific hardware device or other software to work with another application or system
- Typically used to describe how computer peripherals (e.g., printers, keyboards) communicate with the base operating system
- For laboratories, describes how instruments and other devices connect with primary systems
- As LISs were developed and deployed, initial approaches favored direct instrument connections for data transfer
- Each deployment of either a new LIS or instrument generally required custom development, minimally on the part of the vendor but typically also by the laboratory
- This model was not efficient, especially as new LISs, instruments and ancillary systems were developed
- Difficult for vendors to maintain / support for numerous drivers or interfaces
- Point to point interfaces require n x (n - 1) interfaces (e.g., interfacing 7 systems together requires 7 x (7 - 1) = 42 interfaces to be built, in the worst case)

Direct interfacing
- Point to point interfaces require n x (n - 1) interfaces (e.g., interfacing 7 systems together requires 7 x (7 - 1) = 42 interfaces to be built, in the worst case)
- Middleware theoretically reduced the number of drivers developed, easing implementation and maintenance
- With middleware that has the primary purpose of managing interfaces, the number of total interfaces required can be reduced significantly
- Interface engines require n x 2 interfaces to be built (e.g., interfacing 7 systems now only requires 7 x 2 = 14 interfaces)
- Reference: Sinard: Practical Pathology Informatics, 1st Edition, 2005
- Software layer present between LIS and instruments
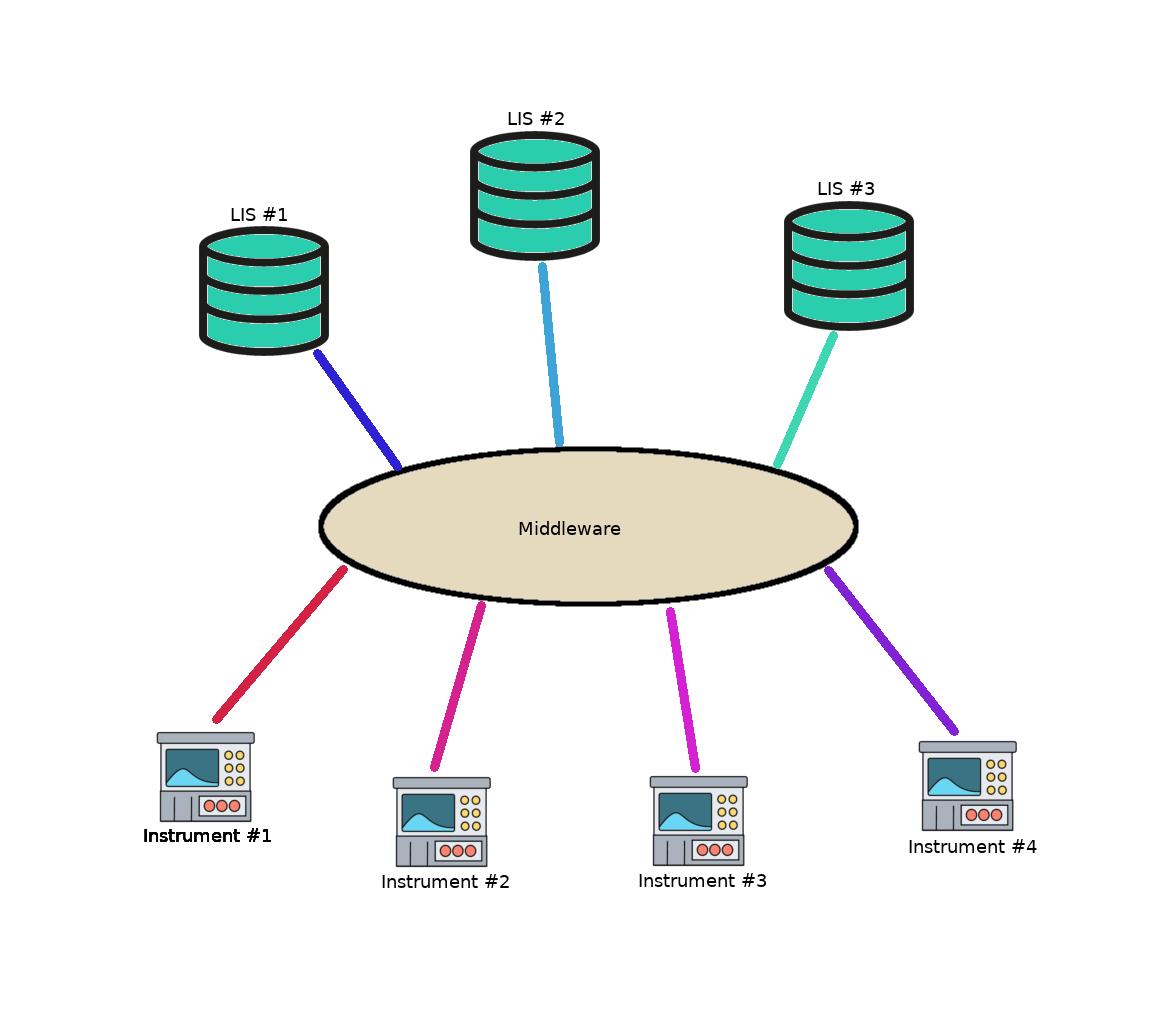
Interfacing via middleware
- Only requires a single driver per instrument type and 1 driver per LIS / other middleware
- Adding a new instrument or the more challenging task of connecting a new LIS to a laboratory’s instrumentation can be accomplished by installing the appropriate driver
- Rules for sanity checks, delta checks, quality control (QC), etc. can be performed at this layer, preventing questionable results from reaching the LIS and potentially the patient chart
- Results from various platforms can be normalized into the same format (e.g., adjusting semiquantitative results to a laboratory standard dictionary)
- Provides an opportunity to add functionality, such as moving averages, that may not be available within the LIS
- Reference: Pantanowitz: Pathology Informatics - Theory & Practice, 1st Edition, 2012
- Modern healthcare enterprises rely on numerous, interconnected health information systems besides the electronic health record
- As the number of systems increases, the number of direct connections to keep all systems connected and in sync potentially increases exponentially, as shown previously
- Middleware can reduce the overall complexity, simplifying new additions as well as reducing the overall support effort
- This type of middleware, targeting multidisciplinary systems across the enterprise, is often referred to as an integration engine or interface engine
- Some data feeds, such as ADT, may be commonly needed by most of the ancillary systems
- Other niche feeds may only be used for 2 systems to exchange information
- Data feeds can be customized within the middleware for each application
- Data feeds may be forked and used for other purposes, such as external reporting, regulatory compliance, etc.

Forking message from data stream
- Middleware once focused on interfacing systems together but vendors are adding additional functionality targeted at end users
- Reporting and analytics
- Vendor provides reports for commonly used metrics; these can be run periodically or on demand and may be accessible in real time depending on the underlying IT infrastructure
- Custom reports for customers to explore their data with in house expertise
- Visualization methods, such as interactive dashboards for monitoring trends and producing graphical representation for distribution, are becoming more common
- Utilization metrics for process improvement, resource management and cost saving initiatives are common analytics functions
- Remote support / monitoring
- Companies are able to remotely monitor, log and pull information for maintenance and billing purposes
- Pre-emptive service can prevent unexpected downtime
- Remote troubleshooting can replace expensive on site service calls in certain situations
- Example systems; not an exhaustive list
- Point of care testing (POCT) middleware
- Provides base interfacing capabilities for large numbers of the same device deployed throughout institutions (e.g., 250 glucose meters) that would otherwise traditionally require individual interfaces if connected to the LIS
- Most times includes additional functionality besides providing connectivity for transmitting results to the LIS / electronic health record
- Remote device configuration: devices can be configured and updated remotely via middleware, saving much effort when large numbers of devices are deployed throughout an organization
- Helps meet regulatory requirements specifying who can perform waived and moderate complexity testing, as well as documenting competency
- Locks out users lacking or with expired training
- Can be configured to require quality control measures, such as QC lockout after specific time periods
- More recent functionally may include lab order functionality
- Providers rarely enter an electronic order for specific point of care tests
- Most point of care testing middleware or the LIS can autogenerate orders when a point of care test is performed on a connected instrument (unsolicited orders)
- Some newer point of care testing middleware allows for solicited orders, where the order placed by the provider for a point of care test is linked to the patient result
- Customer relationship management middleware
- Software to aid client service to cultivate relationships and retain referring laboratories
- Facilitates individualized attention - tracks points of contact so customers are greeted by preferred name, have immediate access to individual fee schedules, other miscellaneous features to make customers feel pampered
- Tracks support history so common problems are quickly addressed
- Automation
- Provides baseline interfacing and workflow management capabilities for automation line instrumentation
- Typically the LIS cannot orchestrate the complex workflows required to successfully run a core lab automation line
- Load balancing and distribution based on volume and test availability to maximize throughput are common features
- Communicates with instruments to disable routing when a test or analyzer is offline
- Sample tracking throughout the entire testing process, including storage and disposal of samples as they expire for some systems
- Provides baseline interfacing and workflow management capabilities for automation line instrumentation
- Outreach / reference lab systems
- Acts as both an interface engine with external health information systems and reporting engine for clinical laboratories with external clients
- Manages clients and patients and may include a master patient index
- Other typical functionality includes
- Custom report formatting based on customer preference
- Individualized testing menus, panels and reflexing options
- Client billing
- Transfusion medicine (blood bank) middleware
- Primary purpose is to provide a safe manner for issuing blood products
- Checks ABO compatibility
- Checks markers and historic record for special blood needs (e.g., antibodies, irradiation)
- Checks expiration date / time of products being issued
- Compliant with International Society of Blood Transfusion (ISBT) labeling standards
- Interfaces with blood product administration modules for electronic health records for verification of transfusions
- One of the few health information systems treated as a class 3 medical device by the Food and Drug Administration (FDA); has strict federal regulatory requirements
- Primary purpose is to provide a safe manner for issuing blood products
- Point of care testing (POCT) middleware
- Reference: Surg Pathol Clin 2015;8:175
- Connects laboratory devices to LIS
- Connects LIS to EHR
- Remote order entry and results review
- Autoverification
- Asset tracking
- Image management
- Reporting and analytics
- Reference: Surg Pathol Clin 2015;8:175
- CPT
- DICOM
- HL7
- LOINC
- SNOMED CT
Comment Here
Reference: Middleware
- Analytics platform
- Interface engine
- Middleware
- Software modules
Comment Here
Reference: Middleware
- Cost multiplier for budgeting for interfaces when adding new instrumentation to the laboratory
- Length of time needed for an interface to transmit data
- Number of systems required to create a single point to point interface
- Total number of interfaces required to connect an n number of systems
Comment Here
Reference: Middleware
- Multiplex immunofluorescence (mIF) is a high throughput immunofluorescence technology based on tyramide signal amplification and multispectral imaging, which allows the simultaneous detection of multiple markers on a single tissue section without compromising the tissue architecture
- Multiplex refers to many elements in an interrelated landscape
- Can analyze 2 - 50 markers at one time, expressed on a single cell level with high precision (J Immunother Cancer 2015;3:47, Methods 2014;70:46, Cell 2016;165:780)
- Powerful tool for immune profiling to achieve a targeted therapy
- Multiplex immunofluorescence is a technology that is based on enzyme based tyramide signal amplification and uses multispectral imaging to generate images for analysis
- For multiplex immunofluorescence, it is necessary to excite all the fluorophores contained in a single slide after the staining but the emission spectral range cannot overlap with the excitation range
- Basic principle of analysis of the generated data is linear unmixing of images, segmentation of tissue into tumor and stroma, segmenting individual cells and then phenotyping markers based on marker of interest
- Subsequent data can be used to generate multiple datasets elaborating cell phenotypes, nearest neighbor distances, which can be used for spatial position of single cells in a tissue
- Tyramide signal amplification (TSA): a technique for detection of low abundance targets in fluorescent immunocytochemistry (ICC), immunohistochemistry (IHC) and in situ hybridization (FISH) applications
- mIF is based on the principle of TSA, wherein fluorescent opal dyes are conjugated with tyramide molecules to produce enzymatic (alkaline phosphatase or horseradish peroxidase) amplification; the primary and secondary antibodies can be sequentially applied and washed but tyrinamide signal remains (Mol Oncol 2020;14:2384)
- Multispectral imaging:
- Spectral imaging combines spectroscopy and imaging (Cell 2016;165:780)
- Can acquire 2 dimensional, spatial (X and Y) and temporal data information from objects depending on parameters like spatial resolution, field of view, dynamic range and lowest detectable signal based on their emitted wavelength (Cell 2016;165:780)
- Multispectral imaging can capture approximately 10 - 30 wavelengths at a time at each pixel of an image, providing the intensity wavelength spectrum at every pixel of the image, in addition to the typical 2 dimensional position of every pixel
- This 3D generation of an image is done via specially designed cameras
- This technique forms the basis of image generation in multiplex immunofluorescence
Contributed by Harsh Batra, M.B.B.S., D.C.P., D.N.B., Maria Gabriela Raso, M.D. and Edwin Roger Parra Cuentas, M.D., Ph.D.
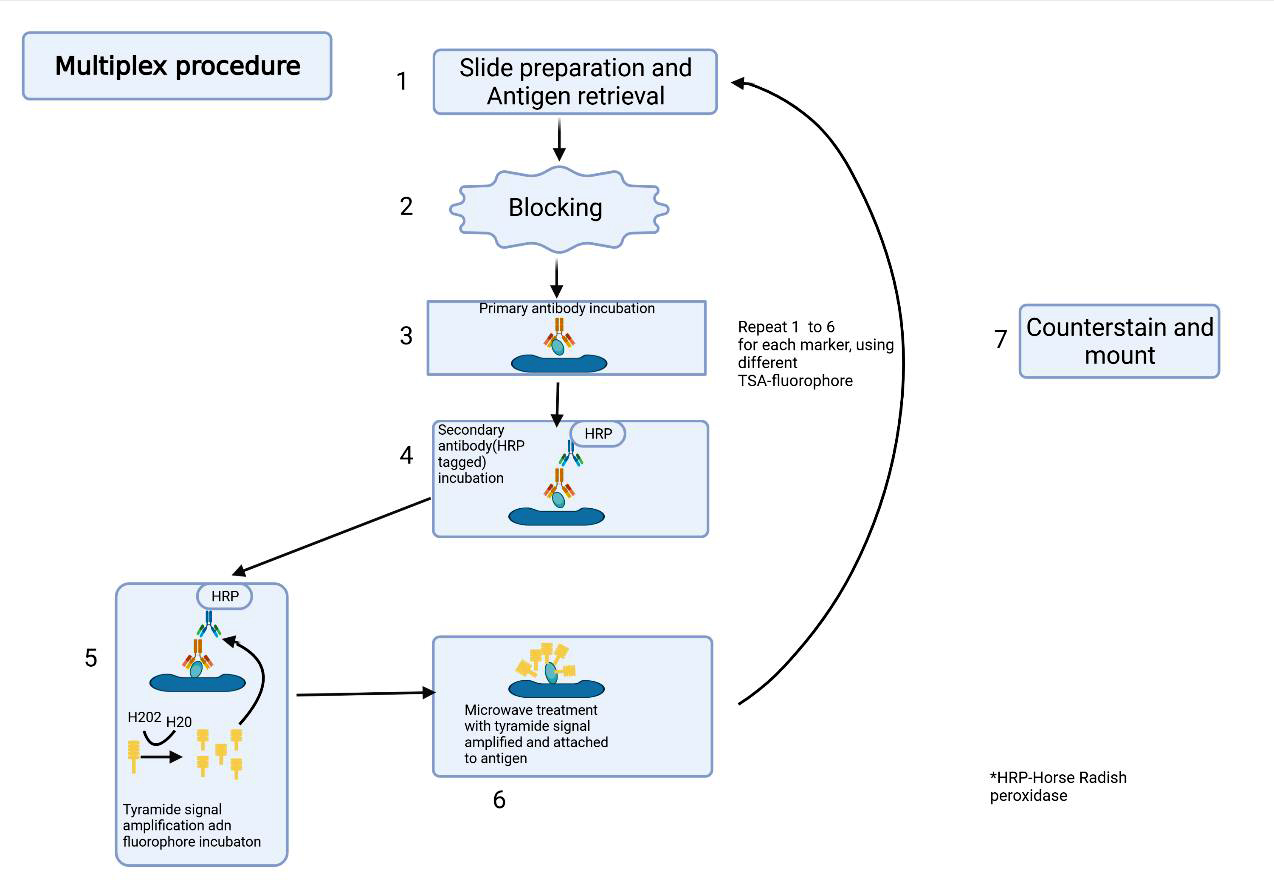
Procedure
- Panel design and selection: select (a) epitopes and markers with lowest redundancy; (b) optimal combination of colocalizing markers based on clinical implications; (c) other antibodies to answer specific scientific or research questions, such as immune checkpoint (Methods Mol Biol 2020;2055:467)
- For purposes of colocalizing, the convention is to pair the brightest opal fluorophores with the weaker expressing proteins and vice versa
- Optimization of primary antibodies by chromogenic IHC: refers to antibodies that have been tested using multiple titers and antigen retrieval conditions on control tissues to screen for markers which produce the best staining pattern
- Use of automated staining is preferred
- Careful selection of positive and negative control to be done; a serial of at least 10 different tissues must be tested to determine the assay's operating characteristics (sensitivity and specificity) for each antibody
- Uniplex immunofluorescence and optimization of primary antibodies: each target to be assessed by a uniplex immunofluorescence assay using single fluorophore to optimize the primary antibodies starting with the same primary antibody concentration as in IHC validation
- mIF staining consists of following steps:
- Slide preparation
- Epitope retrieval
- Blocking
- Primary antibody incubation
- Incubation with secondary antibody conjugated with horseradish peroxidase (HRP), which catalyzes the formation of tyramide into highly reactive tyramide radicals that covalently bind to tyrosine moieties close to the epitope of interest on formalin fixed paraffin embedded (FFPE) tissue
- Tyramide signal amplification (TSA) with fluorophore incubation: combination of tyramide and fluorophore is water insoluble and when attached to antigen, the assembly is very stable (Methods Mol Biol 2020;2055:467)
- Primary and secondary antibody washout by microwave treatment
- Repeating the above steps for each primary antibody and corresponding TSA fluorophore
- Counterstain with DAPI and mount
- Spectral library and linear unmixing
- Spectral library: collection of spectral references matching the intensities contained in the multispectral image used to decode the information in the image at each pixel
- Made by staining single samples with one fluorescent dye at a time with a primary antibody directed against a well known and highly prevalent antigen (e.g. CD20, CD3, etc.)
- Once the library is created, the emitted spectra from each dye can be extracted and registered using a software
- Linear unmixing: for the purpose of analysis of a multispectral image, it needs to be unmixed into its component fluorochromes, which is done using a software constructed algorithm which keeps spectral library and tissue autofluorescence as reference
- Other fluorescence based multiplex staining methods without signal amplification
- Multiepitope ligand cartography (MELC): technology using samples subjected to cycles of fluorescent staining, imaging and photobleaching, with different antibody in each cycle, thus creating analytical images with different antigen localization on single sample
- Sequential immunoperoxidase labeling and erasing (SIMPLE): can visualize 5 - 12 markers using the alcohol soluble peroxidase substrate 3 amino 9 ethylcarbazole with a fast, stable antibody antigen separation method
- MultiOmyx™ staining or hyperplexed immunofluorescence assay: involves a pair of directly conjugated cyanine dye labeled (Cy3, Cy5) antibodies per round of staining, with imaging at end of each round and followed by novel dye inactivation chemistry, enabling repeated rounds of staining and deactivation for up to 60 protein biomarkers
- Advantageous particularly in hematopathology studies
- Codetection by indexing or fluorescent immunohistohybridization (CODEX): this technology uses an antibody conjugated to barcoded unique oligonucleotide sequence
- CODEX assay targets specific barcodes with a dye labeled reporter for highly specific detection
- Tissue sample is stained with the antibody panel in a single step and the reporters bind to the complementary barcodes through repeated cycles of imaging and removal
Contributed by Harsh Batra, M.B.B.S., D.C.P., D.N.B., Maria Gabriela Raso, M.D. and Edwin Roger Parra Cuentas, M.D., Ph.D.
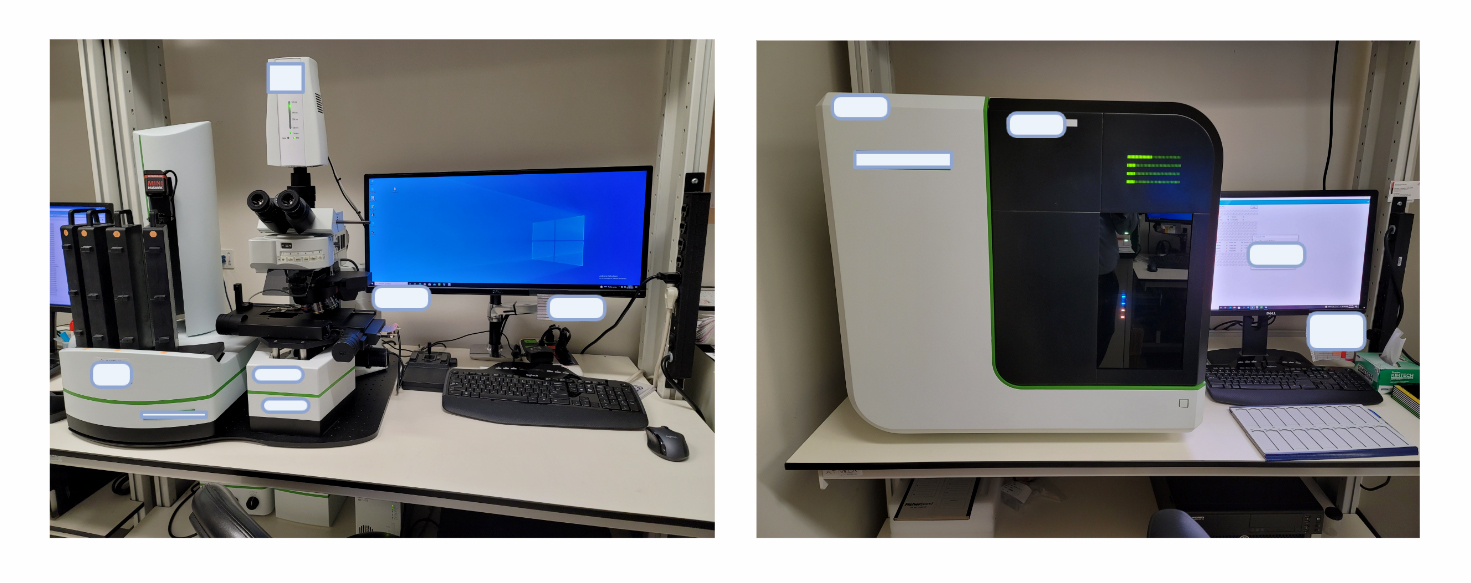
Equipment

Library building and unmixing
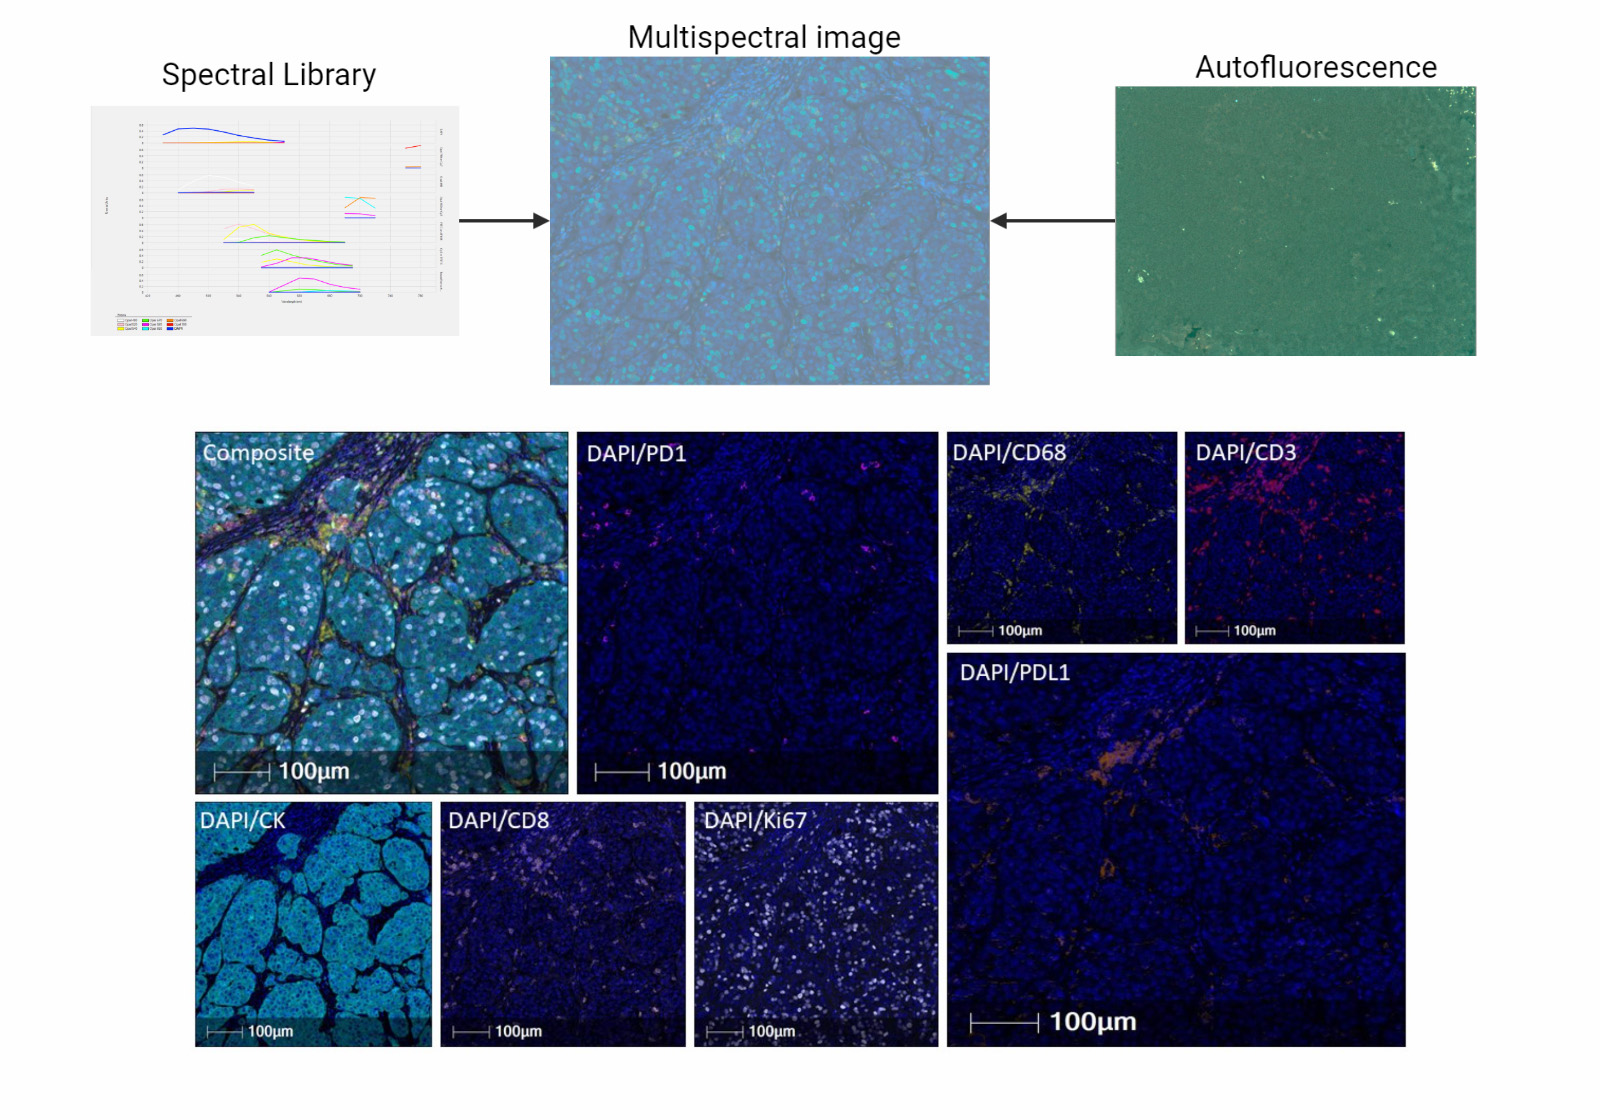
After linear unmixing
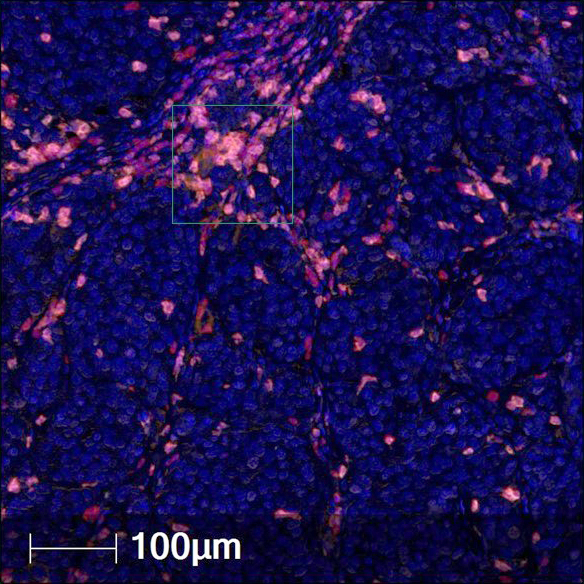
Colocalization of 3 markers
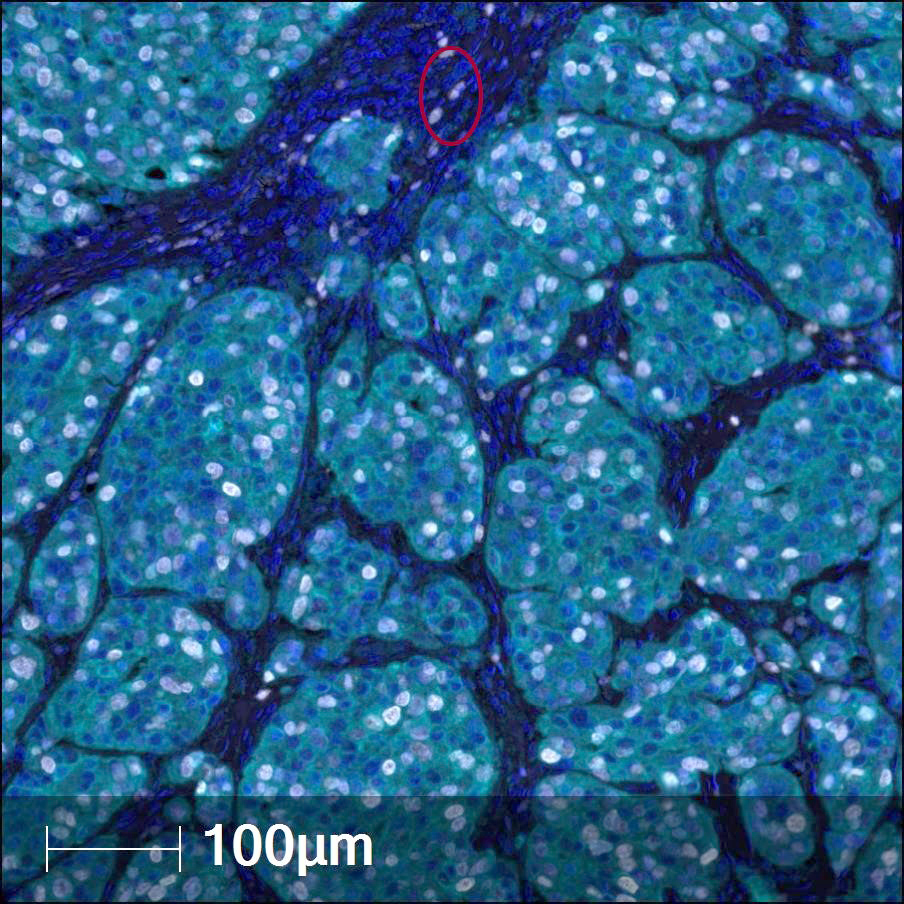
Colocalization's markers
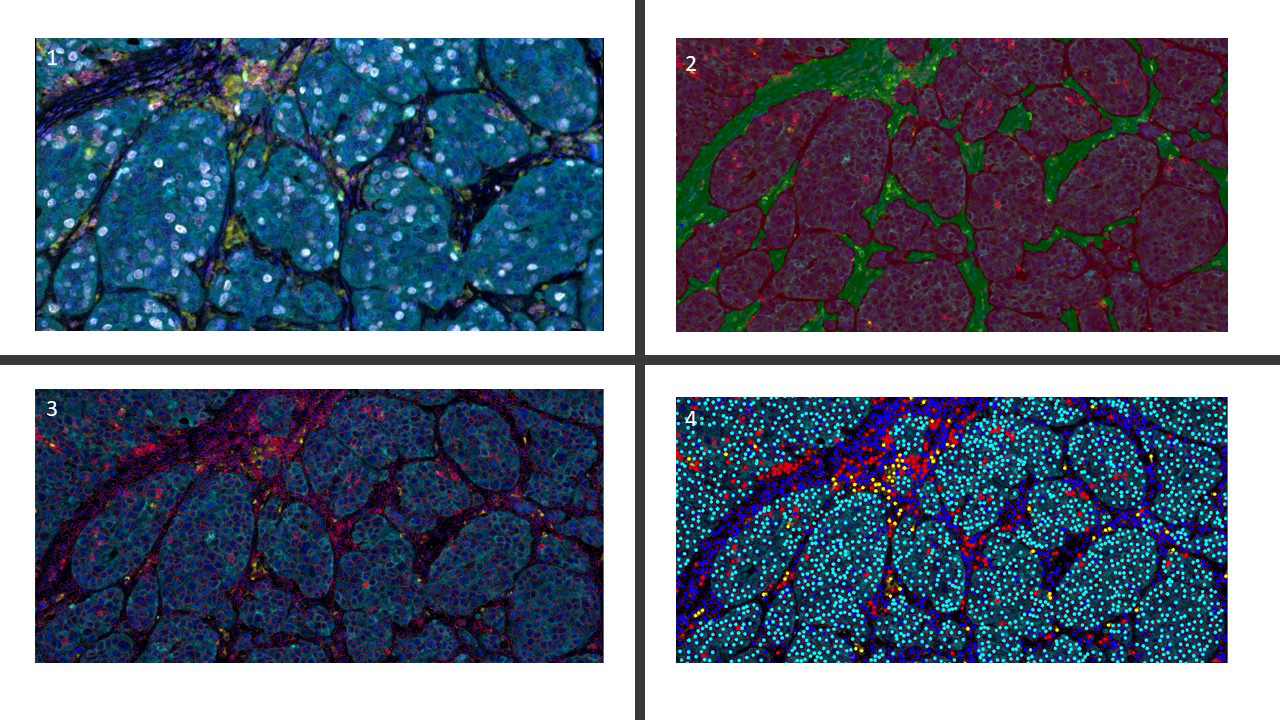
Software analysis
- Image analysis: multiplex immunofluorescence images are read digitally on specially built software, which needs expertise to build an algorithm to analyze each case
- Slides with region of interest are scanned based on pathologists' expertise and disease in question
- Basic workflow of an algorithm is image preparation by linear unmixing → tissue segmentation → individual cell segmentation → phenotyping
- Data generated can be read using computer programming languages viz R, Python and C to generate meaningful results
- Software and platforms to analyze multiplex data (J Cancer Treatment Diagn 2018;2:1):
- Commercial:
- InForm® (Akoya / PerkinElmer)
- MultiOmyx™ Quantification Program (NeoGenomics)
- Aperio eSlide Manager analysis (Leica Biosystems)
- Tissue Studio / Image Developer (Definiens)
- AQUAnalaysis (HistoRx)
- SlidePath's tissue image analysis (SlidePath)
- HALO® (Indica Labs)
- Visimoph Tissuemorph (Visiopharm)
- Image Pro (Media Cybernetics)
- iCyte / iBroser / iNovator (CompuCyte)
- HistoQuest / TissueQuest / StrataQuest (TissueGnostics)
- Open source:
- Image J (NIH)
- QuPath
- Icy (icy.bioimageanalysis.org)
- Cell Profiler / Cell Analyst (cellprofiler.org)
- Commercial:
- Advantages:
- Can study the cell biology through capturing multidimensional data related to tissue architecture, spatial distribution of multiple cell phenotypes and coexpression of signaling and cell cycle markers at the same time (J Cancer Treatment Diagn 2018;2:1)
- Can assess multiple antibodies on a single tissue section
- Disadvantages:
- Requires a significantly longer time to acquire, process and analyze (Cytometry A 2006;69:735)
- Needs costlier equipment and special expertise, which presently lacks trained individuals
- To study the tumor microenvironment in detail, including spatial configuration (Lung Cancer 2018;117:73)
- To discover new therapeutic biomarkers and possible drug targets, thus helping to discover new immunotherapies (J Thorac Oncol 2018;13:1884)
- Immunophenotypic findings of the tumor associated immune infiltrate determined by multiplex immunofluorescence can further be correlated with genomic or transcriptomic data from the same patients (Lab Invest 2014;94:107)
Which of the following steps does a raw multispectral image undergo before analysis on a digital software?
- Linear unmixing using spectral libraries
- Segmenting
- Uncoating and pixelation
- Unrevealing
Comment Here
Reference: Multiplex immunofluorescence
- Confocal imaging
- Transmission of electrons
- Tyramide signal amplification
- Tyrosine signal amplification
Comment Here
Reference: Multiplex immunofluorescence
- Natural language processing (NLP): research and application that explores how computers can be used to understand and manipulate natural language text or speech to do useful things
- Although AI has addressed the problem of human language as early as the 1950s, progress has come in very small, hard fought increments, each time with the introduction of new methods to address the problem
- Programs are finally being made to understand English and other natural languages written in free text, with rich potential application in extracting and understanding pathology information (Multimed Tools Appl 2023;82:3713)
- NLP algorithms can automatically extract named entities from pathology reports
- Word embeddings (interpreting words as vectors in an n-dimensional space) in combination with neural networks can categorize text into different categories
- Suggested categories of applications of NLP to pathology (Am J Pathol 2022 Aug 17 [Epub ahead of print]):
- Extraction of information from pathology reports
- Summarization of pathology reports
- Machine translation
- Topic modeling (grouping keywords according to an intelligent scheme)
- Workflow optimization / prescreening
- Report generation
- Free text versus discrete data:
- Free text data occurs in an information system when text that is not already structured into form fields has to be processed to retrieve relevant information (e.g., the excision shows lepidic predominant adenocarcinoma of the lung, 1.4 cm, T1 N0, with negative resection margins)
- Discrete data is organized into fields, making it much easier for a program to extract the appropriate data
- For example, a pathologist might fill in a template in SoftPath:
| Diagnosis | Histology | Tumor size (cm) | T stage | N stage | Margin status |
| Adenocarcinoma | Lepidic predominant | 1.4 | 1 | 0 | Negative |
- 1980s: corpus linguistics and a rise in processing power allow significant work in machine learning algorithms (e.g., logistic regression)
- 1990s: era of statistical natural language processing as well as support vector machines, etc.
- 2000s: ascendance of unsupervised and semisupervised learning algorithms
- 2010s: era of neural NLP as the use of deep neural networks and representation learning became predominant
- Reference: Cancer 2017;123:114
- In a review of the pathology NLP literature up to 2014, the most used technique was word / phase matching, followed by machine learning
- The Unified Medical Language System and SNOMED were most frequently employed to encode information obtained from reports; extracting structural information, automated coding and case detection were the most common use cases (J Clin Pathol 2016 Jul 22 [Epub ahead of print])
- In a review of the pathology NLP literature up to 2014, the most used technique was word / phase matching, followed by machine learning
- Tokenization: automatic division of text into fundamental units or tokens (similar to words)
- Stemming and lemmatization: reduction of words into their basic forms or roots (i.e., metastatic to metasta* or invasive to inva*)
- Part of speech (POS) recognition: identification of nouns, verbs, adjectives, adverbs, prepositions, conjunctions, articles, subjects, objects, etc.
- Bag of words: a method for representing a piece of text by considering only the set of words it contains, discarding all information about order and phraseology
- Unified Medical Language System (UMLS): a set of files and software that codifies hundreds of thousands of medical terms across several health / biomedical vocabularies, allowing more effective interoperability between biomedical information systems and services
- SNOMED: a systematically organized, computer processable collection of medical terms providing codes, synonyms and definitions used in clinical documentation and reporting
- Automatic text summarization: the use of computer programs to reduce text written in natural languages such as English, whether by selection of important sentences and phrases (extractive) or true summarization by rewriting (abstractive)
- Embeddings: digesting data into points in a vector space; for example, a pretrained language model such as bidirectional encoder representations from transformers (BERT)
- Support vector machine (SVM): a machine learning model for classification in which a data point is viewed as a p dimensional vector and (p-1) dimensional hyperplanes are drawn to separate different categories of points
- Neural network: a ubiquitous machine learning construct, capable of complex and nonlinear behavior, in which the nodes (arranged in layers) have inputs and outputs
- Convolutional neural network (CNN): a neural network structured for image analysis / computer vision which involves convolution operations (i.e., the application of a filter or kernel across the pixels of an image)
- Recurrent neural network: a fully connected neural network architecture in which some layers feed backward to earlier layers, forming a loop that gives the network a memory
- Used in sequence labeling tasks as well as text classification and generation
- Long short term memory builds off this design, giving the network a more robust memory
- Long short term memory (LSTM): a neural network architecture useful for text and speech which implements a feedback loop to process not only single data points but entire sequences of data
- Bidirectional encoder representations from transformers (BERT): an NLP solution, at the crux of which is the transformer, a deep learning model that adopts the mechanism of self attention (differentially weighting the importance of parts of a sequence of input)
- BioBERT is a language model pretrained on medical texts
- Latent Dirichlet allocation (LDA): a topic model in which a set of topics are attributed in different degrees to a set of documents according to a 3 level hierarchical Bayesian model
- Transformer: a neural network model made up of 2 modules: an encoder and a decoder
- The encoder uses a mechanism called attention to identify relationships between relevant words in the text
- By masking, the decoder is only able to see the words up to the current position in text and has the challenge of predicting the next word
- Generative pretrained transformer (GPT): a language model based on the transformer unit, which uses only the decoder half
- Has gone through versions 2, 3 and 35 (being trained on progressively larger datasets), with a fourth likely in late 2023
- Reference: Am J Pathol 2022 Aug 17 [Epub ahead of print]
Images hosted on other servers:

Architecture of deep neural network

Bag of words model

Word embedding
- A significant amount of work has been done using the tools of NLP to examine the copious data in electronic health records (EHRs) and lab information systems (LISs)
- Extraction of information (exam indication, how proximal the endoscope reached, whether a polyp was found etc.) from colonoscopy records of 4 U.S. institutions (J Am Med Inform Assoc 2017;24:986)
- Identification of renal pathology cases requiring urgent clinician attention (e.g., infections in immunocompromised patients, transplant rejection, unexpected malignancies, glomerular crescents) (Am J Surg Pathol 2012;36:376)
- Prediction of CPT codes from the text of pathology reports (J Pathol Inform 2019;10:13)
- Extraction of information on bladder carcinomas (invasion, grade, presence of muscularis propria and CIS) from pathology reports (Urology 2017;110:84)
- Automated detection of reportable cancer diagnoses from the text of pathology reports, leading to a reduction in workload for human tumor registrars (J Am Med Inform Assoc 2016;23:1077)
- Automated classification of tumor morphology from the text of pathology reports from an Italian oncological center (J Biomed Inform 2021;116:103712)
- Automatic extraction of mammographic and pathologic findings from free text mammogram and pathology report text for clinical decision support (Cancer 2017;123:114)
- Automated coding of free text breast pathology reports with limited manual assistance (J Pathol Inform 2015;6:38)
- Extraction of key information (specimen, procedure, pathologic entity) from a very large set of pathology reports using bidirectional encoders and LSTM (Sci Rep 2020;10:20265)
- Automated retrieval and classification of colorectal pathology reports, distinguishing adenocarcinomas from others (J Pathol Inform 2022;13:100008)
- Biomedical knowledge extraction from MEDLINE abstracts (Multimed Tools Appl 2023;82:3713)
- Automated categorization or classification of disease entities (e.g., based on pathologist descriptions of histology)
- Extracting pertinent information from patient electronic health records (EHRs)
- Identifying potentially urgent situations (needing immediate clinician attention) from pathology report text
- Researching and writing articles for pathology scientific publications
- Template and form based pathology report generation
Comment Here
Reference: Natural language processing (NLP)
- An automated script that can search through a pathology information system and recognize key words suggesting a cancer diagnosis
- Creating word clouds from documents or collections of documents
- Programming of chatbots and personal assistants
- The branch of AI that deals with enabling computers to understand and generate human language
- Training a computer application to generate text mimicking a human
Comment Here
Reference: Natural language processing (NLP)
- Extracting all mentions of a certain disease entity from a patient’s documents in the EMR system
- Filling out a job application form with fields for first and last names, street address, city, state and postal code
- Scanning through a novel for sentences that mention a particular character
- Searching the Comments sections of anatomical pathology reports
Comment Here
Reference: Natural language processing (NLP)
- This topic is about validation and quality control for digital pathology and artificial intelligence / machine learning (AI / ML) tools devoted to pathology
- Spectral imaging, commonly referred to as imaging spectroscopy, combines traditional imaging and spectroscopy techniques to gather both spatial and spectral data about an object (J Biomed Opt 2013;18:100901)
- Technique that generates a spectrum (with varying spectral resolution) for every pixel of an image (Stud Health Technol Inform 2013;185:43)
- Analysis is based on well validated standard spectroscopy algorithms used for identifying, unmixing and quantifying components in mixtures; spectral imaging software essentially modifies such methods to produce pixel by pixel quantitative data
- Compared to traditional approaches, spectral imaging provides better detection, validation, separation and quantification (Stud Health Technol Inform 2013;185:43)
- Spectrum: a collection of light intensities at different wavelengths
- Spectroscopy, the science of acquiring and explaining the spectral characteristics of matter, is a broad, well established and old science
- Newton described the dispersion of white light into its constituent colors in 1666
- By 1900 the spectrograph, a system for measuring a spectrum, was widely used
- Spectroscopy provided the spectrum of hydrogen that was explained by Balmer in 1885, which led to the Böhr model of the atom in 1913 and finally to the development of quantum mechanics by Schrödinger in 1926
- Reference: Cytometry A 2006;69:735
- Spectral imaging classification is dependent on the spectral resolution, the number of bands, bandwidth and contiguousness of bands as multispectral, hyperspectral (HSI) and ultraspectral
- In general, multispectral imaging systems collect data in a small number of relatively non-contiguous, wide spectral bands, which are often measured in micrometers or tens of micrometers
- These spectral bands have been chosen to gather intensity in very specific regions of the spectrum and are optimized for particular types of information that are most prominent in those bands
- HSI systems can collect hundreds of spectral bands
- Ultraspectral imaging systems can gather even more spectral bands than HSI systems
- Concept of the hypercube data obtained by a spectral imaging system is illustrated in diagram 1
- Data of spectral imaging can be visualized as a 3 dimensional (3D) cube or a stack of multiple 2 dimensional (2D) images due to its intrinsic structure, in which the cube face is a function of the spatial coordinates and the depth is a function of wavelength
- One of the key benefits of this technique is that it can obtain the reflectance, absorption or fluorescence spectrum for each pixel in the image; this allows for the detection of biochemical changes in objects that cannot be identified using conventional gray scale or color imaging techniques
- Reference: J Biomed Opt 2013;18:100901
- Hardware architecture of a typical biomedical spectrum imaging system is illustrated in diagram 2
- It typically consists of 4 components:
- Collection optics or instruments
- Spectral dispersion element
- Detector
- System control and data gathering module
- Reference: J Biomed Opt 2013;18:100901


- The term collection optics (or instruments) refers to collecting and imaging optics
- This includes microscopes, endoscopes, camera lenses and other devices that can project an image onto the spectral dispersion element
- Quality of an image decides the amount of information that can be obtained from it; the following list outlines the most prevalent factors that define the acquired images:
- Spatial resolution identifies the items' nearest recognizable features; it mostly depends on
- Wavelength (λ)
- Numerical aperture (NA) of the objective lens
- Magnification and the pixel size of the array detector, which is often a charged coupled device (CCD) camera
- Lowest detectable signal relies on
- Quantum efficiency of the detector (the higher the better)
- System noise level (the lower the better)
- NA of the optics (the higher the better)
- Optics quality
- Dynamic range of the captured data determines the number of various intensity levels that can be identified in an image
- It depends on the maximal possible number of electrons at each pixel and on the lowest detectable signal (basically it is the ratio of these 2 values)
- However, if the measured signal is weak and only partially fills the CCD well associated with each pixel, the dynamic range will be constrained
- Field of view (FOV) determines the maximal area that can be imaged
- Other factors include the exposure time range, which is typically determined by the detector, and binning CCD pixels to increase sensitivity (by trading off spatial resolution)
- Spatial resolution identifies the items' nearest recognizable features; it mostly depends on
- In actual measurements, there are a variety of imperfections that decrease the image's quality, including autofluorescence, nonspecific staining, bleaching and others; however, these should be distinguished from the physical restrictions imposed by the electro-optical system itself and the properties of light (Cytometry A 2006;69:735)
- The spectral dispersion element is the main component of the system that enables the separation of the light into different wavelengths
- 2 types of frequently used wavelength dispersion tools are dispersive spectrometers and spectral filters
- Dispersive spectrometers consist of many transmitting or reflecting components separated by a distance corresponding to the wavelength of the light under analysis
- Frequently it refers to prisms, gratings, prism grating prism (PGP) or beam splitters, which can be used with whiskbroom, pushbroom and some snapshot imaging modes
- Spectral filters have the characteristic of passing radiation through a very narrow bandpass or spectral bin and this can be spectrally tuned over a wide spectral range, usually in a very short time
- The most widely used tunable filters in spectral scanning instruments are acousto-optical tunable filters (AOTF), liquid crystal tunable filters (LCTF), circular and linear variable filters (CVF and LVF)
- Interferometer is another frequently used spectral dispersion component that can produce spectral images by adjusting the optical path length difference (OPD) between 2 beams, capturing the interference intensity as a function of the OPD (interferogram) and Fourier transforming the interferograms pixel by pixel (Opt Express 2011;19:1291)
- Used to gather the intensity of light necessary to measure the spectrum at each pixel in the image
- A variety of sensors, including the photomultiplier tube, linear CCD, area CCD and CMOS, focal plane array and electron multiplying charge coupled device (EMCCD), can be used as detectors depending to the imaging required
- Spectrum imaging may be helpful in applications where subtle spectral discrepancies exist in chemical components within a scene of spectral images
- It has enabled applications in a wide variety of biomedical engineering studies, ranging from specific biochemical species detected in in vitro samples to organs of living individuals (J Biomed Opt 2013;18:100901)
- In vivo optical imaging enables noninvasive monitoring of living organisms and aids in the comprehension of metabolic processes and changes in the body brought on by disease
- Spectral imaging has recently been used for in situ tissue diagnosis as one of the optical diagnostic technologies
- Skin is one of the best candidates for in vivo spectral imaging among openly accessible tissues
- Multispectral imaging system is used to evaluate the burn depth of the skin
- It was reported that the spectral imaging method was more accurate in predicting burn healing than the traditional method (IEEE Trans Biomed Eng 1988;35:842)
- Noninvasive spectral reflectance methods can be used for mapping blood oxygen saturation in various types of wounds, ranging from burn injuries and diabetic related ulcers to skin grafts
- Additional studies involve identifying skin ulcers and spectral imaging of cancer skin fluorescence and reflectance (IEEE Eng Med Biol Mag 2004;23:40)
- Recent studies have focused on 3D HSI on small sections of human skin, quantifying skin oxygen saturation and how it relates to conventional wound healing measures, evaluating ischemic wounds and studying breast cancers (Opt Express 2010;18:3244, Biomed Opt Express 2012;3:1433, J Biomed Opt 2011;16:066007)
- These studies suggest that noninvasive in vivo skin surface detection using spectral imaging technology may be useful in the early evaluation of burn injuries and skin malignancies
- Another important in vivo application of spectral imaging is retinal detection
- Some earlier studies concentrated on the development of the retinal spectral imaging system coupled with a standard ophthalmic fundus camera (Invest Ophthalmol Vis Sci 2004;45:1464)
- Some researchers also discussed how to use spectral images to analyze retinal abnormalities and determine their extent
- In vivo spectral imaging technology has also been used for tongue surface identification and oral cancer diagnosis (Appl Opt 2010;49:2006)
- Use of a spectral imaging system in conjunction with a gastroscope, endoscope and colposcope allows for the in vivo detection of some intracorporeal organs in addition to the exterior organs and tissues
- Multispectral imaging system based on liquid crystal tunable filter (LCTF) was developed for the in vivo detection, quantitative staging and mapping of cervical cancer and precancer (IEEE Trans Biomed Eng 2001;48:96)
- Another promising use of in vivo spectrum imaging is the guidance of surgical intervention, treatment and real time assessment of tissue response to therapy (Opt Express 2010;18:8058)
- Surgeons can use in vivo spectral imaging to define the tumor margins and find any micrometastases or residual tumor cells
- Nanotechnology and optical instrumentation advancements can be used for surgical oncology applications such as tumor localization, tumor margins, identification of significant adjacent structures, mapping of sentinel lymph nodes and detection of residual tumor cells (Annu Rev Med 2010;61:359)
- Furthermore, some scientists perform in vivo diagnostics using diffuse spectral imaging technology
- This technology has been used for early diagnosis and screening of malignant alterations in the oral cavity
- Some initial findings indicate the possible application of this technique in routine clinical practice for rapid screening for oral cancer (J Opt 2013;15:055301)
- Spectral imaging technology might provide a novel tool for histological analysis
- It can utilize the spectral characteristics of different stains applied in histological sections to segment features of interest for later morphometric evaluation
- This technique has been effectively used in recent years to identify a variety of histology stains and immunolabeling reaction products and has shown to be capable of finding any color stained object
- Spectral analysis of stain combinations was described, including
- Safranin O / hematoxylin for proteoglycans in articular cartilage
- Oil red O in adipose tissue
- Peroxidase diaminobenzidine immunostain with either a fast green or hematoxylin counterstain
- Alkaline phosphatase (AP) red and Vector Red immunostain and counterstains in a variety of tissues
- Additionally, the studies discussed the possibility of using the spectral imaging method for quantitative assessment of the uptake by histologic samples of stains used in pathology to label tissue features of diagnostic importance (IEEE Trans Biomed Eng 2003;50:207)
- Using HSI technology, which combines spectroscopy and imaging, an objective method was developed to identify gastric cancer (J Biomed Opt 2013;18:26010)
- A more recent study used an infrared (IR) spectral imaging system to diagnose colon cancer (Cytometry A 2013;83:294)
- Additionally, IR spectral imaging system has been employed to perform the histopathology mapping of biochemical changes in myocardial infarction, live epithelial cancer cells, histologic and biochemical correlations in tissue engineered cartilage and histomorphological evaluation of oral squamous cell carcinoma of the oral cavity (J Clin Pathol 2013;66:312)
- One of the most widespread applications of spectral imaging technology is spectral karyotyping (SKY), which is based on FISH and revolutionized mouse and human cytogenetics
- Recent applications of SKY include assessing
- Chromosomal rearrangements in post Chernobyl papillary thyroid carcinomas
- Detecting constitutional chromosomal abnormalities
- Describing giant marker and ring chromosomes in a pleomorphic leiomyosarcoma
- As a result, it is an important technique for the cytogenetic analysis of a wide variety of chromosomal abnormalities linked to a lot of genetic diseases and cancers (J Vis Exp 2012;60:3887)
Spectral imaging laboratory
Medical applications of hyperspectral imaging
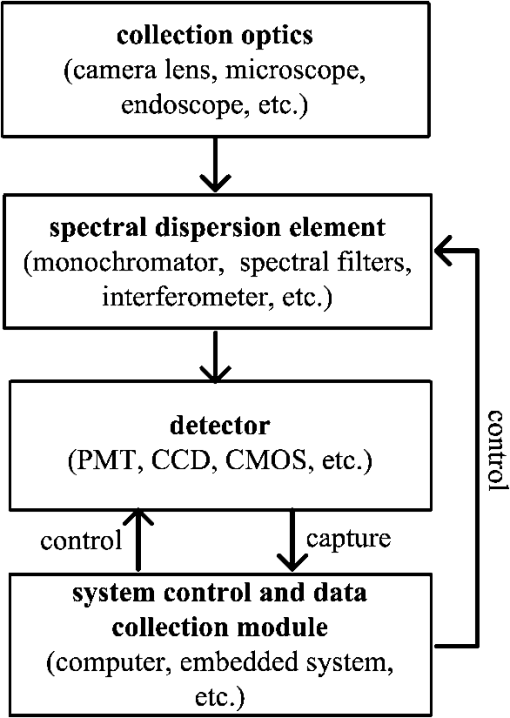
In spectral imaging, the detector is used to gather which of the following?
- Color of light
- Contrast of light
- Hardness of light
- Intensity of light
- Collection optics
- Detector
- Spectral dispersion element
- System control and data gathering module
- Through a database management system (DBMS), structured query language (SQL) is the language used for interacting with relational databases commonly used in research systems, laboratory information systems (LIS), ecommerce websites, reservation systems and other applications that store and manage data
- When a search for a test result in your laboratory information system is conducted, an SQL query is sent to your database management system to retrieve your data of interest; the result is returned to your laboratory information system software and eventually displayed on your screen
- Relational databases, such as those within laboratory information systems, consist of stored data in the form of multiple tables linked to one another; these laboratory databases are composed of hundreds / thousands of tables, with each table containing as many as millions of rows of data
- For instance, a table containing lab order details may have one row of data for each lab order (each row contains various order details: order date, test ordered, order status)
- In a laboratory information system, there will be separate tables for patient information, patient visits, ordered tests, specimens, test results and test details
- Note: many electronic medical records (another type of hospital software system) are based on a different type of database (hierarchical) that follows a tree-like structure; these databases may not be queried using SQL
- Some tools, like Microsoft Access and LibreOffice Base (an open source database application), enable you to graphically link tables together to create an SQL query without having to write the SQL statement yourself
- Data from older data storage systems may be migrated to relational databases through a process referred to as ETL (extract, transform, load), where data stored from the original system is extracted and manipulated to fit the formatting requirements of the relational database system
- The process comes with challenges and at times, not every single piece of data is migrated (Stud Health Technol Inform 2019;264:233)
- SQL is the language used for interacting with relational databases
- In the hospital and laboratory setting, an SQL query will be the predominant way of directly accessing data from research and laboratory information system databases
- Users are often granted read only rights; commands that alter the contents of the database are reserved for database administrators (e.g., UPDATE, DELETE, INSERT)
- SQL may be used for cohort selection, result retrieval, management report and financial statement preparation
- A data dictionary and entity relationship diagram (ERD) is often available to assist in navigating through the various database tables of a laboratory information system
- Database: a system for storing information that allows efficient storage, management and retrieval of data
- SQL query: a statement for retrieving data from a relational database
- Field: data element in a row that falls under a column
- Entity relationship diagram: shows the relationships among different tables within a database (e.g., one to one, one to many)
- Data dictionary: provides details about each database table, including the content of each field and what field may be linked with another table (e.g., an order table may contain a patient ID field that can be linked with the patient ID field within the patient table)
- For study cohort selection (J Pathol Inform 2016;7:44)
- Clinical trial data management (Rev Recent Clin Trials 2019;14:160)
- Collection of data for financial and management reports, including turnaround time (TAT) and test utilization reports
- Curation of datasets for analysis and machine learning projects (PLoS Med 2018;15:e1002701)
- Genomic sequence similarity searching and analysis (Curr Protoc Bioinformatics 2017;59:9.4.1)
- SELECT: most important and frequently used by the average user
- Retrieves data from a table or multiple tables
- Primary method of retrieving data from relational databases is through a SELECT statement; at the bare minimum, it should consist of the SELECT command followed by the columns of interest, the FROM clause, followed by a table name (e.g., SELECT FIRST from patient [this statement returns all first names from the patient table])
- A query on a single table follows the following structure:
- SELECT [columns] FROM [table] WHERE [conditions] ORDER BY [column(s)]
- Fields to be retrieved are specified after the SELECT command
- Optional WHERE clause specifies the inclusion or exclusion criteria for the data being retrieved; although optional, most SELECT statements will have a WHERE clause, unless the purpose of the SELECT statement is to retrieve all the contents of a table or tables
- Optional ORDER clause specifies the sorting order and priority order for a column or columns
- JOIN clause: combines data from 2 tables
- INNER JOIN: returns rows that match for both tables
- LEFT OUTER JOIN: returns all rows from the first table and all matching rows from the second table
- RIGHT OUTER JOIN: returns all rows from the second table and all matching rows for the first table
- WHERE clause: conditional statement
- LIKE operator: matches a specified pattern
- Aggregating functions - COUNT, SUM, AVE, MIN, MAX: give the count, total, average, minimum or maximum value of a set of items, which are specified by the GROUP BY clause
- UPDATE: updates contents of a table
- INSERT INTO: adds data to a table
- DELETE: removes item(s) from a table
- DROP TABLE: deletes a table
- CREATE TABLE: creates table and specifies the data type for each column
- ALTER TABLE: adds / removes column(s) from a table, alters column data types (e.g., string, date or numeric)
- Reference: W3Schools: SQL Tutorial [Accessed 25 August 2022]
- Example queries and results are based on the 2 tables below (Orders, Patient)
- Orders:
ID PATIENT_ID ORDERED_DATE TEST_ID TEST_NAME 1 53053 20151014 CBC Complete blood count 2 53053 20151212 FRTN Ferritin 3 53404 20151212 LIPID Lipid panel 4 53404 20151126 A1C Hemoglobin A1C 5 52100 20151205 BASIC Basic metabolic panel 6 52100 20151204 CBC Complete blood count 7 52117 20151201 TRIG Triglycerides 8 52117 20151204 CHOL Cholesterol, total 9 52136 20151124 BASIC Basic metabolic panel 10 52136 20151124 CBC Complete blood count
- Patient:
ID MRN FIRST LAST ZIP 53053 800003295 WINNIE TEST 48176 53404 800002796 GEORGE FIVE 43619 52100 060000384 JOHN TRAIN 48112 52117 060000311 WILLIAM ADULT 48107 52136 800002844 PATIENT RESEARCH 43619
- Orders:
- SQL query example #1: SELECT TEST_ID FROM Orders
- In this example, the TEST_ID field was retrieved from each row
- Adding the DISTINCT keyword after SELECT will instruct the query to retrieve unique values only (see example #2)
- Query result:
TEST_ID CBC FRTN LIPID A1C BASIC CBC TRIG CHOL BASIC CBC
- SQL query example #2: SELECT DISTINCT TEST_ID FROM Orders
- Query result:
TEST_ID A1C BASIC CBC CHOL FRTN LIPID TRIG
- Query result:
- SQL query example #3: SELECT * FROM Patient
- Returns entire content of the patient table
- Query result:
ID MRN FIRST LAST ZIP 53053 800003295 WINNIE TEST 48176 53404 800002796 GEORGE FIVE 43619 52100 060000384 JOHN TRAIN 48112 52117 060000311 WILLIAM ADULT 48107 52136 800002844 PATIENT RESEARCH 43619
- SQL query example #4: SELECT * FROM Orders WHERE TEST_ID ='CBC'
- Retrieves every row with a TEST_ID of 'CBC'
- In a SELECT statement, the '*' wildcard character denotes every column will be returned from each row that matches the selection criteria, the selection criteria being TEST_ID = 'CBC' in this case
- Query result:
ID PATIENT_ID ORDERED_DATE TEST_ID TEST_NAME 1 53053 20151014 CBC Complete blood count 6 52100 20151204 CBC Complete blood count 10 52136 20151124 CBC Complete blood count
- SQL query example #5:
- SELECT TEST_ID, COUNT (TEST_ID) FROM Orders
- GROUP BY
- TEST_ID
- Query result:
TEST_ID A1C 1 BASIC 2 CBC 3 CHOL 1 FRTN 1 LIPID 1 TRIG 1
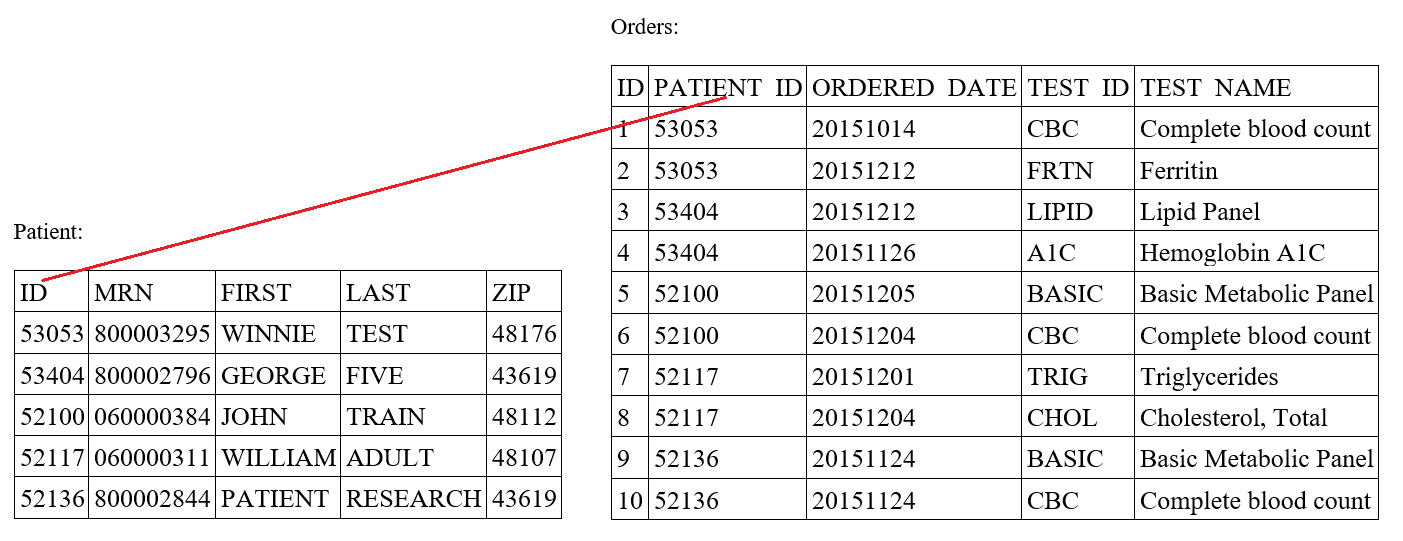
For which type of database are SQL queries used?
- Hierarchical
- Network
- Nosql
- Relational
Comment Here
Reference: Structured query language (SQL)
SELECT * FROM Orders WHERE TEST_ID ='CBC'
- Deletes every row in the orders table with a TEST_ID of 'CBC'
- Retrieves every row in the orders table
- Retrieves every row in the orders table with a TEST_ID of 'CBC'
- Returns every order from the TEST_ID table
Comment Here
Reference: Structured query language (SQL)
- This topic discusses data analysis, billing and other subjects related to surgical pathology not described elsewhere in the informatics chapter
- See also: Barcoding and tracking
- Specific applications of informatics in surgical pathology include
- Barcode and radio frequency identification (RFID) scanning data applications for specimen tracking and quality management
- Digital imaging and virtual microscopy
- Telepathology and remote consultation
- Laboratory information systems (LISs) and interface with electronic health record (EHR)
- Applications in quality and error reduction
- Applications for billing data
- Radio frequency identification (RFID)
- Digital workflow
- Whole slide imaging (WSI)
- Anatomical pathology laboratory information system (APLIS)
- Quality assurance (QA)
- Crowdsource the collection of quality issues occurring throughout the testing process across all sites and all staff by linking a structured data set of potential problems to the LIS
- By automating the collection of the patient and case context in the LIS when inputting a quality issue, issue entry is simplified and encouraged; linking this context to a quality issue enabled queries into data contained in the LIS for root cause analysis and quality improvement
- Structuring the issue input enables counting and trending issues over time; computers can be made to identify significant changes in issue trends for better or worse and alert staff to the change
- Associating quality issues with cost, delay and risk can give insight into significance of an issue beyond simple frequency
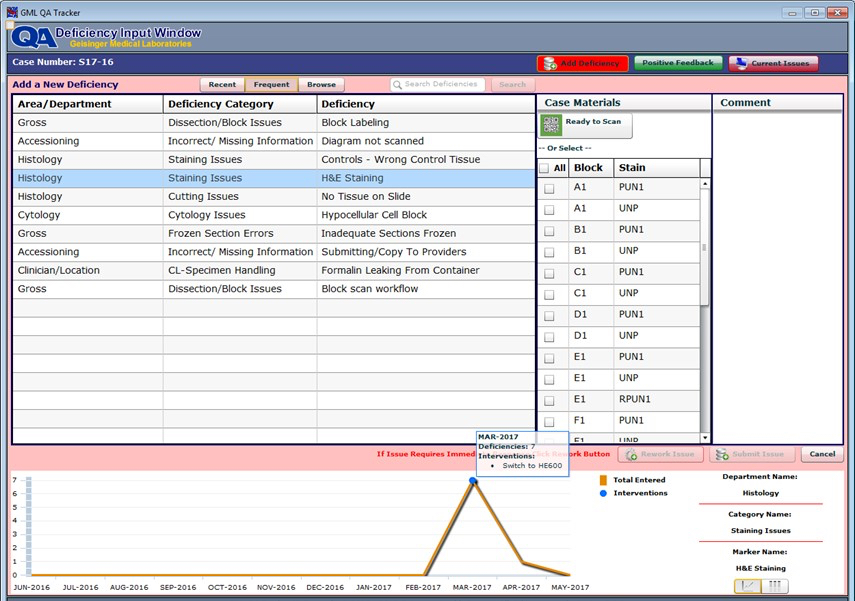
Quality assurance tracker
- Informatics tools for ensuring quality and error reduction in anatomic pathology (Clin Lab Med 2008;28:207)
- Preanalytical (e.g., surgical pathology specimen tracking)
- Ensure where a specimen is within the workflow at a specific point in time, learn how long the specimen spends in a given process and identify bottlenecks within the workflow
- Analytical (e.g., applying statistical quality control to immunohistochemistry through digital imaging)
- Quantitation of test kit controls using image analysis
- Application of common laboratory control methods to the results
- Establishing quantifiable acceptable limits for control results to monitor variability between runs and detect process errors
- Postanalytical (e.g., results reporting)
- Ensure that all results from LIS reach their respective repositories
- Detect, correct and resend any filing errors within 24 hours
- Reduce the number of filing errors to within a 6 sigma standard
- Preanalytical (e.g., surgical pathology specimen tracking)
Applications of laboratory information systems (LISs) in surgical pathology (Arch Pathol Lab Med 2015;139:319)
- Designed to meet workflow requirements in the laboratory and interface with electronic health record (EHR) and billing systems
- Anatomic pathology LIS handles workflows related to surgical specimens
- Patient identification
- Unique patient identifiers allow LIS to transmit patient data across multiple institutions, personal health records or state and federal registries for mandatory reporting
- Splitting samples
- Tracking requirements for dividing specimens between anatomic pathology (AP) and clinical pathology (CP)
- Ordering procedures for anatomical pathology (AP) orders entered in operating rooms (e.g., resections), surgery centers (e.g., endoscopies) and outpatient clinics
- Appropriate clinical information accompanies the specimen electronically to facilitate pathologist sign out
- Frozen section workflow in operating room
- Electronic order is created in the EHR and processed by the LIS either before or after specimen delivery, with or without an already existing specimen
- Specimen type in order interface
- Determined by the specimen type assigned for each part received
- Results in the number of cassettes printed and fee codes submitted

Complex items that may be required in AP orders
- AP results in the EHR
- Accessible and interpretable by clinicians
- Can be sent to the physician's office for an outreach specimen
- Either unstructured free text (with or without formatting and images) or in PDF format
- Display supported by EHR
- Linked with a test order
- Can be amended (i.e., new report clearly replaces the existing report and not displayed as a second report)
- Patient identification

Applications for billing data in surgical pathology
- Each surgical pathology specimen has a discrete Common Procedural Terminology (CPT) billing code indicating the complexity of the evaluation of that specimen
- These are 5 digit CPT codes the begin with 883??, ranging from a gross examination only code of 88300 to a comprehensive consultation core of 88325
- Each of these billing codes is associated with a relative value unit (RVU) to correspond the complexity of the CPT code
- Charting the complexity of the specimen billing codes can bring insight into the diversity of the caseload in a pathology practice
- A different set of CPT codes can be used to reflect on the discretionary test ordering patterns for stains
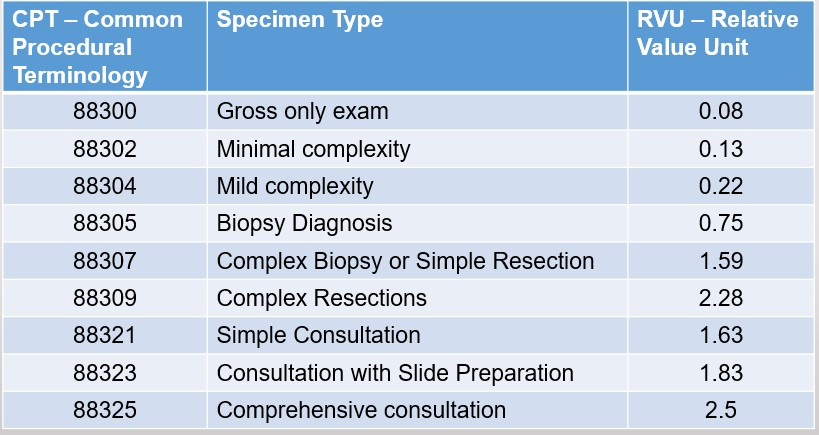
CPT codes for various specimens and associated RVU
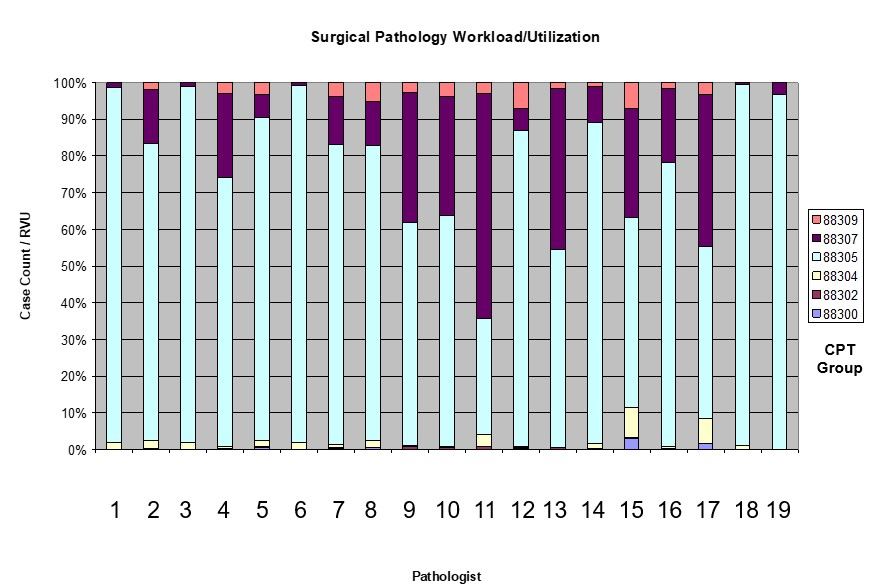
Diversity of caseload in a pathology practice
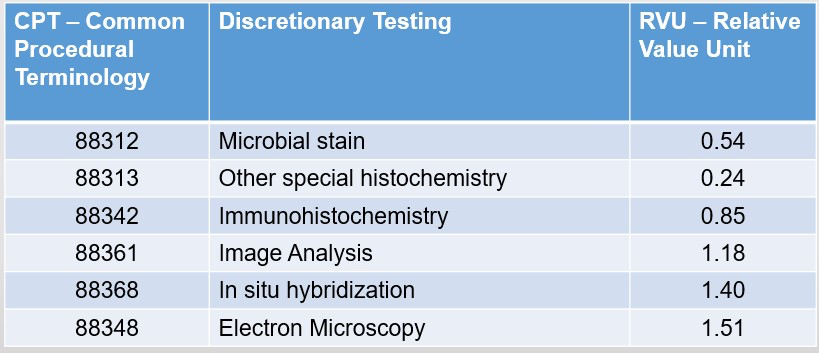
CPT codes for discretionary testing and associated RVU
- When combining the specimen CPT codes with the discretionary staining CPT codes, a chart can show how stain ordering practices can be similar or vary greatly between pathologists
- This type of analysis can be used to identify whether or not a standard of care or a care gap exists in a peer group
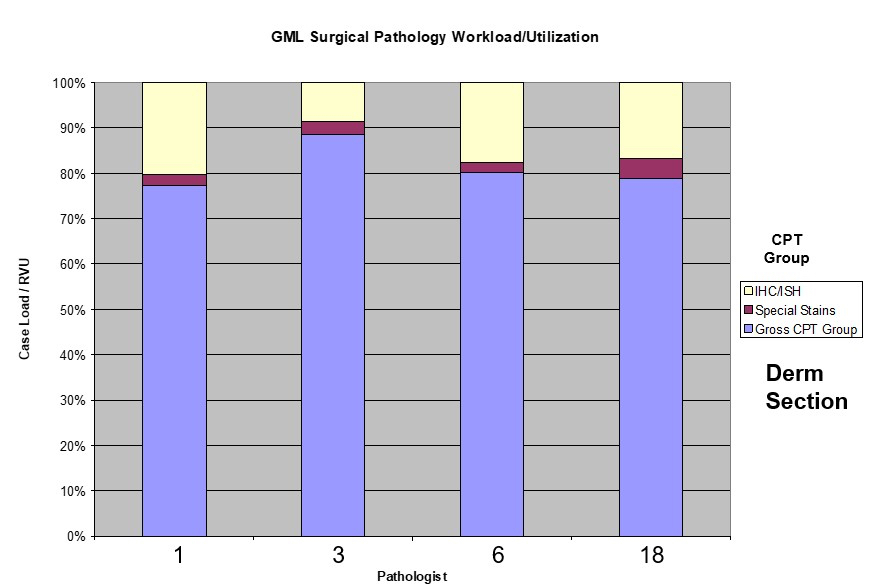
Similar stain ordering patterns
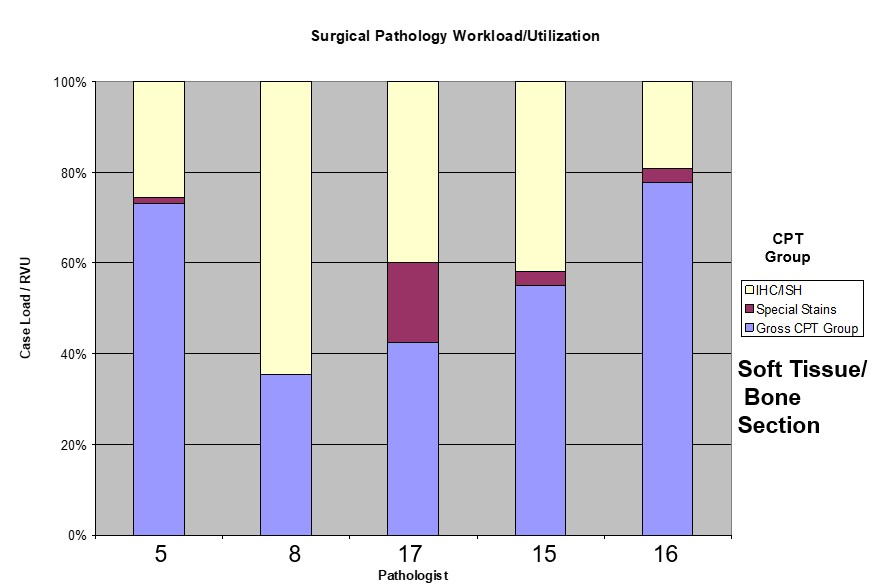
Different stain ordering patterns
Value of structured AP data (Pathol Lab Med Int 2015;7:11)
- Synoptic reporting in surgical pathology is a process for reporting specific data elements in a specific format based on cancer protocols
- Ensures:
- Completeness, timeliness, accuracy and clarity
- Follow guidelines published by pathology associations
- For pathologists
- Ease of creating report using format required by the College of American Pathologists (CAP) Laboratory Accreditation Program (LAP) checklist
- Inter and intrainstitutional collaborative clinicopathologic efforts
- For clinicians
- Accurate extraction of relevant information
- Permits rapid use of prognostic systems for patient therapy
- Scalability of data capture, interoperability and exchange
- For researchers and cancer registrars
- Raw data available within hours after report is released
- Allows digital extraction and categorization
- Use of natural language search modalities
- For researchers and cancer registrars
- Completeness, timeliness, accuracy and clarity
- Advantages of web based synoptic user interface:
- Ordering ancillary studies
- Utilizing diagnostic algorithms
- Quality assurance
- Creating pathology reports through automation with web based reporting systems with ability to populate data from ancillary studies, such as genomic data
Images hosted on other servers:


Applications / incorporation of informatics into surgical / anatomical pathology
- Analytic informatics tool
- Preanalytic and analytic informatics tool
- Preanalytic informatics tool
- Postanalytic informatics tool
- Telecytology has been implemented for rapid off site evaluation of cytology specimens, which improves efficiency by saving time spent in evaluation and subsequent triage of specimens for appropriate investigations and management by pathologist
- Telecytology has been integrated into the clinical practice of cytopathology for rapid off site evaluation of cytology specimens
- Other use cases of telecytology include primary diagnosis, teleconsultation and education / research
- To reproduce 3 dimensional (3D) structure of cytology specimen, digital cytology requires advanced scanning modes (Z stacking or extended focus) or video microscopy
- Rapid on site evaluation (ROSE): refers to immediate microscopic evaluation of fine needle aspiration material, traditionally performed on site, to assess for adequacy and to triage the obtained material for ancillary studies (Cytopathology 2014;25:322)
- Static image transmission: 1 person (e.g. cytotechnologist or house staff) on site takes representative photomicrographs of the slide and sends them electronically to the pathologist
- Dynamic microscopy: 1 person on site controls the microscope (position, magnification and focus) with a camera that streams the field of view to a remote computer, which a pathologist uses to view the slide in real time
- Whole slide imaging: digitization of glass slide images by scanning them at different planes and magnifications;
digital cytology requires advanced scanning mode to correctly reproduce 3D structure of cytology specimen (J Pathol Inform 2010;1:15)
- Z stacking: images captured from multiple planes along the z axis above / below the optimal focal plane are used to create a 3D structure (Z stack) image
- Extended focus mode (also known as EDF, extended depth of field): multiplane scanning with integration of the best focused image at each tile into a final single plane file
- Rapid on site evaluation: telecytology is being used increasingly for rapid on site evaluation (J Am Soc Cytopathol 2018;7:1)
- Intraoperative consultation of neuropathology specimens with smears and touch imprints preparations (J Pathol Inform 2020;11:13)
- No time wasted by pathologist to travel to site
- No delay for clinical team while waiting for pathologist to arrive
- Pathologists can do other activities during wait time between needle passes, increasing their efficiency
- A single pathologist can provide consultation for multiple concurrent ROSE procedures occurring at different sites
- Multiple users can login at the same time for a single case review; helpful in trainee education and second opinion
- Different users can annotate images at the same time to facilitate consultation (see Images section, image 1)
- Requires competent cytotechnologists or house staff to accurately identify areas of interest to present to pathologist (locator skills)
- Can slow the procedure if only 1 cytotechnologist or house staff is present for the procedure, since a single person cannot stain slides and screen slides at the same time
- Requires purchase of specialized software and hardware
- Implementation of telecytology for ROSE is cost effective and time saving (J Am Soc Cytopathol 2018;7:1)
- Telecytology can be done by:
- Static telecytology: images of preselected microscopic fields are transferred as digital images to the pathologist
- This is the simplest telecytology set up and requires a microscope fitted with a digital camera connected to the computer and an internet network
- Static telecytology is useful in resource limited settings
- However, it limits the pathologist's ability to examine the entire slide
- Time consuming: the staff on site has to screen the slide, take photomicrographs and then send them electronically; turnaround time may not be appropriate for ROSE
- Two dimensionality: inability to adjust the plane of focus to fully examine 3 dimensional cell clusters
- Cost effective
- Dynamic telecytology: requires similar hardware to static microscopy, a microscope, high definition (HD) digital microscopy camera, computer with HD digital live streaming software, secure internet network with sufficient bandwidth and connectivity (see Images section, image 2)
- With a skilled cytotechnologist on site, a pathologist in his / her office can review selected areas of the slide or even the entire slide much more quickly than static images
- Time efficient: since the cytotechnologist and pathologist review the slide together in real time, the method is faster than static images; there is also less delay in the transmission of images compared to whole slide imaging
- Requires technical expertise: familiarity with the operational software and initial training for smooth operation
- Dependent on locator skills of on site cytotechnologist
- Cost effective and users can be easily trained
- Robotic microscopy: robotic microscopes allow full remote control of the slides including position, magnification and focus; in the absence of on site cytotechnologists, the slides can be prepared by pathology assistants or laboratory technicians (J Pathol Inform 2020;11:13)
- Requires high speed internet
- Can be useful in low volume settings
- Whole slide imaging: rarely used for ROSE
- Time consuming due to need for z stacking (high resolution scanning in multiple focal planes) to adequately image 3 dimensional cell clusters
- Requires tremendous bandwidth
- Requires on site personnel to prepare and stain direct smears
- Might not be the most cost effective option (J Am Soc Cytopathol 2018;7:1)
- Static telecytology: images of preselected microscopic fields are transferred as digital images to the pathologist
- College of American Pathologists requires validation to be done for clinical practice in the United States, regardless of the telecytology platform
- Recommends validation to be performed by the pathologists, who will be using the telecytology system
- Should be performed in a setup similar to the usual work environment
- A minimum of 60 cases, including positive and negative cases that reflect the spectrum and complexity of routine cases per application should be used; the digital and glass slides should be reviewed at least 2 weeks apart and the diagnostic concordance is evaluated
- Whenever there is a significant change to the system that may potentially impact the interpretation of digital slides (e.g., new scanner is used, major hardware / software upgrade), the validation process should be repeated using a smaller set of cases (20 cases) (Arch Pathol Lab Med 2013;137:1710)
- Center for Medicare and Medicaid Services (CMMS) considers ROSE as a clinical test, hence a Clinical Laboratory Improvement Amendments (CLIA) number and a New York State clinical laboratory permit (in New York sites) are necessary
- Primary diagnosis:
- Whole slide imaging (WSI) for primary diagnosis in cytology is currently not FDA approved
- Some WSI scanners do not allow for z stacking or EDF to address the issues associated with imaging cytology specimens
- However, some authors have investigated the utility of WSI for primary diagnosis and they have shown good concordance with review of glass slides (Acta Cytol 2020;64:323)
- Consultation:
- Telecytology using static images or WSI is being used for remote telepathology consultation
- Implementation of the two systems depends on the availability of resources (e.g. hardware, network speeds, manpower) (Diagn Cytopathol 2019;47:28)
- Education:
- Telecytology, combined with remote conferencing and learning management platforms, has been received positively by cytology program students (J Am Soc Cytopathol 2020;9:579)
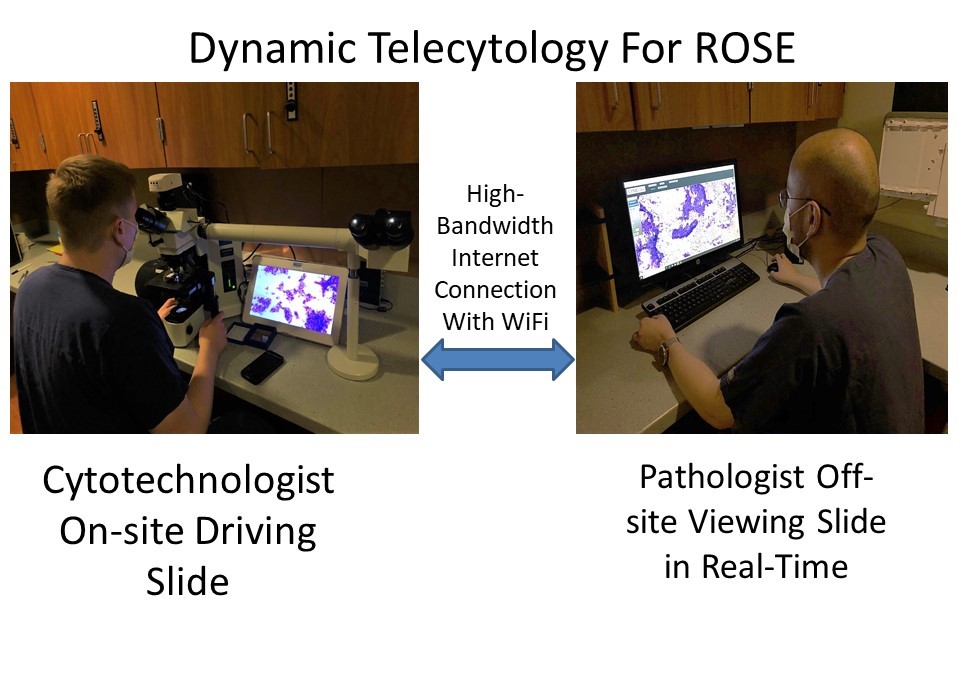
- Cytoatlas
- Image flattening
- Smoothening
- Two dimensionality
- Z stacking
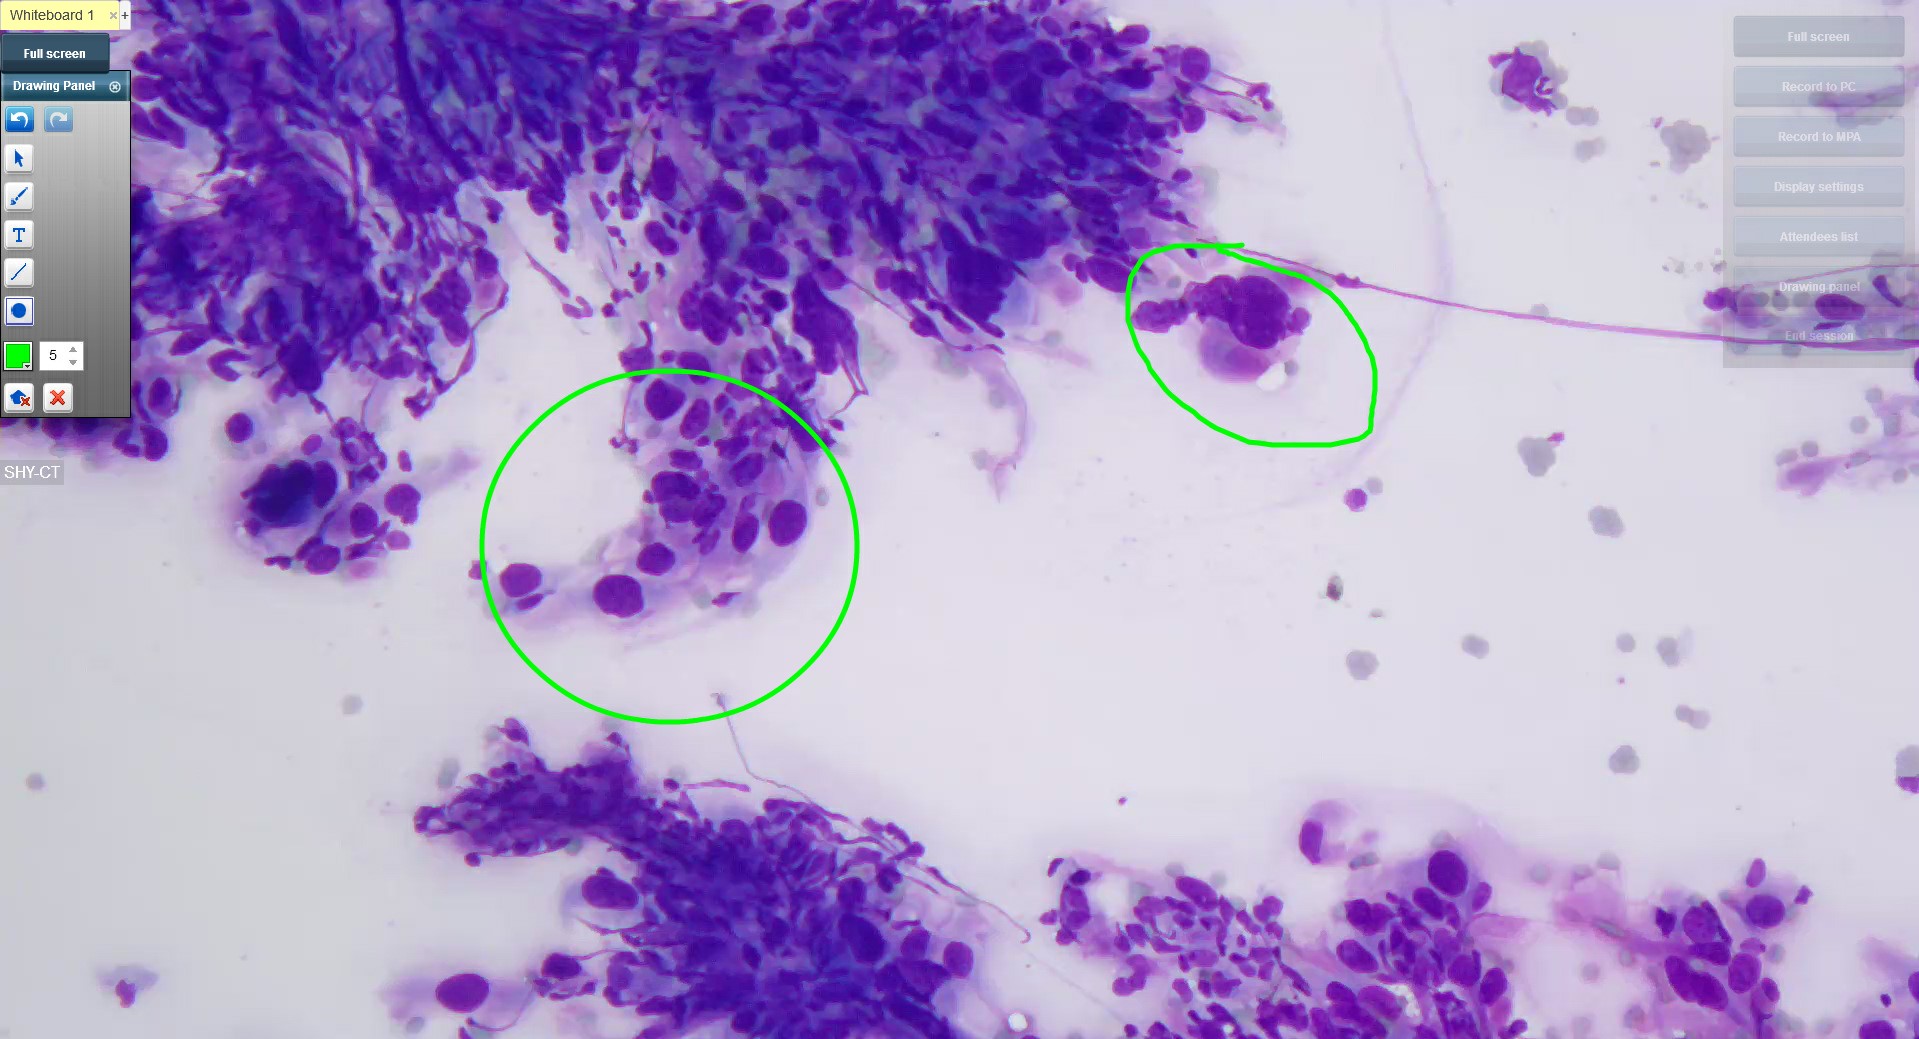
The method of telecytology in which 1 person on site controls the microscope with a camera that streams the field of view to a remote computer, which a cytopathologist uses to view the slide in real time is known as which of the following?
- Dynamic
- Robotic
- Static
- Whole slide imaging
- Digital transfer of image rich dermatopathology data using telecommunication technology
- Classified into real time, store and forward or hybrid
- Goal is to provide the highest quality of dermatologic care by moving patient information efficiently (Semin Cutan Med Surg 2002;21:179)
- Composed of telecommunication lines, a virtual slide system and a public web server (Diagn Pathol 2012;7:177)
- Implementation requires adequate infrastructure (BMC Res Notes 2014;7:588), internet connectivity (BMC Res Notes 2014;7:588) and healthcare provider basic training related to imaging and storage (BMC Res Notes 2014;7:588)
- Interchangeable terms may include digital pathology, digital microscopy, teleconference, teleconsultation, virtual microscopy and whole slide imaging (J Pathol Inform 2010;1:15)
- Virtual slide system: an automated scanner that digitizes microscopic slides into high resolution images
- Mobile teledermatopathology: the use of a smartphone or tablet to retrieve image rich slides from digital server
- Real time (dynamic): images are examined in real time, using a live telecommunications link (J Pathol Inform. 2010 Aug 10;1. pii: 15)
- Utilizes a remote controlled microscope and video conferencing equipment
- Space independent but not time independent (Curr Dermatol Rep 2016;5:96)
- Both parties must be available at the same time
- May interrupt the routine workflow and make scheduling challenging
- Store and forward (static): referring providers transmit the digitalized images to consulting pathologists by email or web based uploading systems (Curr Dermatol Rep 2016;5:96)
- Uses a microscopy camera or automated scanner
- Space and time independent (Curr Dermatol Rep 2016;5:96)
- Does not require simultaneous presence of both parties
- Compared to real time interactive, store and forward (Curr Dermatol Rep 2016;5:96, J Pathol Inform 2010;1:15):
- Creates flexibility
- Shorter consultation time
- Less expensive
- Higher resolution digital images
- No or minimal interaction
- Delayed responses
- Consulting pathologist has no remote control of precaptured images and have limited fields of view to examine
- Most commonly used modality of teledermatopathology (Curr Dermatol Rep 2016;5:96)
- Major applications include Alaska Federal Health Care Access Network, Medweb, TeleDerm Solutions and Second Opinion (Curr Dermatol Rep 2016;5:96)
Contributed by Jasmine Saleh, M.D.
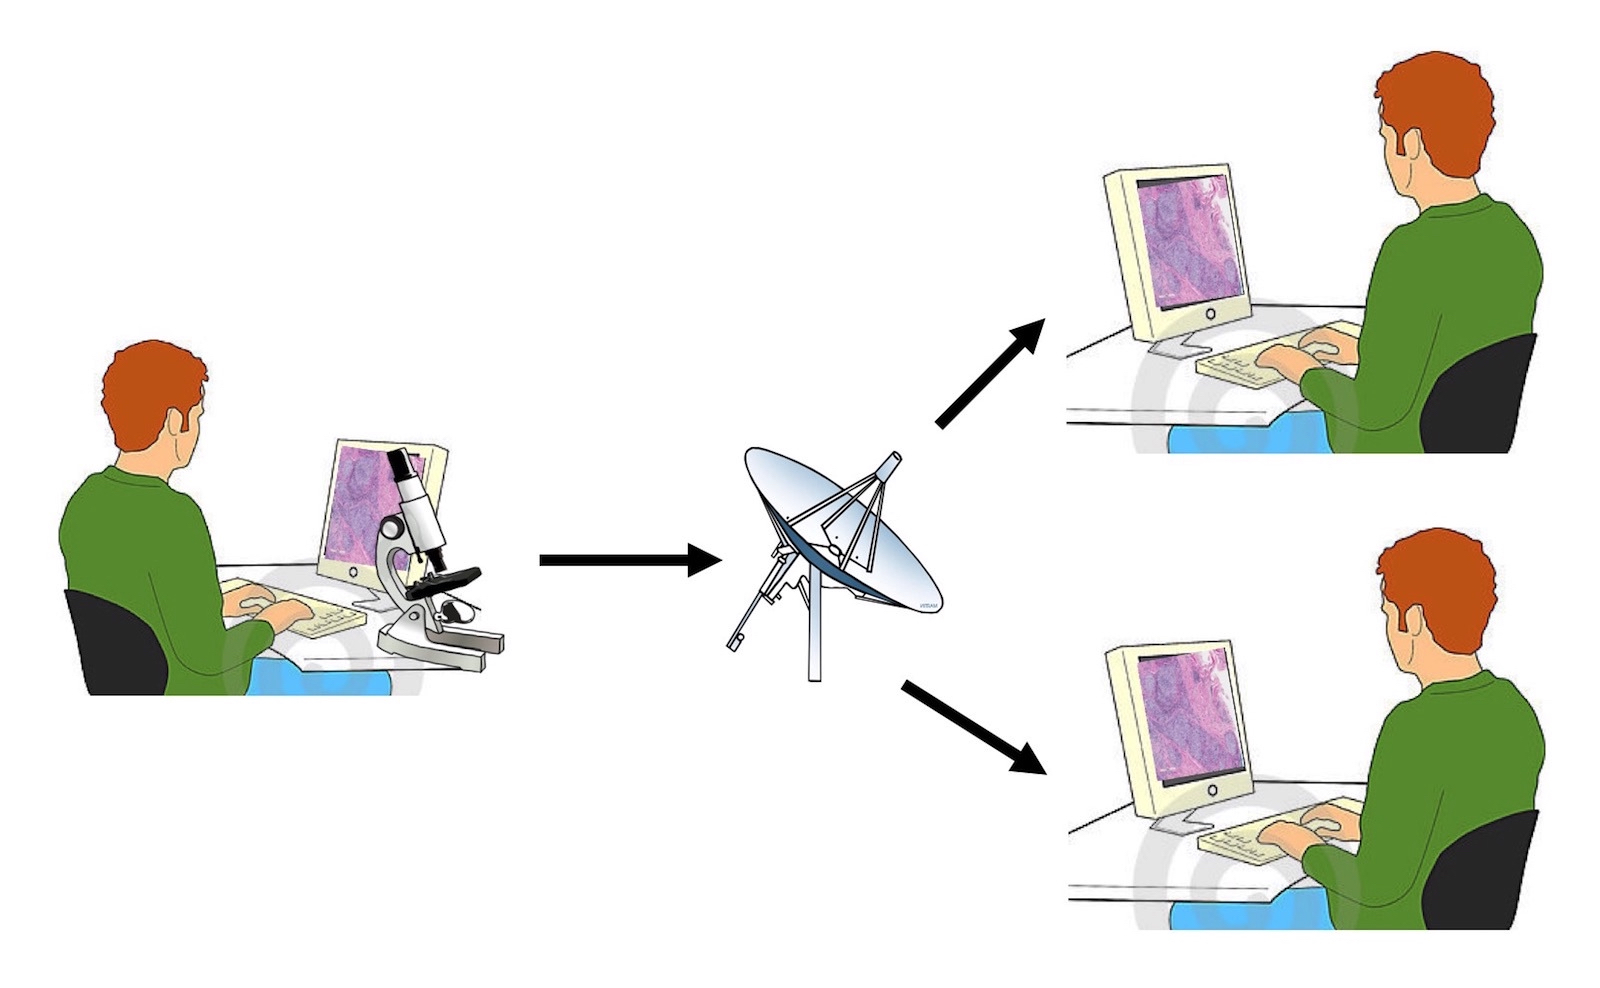
Real time
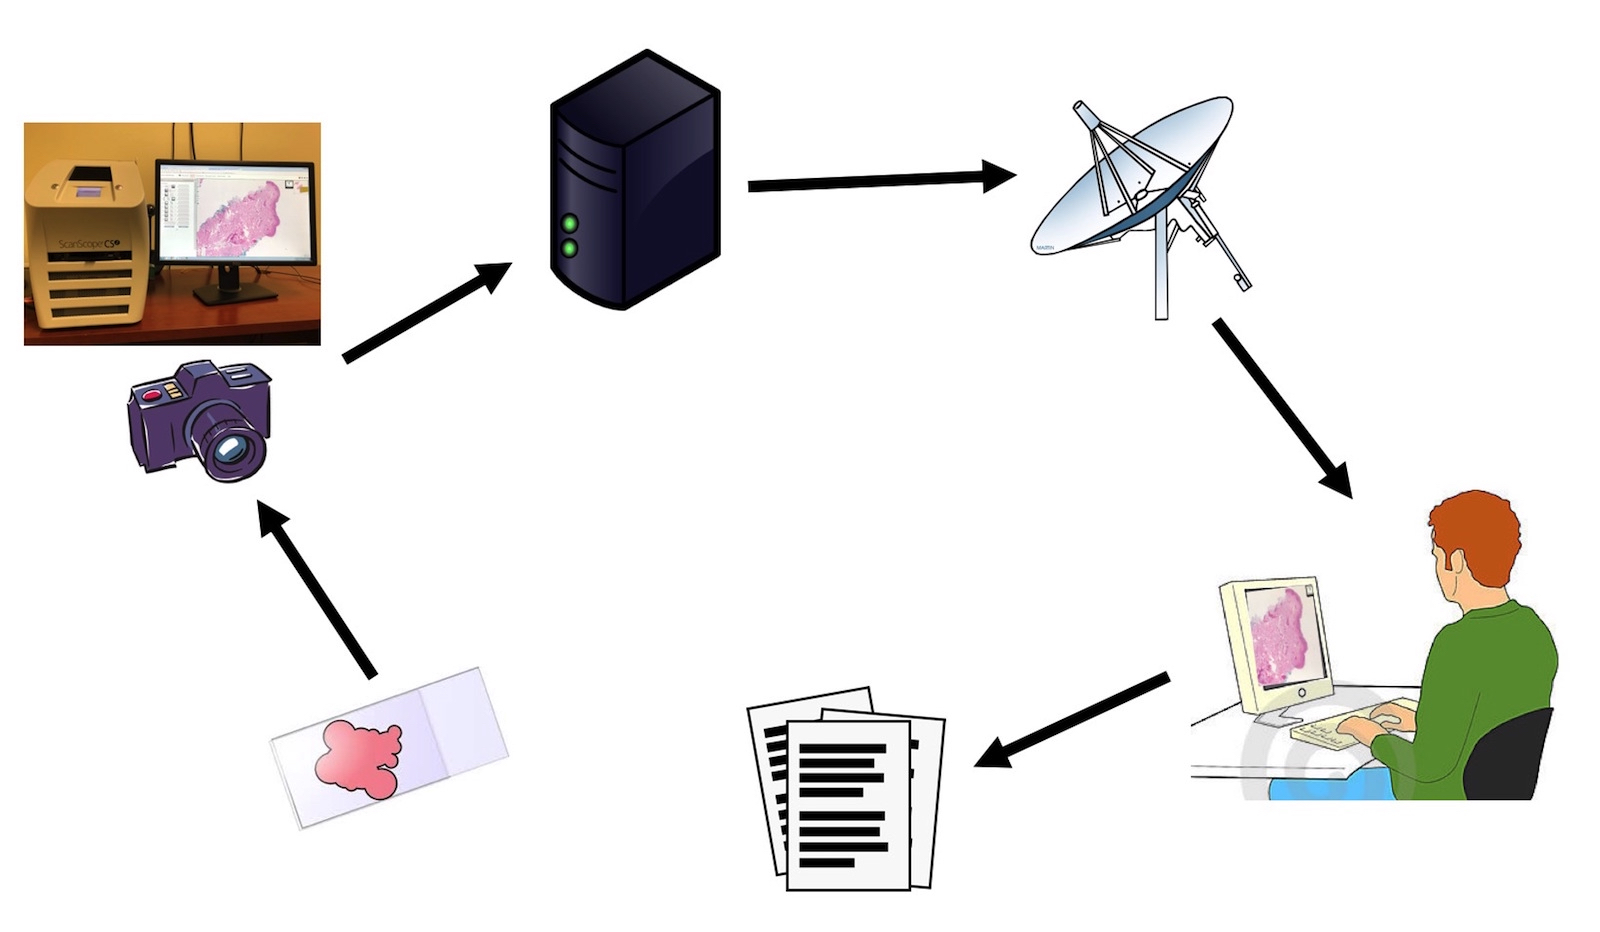
Store and forward
- Communication with dermatologists and dermatopathologists in remote locations
- Consultations for rural and underserved areas lacking access of specialists
- Consultations for second opinions
- Educational resources
- Utilization of image analysis software and computer aided diagnostic tools to enhance diagnostic accuracy
- Collaborative diagnostic research, tumor boards and scholastic endeavors
- Real time (BMC Res Notes 2014;7:588):
- Enables direct interaction between medical providers and pathologists
- Facilitates education for providers
- Allows for instant clarification of any issues that may arise
- Store and forward (BMC Res Notes 2014;7:588):
- Useful when physicians and pathologists have difficulty coordinating for in person or real time consultation
- Beneficial for low resourceful settings
- Improves access to specialists as the number of dermatopathologists is limited and unevenly distributed geographically
- Enhances quality of care and efficiency of workflow
- Reduces interpretive errors and optimizes patient outcomes
- Minimizes healthcare expenditures
- Facilitates international collaboration
- Prevents service disruption or loss
- Reduces the pathologists’ travel time
- Quality of images (Am J Dermatopathol 2018;40:667)
- Diagnostic reliability is comparable with conventional microscopes
- Concordance rates 73 - 100%
- Most studies conclude that the image quality is adequate for microscopic examination of melanocytic and inflammatory skin diseases
- May be more difficult to identify eosinophils, neutrophils, melanin granules and apoptosis, as well as to grade melanocytic dysplasia
- Images may be out of focus and require rescan
- Diagnostic reliability is comparable with conventional microscopes
- Possible technical issues (J Pathol Inform 2010;1:15)
- Networks with bandwidth limitations
- Firewalls that may block signals for remote device controls
- Computer or scanner malfunction
- Image deficiencies
- Corrupted images
- Images with poor resolution
- Potential technical delays (J Pathol Inform 2010;1:15)
- Waiting for images to download
- Pixelating images when zooming
- Slow internet connection
- Obstacles to implementation (Am J Dermatopathol 2018;40:667)
- Varying state licensing laws
- Varying reimbursements by insurance provider and state
- Regulatory issues with FDA
- Evaluation criteria before implementing teledermatopathology (including but not limited to) (Telemed J E Health 2010;16:424):
- Technical resources required
- HIPAA compliance with secure storage, transmission and access
- Ability to store and transmit digit images, clinical history and consultant's diagnosis and recommendations in an organized fashion
- User friendliness and intuitiveness of the application
- Integration with existing EMR systems
- Scalability and ability to fit into organization
- Billing
- Cost of equipment
- Steps to incorporate teledermatopathology into practice (Semin Cutan Med Surg 2002;21:179):
- Understand how the organization delivers care
- Analyze the alternatives (i.e. cost benefit analysis)
- Obtain organizational support
- Formulate an execution plan
- Train staff
- Monitor the process and analyze outcomes (i.e. turnaround times)
- Varying reimbursements by insurance provider and state (Dermatol Pract Concept 2018;8:214)
- Privacy and security (Dermatol Pract Concept 2018;8:214)
- Legal risks (Curr Dermatol Rep 2016;5:96)
- Ethical issues (J Pathol Inform 2010;1:15)
- Lack of uniform technology
- Healthcare providers’ training
- Which of the following is true about teledermatopathology?
- Does not increase access to specialists
- Has a poor diagnostic concordance
- Facilitates international collaboration and widens global access to specialists
- Increases interpretive errors
Comment Here
Reference: Teledermatopathology
- Which of the following is the most commonly used modality in teledermatopathology?
- Store and forward
- Real time
- Hybrid
- A dermatologist sends the patient’s clinical history and microscopic images of her dermatologic condition to a pathologist, who subsequently views them and provides diagnosis and recommendations. Which of the following modality did these physicians use?
- Hybrid
- In person consultation
- Real time
- Store and forward
- A dermatologist emails a pathologist with the patient’s clinical history and microscopic images of her dermatologic condition. The pathologist reviews the information and responds to the email with diagnosis and recommendations. He also sets up a video consultation with the dermatologist. Which of the following modality did these physicians use?
- Hybrid
- In person consultation
- Real time
- Store and forward
- Telepathology is a form of communication between medical professionals that includes:
- Transmission of pathology images or testing data
- Associated clinical information for the purpose of various clinical applications, including:
- Primary diagnoses
- Rapid cytology interpretation
- Intraoperative and second opinion consultations
- Ancillary study review
- Archiving
- Quality activities (American Telemedicine Association (ATA): Clinical Guide for Telepathology [Accessed 5 June 2020])
- Data capture device (slide scanner, microscope with mounted camera, other primary instrumentation such as flow cytometer, etc.)
- Suitable connectivity medium with appropriate security and bandwidth for type of data
- Receiving and review device (mobile device, computer / monitor, other)
- Data management software, reporting software, interpretive aids and algorithms or image analysis tools and other tools are often desirable but optional
- Static image: capture and send
- Dynamic, robotic / assisted streaming video microscopy (Clin Lab Med 2016;36:101)
- Simple smart phone based (Cancer Cytopathol 2016;124:213)
- Hardwired robotic microscope (Hum Pathol 2009;40:1070)
- Scanned whole slide imaging (WSI) stored and archived slides (DPA Association: Archival and Retrieval in Digital Pathology Systems [Accessed 5 June 2020])
- Slide scanner (linear scanning or tile by tile followed by image stitching, plus focusing software)
- Image analysis software (artificial intelligence tools, etc.)
- Viewing software and hardware (simple and intuitive viewing and manipulation of images is critical to adoption and efficiency)
- Virtual case management tools (archiving, image extraction, sharing)
- Reporting (lab information system, electronic health record or paper fax)
- Digital imaging and communications in medicine (DICOM) is the technical specification for managing digital image data (J Pathol Inform 2018;9:37)
- American Telemedicine Association (ATA) guidelines (2014) propose practical standards for technical specifications, clinical responsibilities, facility responsibilities, training, documentation, operations and quality assurance (American Telemedicine Association (ATA): Clinical Guide for Telepathology [Accessed 5 June 2020])
- Others: CAP accreditation guidelines for laboratories using telepathology, Canadian Association of Pathologists largely mirror the ATA guidelines (Captodayonline.com: CAP accreditation guidelines [Accessed 5 June 2020], J Pathol Inform 2014;5:15)
- Remote consultation
- Within a healthcare system: intraoperative (with or without use of frozen section), rapid cytologic assessment of cytologic samples or other consultations between central and satellite locations, improving efficiency by avoiding travel and optimizing staff allocation (Expert Rev Med Devices 2018;15:883)
- Between different healthcare systems: remote teleconsultations open access to subspecialists by eliminating geographic distance, saving shipping time, while retaining tissue within the consulting institutions (J Pathol Inform 2019;10:31, J Telemed Telecare 2018 Dec 30 [Epub ahead of print])
- Contract central laboratory
- Technical services can be centralized or offshored (for either clinical or research work) with dissemination of professional or interpretive / manipulative effort via telepathology, most often using whole slide imaging (WSI)
- Special studies
- Expands access to specialized processes such as IHC, FISH, CISH, etc., otherwise unavailable in a given location
- Primary diagnosis - in line scanning
- All or selected cases scanned and integrated into the histology laboratory workflow with the use of WSI for primary diagnosis
- Works best with surgical pathology, while cytopathology is more challenging (Cytopathology 2011;22:73)
- Tumor board - clinical reviews
- Whole slide images or remote streaming microscopy facilitate remote or on site tumor board presentation and clinician (or patient) slide review, enhancing the ability to adequately present whole slides or whole cases that could be relevant during these conferences
- Slide archival review
- Archived digital image materials of an existing patient available for review when presented with a new specimen from this patient or for clinical reassessment
- Quality assurance
- Technical processes (staining, control reactivity, proficiency testing)
- Professional peer review and quality assurance (e.g. random or directed second reviews / over reads) or consensus development on criteria / nomenclature
- Patient consultation
- Sharing pathology images with the patient or with the clinical team
- In granting patient access to their digital image materials, adherence to privacy and security guidelines is required
- Confidential, secure, facile access
- Extend service to remote populations
- Expand access to subspecialists or obtain peer consultations
- Enhance business efficiencies (reduce transport costs, equalize workload)
- Centralize specialty procedures (e.g. IHC or flow cytometry) while allowing facile distribution of professional revenue from interpretation
- Lack of robust instrumentation on both ends (high up time:down time quotient)
- Lack of available IT personnel and infrastructure
- Equipment and other capital costs
- Political opposition or regulatory hurdles
- Validation, quality control, training issues
- Compatibility of file types, viewers, data sharing methods
- Data transmission rates determined by bandwidth of infrastructure and concurrent usage
- Large file size and slower transmission rates result in pixilation, delays in loading and slower processes, leading to frustrations on the part of the observer
- Video streaming requires at least 3 - 5 megabits / sec (Mbps) for download and 2 Mbps for upload speeds
- File sizes dictate need for abundant storage and well conceived retention / purge plan
- Data security governed by local governments and regulation may dictate where storage facility must reside
- Under U.S. law, HIPAA requirements dictate the need for appropriate business agreements for any data traceable to individual patients that is stored outside an institution, such as in the cloud
- Scanner, image acquisition means
- Image management system
- Viewing system (hardware)
- Storage system (PACS or server configuration)
- Interface to other systems, electronic health record (EHR), laboratory information systems (LIS), business systems
- Case management / reporting / retrieval system
- Scanners range from single slide scanners to high throughput scanners for large volume operations
- Scanners may incorporate features of a microscope, including those using ultraviolet (UV) or multispectral wavelength light or be configured to piggyback onto existing microscopes and stitch tiled images together with acquisition
- Other telepathology image acquisition devices include still or video imaging cameras (including smart phones) for streaming or fixed image capture
- File storage devices include conventional servers, optical disc media or other solid state or disc drive devices with high enough capacity to store large file sizes
- Image management includes specification of file type and associated metadata, compression algorithms and file reconstruction methods
- Image management may also include logic for arrangement of images and associated metadata, like case number or patient demographics, to safeguard patients
- Viewing system includes the software for image and color representation and appropriate (validated) hardware suited to the application
- Define needs and purposes to be accomplished
- Streaming or fixed images to be used
- Scanning of slides at what magnification
- Assess workforce issues, plan staffing adjustments / additions and obtain training if needed (NSH certificate in scanning, for example)
- Evaluate need for additional or upgraded hardware (e.g. monitors) and network demands
- Engage support from all key stakeholders and identify a leadership group for implementation
- Select a vendor or vendors (do due diligence!) and interview users
- Single vendor option
- FDA approved system is required
- Limited service options available or constrained market
- Favorable pricing is available
- Best of breed option
- Niche or specialized functionality is needed
- Validation costs not excessive
- Service agreements suitable and other costs favorable
- Implementation via a staged process is preferred to eliminate barriers and solve problems before full scale roll out
- Ensure that funding model is based on sound assumptions and sustainable over time
- Most scanner and viewer hardware will have a defined lifespan dependent on uses, technological evolution and availability of technical support
- Scientific and technical advances in data and image management impinge on lifespan
- Political and social environment also impact use cases, e.g. pandemic experience
- Whole slide imaging systems for primary diagnosis: class II FDA device
- Streaming video for telecytology, telepathology: non FDA regulated
- Validation guidelines from CAP for WSI systems include an array of recommendations as to number of slides, components to be included (CAP: Validating Whole Slide Imaging for Diagnostic Purposes in Pathology [Accessed 8 June 2020])
- All preparation types (cytology, IHC, FFPE H&E, etc.) should be validated using a minimum of 60 cases, plus an additional 20 cases for each additional application
- Revalidation may be required when components are replaced, upgraded or undergo significant service
- Validation should measure intraobserver variation, not interobserver variation and hence requires a wash out period of several weeks
- Lab accreditation standards for WSI and telepathology included in CAP accreditation checklists
- ATA guidelines include standards for non WSI telepathology validation and quality control
- Medical licensure generally required in the locale where the point of patient encounter occurs for primary diagnosis but not essential for cases seen in secondary consultation
- Technical functioning should be ascertained regularly, at least on every day of use
- Consideration of control of color contrast throughout the image pipeline recommended
- Should be measured or standardized at regular intervals to optimize results
- Professional training and validation using the technology, along with peer review, is needful
- Use the same billing codes for the service as one would use for conventional frozen section, adequacy assessment, consultation or other pathology service
- Location coding (point of service) may or may not be required by payors
Images hosted on other servers:

Remote consultation

Use for frozen sections at remote site
Real time high definition video demo
- Validation of a telepathology solution for remote primary sign out of surgical pathology should include at least how many cases per CAP recommendations?
- 30 cases for each use application
- 40 cases, plus 20 for each use application
- 60 cases, plus 20 more for each use application
- One week's volume of cases expected to be viewed over the system
Comment Here
Reference: Fundamentals and implementation
- Which of the following is a key measure requiring regular quality control in a telepathology system?
- Color consistency through the pixel pipeline
- Metadata retention consistency
- Monitor brightness
- Loading speed of images
- Scanning acquisition time
Comment Here
Reference: Fundamentals and implementation
- Which of the following telepathology practice settings would require prior validation?
- Evaluating photomicrographs of a parasite mailed to you by a colleague visiting a developing country and offering an opinion
- Interpreting results of flow cytometry scattergrams sent to you on an urgent case by email while away from your hospital doing an inspection
- Reviewing the live stream video images of a rapid on site evaluation of a pancreatic FNA procedure performed in another part of your hospital from your office as a part of your standard practice
- Viewing a scanned special stain digital slide sent to you by a reference laboratory in consultation and rendering an opinion for 1 patient
Comment Here
Reference: Fundamentals and implementation
- Virtual staining (VS) is the conversion of an H&E (or other common standard stain, e.g., PAS) digital whole slide image (WSI) to a digital prediction of a special stain (e.g., trichrome, CK AE1 / AE3 IHC)
- The prediction relies on the detection of morphological features (if they exist) of the source WSI, which inform the distribution of a special stain
- Typically performed using artificial neural networks (ANN)
- Can obviate the need for application of physical reagents, thereby conserving precious laboratory resources (e.g., reagents, staff time, costs) while improving operational efficiency (e.g., view multiple stains simultaneously via nonautonomous diagnostic decision aid) and standardization of reagents (i.e., assessment quality)
- It can also serve as a quick initial assessment while waiting for a physical special stain to be processed
- Virtual staining technologies leverage ANNs to generate synthetic images of tissue slides with predictions of the results of special staining reagents (chemical and IHC)
- Bolsters pathology laboratory infrastructure through rapid reflexive staining at virtually no cost
- Selection of stains is application dependent and whether the suspected histomorphology provides sufficient information to infer marker
- 2 primary approaches exist for generation of synthetic stain:
- Use of a generative adversarial network to produce image of synthesized stain
- Identify and segment cells which have been tagged by coregistered IHC / mIF WSI on same section
- Validated visually using Turing test (ability to distinguish real and synthetic), qualitative ratings and clinical concordance to diagnostic / prognostic outcomes
- Whole slide image (WSI): digitized representation of tissue slide after whole slide scanning at 20x or 40x resolution (e.g., using Aperio AT2 or GT450 scanner); slide dimensionality can exceed 100,000 pixels in any given spatial dimension
- Subimage / patch: smaller, local rectangular region extracted from a WSI, often done to ameliorate use of excessive computational resources that may hinder development and deployment of machine learning algorithm (J Pathol Inform 2019;10:9)
- Immunohistochemistry (IHC): application of chemical staining reagents with selective antibodies that bind to specific antigens to assess for the presence of particular biomarkers
- Multiplexed immunofluoresence (mIF): multispectral imaging after excitation of multiple fluorophores attached to antibodies (Cancer Commun (Lond) 2020;40:135)
- Special stains: alternative staining techniques which are not explicitly routine (e.g., H&E) or antibody based (e.g., Masson trichrome for highlighting connective tissue via collagen hybridizing peptides) (Adv Anat Pathol 2017;24:99)
- Autofluorescence: imaging of natural light emission by tissue slide after light absorption in the absence of fluorophores (Nat Biomed Eng 2019;3:466)
- Coregistration: pixelwise (cellwise) alignment of 2 tissue slides from the same section after tissue restaining (Sci Rep 2014;4:6050)
- Artificial intelligence: computation approaches developed to perform tasks which usually require human intelligence
- Machine learning: computational heuristics that learn patterns from data without requiring explicit programming to make decisions
- Artificial neural networks (ANN): type of machine learning algorithm which represents input data (e.g., images) as nodes; learns image filters (e.g., color, shapes) used to extract histomorphological features; comprised of multiple processing layers that learn representations of objects at multiple levels of abstraction (deep learning); inspired by central nervous system (Nature 2015;521:436)
- Segmentation: use of a computer algorithm for pixelwise assignment of specific classes (e.g., tumor) without specific separation of objects
- Detection: use of computer algorithm to isolate specific objects in an image and report object's bounding box location (e.g., location of nuclei), separating conjoined nuclei, etc. (Am J Pathol 2021;191:1693)
- Generative adversarial networks (GAN): a type of neural network that generates highly realistic synthetic images from input signal (e.g., noise, source image) through iterative optimization of a generator which synthesizes images; this is followed by a discriminator / critique which attempts to distinguish generated from real images
- Paired image translation: requires pixelwise microarchitectural alignment of source stain WSI to target stain WSI; target stain serves as label
- Unpaired image translation: does not require paired tissue stains from same WSI or patient and learns mapping between source and target stains; however, is less precise than paired image translation
- Training cohort: set of cases used for training machine learning model
- Validation cohort: set of cases used for evaluating machine learning model
- Image to image translation: digital conversion of an image from a source domain (e.g., hematoxylin and eosin stained slide) into what it would look like given a target domain (e.g., trichrome stain)
- Selection of markers: determined by application (e.g., converting diagnostic H&E stain into trichrome stain for prognostication) and feasibility (i.e., perceived capacity to be inferred from routine stain morphology)
- Primary source staining / imaging modality: WSI of image unstained / stained tissue section, typically using H&E or autofluorescence
- Other source staining / imaging modalities: quantitative phase images, Raman spectroscopy, mIF, IHC
- Common target images: IHC, mIF
- Developing a virtual staining dataset (BME Frontiers 2020;9647163:1):
- Collect specimens with representative tissue architectures (e.g., portal regions, tumor microenvironment, etc.) across a range of diagnostic contexts (e.g., benign versus malignant tissue, different tissue stages, etc.; depends on application); ensure cohorts are well balanced and confounders have been accounted for (e.g., excess adipose tissue, age, sex, etc.)
- Stain and image initial section with source stain (e.g., H&E) across all cases from training cohort
- Stain serial section with target stain (e.g., Ki67) across all cases from training / validation cohort
- If performing a paired image translation, source and target stains require application on the same slide (J Pathol Inform 2022;13:100012):
- Most common technique for same slide application is tissue restaining (destaining tissue section, then restaining with second staining application)
- Significant tissue distortion can occur (e.g., nonuniform reductions in tissue size)
- There are approaches which do not require tissue destaining
- Slides must undergo coregistration of nuclear stains (e.g., hematoxylin to SYTO13) or analogous structures (see figures 1, 2)
- If performing an unpaired translation, then there is not a strict requirement for tissue coregistration (i.e., slides stained with target stain do not need to overlap with slides stained with source stain for training the model)
- After segmenting regions of tissue, subimages from source / target WSI are extracted and partitioned into training / validation sets representing source (input) and target (output) stains respectively
- Virtual staining methods (J Pathol Inform 2021;12:43):
- Generative adversarial networks to generate synthetic images of target stain from source using either paired (e.g., Pix2Pix) or unpaired (e.g., CycleGAN) translation methods (see figure 1)
- Pix2Pix generates target stain from source stain by assessing pixelwise concordance in staining between real and synthetic stain and uses discriminator to determine whether synthetic stain was real or fake; requires perfectly aligned images (e.g., pixel to pixel correspondence)
- CycleGAN generates target stain from source by using discriminator to determine whether synthetic stain was real or fake and back translates synthetic stain back to source stain to retain microarchitectural structure via pixelwise concordance; does not require pixelwise registration
- Synthetic images may be postprocessed to yield quantitative measures (e.g., IHC index score)
- Segmentation / detection approach:
- Train robust nuclei segmentation / detection algorithms through annotation of nuclei by trained pathologist
- Use stain deconvolution approach (IHC) or intensity thresholding (mIF) to isolate specific target stain / marker (e.g., CD45)
- Overlay marker over nuclei to tag nuclei with label (e.g., labeling immune cells)
- Train separate segmentation / detection algorithm to predict pixelwise presence of specific cell types (e.g., positive / negative staining for SOX10)
- Neural networks are optimized for many iterations as models attempt to converge at optimal mapping between 2 stains
- Generative adversarial networks to generate synthetic images of target stain from source using either paired (e.g., Pix2Pix) or unpaired (e.g., CycleGAN) translation methods (see figure 1)
- Model optimization and selection of optimal virtual stain:
- GAN approach: during training, apply generator to convert select source WSI for collaborating pathologist to visualize intermediate results; training iteration deemed sufficiently concordant to actual staining reagent application is used to convert remaining images
- Segmentation / detection approach: models are optimized based on pixelwise / cell level concordance between predicted and actual stains; best model is selected from training iteration which demonstrates optimal concordance between real / synthetic stain on held out patients
- Additional pathologist annotations (e.g., location of tumor) may help guide virtual staining (e.g., identification of markers colocalized to tumor determined by routine stain)
- Validation, done on a hold out test set that is separate from training / validation set:
- GAN approach: visual assessment for realism and clinical utility (similar ability to grade / stage case) and if paired translation, stain accuracy when postprocessed (i.e., stain separation / accuracy)
- Segmentation / detection approach: pixelwise / cellwise concordance performance (e.g., accuracy) and crosstabulation within macroarchitectures / across the slide
- Visual quality tests (subjective); 2 types of visual quality tests exist:
- Turing test: at random, present pathologists with real and virtual images; Turing test passes if pathologists are unable to distinguish the difference between the real / virtual images
- Staining quality ratings: judging specific tissue architectures (e.g., submucosa) across select slides, pathologists rate quality of tissue staining on a scale from 1 (low quality) to 5 (high quality), noting type and scope of tissue artifacts introduced through virtual staining
- Computational quality test (Brief Bioinform 2022;23:bbac367):
- Inception score (IS) provides an objective measurement of staining quality by using machine learning classifiers on the generated tissue stain to measure its ability to characterize certain tissue architectures (e.g., tumor) while comparing images to ensure a diverse set of images were assessed
- Biomarker quantification (Nat Mach Intell 2022;4:401):
- Marker of accuracy: 1) for paired translation GAN approaches, deconvolving the image into the inferred stains or 2) for segmentation / detection approaches assess agreement with original stains with concordance measurement (e.g., accuracy)
- Quantification of marker across slide: counting cells that stain positive / negative across local region or across slide and correlating with assessment indices (e.g., Ki67 index; area of positive SOX10 staining, etc.)
- Clinical concordance for diagnostic / staging practices (Mod Pathol 2021;34:808):
- Noninferiority:
- Can pathologists grade or stage the disease similarly between the real / virtual stain?
- Can be assessed through Kappa agreement, Spearman correlation or regression modeling
- Is the interpretation impacted by artifacts or by perceptions of virtual stain?
- Results should be interpreted in context of how difficult grading / staging can be for this condition (e.g., inter-rater variation) (see figure 3)
- Can pathologists grade or stage the disease similarly between the real / virtual stain?
- Superiority:
- Does virtual staining, when used in conjunction with the standard assessment, permit improved capacity to grade / stage?
- Correlation:
- How well do quantified biomarkers correlate with diagnosis / prognosis?
- WSI from real and virtual stains should be chosen randomly for at least 2 separate assessment periods with a washout period of at least 2 weeks; if real stain is selected for first period, then virtual stain for case / section should be selected for the second period and vice versa; raters should be blinded
- Multiple pathologists should assess the same tissue section with agreement between pathologists and different assessment biases noted
- Noninferiority:
- Correlation with other assays:
- How well does assigned virtual stain stage correlate with other known disease markers (e.g., serology)?
- Is this association more precise than the traditional stain?
- Survival / risk stratification:
- How well does virtual stain biomarker quantification or diagnosis / grade / stage assignments associate with objective markers of recurrence / survival / disease progression (e.g., transplant)?
- Is the association similar or more precise than using the traditional stain?
- Can be assessed through Kaplan-Meier analysis or Cox proportional hazards (i.e., survival) assessment
- Workflow speed and surveys on usage of digital web application to facilitate virtual stain viewing
- Comparative / cost effectiveness comparison with related automation technologies (e.g., autostaining)
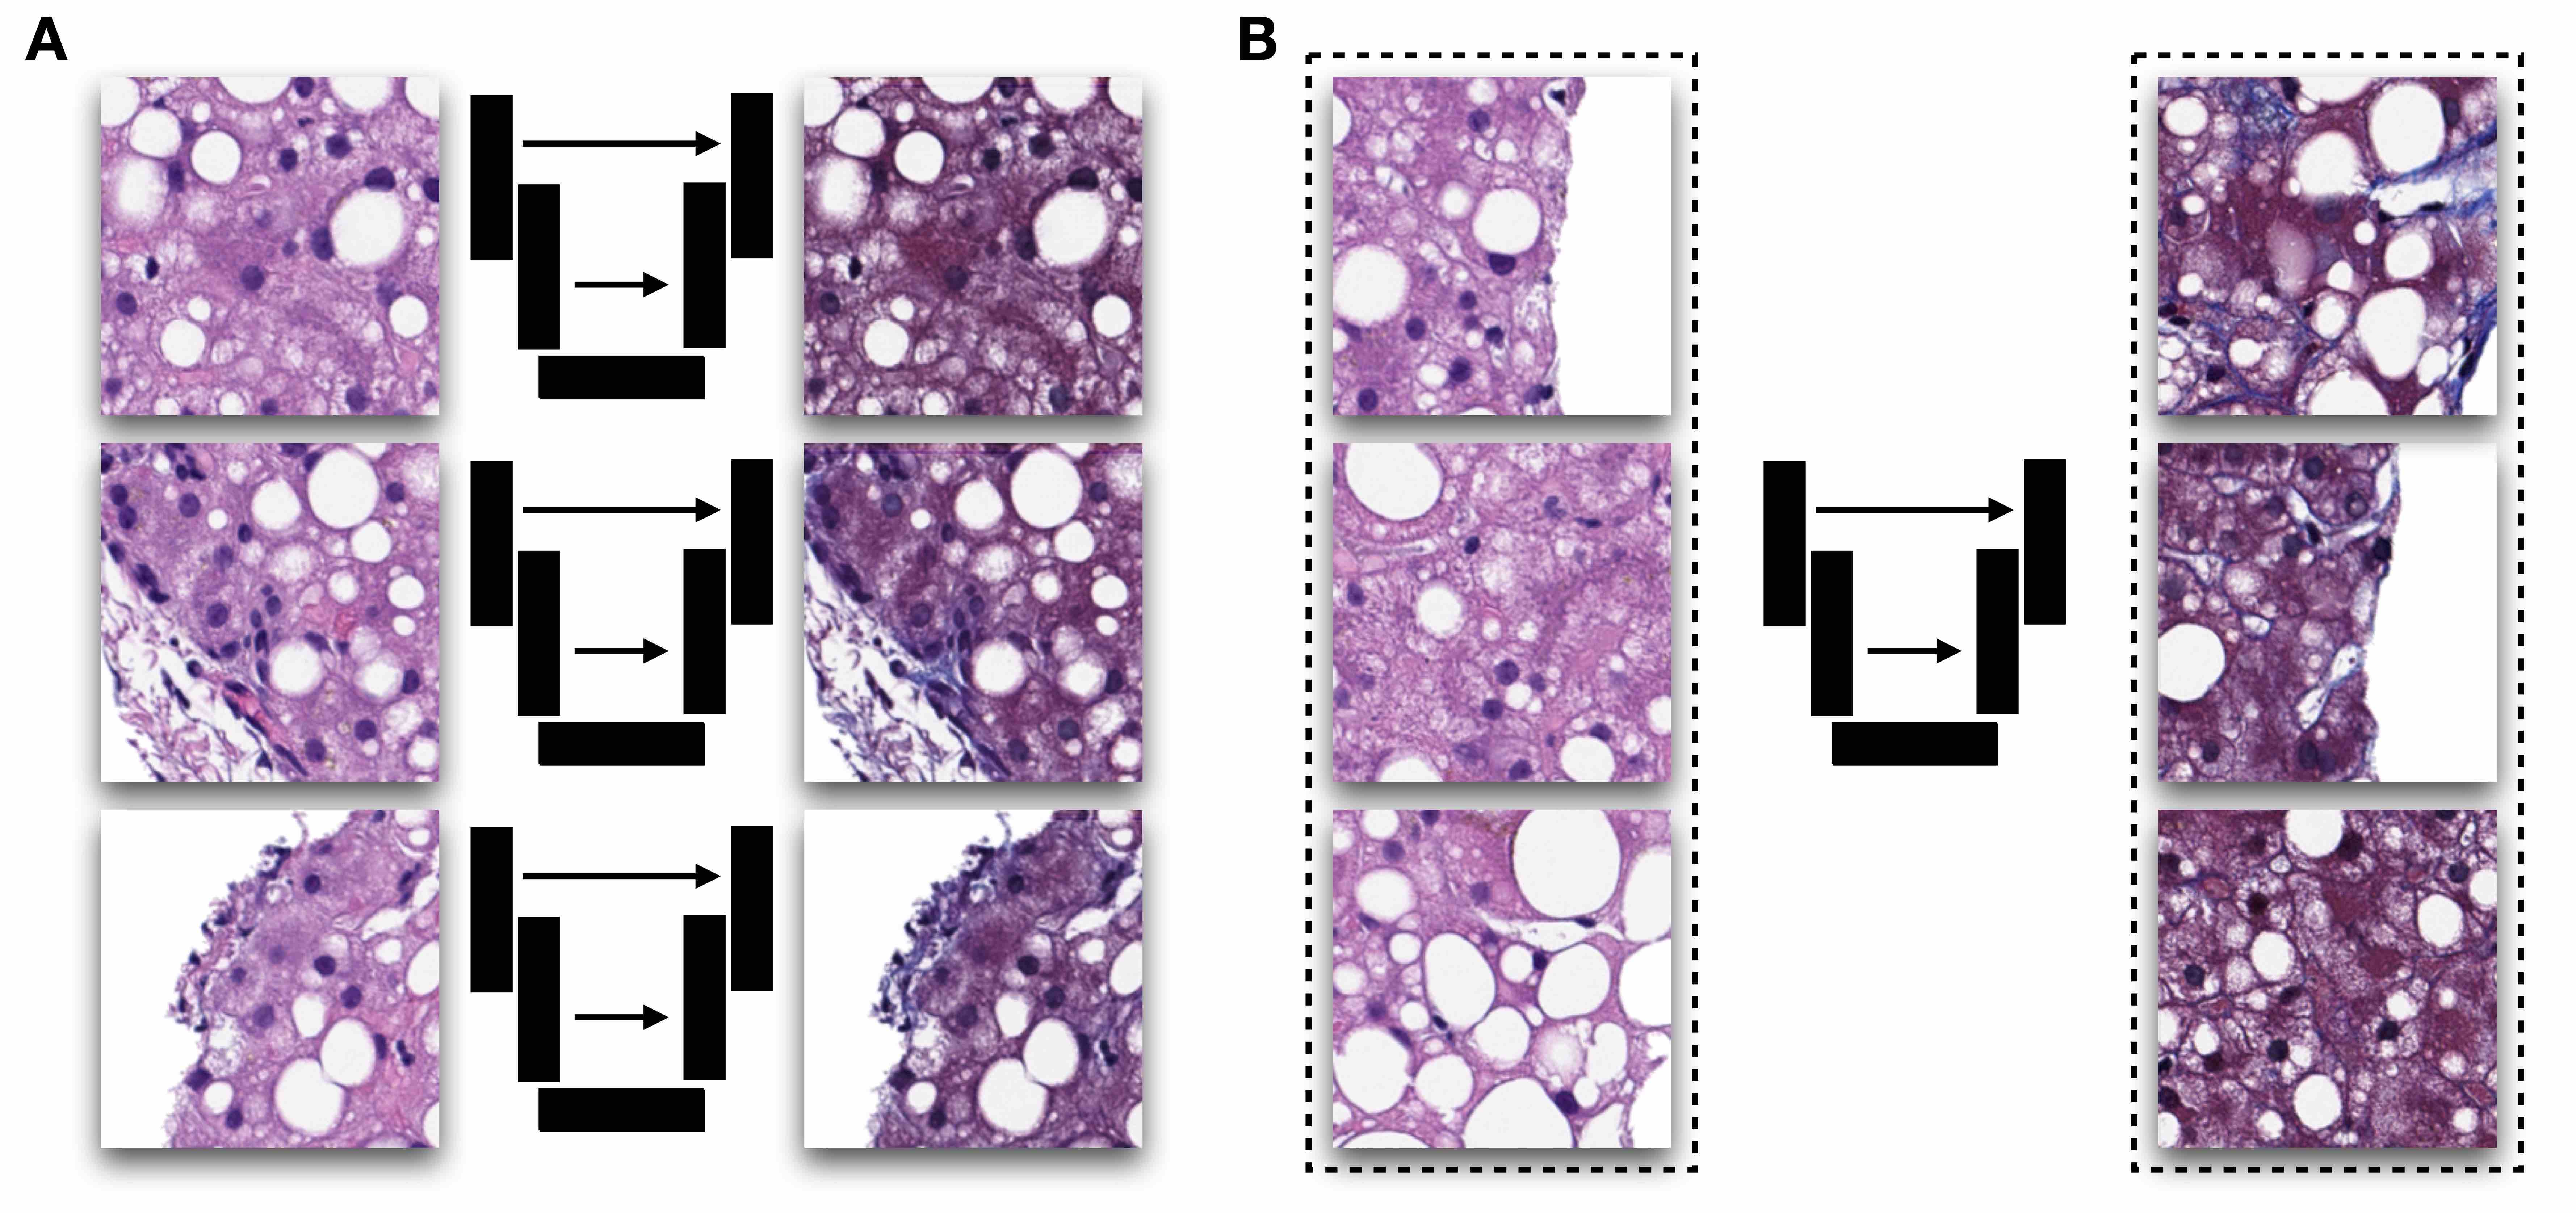

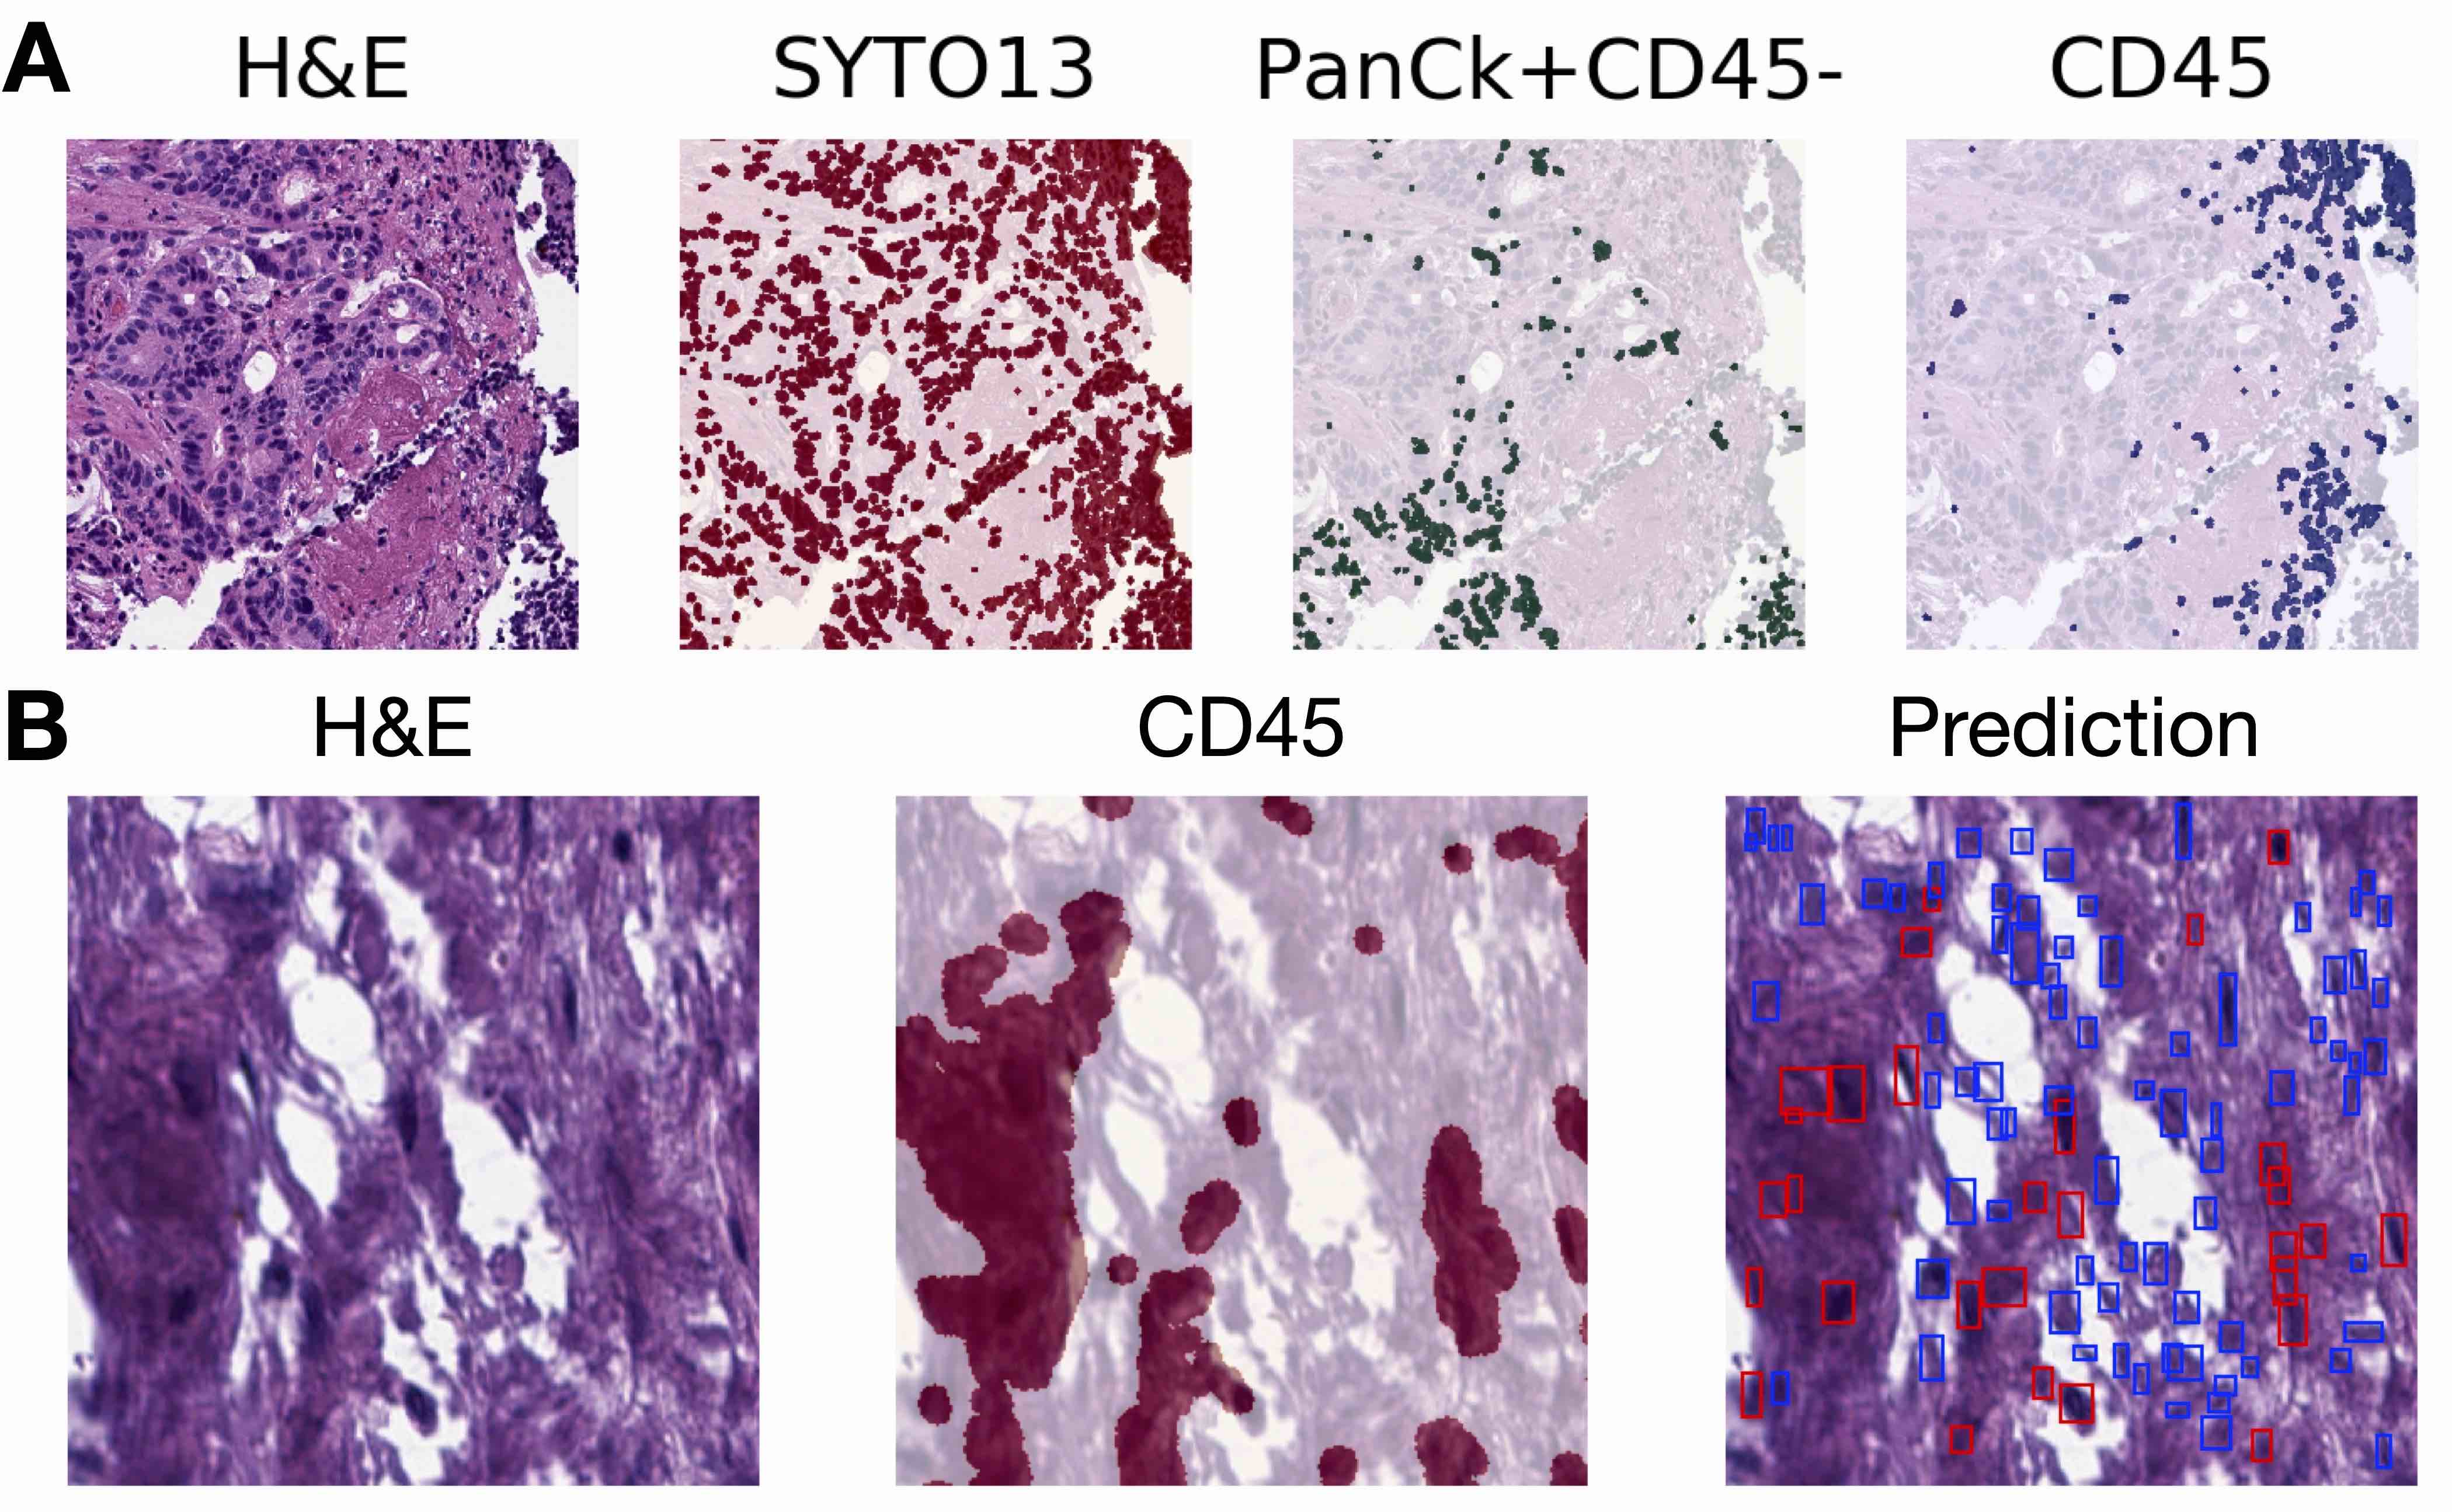
- Virtual alignment of pathology image series (VALIS)
- OpenCV2
- ViV (Nat Methods 2022;19:515)
- Warpy (Front Comput Sci 2022;3:780026)
- ASHLAR (Bioinformatics 2022;38:4613)
- CODA (bioRxiv 2020 Dec 9 [Preprint])
- HALO
- Visiopharm (Tissuealign)
- ImageJ (TurboReg, UnwarpJ, etc.)
- NiftyReg
- Elastix
- ANTs
- MCMICRO
- CycleGAN and Pix2Pix
- Visiopharm (virtual double staining)
- SHIFT
- HistoGeneX
- Owkin
- Indicalabs / HALO
- SOX10 IHC for melanoma (Mod Pathol 2020;33:1638, Front Artif Intell 2022;5:1005086)
- Virtual HER2 IHC staining (Proc SPIE PC12204 ETAI 2022;PC12204:PC122040O, Technical Digest Series 2022;SM5O.2)
- Label free staining from tissue autofluorescence into H&E, Jones and trichrome (Light Sci Appl 2020;9:78, Light Sci Appl 2019;8:23, Nat Biomed Eng 2019;3:466)
- Gleason scoring (Sci Rep 2022;12:9329)
- Pancytokeratin, tumor stromal ratio and p53 (Sci Rep 2020;10:17507, Sci Rep 2021;11:192557, NPJ Precis Oncol 2022;6:14)
- Special stains (e.g., periodic acid-Schiff) (Nat Commun 2021;12:4884)
- Ki67 (IEEE Trans Med Imaging 2021;40:1977)
- PAS stain (kidney) (J Pathol Inform 2022;13:100107)
- IHC to mIF (e.g., DAPI, Lap2, BCL2, BCL6, CD10, CD3 / CD8, Ki67) (Nat Mach Intell 2022;4:401)
- Tumor microenvironment characterization (Proc SPIE 12039 Medical Imaging 2022;12039:120391H)
- Adipocytes (nuclei, lipid, cytoplasm) (PLoS One 2021;16:e0258546)
- Intraoperative virtual staining (Nat Biomed Eng 2022 Sep 19 [Epub ahead of print])
- Virtual staining of skin biopsies from reflectance confocal microscopy (Light Sci Appl 2021;10:233)
- Large scale clinical validation of virtual trichrome staining (Mod Pathol 2021;34:808)
- Virtual staining of distinct cellular components (e.g., endosome, actin, golgi, etc.) (Sci Adv 2021;7:eabe0431)
- Fibrosis quantification (Med Image Anal 2022;81:102537)
- Blood smears (BME Frontiers 2022;9853606:1)
- Mitosis detection via PHH3 stain (2020 IEEE 17th ISBI 2020;1770)
- Other examples (BME Frontiers 2020;9647163:1)
- Advantages (Nat Biomed Eng 2019;3:466):
- Ameliorate laboratory infrastructure burdens through quick access to reflexive tissue staining at virtually no cost
- Improves precision and tedious quantification of biomarkers
- Can provide access to stains with reasonable multiplexing to facilitate spatial molecular assessment
- Can make remote pathology consultation more practical due to reliance on digital assessment
- Potentially can be employed to standardize the application of staining reagents
- Virtually stained tissue can be used to augment datasets for training downstream machine learning workflows (e.g., IHC marker quantification) (see figure 4)
- Disadvantages:
- GANs may hallucinate histological features that look real but are incorrectly placed or should not be present; this often occurs when sections are imprecisely aligned for paired translation techniques and sometimes when using unpaired translation techniques
- Without evaluating virtual stains on generated images of WSI (e.g., looking only at representative subimages), it is possible to choose a virtual staining model that over / under stains
- Tissue artifacts and variable slide staining can introduce aberrant staining in virtual slides; multicenter validation or finetuning of technology is recommended for demonstrating broad application
- Depending on the application, disagreement between raters may make assessment challenging, reducing the study power by adding noise
- Pixelwise agreement between real / virtual stain does not necessarily reflect the impact on real world grading / staging
- Turing test can be easily fooled by presenting pathologists with smaller image crops (i.e., tissue resolution, larger images have higher likelihood of containing an artifact) or not enough images to draw inferences (i.e., sample size); does not accurately reflect impact on real world grading / staging
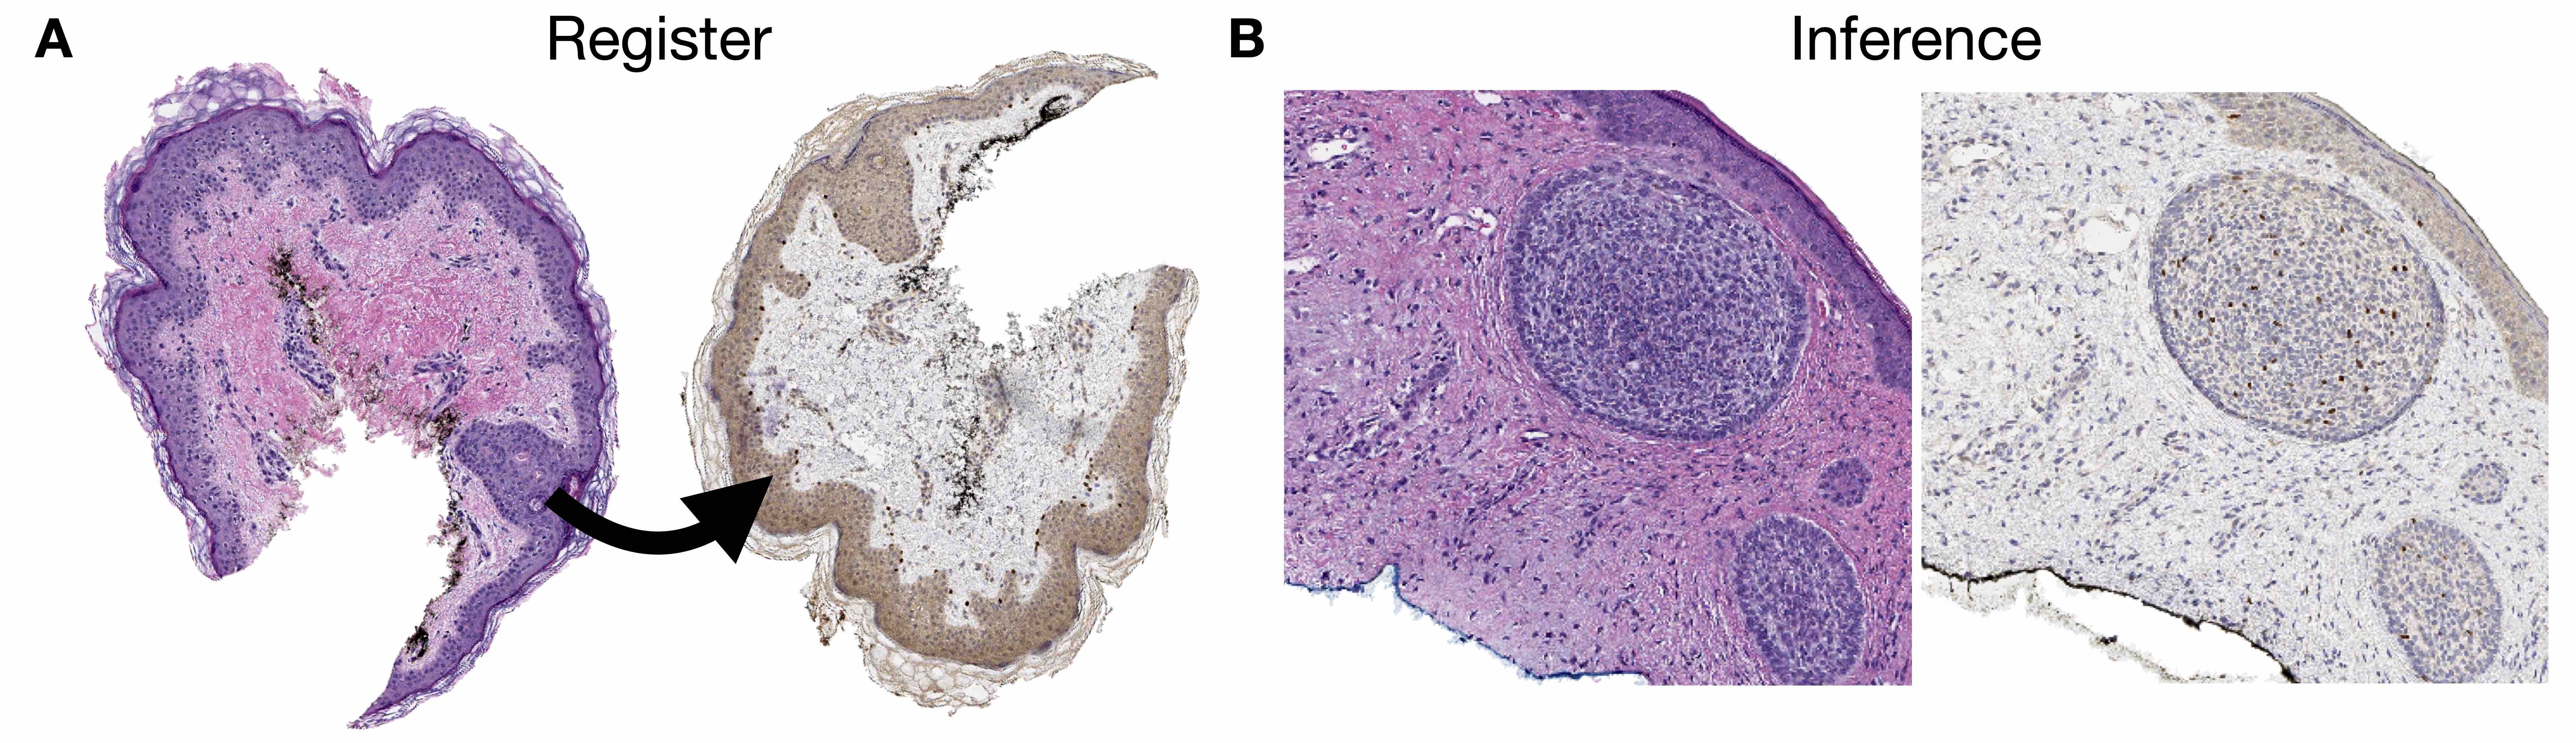
As opposed to an unpaired image translation task, what different set of procedures are absolutely required to obtain data for a paired image translation task?
- Application of at least 2 different tissue stains to the same tissue section
- Segmentation of tissue and partitioning into training / validation sets
- Tissue restaining and image coregistration of same tissue section
- Tissue staining of a partially overlapping set of patients
Comment Here
Reference: Virtual staining
- Concordance with stage / serology / survival
- Cost effectiveness comparison
- Surveys for attitudes and beliefs surrounding adoptability
- Virtual assessment time
Comment Here
Reference: Virtual staining
- Whole slide imaging involves the acquisition of digital images from glass slides using slide scanners
- Whole slide images (WSI) are fundamentally different from glass slides in that they can be:
- Viewed remotely through online software
- Accessed simultaneously by several viewers
- Annotated digitally
- Processed computationally
- WSI can be used for:
- Clinical diagnosis
- Education
- Quality assurance
- Research and image analysis
- Applications of whole slide imaging typically require:
- Whole slide scanner and scanning staff
- Image viewer software platform
- High resolution screen and pointer device (mouse, joystick, trackpad or other tailored pointer)
- Digital pathology: refers to pathologic diagnosis made entirely from WSI without recourse to glass slides
- Telepathology: refers to digital pathology performed at a distance from the originating site of the slides / specimen
- Computer aided diagnosis: refers to a technology or system used for interpreting findings on medical images; may refer to pathology, radiology or other medical images
Contributed by Rebecca Rojansky, M.D., Ph.D.
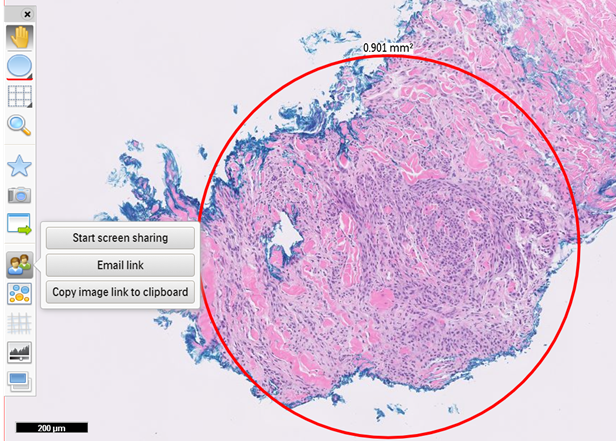
WSI annotation
- Primary diagnosis:
- Platforms:
- Philips IntelliSite Pathology Solution (PIPS) became the first FDA granted WSI system, including scanner and image management system (IMS) in April 2017
- Leica Aperio AT2 DX WSI system, including scanner and Image Scope viewing software, was FDA cleared in June 2019 and the Sectra digital pathology module was cleared in April 2020 for use with the Aperio scanner
- Paige.AI Full Focus IMS became FDA cleared in July 2020
- Numerous platforms are approved for clinical use outside of the United States, including the Roche Ventana DP 200 slide scanner with uPath IMS, Zeiss Axioscan Z1, 3DHistech Pannoramic scanners and Pannoramic viewer, Hamamatsu NanoZoomer scanners, NDP.serve3 IMS and NDP.view2 viewer
- Algorithms:
- Several automated image analysis algorithms have been FDA approved and CE marked, including Bioview HER2 FISH, Paige Prostate, lung ALK quantitation and hematology FISH assays (J Pathol Inform 2019;10:2)
- Additional algorithms have been CE marked in the European Union, including 3DHistech MembraneQuant and NuclearQuant, Visiopharm VDS Ki67 module for breast and Paige Breast for breast cancer prediction (J Pathol Inform 2019;10:2)
- Advantages:
- Users can annotate WSI as they would glass slides, including flagging areas of interest, measuring features and writing notes
- WSI software platforms allow for creation of work lists and personalized image archives
- WSI can be shared with other users in real time and without geographic restrictions
- Archiving of WSI enables rapid retrieval of prior patient material to decrease turnaround time (TAT)
- Primary diagnosis and consensus conferences within departments or practices can be conducted remotely (see Remote reporting section below)
- Platforms:
- Remote reporting:
- Remote reporting from WSI can be achieved with appropriate hardware, software, internet connectivity and validation (J Pathol Inform 2021;12:20, J Pathol Inform 2021;12:3)
- Center for Medicaid Services waived the requirement for pathologists to perform diagnostic tests in Clinical Laboratory Improvement Amendments (CLIA) licensed facilities during the coronavirus disease 2019 (COVID-19) pandemic, to support the health and safety of medical staff (Mod Pathol 2020;33:2115)
- Intraoperative consultations:
- Remote intraoperative consultation allows on call pathologists to digitally review frozen sections (Am J Clin Pathol 2020;153:198)
- Use cases:
- Small volume hospitals that may not have a full time pathologist available
- Helpful in countries where there are pathologist shortages (Pathology 2005;37:5)
- Facilitates coverage of multiple sites, coordinated from a single centralized site (Semin Diagn Pathol 2009;26:165, Arch Pathol Lab Med 2018;142:369)
- Can be used for quality assurance (J Pathol Inform 2012;3:45)
- Advantages:
- Faster alternative to remote control robotic microscopes (more akin to usual slide review)
- Facilitates expansion to multiple sites
- After hours call can be covered remotely and be supported by subspecialist pathologists (J Pathol Inform 2014;5:15, J Digit Imaging 2013;26:668)
- Can access historical patient cases in real time
- Helps achieve recommended time to diagnosis for intraoperative consultations (typically around 20 minutes)
- Rapid on site evaluations in cytology:
- Facilitates remote assessment of adequacy for cytology biopsies for rapid on site evaluations (J Pathol Inform 2015;6:19)
- Typically requires a platform capable of acquiring data from sequential focal planes
- Multidisciplinary case conferences (also known as tumor boards or multidisciplinary team meetings):
- Forum for pathologist participation in discussions and management recommendations
- WSI allows pathology data to be accessed and viewed in real time (Diagnostic Histopathology 2014;20:470, J Pathol Inform 2014;5:41)
- Second opinion consultations and outside pathology review:
- Consultations (for expert opinion) often requires sending original materials to the consult institution; in this case, consult services may retain original materials
- WSI can be transferred without loss of original material or risk of different material present on recuts (CMAJ 2013;185:135, Diagnostic Histopathology 2014;20:470)
- Dedicated web based whole slide image platforms are available to facilitate consultation (Arch Pathol Lab Med 2015;139:627)
- Interinstitutional telepathology:
- Decreased turnaround time verses shipping glass slides
- Removes the selection bias of static telepathology
- Improves collaboration between the consult requestor and the consultant (through use of annotation features within WSI viewing software)
- Provides opportunities for quality assurance, archiving and education
- Challenges:
- Cost of transitioning to WSI (J Pathol Inform 2014;5:33)
- Change of workflow in the laboratory to optimize slides for scanning (J Pathol Inform 2014;5:43)
- IT infrastructure required to maintain high speed communication at all times
- Guidelines for validation of WSI for clinical applications are available from:
- Digital Pathology Association (DPA), 2011 (Digital Pathology Association: Validation of Digital Pathology in a Healthcare Environment [Accessed 25 March 2022])
- College of American Pathologists (CAP), 2013 (Arch Pathol Lab Med 2013;137:1710)
- Royal College of Pathologists, 2013 (Royal College of Pathologists: Telepathology - Guidance from The Royal College of Pathologists [Accessed 25 March 2022])
- American Telemedicine Association, 2015 (J Pathol Inform 2015;6:13)
- Spanish Society of Anatomic Pathology, 2015 (Sociedad Española de Anatomía: Libro Blanco de la Anatomía Patológica en España - Recomendaciones de los Clubes para el Diagnóstico Anatomopatológico [Accessed 25 March 2022])
- Korean Society of Pathologists (J Pathol Transl Med 2020;54:437)
- WSI is useful for multidisciplinary case conferences and teaching rounds:
- Reduces preparation time required for conference presentations
- Enables access to past cases, should the need arise during a conference
- Standardized examinations:
- Facilitates multiple examination sites
- Provides improved image quality over snapshot images
- Continuing education:
- Provides access to high quality educational material to learners in disparate locations
- Society conferences:
- Interesting case submissions in WSI format, eliminate the need for multiple recut sections
- Materials can be made available both before and after the conference period
- Online image repositories:
- Several image databases are publicly available for educational and research purposes, including the following:
- References: APMIS 2012;120:305, J Pathol Inform 2022;13:100117
- Studies have utilized WSI for quality assurance assessment of histology (Lancet Oncol 2019;20:e253, Hum Pathol 2006;37:322)
- WSI may be used to standardize reagent concentrations, over time and within an institution
- Useful for regulatory requirements, such as the required 5 year look back for diagnoses that are worse than a high grade squamous intraepithelial lesion in Pap smears
- Can be used for medicolegal review and secondary review of cases with newly diagnosed malignancies (which is required in some practices)
- WSI enables image analysis of pathology slides for research and computer assisted diagnosis
- Quantitation tasks:
- Automated calculation of breast biomarkers: estrogen receptor, progesterone receptor and HER2 (J Pathol Inform 2013;4:19, Pathol Res Pract 2014;210:713, Mod Pathol 2016;29:318)
- Ki67 counting (Am J Surg Pathol 2012;36:1761)
- Mitosis detection (Med Image Anal 2015;20:237)
- Rare event identification:
- Finding microorganisms (Am J Clin Pathol 2010;133:849)
- Counting glomeruli in renal biopsies (PLoS One 2016;11:e0156441)
- Quantification of fibrosis and fat (Pathol Int 2013;63:305)
- Diagnostic assistance:
- Finding ductal carcinoma in situ in breast tissue (IEEE Trans Med Imaging 2016;35:2141)
- Gleason scoring of prostate cancer (Mod Pathol 2020;33:2058)
- WSI for research applications:
- Central review for clinical trials (Arch Pathol Lab Med 2013;137:492)
- Peer review and working groups (Toxicol Pathol 2015;43:1149)
- Novel tumor classification schemes:
- Prognostication based on epithelium to stroma ratio (Diagn Pathol 2012;7:22)
- Risk stratification based on variations in lymphocyte subtypes of tumor microenvironment (J Transl Med 2012;10:205)
- Increasing area of investigation in the correlation of WSI data with other data streams (clinical, pathologic or genomic)
Creating whole slide images with a robotic microscope stage
Whole slide images for diagnostic pathology
- Each laboratory employing WSI for primary diagnosis should independently validate their WSI implementation
- No validation is recommended so long as laboratories use FDA approved WSI systems
- Pathologists who use WSI for primary diagnosis must have special certification
- WSI must be separately validated for each tissue type and application
Comment Here
Reference: WSI applications
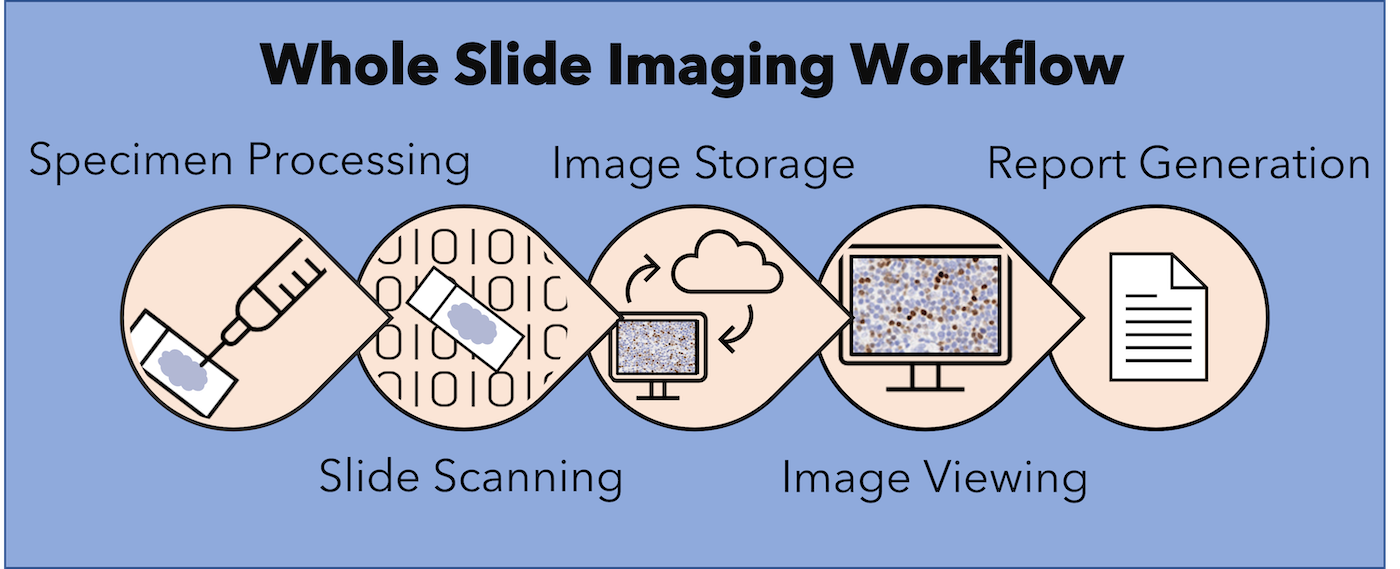
Which of the following activities constitutes use of whole slide images for primary diagnosis?
- Correlating whole slide images of a prior biopsy with slides of a current resection specimen
- Sending whole slide images to a colleague for consultation
- Sharing whole slide images at tumor board to guide medical management
- Signing out a case remotely after reviewing the whole slide images
Comment Here
Reference: WSI applications
- Whole slide imaging has become increasingly adopted by pathologists as a tool to digitalize pathology
- Major manufacturers of whole slide scanners and 2 of each of their representative products are listed as a resource for the pathology community
- Manufacturers appear in alphabetical order (see Table of Contents above)
- Reference: J Pathol Inform 2021;12:50

|
|
PANNORAMIC® 1000 DX

|
|
PANNORAMIC 1000 demo
PANNORAMIC Flash DESK DX

|
|
PANNORAMIC DESK II DW demo
- Contact 3DHISTECH for more information

|
|
PhenoImager HT

|
|
PhenoImager Fusion

|
|
PhenoImager - Akoya's patented multispectral imaging technology
- Contact Akoya Biosciences for more information
|
|
|
CSFA800

|
|
CSFA800-30
CSFA2000
|
- Contact Bionovation Biotech for more information

|
|
Ocus®40

|
|
Ocus®40 microscope scanner overview
Ocus®20

|
|
Ocus®20 main features and key applications
Ocus®20 versus Ocus®40 microscope scanners comparison
- Contact Grundium for more information
|
|
|
NanoZoomer S360 C13220-01

|
|
NanoZoomer product range and its possibility
NanoZoomer S20 C16300-01

|
|
Introducing NanoZoomer S20MD slide scanner system
- Contact Hamamatsu Photonics for more information
|
|
|
TissueScope™ iQ

|
|
TissueScope™ LE

|
|
TissueScope LE120 demonstration
- Contact Huron Digital Pathology for more information
|
|
|
KF-PRO-400

|
|
KFBIO 400 slides digital pathology scanner
KF-PRO-002

|
|
KFBIO 2 slides scanner
- Contact KFBIO Digital Pathology for more information

|
|
Aperio GT 450

|
|
Introducing Aperio GT 450
Aperio CS2

|
|
- Contact Leica Biosystems for more information
|
|
|
SL5-20

|
|
Mikroscan SL5 live telemicroscopy mode
- Contact Mikroscan for more information
|
|
|
MorphoLens 1

|
|
MorphoLens 6

|
|
- Contact Morphle Labs Inc. for more information
|
|
|
MoticEasyScan NEW Infinity

|
|
MoticEasyScan NEW Infinity overview
MoticEasyScan One

|
|
How to get started with MoticEasyScan One
- Contact Motic Digital Pathology for more information

|
|
BioPipeline Slide

|
|
OS-15-N

|
|
- Contact Nikon Instruments for more information
|
|
|
Glissando 20SL

|
|
Glissando Desktop Scanner

|
|
Glissando slide scanner live demo
- Contact Objective Imaging for more information
|
|
|
OS-Ultra

|
|
OptraSCAN-OS-Ultra 320 digital pathology scanner launch
OS-Lite Brightfield Scanner

|
|
Digital pathology slide scanners - OptraSCAN
- Contact OptraSCAN for more information

|
|
Pathology Scanner Second Generation SG300

|
|
Pathology Second Generation Scanner SG20

|
|
- Contact Philips Healthcare for more information
|
|
|
SpectralHT

|
|
Digital pathology 2.0, Pramana robots in action
- Contact Pramana for more information
|
|
|
M8

|
|
Digital microscope & scanner - PreciPoint M8
O8

|
|
- Contact PreciPoint for more information

|
|
VENTANA DP 600

|
|
VENTANA DP 200

|
|
VENTANA DP 200 slide scanner
- Contact Roche Diagnostics for more information
|
|
|
X100HT

|
|
X100

|
|
- Contact Scopio Labs for more information
|
|
|
Oncotopix Scan Nanozoomer S360

|
|
Oncotopix Scan Nanozoomer SQ

|
|
- Contact Visiopharm for more information
- Whole slide imaging (WSI) or virtual microscopy involves the scanning (digitization) of glass slides to produce digital slides (Adv Anat Pathol 2012;19:152)
- Whole slide imaging has 2 major components: hardware and software
- Hardware:
- Microscope with lens objectives
- Light source (bright field or fluorescent)
- Robotics to load and move glass slides around
- Digital cameras for image capture
- Computer
- Software to manipulate, manage and view digital slides
- Hardware:
- Static digital image, virtual microscopy
Contributed by Anil Parwani, M.D., Ph.D., M.B.A.
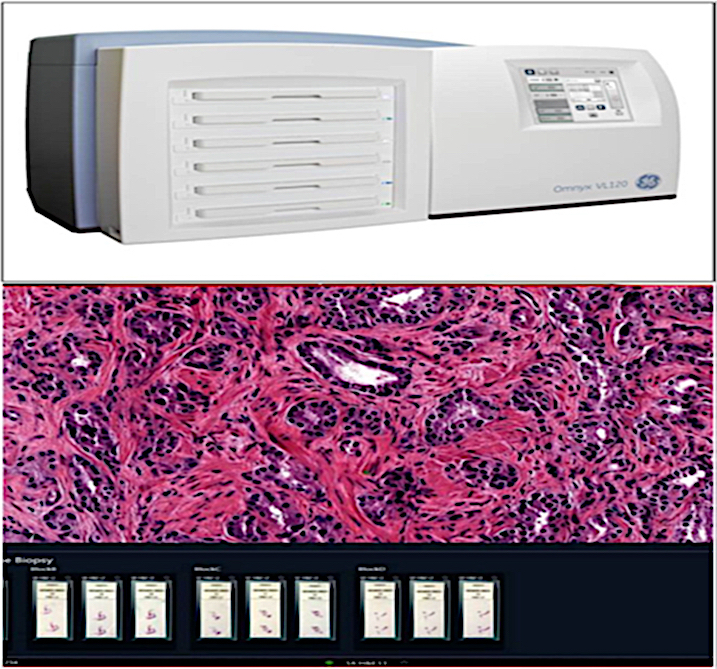
Omnyx whole slide imaging scanner
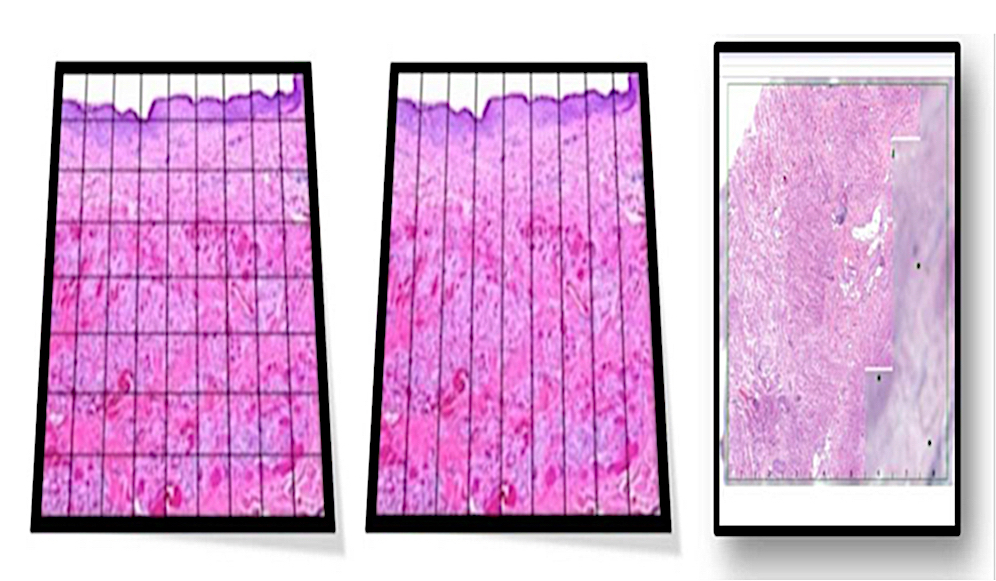
Tile based and line based scanning
- First scanners introduced in by Wetzel and Gilbertson in 1999 (Arch Pathol Lab Med 2019;143:222)
- Evolved from static digital images and robotic microscopy
- In 1997, Ferreira et al. used robot / microscope / computer combination to create a mosaic pattern of image tiles that produced a composite slide image (Path Lab Med Int 2015;7:23)
- A system capable of capturing entire slides at high resolution but in a time efficient fashion and with reasonable operating costs was produced by Interscope Technologies (Path Lab Med Int 2015;7:23)
- Traditional glass histology slide is digitized via a slide scanner and viewed on a computer screen or handheld device at a similar resolution as light microscopy
- Robotics are key to avoid breaking slides, for stage accuracy and for dependable objective switching
- Whole slide imaging instruments do batch scanning (i.e. scan one slide at a time) and continuous or random access processing (i.e. slides can be uploaded while another is being scanned)
- Entire glass slide or a preselected region of interest on the slide can be scanned
- Digital data are captured via the camera's charge coupled device (CCD) and then a computer employs specialized imaging software to generate a virtual slide
- Tile based scanning
- Robotics controlled motorized slide stage obtains large numbers of square image frames and assembles them into a mosaic pattern
- Charge coupled device captured tiles are autocorrelated with each other to ensure proper alignment and stitched together in a single, massive seamless image
- Line based scanning
- Servomotor based slide stage moves in a jitter free linear fashion on a single axis of acquisition
- Group of images is produced in the form of long, uninterrupted strips or lines
- Bright field
- Emulates standard bright field microscopy and is most common and cost effective
- Fluorescent
- Used to digitize fluorescently labeled slides (i.e. fluorescent immunohistochemistry, fluorescent in situ hybridization)
- Captures images as tiles
- Multispectral
- Captures spectral information across the spectrum of light
- Applied to both the bright field and fluorescent settings
- Image viewer
- Software utilized to navigate digital slides
- Allows users to view and navigate (pan and zoom) virtual slides on a digital screen
- Image analysis
- Iterative process of adjusting the algorithm parameters, running the algorithm on a subset of images and evaluating the algorithm performance until sufficient algorithm performance is achieved
- Area based
- Basic assessments, for example, quantifying the areas (2 dimensional) of a certain stain (e.g. chemical or immunohistochemistry stain), the area of fat vacuoles or other events present on a slide
- Cell based
- Identifying and enumerating objects, e.g. cells
- Enables subsequent assessment of subcellular compartments
- To ensure the value and quality of generated data
- Value: technical knowledge of tissue handling, fixation, processing and staining, as well as the specialty expertise in biology, histology, pathology, pathophysiology, biomarker expression, comparative anatomy, etc.
- Quality: quality of the tissue, histology slide, stain and scan
- Validity of image analysis data can be greatly hampered by performing analysis on low quality tissue / histology slides or improperly optimized staining results
- Preanalytical variables such as interval between tissue harvest and fixation and total fixation time are often poorly controlled
- Validation refers to the demonstration of equivalent diagnostic performance between digital slides and glass slides examined
- According to the College of American Pathologists (CAP), validation of the entire whole slide imaging system that involves trained pathologists should be performed in a manner that emulates the laboratory's actual clinical environment
- CAP recommends including at least 60 routine cases per application to assess interobserver diagnostic concordance between digitized and glass slides, viewed at least 2 weeks apart (Arch Pathol Lab Med 2013;137:1710)
- Primary diagnosis
- Consultation (second opinions)
- Remotely interpreting frozen sections
- Remotely viewing immunostains
- Showcasing pathology slides at tumor boards
- Archiving and retrieval
- Performing image analysis
- Proficiency training
- Education
- Clinical trials / research
- Customized reporting
- Digitization
- Data mining
- High definition hematoxylin and eosin test for digital pathology
- Color calibration slide to promote color standardization
- Vendor neutral viewers (e.g. OpenSlide)
- Usage of enhancement to avoid tissue folds interference with image analysis algorithms
- Limiting technology and regulatory issues
- Image quality
- Cannot scan all materials (e.g. cytology, microbiology)
- Cost of the systems
- Digital slide storage
- Inability to handle high throughput routine work
- Regulatory barriers in certain countries
- User unfriendly ergonomics
- Increases viewing time
- Pathologists' reluctance to use whole slide imaging
Whole slide imaging overview
Scanning (MikroScan D2)
- An iterative process of adjusting the algorithm parameters and running the algorithm on a subset of images
- Robotics controlled motorized slide stage that obtains large numbers of square image frames and assembles them into a mosaic pattern
- Servomotor based slide stage that moves in a jitter free linear fashion on a single axis of acquisition
- Software utilized to navigate digital slides
Comment Here
Reference: Whole slide imaging fundamentals
- Whole slide imaging (WSI) is a method for digitizing glass slides in their entirety
- Implementation of WSI requires several technical and cost considerations
- Pathology applications span multiple domains that can potentially improve efficiency, accessibility and quality
- Common clinical applications of WSI include:
- Digital archival
- Collaboration
- Telepathology
- Primary diagnosis (including remote signout)
- Image quantification
- Implementation of WSI benefits from oversight by pathologists and laboratorians
- Input from others during planning is also important, as slides scanned for clinical purposes may have additional uses for research and education
- College of American Pathologists guidelines should be followed to ensure the safe and effective use of WSI for clinical use (Arch Pathol Lab Med 2013;137:1710)
- Recommendations center on validation and documentation, with a focus on interobserver and intraobserver concordance and understanding scope and limitations of the technology
- Laboratory developed test (LDT) paradigm applies to many clinical use cases of WSI
- FDA clearance is not itself a requirement for the clinical use of WSI
- Considerations for implementation include:
- Compatibility with downstream viewers and analytical tools
- Informatics infrastructure, including file storage and bandwidth
- Pathology workstations, e.g. the "pathologist cockpit" (J Pathol Inform 2010;1:19)
- Workflow considerations for the intended use case(s), e.g. scanning pre versus post signout and their respective impacts on turnaround time (TAT)
- Costs, not only for hardware but also ongoing costs, such as personnel
- Compute the target scanning volume for the use cases
- Craft a slide preparation strategy focused on slide cleaning, slide integrity checks (including trimming labels and coverslips) and quality control (QC)
- Establish a prescan QC protocol to identify slides that may not be appropriate for scanning
- Examples include slides that are not supported by the slide scanner (e.g., excessive slide thickness, plastic cover slips), slides that are damaged or slides that have excessive artifacts, such as air bubbles
- This may need to be performed in coordination with the slide scanner selection process to understand the limitations of each scanner under consideration
- Craft a post scan QC strategy that ensures that the images produced by the scanner are acceptable in quality
- This may include automation such as digital image analysis if supported by your platform
- If an automated procedure is adopted, it is generally best practice to adopt an ongoing validation procedure to ensure that the algorithm is working correctly; one approach is to visually analyze slides that fail the automated procedure as well as slides that pass the automated procedure
- Craft a workflow blueprint that details how slides move through the pipeline
- This should include slide preparation and QC strategy, selecting whether slides are rescanned if they fail QC (and how many rescan attempts) or returned to the lab
- Allocate workforce based on the computed volume, taking the workflow envisioned into account
- In addition to slide preparation and scanning, this may include efforts to pull or archive slides, manually associate slides with clinical (or research) cases in the system, data entry, selecting representative slides from cases, conducting image analysis, etc.
- Identify slide scanners that have the speed, capacity and level of automation to reasonably achieve the calculated volume given the workforce available
- For example, if the target volume is 500 slides per day, the workforce must be able to prepare and deliver 500 slides per day to the scanner and the scanner must be able to scan 500 slides daily
- Note that speed scales with additional scanners operating in parallel, whereas larger capacity scanners do not necessarily add speed but may enable larger daily batches
- When considering upgrades and enhancements, examine and identify bottlenecks in equipment and workforce planning; common bottlenecks include:
- Not enough workforce devoted to all of the tasks necessary to scan slides
- QC slowness creates a bottleneck in releasing slides to their ultimate destination
- Automated slide scanning is not available (or fails); for example, automated tissue detection fails to reliably select tissue or automated focusing is insufficient to generate blur free images
- Slide scanner is insufficient in speed to meet the target volume
- Plan for the user experience and select platforms that meet those needs
- Should the images be accessible over the local network so that they can be viewed at different workstations?
- Should image management be deployed to aid with metadata collection, ease of viewing, searching and organization?
- Will annotation be needed (e.g., drawing regions of interest)? If so, for what purpose?
- Is integration with other systems necessary, such as the laboratory information system (LIS) / electronic health record (EHR)?
- Is integration with image analysis and AI platforms desired?
- Are the file types produced by the slide scanner(s) supported by the platform?
- Is the user’s intended storage strategy supported by the platform?
- Settle on a file storage strategy
- If long term storage of the slide is necessary, expect the storage requirements to grow and plan accordingly
- Calculate costs per scanned slide for storage; this requires an expectation of file size and target volume
- Consider whether the intended storage strategy meets the needs of the user in terms of accessibility, rendering speed and byte level access
- Consider issues surrounding personal health information (PHI), such as whether the intended storage supports PHI or whether PHI must first be separated from the whole slide image prior to storage
- Determine a (preferably offsite) backup strategy; common methods are cold storage, such as tape backup and cloud services (particularly low cost ones that assume infrequent access)
- Hybrid solutions are also possible, which may include a mixture of fast, highly accessible storage, slower storage with less frequent access and cold archival storage; if so, a strategy should be developed to determine which images should belong to which partition
- Digital archival:
- Slides can be scanned post signout to retain digital copies
- Archived slides can be associated with the clinical case by integration into the laboratory information system or electronic health record, making them easily accessible for follow up
- Has the potential to improve workflow efficiency and reduce costs associated with pulling archived glass slides (Arch Pathol Lab Med 2019;143:1545)
- Can enable institutions to retain a digital copy of glass slides for consult cases that typically must be returned to the originating institution
- Collaboration:
- WSI eliminates the scarcity problem; images can simultaneously be viewed and navigated by different users and at potentially different locations
- Useful for consultation without needing to ship and receive slides, particularly overseas where there can be legal barriers (J Pathol Inform 2015;6:63)
- Tumor board, quality assurance and other conference-like settings can benefit, particularly if multiheaded microscopes aren't available or can't accommodate all participants
- Screening and rapid evaluation (e.g. rapid onsite evaluation [ROSE], frozen sections) that may require remote reads at locations without on-site pathologists, reducing travel between sites
- Telepathology:
- Scanned slides can be made accessible remotely to users to enable remote consultation
- Advantages compared with conventional telepathology systems include:
- Local user does not necessarily have to be present at the time of slide review to load / unload slides in real time, establish connections and manipulate the slide
- Remote user can have full control of the slide, including field of view and magnification
- Permanent record of the entire slide can be retained
- Drawbacks compared to conventional telepathology:
- Requires extra time for whole slide scanning prior to review, which should be specifically validated if being considered for frozen section interpretation
- Typically a larger investment than conventional telepathology systems
- If using existing WSI equipment, telepathology may have to compete with other uses of the system, which can delay availability
- Remote software still needs to be identified if a multiple user image management system is not used
- Primary diagnosis:
- Can be performed using WSI
- Requires validation demonstrating concordance with glass slides
- May require special scanning protocols, e.g. scanning at 40x (versus the standard 20x) to identify H. pylori in gastric biopsies
- Has been shown to yield similar results to microscope review (Arch Pathol Lab Med 2019;143:1545, Cancer Cytopathol 2020;128:17)
- Remote diagnosis is allowed when the diagnostic read is performed in a Clinical Laboratory Improvement Amendments (CLIA) licensed location
- (Currently) temporary waiver was issued in response to the COVID-19 pandemic, enabling remote diagnosis at non-CLIA locations, such as a pathologist's home (College of American Pathologists: Remote Sign-Out of Cases With Digital Pathology FAQs [Accessed 18 March 2021]
- Initial studies suggest that quality is not sacrificed (Mod Pathol 2020;33:2115)
- Image quantification:
- Digitization is a necessary step for digital image quantification
- WSI enables digitization to be applied to the entire slide
- WSI can also allow pathologists to more easily offload digital capture to technicians, as opposed to digital capture using microscope cameras
- Quantification for clinical support commonly includes:
- Immunohistochemistry scoring
- There are some 510(k) cleared algorithms but many are research use only
- Laboratory developed test mechanism can be applied to utilize algorithms clinically
- For certain markers, such as HER2 scoring in breast cancer, additional reimbursement via CPT 88361 may be possible
- Counting of cellular and subcellular structures
- Area quantification
- Emerging techniques, such as machine learning for tissue segmentation, tumor detection and grading have been demonstrated in a clinically relevant fashion and may be on the horizon (Nat Med 2019;25:1301, Lancet Digit Health 2020;2:e407, JAMA Netw Open 2020;3:e2023267, Mod Pathol 2021;34:660)
- Immunohistochemistry scoring
- Slides can be viewed by users at remote locations
- Turnaround time is usually must faster using whole slide imaging versus microscope cameras or robotic microscopes
- WSI is typically less expensive than alternatives
- WSI does not necessarily require that a technician or resident is present during slide review
Comment Here
Reference: WSI implementation & primary diagnosis
- Digital slide archival
- Educational activities using whole slide imaging
- Primary diagnosis using whole slide imaging
- Retrospective research studies using whole slide imaging
Comment Here
Reference: WSI implementation & primary diagnosis
Baron: 2023
Cohen: 2020
Holzinger: 2020
Huss: 2022
Pantanowitz: 2016
Pantanowitz: 2012
Parwani: 2016
Parwani: 2022
Zuraw: 2023
Find related Pathology books: informatics